

Sample Category Title
BoJ Ueda awaits wage trends before altering policy
In today's parliamentary session, BoJ Governor Kazuo Ueda emphasized a cautious stance on Japan's monetary policy, acknowledging the need for more evidence before making any adjustments.
"We expect trend inflation to gradually approach 2 percent. But we'd like to wait until we have more conviction that sustained achievement of our price target comes into sight," Ueda said.
Highlighting the significance of wage trends, Governor Ueda noted, "Whether wage hikes will broaden and become embedded in society, firms begin to hike prices on prospects of rising wages, will be key to judging whether inflation target will be met sustainably."
He reaffirmed the Bank's current strategy: "Until then, we will maintain negative interest rates and the yield curve control framework."
The Summary of Opinions from the BoJ's October meeting, released separately, showed a notable stance from one member suggested optimism about wage growth, "It's highly possible that wage growth to be agreed in next year's base pay negotiations will exceed that agreed this year," and added that "achievement of the BoJ's price target is coming into sight."
One member went further to suggest that the chances of meeting the inflation target have increased, proposing that "It's therefore necessary for the BOJ to gradually adjust the degree of monetary easing down from its maximum level."
Another member's opinion highlighted that adjustments in yield controls are not just a mitigation of side-effects but also pave the way for future policy normalization.
Is the Geopolitical Rally in Gold Exhausted?
- Gold prices retreat from recent highs, despite sharp drop in US yields
- It seems safe-haven flows are unwinding as geopolitical nerves calm
- For gold to rally back to record highs, it might need a recession
Sinking yields unable to boost gold
On paper, last week had all the elements to be incredibly bullish for gold. Yields on US government bonds came crashing down, which in turn inflicted heavy damage on the US dollar. Both of these developments are normally positive for gold prices, and yet the precious metal was unable to advance.
Yields are essentially the price of money, so they can be considered interest rates that are determined by market forces. Gold doesn’t pay any interest to hold, so when yields or interest rates fall, the metal becomes more attractive by comparison. In similar logic, because gold is denominated in US dollars, a weaker dollar is also beneficial for gold as it makes it cheaper to buy for foreign investors.
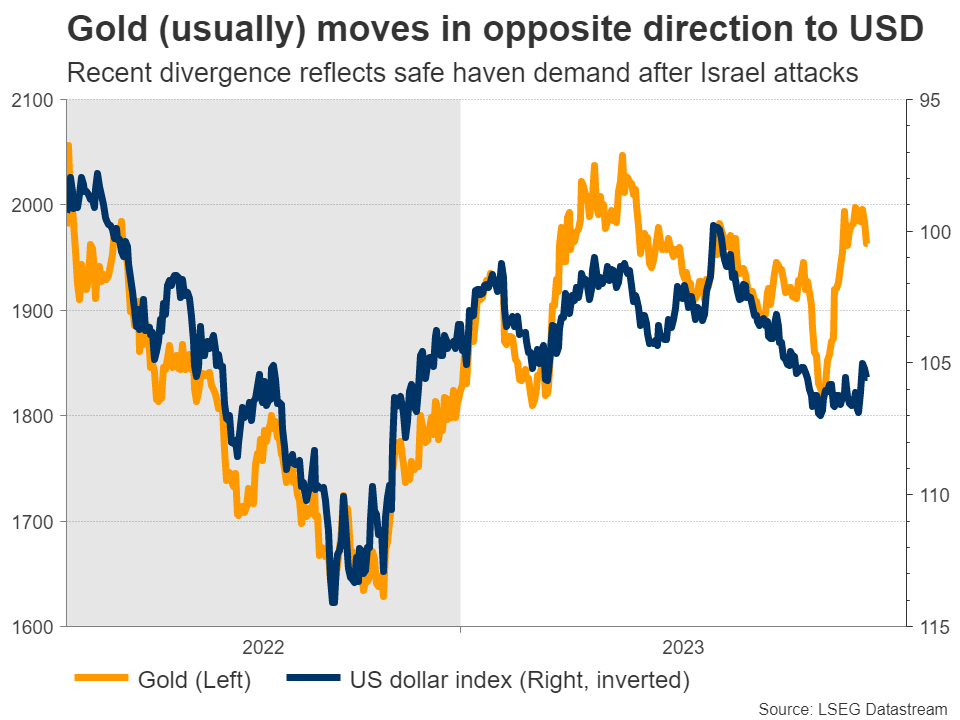
Hence, it is strange that gold could not rally even with such a favorable setup in bond and FX markets, and instead moved lower. It appears these positive effects were overpowered by something even stronger, and the answer might boil down to geopolitics.
No escalation in the Middle East
After Israel was attacked in early October, gold prices rallied more than 10% in the next few weeks as safe-haven demand went into overdrive. Investors were running scared about an escalation in the conflict that could spread to the entire region and drag Iran into the war. Gold is considered the ultimate hedge against such geopolitical risks.
But the conflict never escalated. As horrific as the situation is, it hasn’t spiraled out of control to engulf the whole Middle East. And since the threat never materialized, it appears that speculators have started to exit some of their long positions in gold that were meant to protect them from a conflagration in the war.
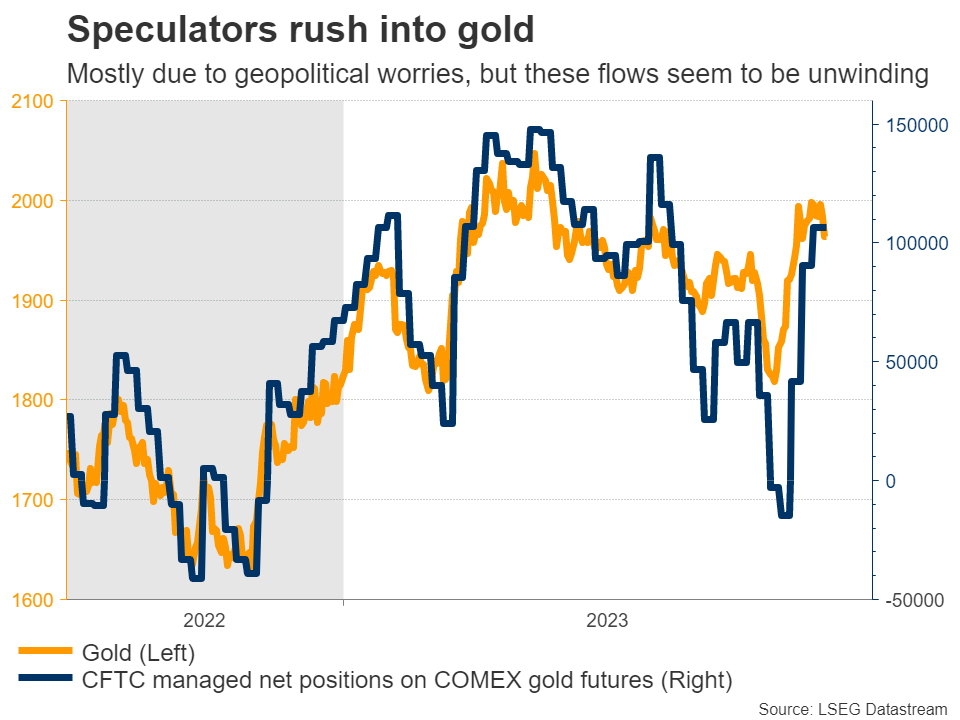
Therefore, fading demand for safe haven assets might be behind gold’s relative weakness. The recent decline in oil prices argues the same point. Oil has also served as a barometer for geopolitical stress over the past month amid concerns of potential disruptions to crude shipments. Hence, the selloff in oil reinforces the view that the ‘war premium’ is being priced out.
Central bank purchases
Beyond the flare up in Israel, another important factor that has supported gold prices this year have been direct purchases by central banks, led by China. Beijing is essentially trying to diversify its reserves, shifting away from dollars or euros and towards gold.
This trend started after Ukraine was invaded. The subsequent sanctions against Russia saw around half of the nation’s reserve assets getting frozen. Naturally, China is concerned about suffering the same fate should diplomatic relations with the West deteriorate. As such, Beijing is buying hard assets like gold, which cannot be frozen so easily.
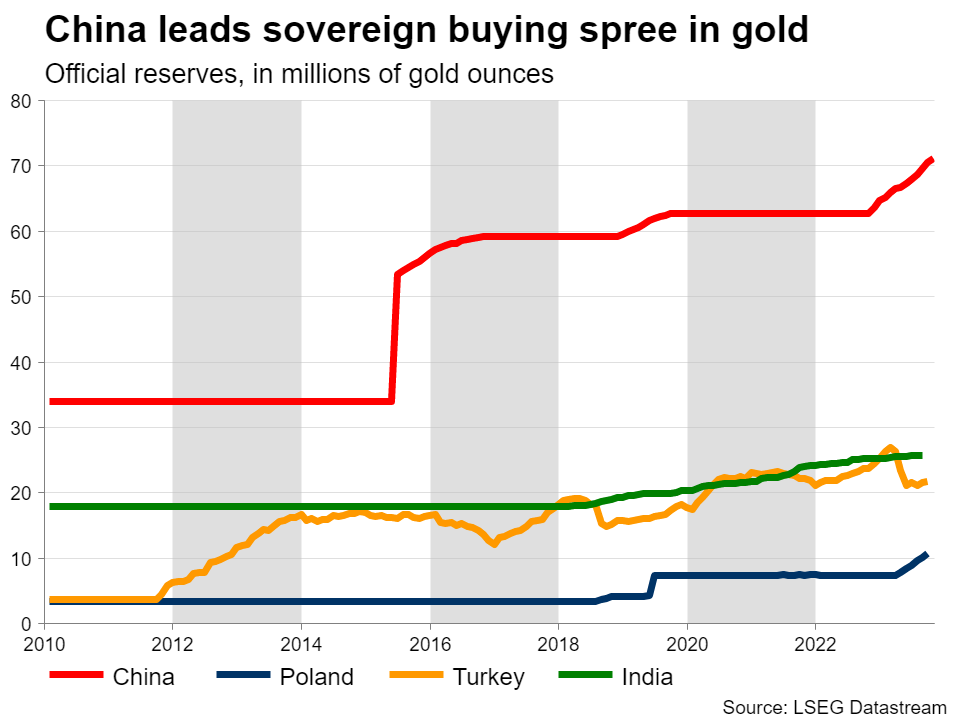
Considering that the ‘new Cold War’ between the US and China continues to heat up, spreading to technology sanctions lately with America banning the export of advanced semiconductor chips to China, this strategic shift towards gold could be a multi-year process.
What would it take for new record highs?
All told, despite the volatility, gold prices have been trapped in a wide sideways range for three years now, trading between the lower bound of $1,680 and the record high of $2,072. A significant catalyst will probably be required for this range to be broken.
A return of recession fears might be the most powerful trigger for a sustainable rally in gold. If market participants panic about the economic outlook, fueling bets of Fed rate cuts, that could push yields sharply lower and by extension breathe life into gold. This might be a story for next year, as the global economic data pulse has started to weaken.
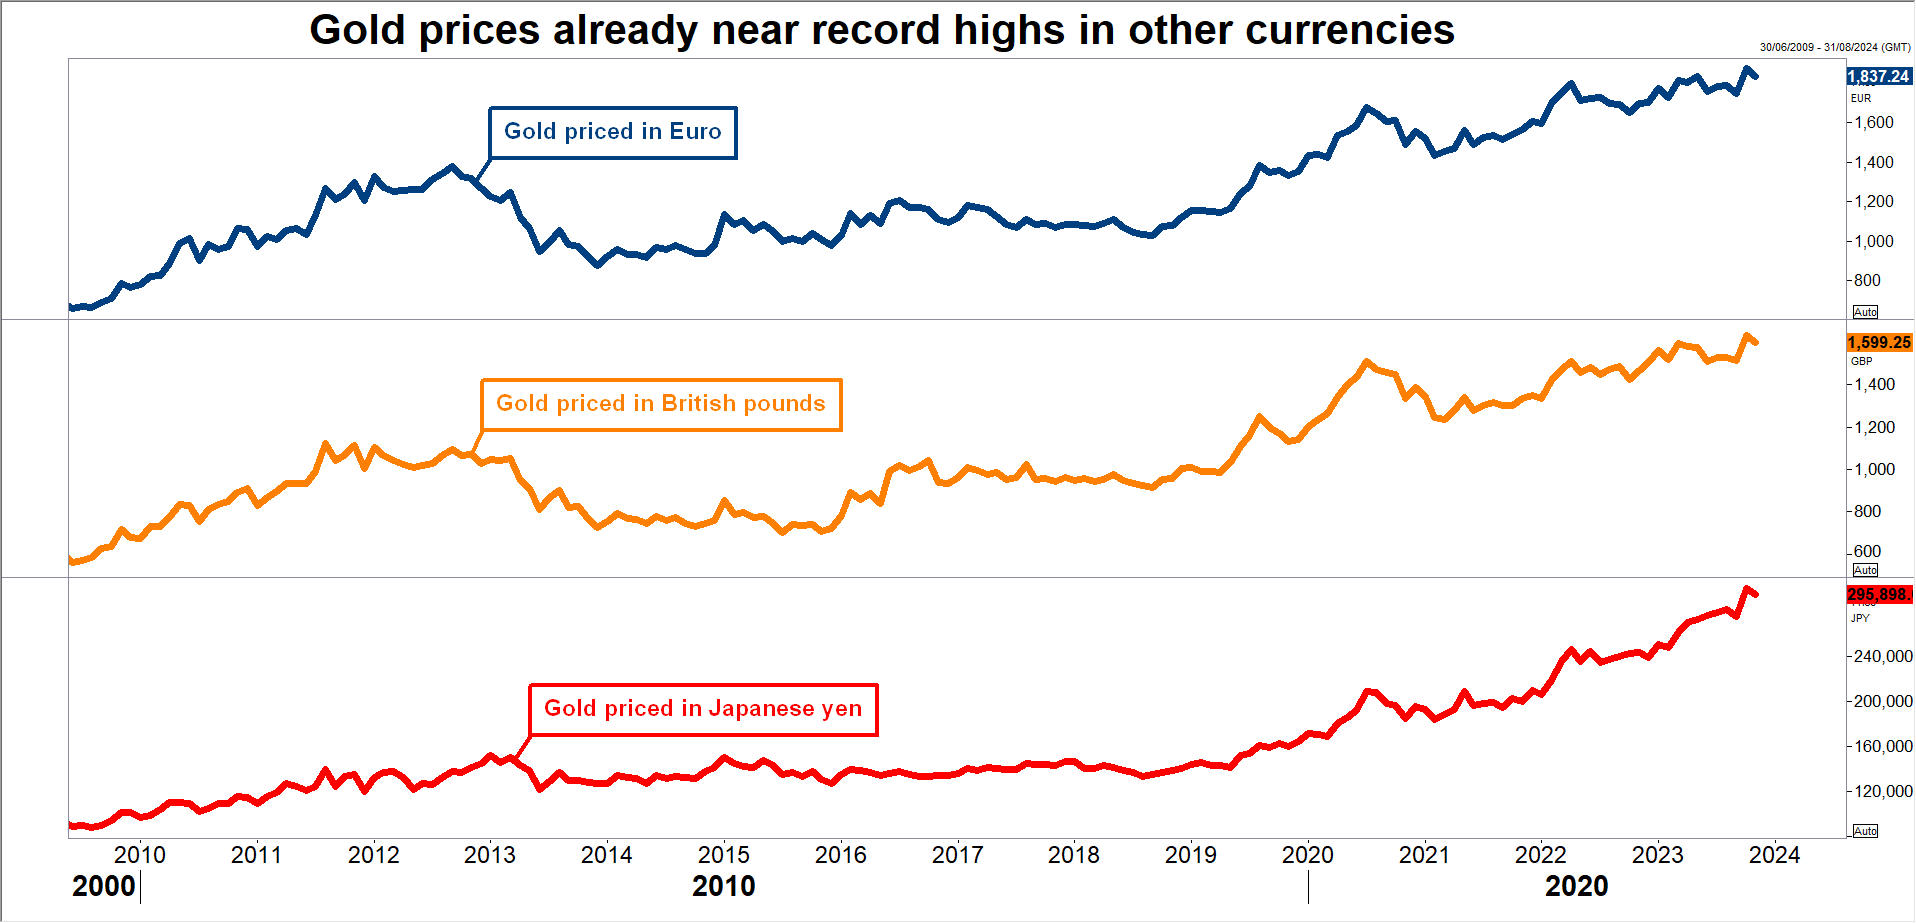
A softer US dollar can also do the trick. Gold prices are already at record levels when denominated in other currencies except for the dollar, as shown on the chart above. Hence, a persistent decline in the dollar could be another blessing for gold. That said, this scenario seems unlikely considering that most economies are in worse shape than the United States.
To conclude, the performance of gold will be decided by a combination of geopolitical tensions, the path of interest rates, direct central bank purchases, and how the economic landscape evolves.
In this sense, the near-term outlook seems somewhat negative, amid fading geopolitical demand. However, the tides could turn next year as the world economy loses steam and some regions go into recession, giving gold the firepower it needs for another rally towards record highs.
Technical Outlook and Review
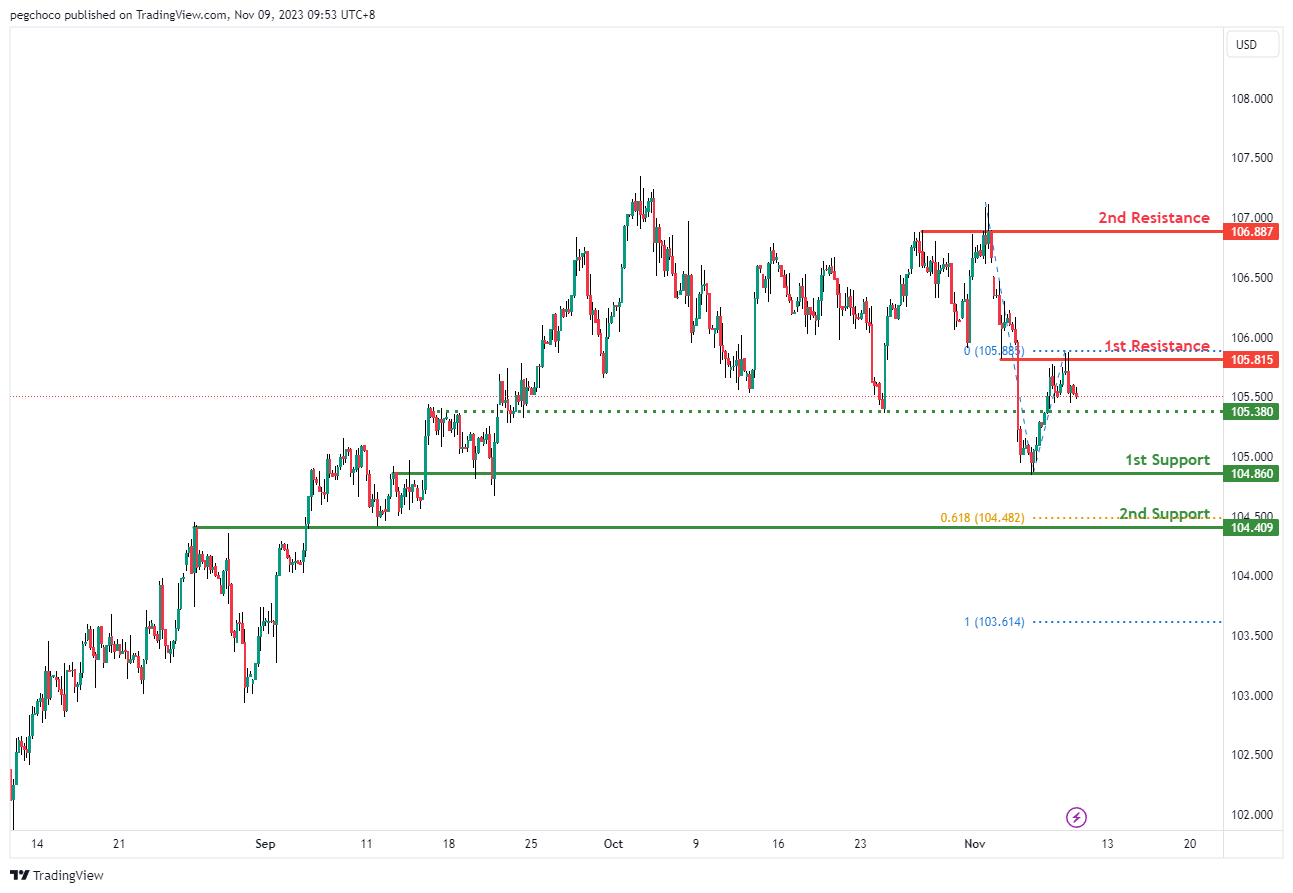
DXY:
The DXY chart currently displays a bearish overall momentum, indicating the potential for a bearish continuation towards the 1st support level.
The 1st support at 104.86 is identified as an overlap support, which strengthens its significance as a potential level where the price could find buying interest.
Moreover, the 2nd support at 104.40 is also considered an overlap support, and it exhibits a confluence with the 61.80% Fibonacci Projection, indicating strong technical support. This makes it a crucial level to watch for potential reversals or price reactions.
On the resistance side, the 1st resistance at 105.81 is categorized as an overlap resistance, suggesting it may act as a level where the price encounters selling pressure.
Furthermore, the 2nd resistance at 106.88 is noted as a multi-swing high resistance, adding to its significance as a potential barrier to the price’s upward movement.
Intermediate support at 105.39 is identified as a pullback support, providing an additional area to monitor for potential price reactions.
EUR/USD:
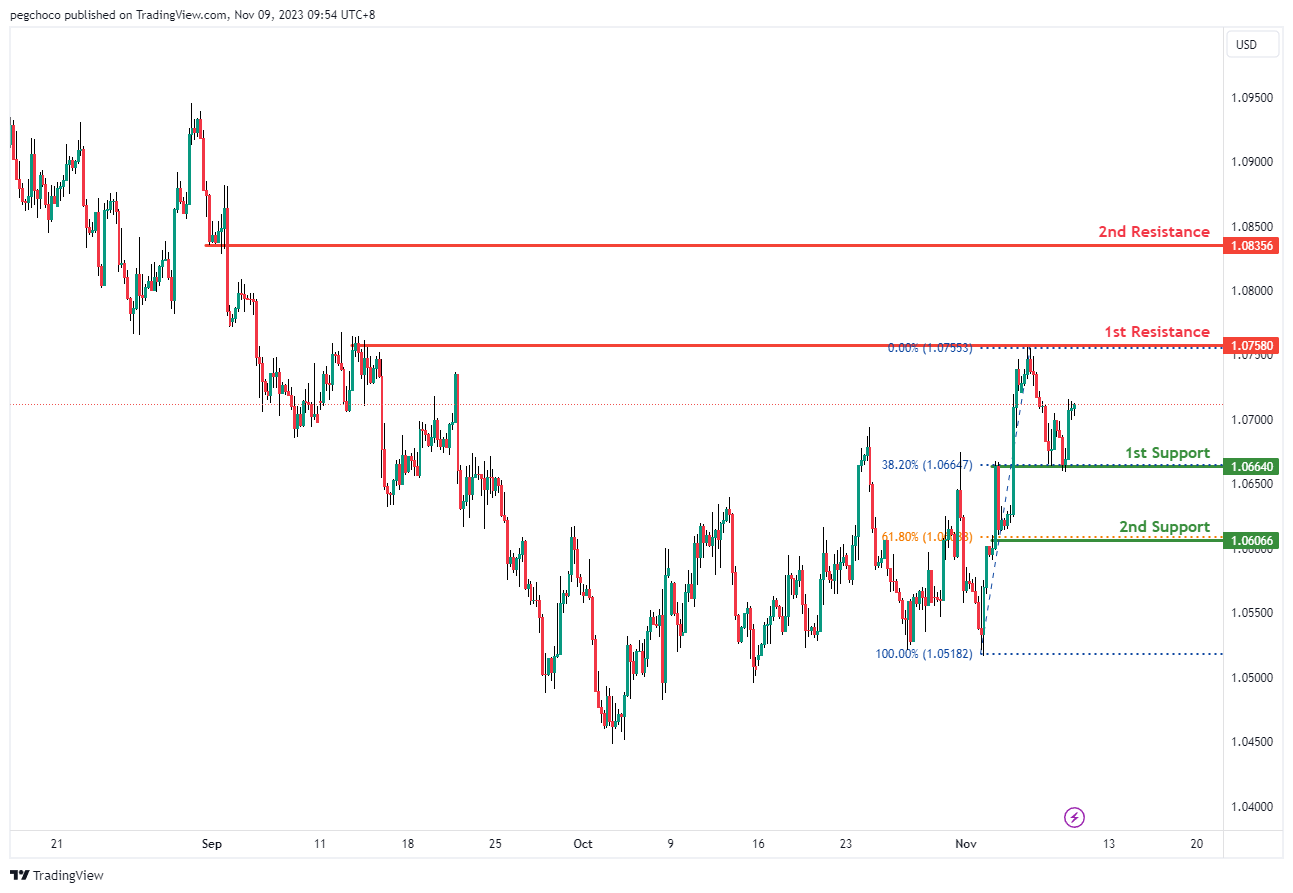
The EUR/USD chart currently has a bullish overall momentum, indicating the potential for a bullish continuation towards the 1st resistance level.
The 1st support at 1.0664 is identified as an overlap support and coincides with the 38.20% Fibonacci Retracement level, making it a significant level where buyers may step in.
Additionally, the 2nd support at 1.0606 aligns with the 61.80% Fibonacci Retracement level, further reinforcing its potential as a strong support level.
On the resistance side, the 1st resistance at 1.0758 is categorized as a multi-swing high resistance, suggesting it may act as a level where the price encounters selling pressure.
Furthermore, the 2nd resistance at 1.0835 is noted as a pullback resistance, indicating it could be a level where the price faces obstacles in its upward movement.
EUR/JPY:
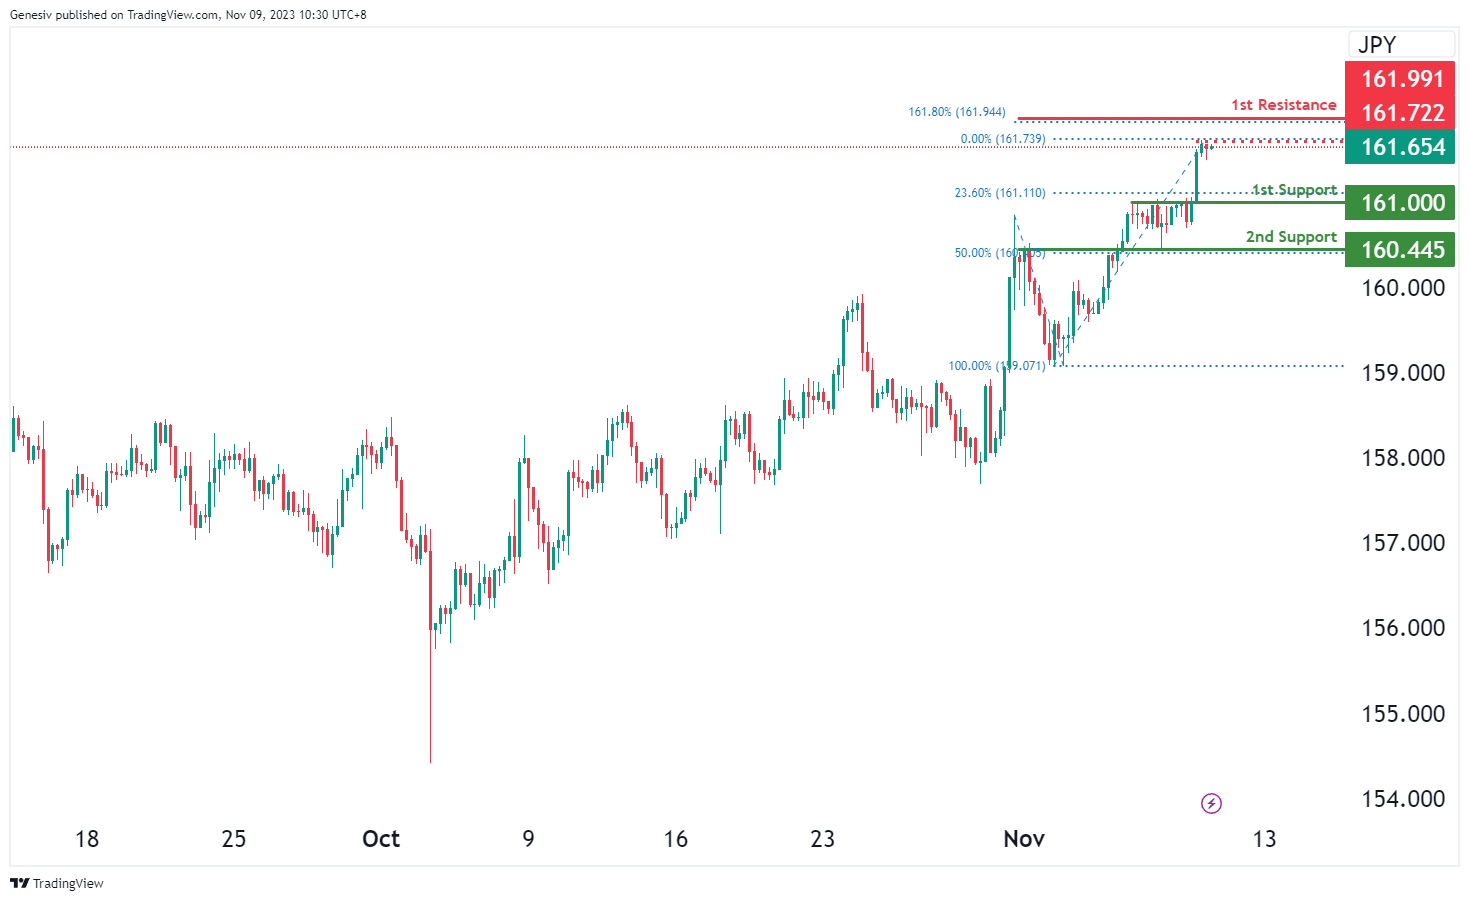
The EUR/JPY instrument is currently exhibiting a bearish momentum on the chart. There’s a potential for a short-term rise towards the first resistance before a likely reversal, subsequently leading the price to drop towards the first support at 161.00, known for its pullback support at the 23.60% Fibonacci Retracement level. Additionally, a second support at 160.44 is identified as an overlap support at the 50% Fibonacci Retracement level. On the resistance side, the first resistance at 161.99, marked at the 161.80% Fibonacci Extension, and the intermediate resistance at 161.72, recognized for its swing high resistance, indicate crucial points within the trading scenario.
EUR/GBP:
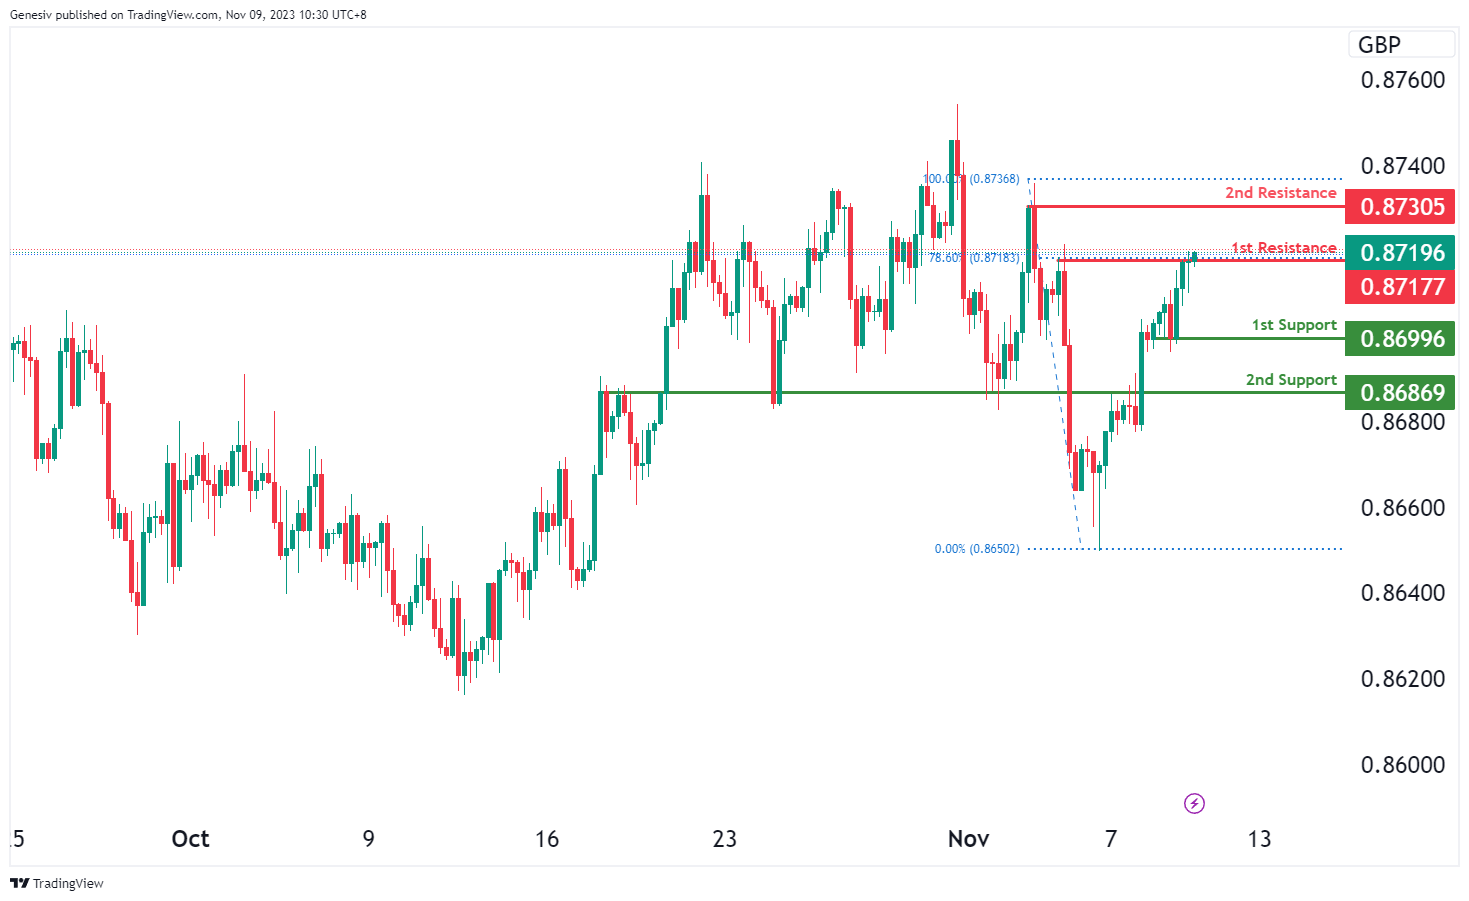
For EUR/GBP, the analysis suggests the following support and resistance levels based on the bullish momentum:
1st support is identified at 0.8699, noted as a swing low support. This level historically has shown significant buying interest or a bounce in the price.
The 2nd support is positioned at 0.8686, recognized as a pullback support. It indicates a level where the price has retraced before moving higher, adding further credence to its potential support role.
Regarding resistance, the 1st resistance level is at 0.8717, known as a swing high resistance coinciding with the 78.60% Fibonacci Retracement. This suggests a substantial historical level where selling pressure has previously affected the price, aligning with a critical Fibonacci level.
The 2nd resistance is placed at 0.8730, identified as a swing high resistance. This further solidifies the potential barrier that the price might face after breaching the 1st resistance, signaling another historical point where the price has been met with selling pressure.
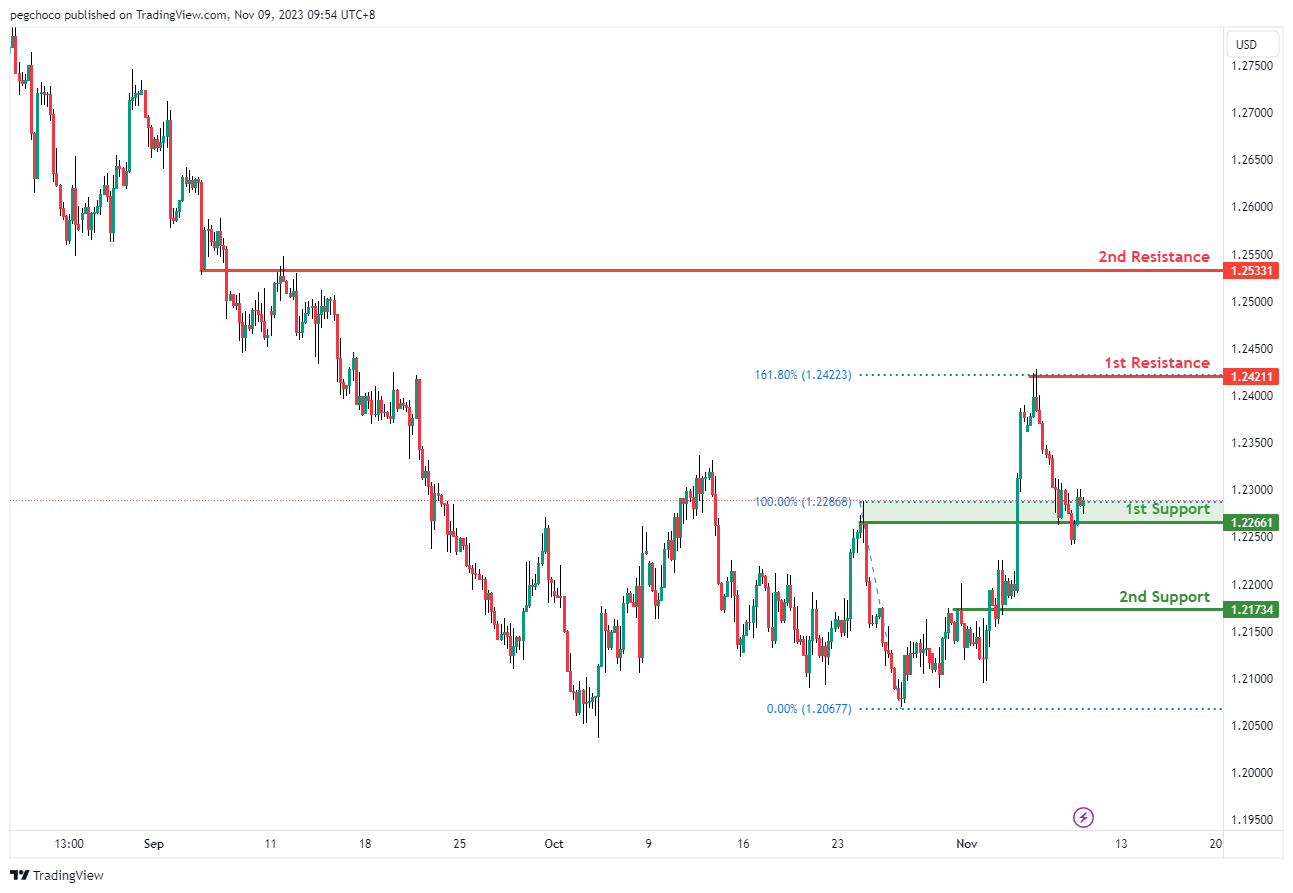
GBP/USD:
The GBP/USD chart currently has a bullish overall momentum, suggesting the potential for a bullish continuation towards the 1st resistance level.
The 1st support at 1.2266 is identified as an overlap support, making it a significant level where the price may find buying interest.
Additionally, the 2nd support at 1.2173 is also categorized as an overlap support, further reinforcing its potential as a strong support level.
On the resistance side, the 1st resistance at 1.2421 is noted as a swing high resistance, suggesting it could act as a level where the price encounters selling pressure.
Furthermore, the 2nd resistance at 1.2533 is identified as an overlap resistance, indicating another potential level where the price may face obstacles in its upward movement.
GBP/JPY:
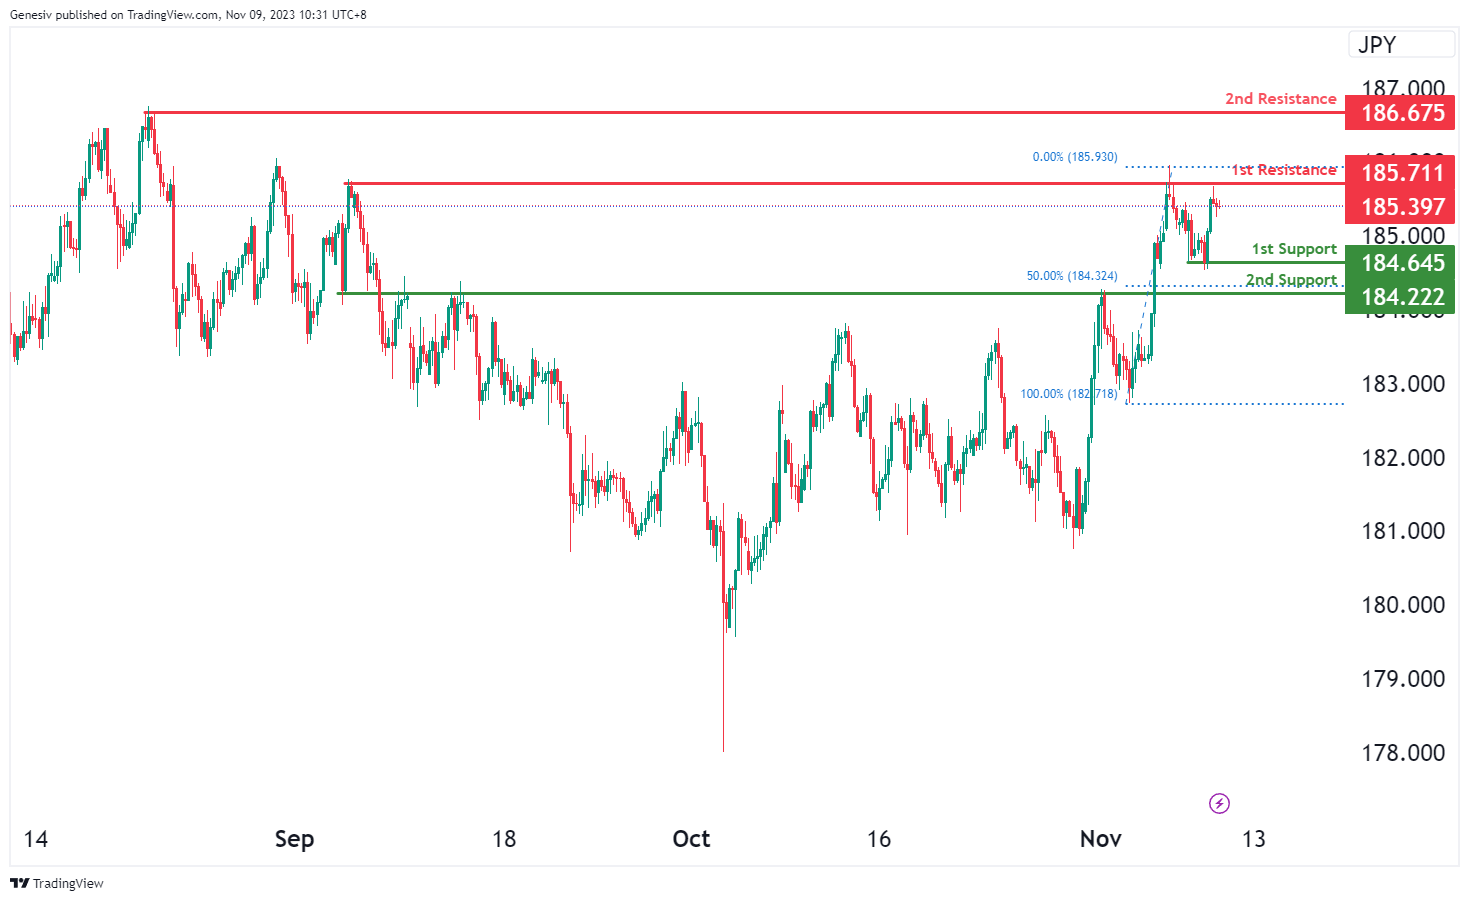
The GBP/JPY chart reflects a bearish momentum, suggesting a potential bearish reaction at the first resistance level, leading the price to drop towards the first support at 184.64, supported by its significance as a swing low support. Additionally, a second support at 184.22 is recognized as a pullback support at the 50% Fibonacci Retracement level. On the resistance side, the first resistance at 185.71 is identified as a point of multi-swing high resistance, while the second resistance at 186.67 is characterized by its significance as a swing high resistance, both indicating crucial levels within the trading context.
USD/CHF:
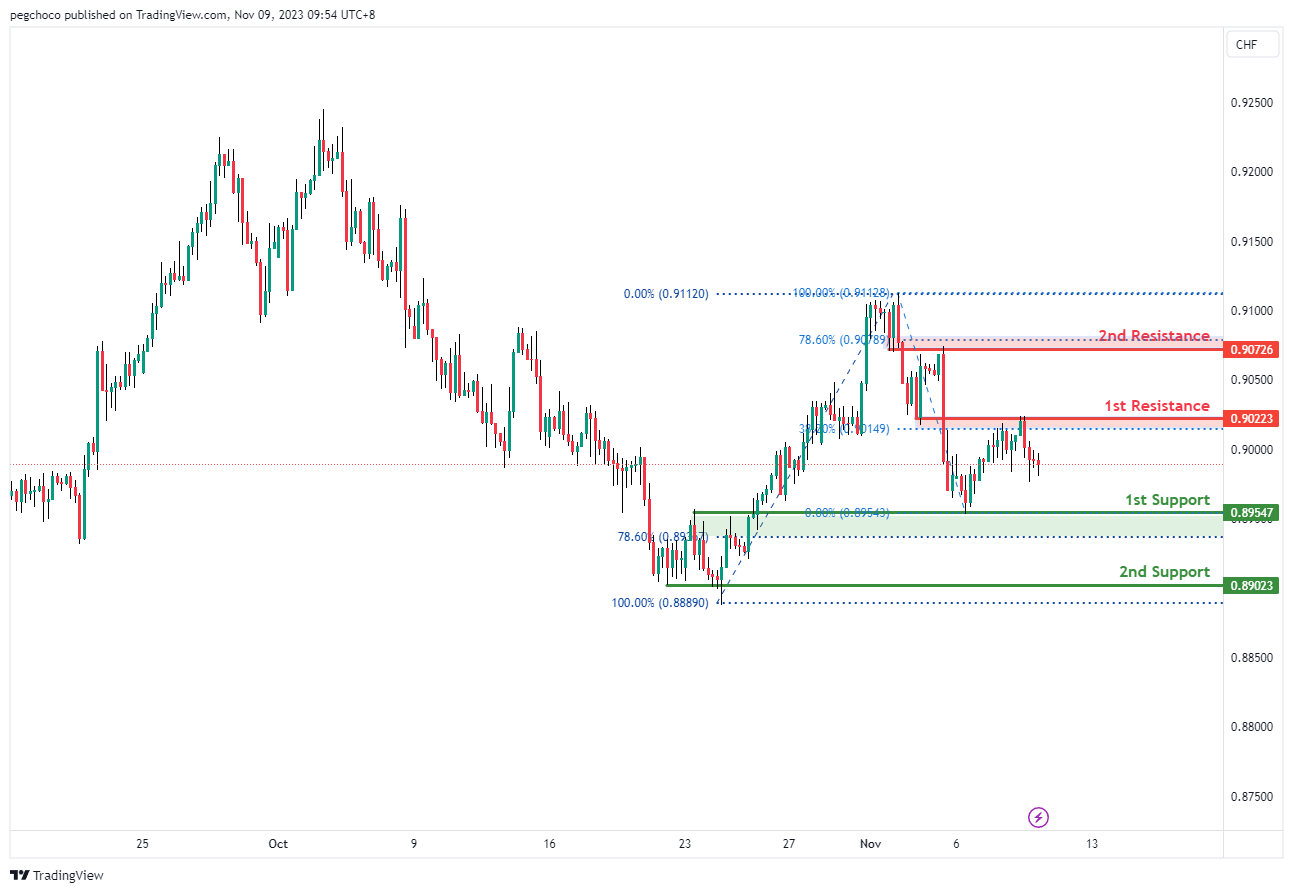
The USD/CHF chart currently exhibits a bearish overall momentum, indicating the potential for a bearish continuation towards the 1st support level.
The 1st support at 0.8954 is identified as an overlap support, signifying its significance as a level where the price may find buying interest. Additionally, this support level aligns with the 78.60% Fibonacci Retracement, adding to its potential as a strong support zone.
The 2nd support at 0.8902 is categorized as a multi-swing low support, further reinforcing its role as a potential level where buyers could enter the market.
On the resistance side, the 1st resistance at 0.9022 is noted as an overlap resistance. This level may act as a barrier where the price could face selling pressure. It also corresponds to the 38.20% Fibonacci Retracement.
Furthermore, the 2nd resistance at 0.9072 is identified as an overlap resistance and coincides with the 78.60% Fibonacci Retracement. This level adds to the strength of the resistance zone.
USD/JPY:
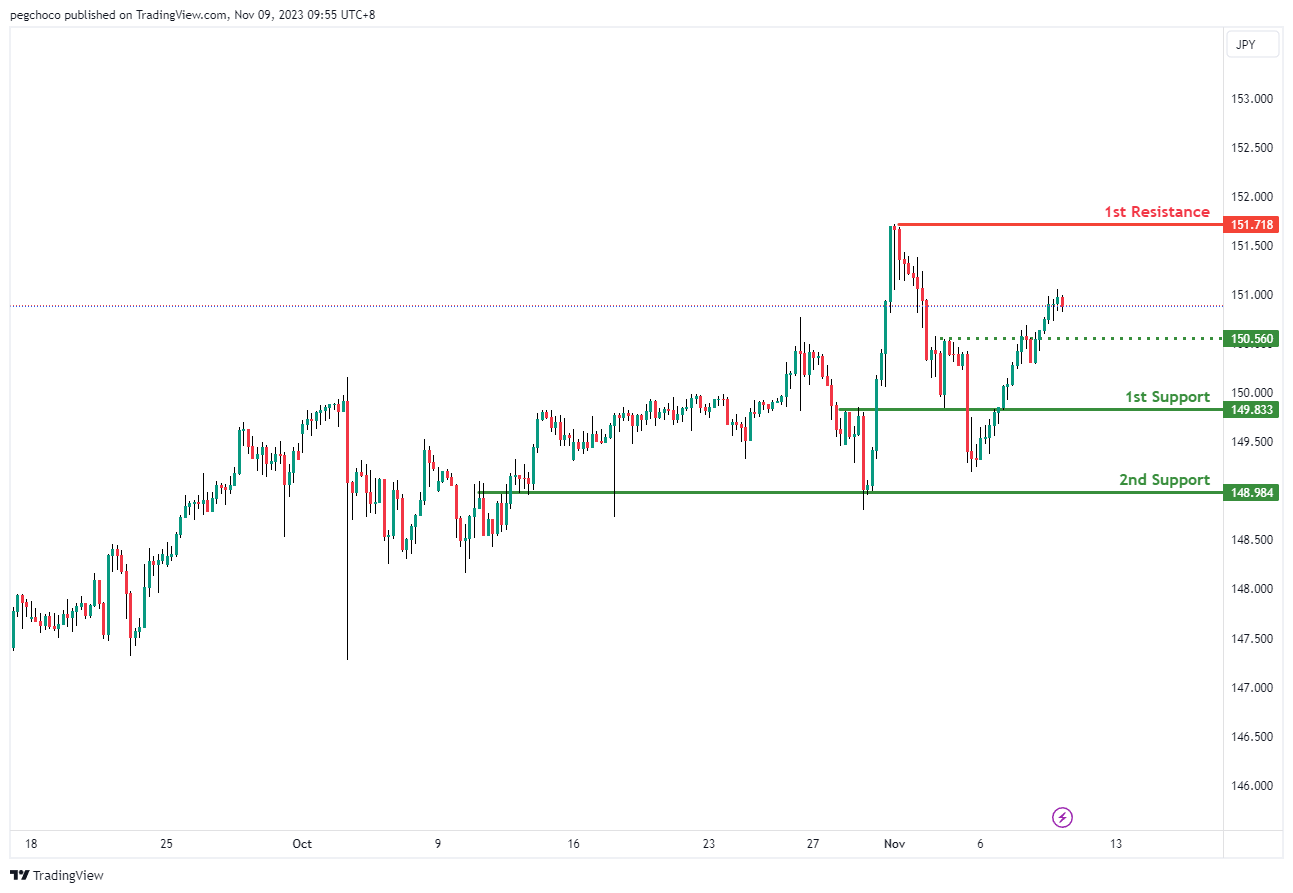
The USD/JPY chart currently displays a bullish overall momentum, suggesting the potential for a bullish continuation towards the 1st resistance level.
The 1st support at 149.83 is identified as a pullback support, indicating it could be a significant level where the price might find buying interest. This support level aligns with the prevailing bullish momentum.
Additionally, the 2nd support at 148.98 is categorized as an overlap support, further reinforcing its potential as a support level where buyers may step in.
On the resistance side, the 1st resistance at 151.71 is noted as a swing high resistance. This level indicates a potential barrier where the price may face selling pressure as it attempts to move higher.
Intermediate support at 150.56 is also mentioned as a pullback support, adding to the potential areas where the price might find support in its bullish journey.
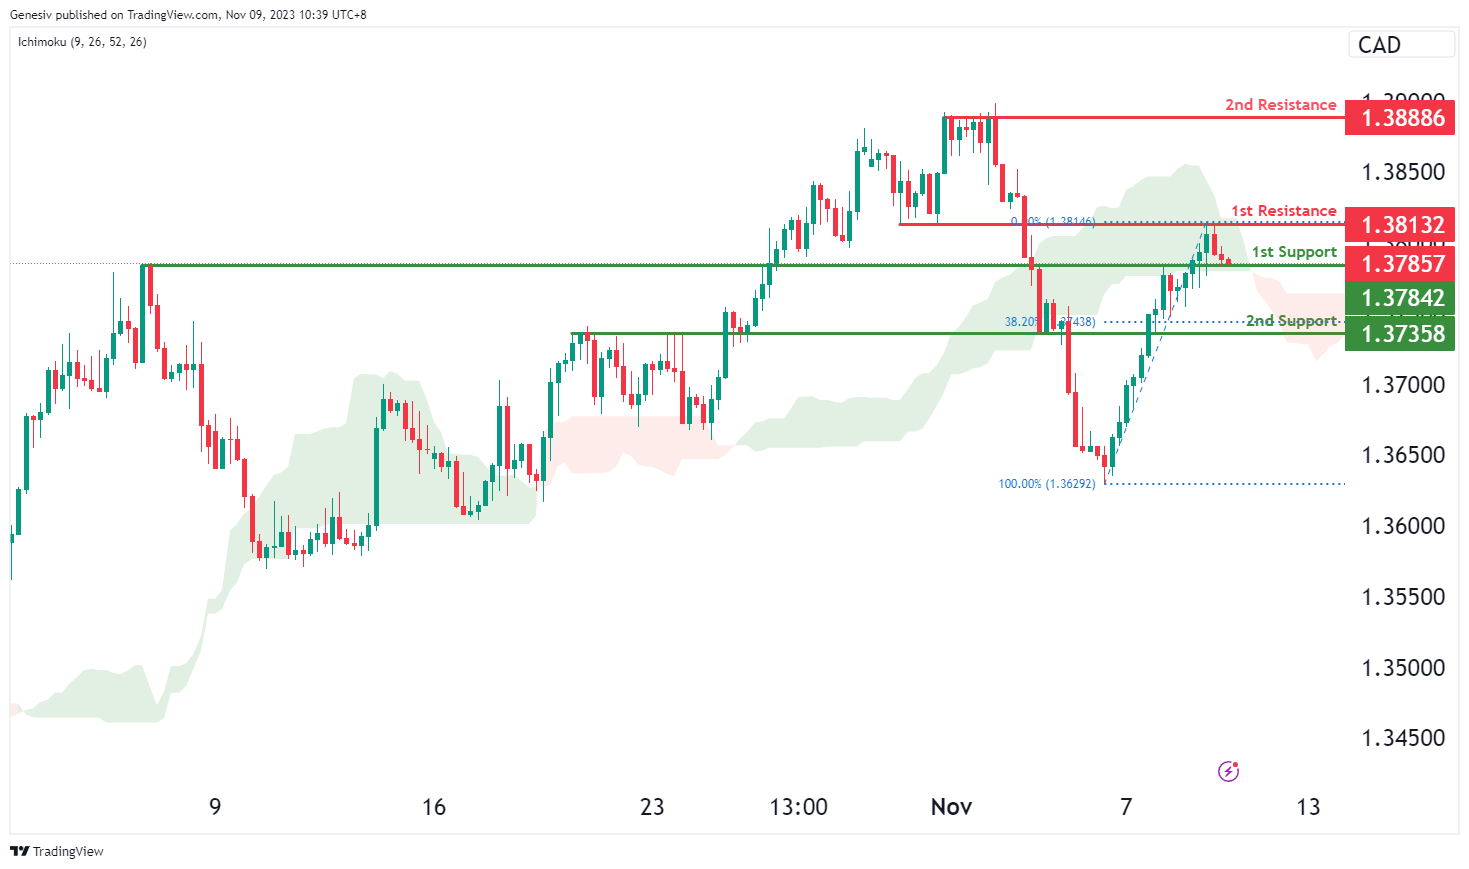
USD/CAD:
The USD/CAD chart is currently exhibiting an overall bullish momentum, indicating a potential for price to make a bullish continuation towards the 1st resistance.
The 1st resistance level at 1.3813 is identified as an overlap resistance. Higher up, the 2nd resistance level at 1.3889 is marked as a pullback resistance, suggesting that it may act as a strong resistance zone.
To the downside, the 1st support level at 1.3784 is identified as an overlap support. Further below, the 2nd support level at 1.3736 is also noted as an overlap support that aligns with the 38.20% Fibonacci retracement level, adding to its potential as a level where price could find support.
AUD/USD:
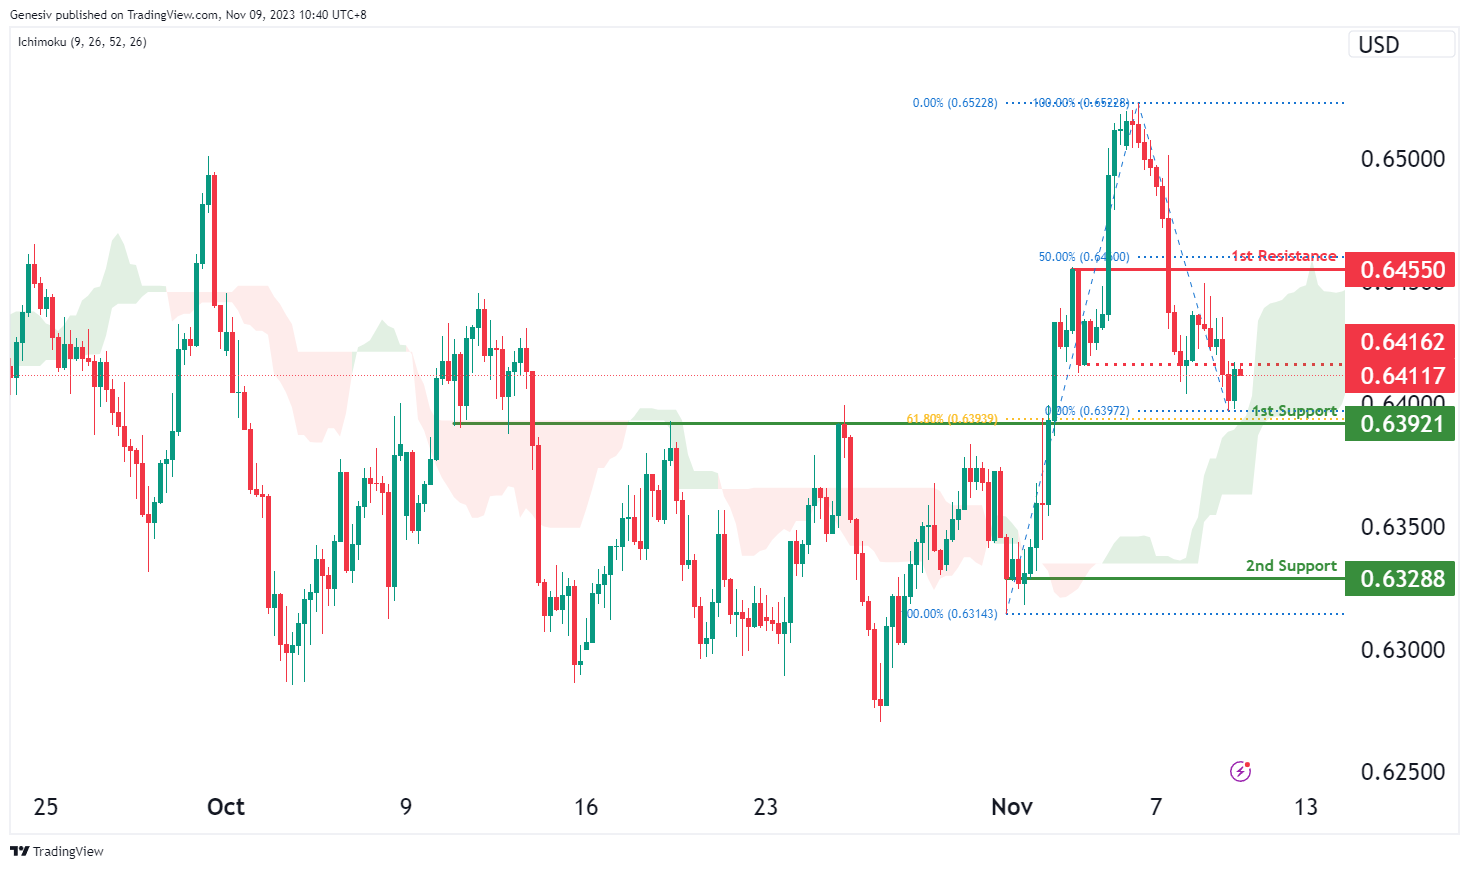
The AUD/USD chart is currently characterized by a weak bullish momentum. There is potential for price to make a bullish reaction off the 1st support and rise towards the intermediate resistance. Another factor contributing to this bullish reaction is that price is trading above the bullish Ichimoku cloud and could find strong support within the cloud.
The 1st support level at 0.6392 is idenitfied as an overlap support that aligns with the 61.80% Fibonacci retracement level. Further below, the 2nd support level at 0.6329 is noted as a pullback support, reinforcing its potential as a level of support for the price.
On the resistance side, the intermediate resistance level at 0.6416 is identified as a pullback resistance. Additionally, the 1st resistance level at 0.6455 is also marked as a pullback resistance that aligns close to the 50.00% Fibonacci retracement level, indicating another potential obstacle for the price’s upward movement.
NZD/USD
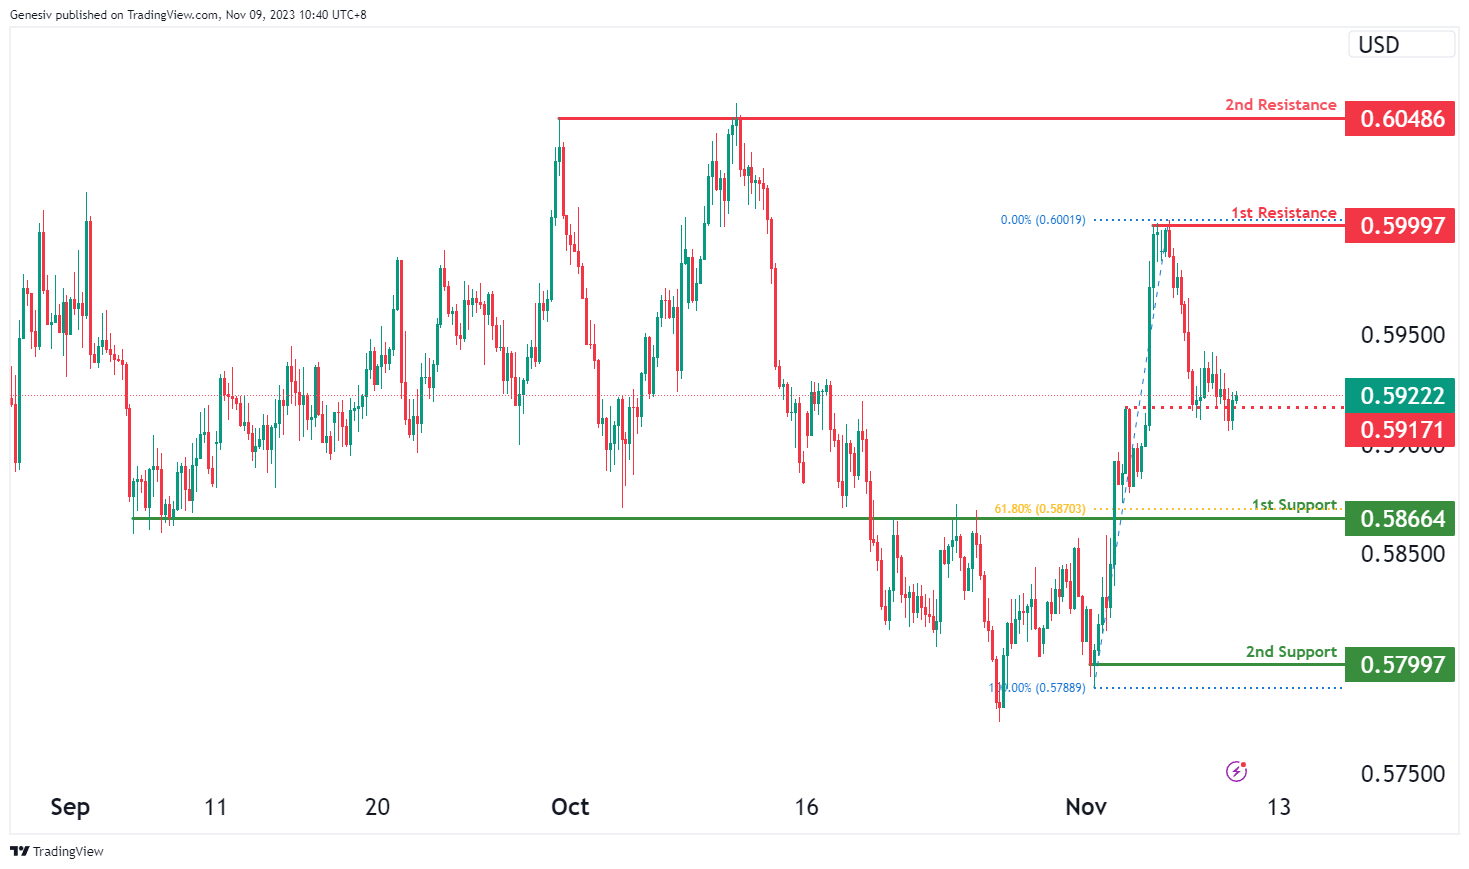
The NZD/USD chart is currently characterized by an overall bearish momentum. There is potential for price to make a bearish continuation towards the 1st support.
The 1st support level at 0.5866 is identified as an overlap support that aligns with the 61.80% Fibonacci retracement level. Further below, the 2nd support level at 0.5799 is marked as a swing-low support, reinforcing its potential significance as a level of support.
On the resistance side, the intermediate resistance level at 0.5917 is identified as a pullback resistance while the 1st resistance level at 0.5999 is noted as a swing-high resistance. Higher up, the 2nd resistance level at 0.6049 is marked as a multi-swing-high resistance, indicating another potential level where the price may face obstacles in its upward movement.
DJ30:
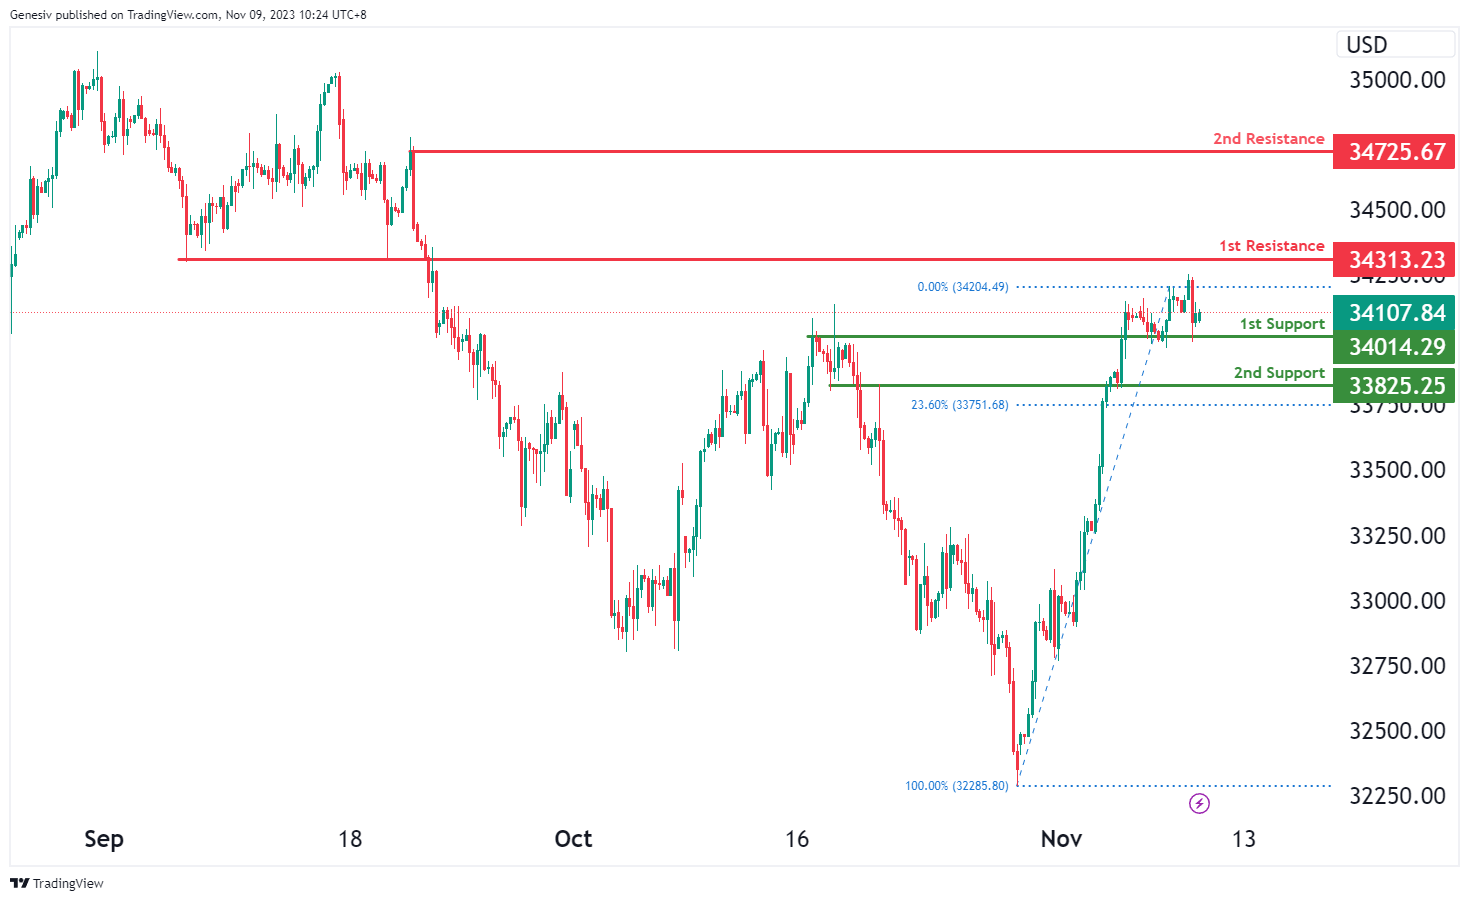
For DJ30, the current market momentum is bullish, and the price could potentially see a bullish continuation toward the 1st resistance. Here are the identified support and resistance levels:
1st support at 34014.29 is labeled as an overlap support, signifying a significant historical level where the price has shown a tendency to find support.
The 2nd support at 33825.25 is also recognized as an overlap support and coincides with the 23.60% Fibonacci Retracement level. This dual confirmation enhances its significance as a potential support area for the price.
On the resistance side, the 1st resistance at 34313.23 is identified as a pullback resistance. This level is likely to present a barrier where the price might face selling pressure based on historical price action.
The 2nd resistance is identified at 34725.67 and is characterized as a swing high resistance, implying a level where historical highs have been observed. This area could act as a significant barrier to further upward movement, potentially causing a reversal or a slowdown in the bullish momentum.
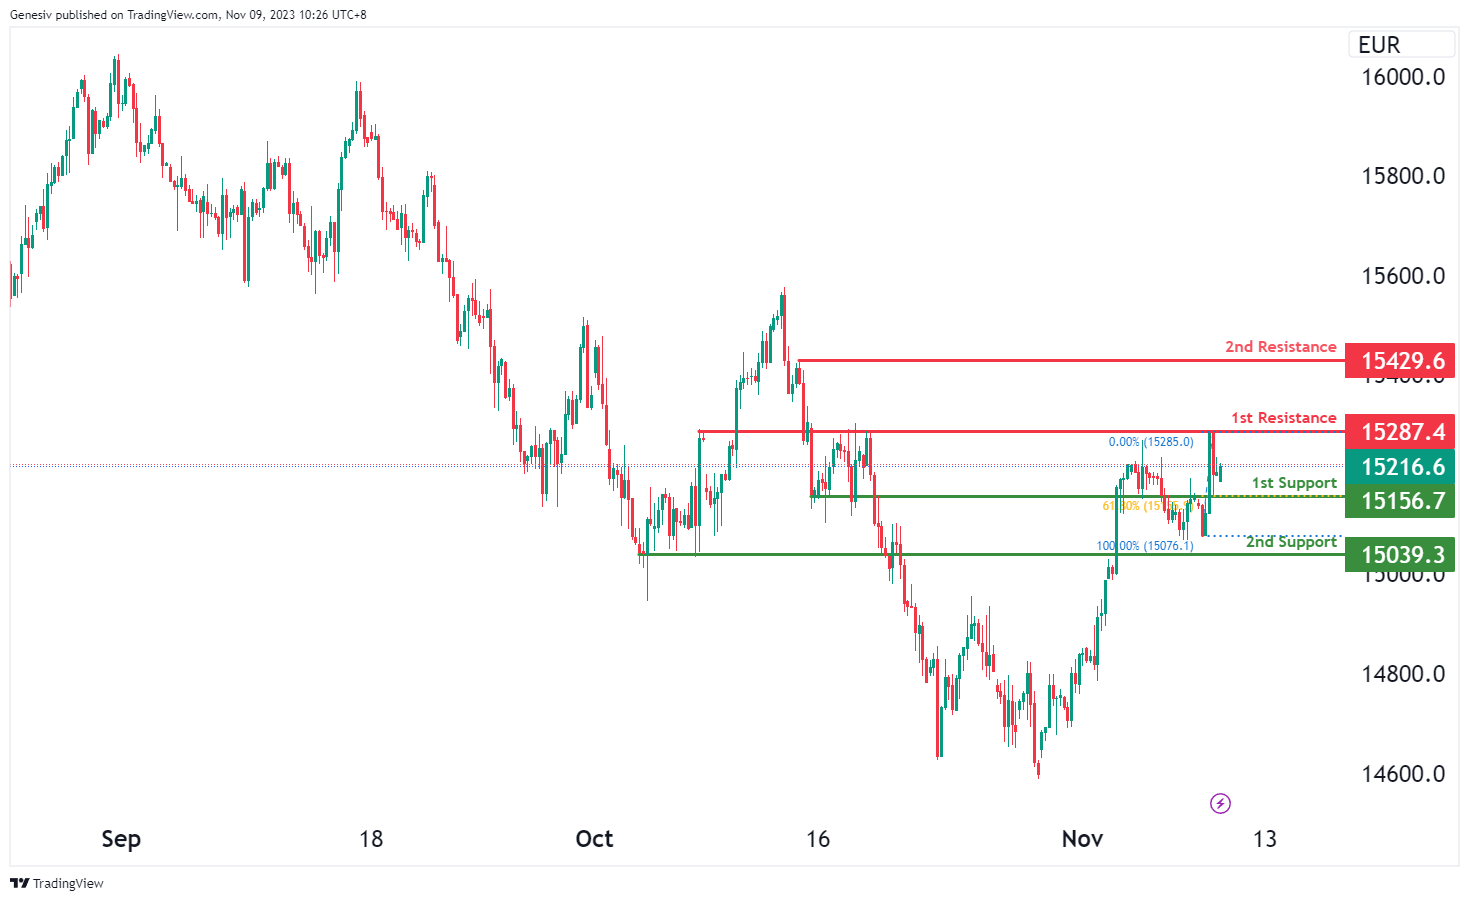
GER40:
For GER40, the current market momentum is bullish. The analysis indicates potential support and resistance levels:
1st support at 15156.70, characterized as a pullback support, coincides with the 61.80% Fibonacci Retracement. This confluence enhances the significance of this level as a potential support area, indicating historical retracement levels aligning with prior price action.
The 2nd support at 15039.30 is another identified area for potential support. It’s marked as a pullback support without any particular confluence.
On the resistance side, the 1st resistance is noted at 15287.40, labeled as an overlap resistance, denoting a significant historical level where the price has shown a tendency to face selling pressure.
The 2nd resistance is at 15429.60, recognized as a swing high resistance. This level typically indicates historical highs and might act as a significant barrier to further upward movement, potentially causing a reversal or a slowdown in the bullish momentum.
US500
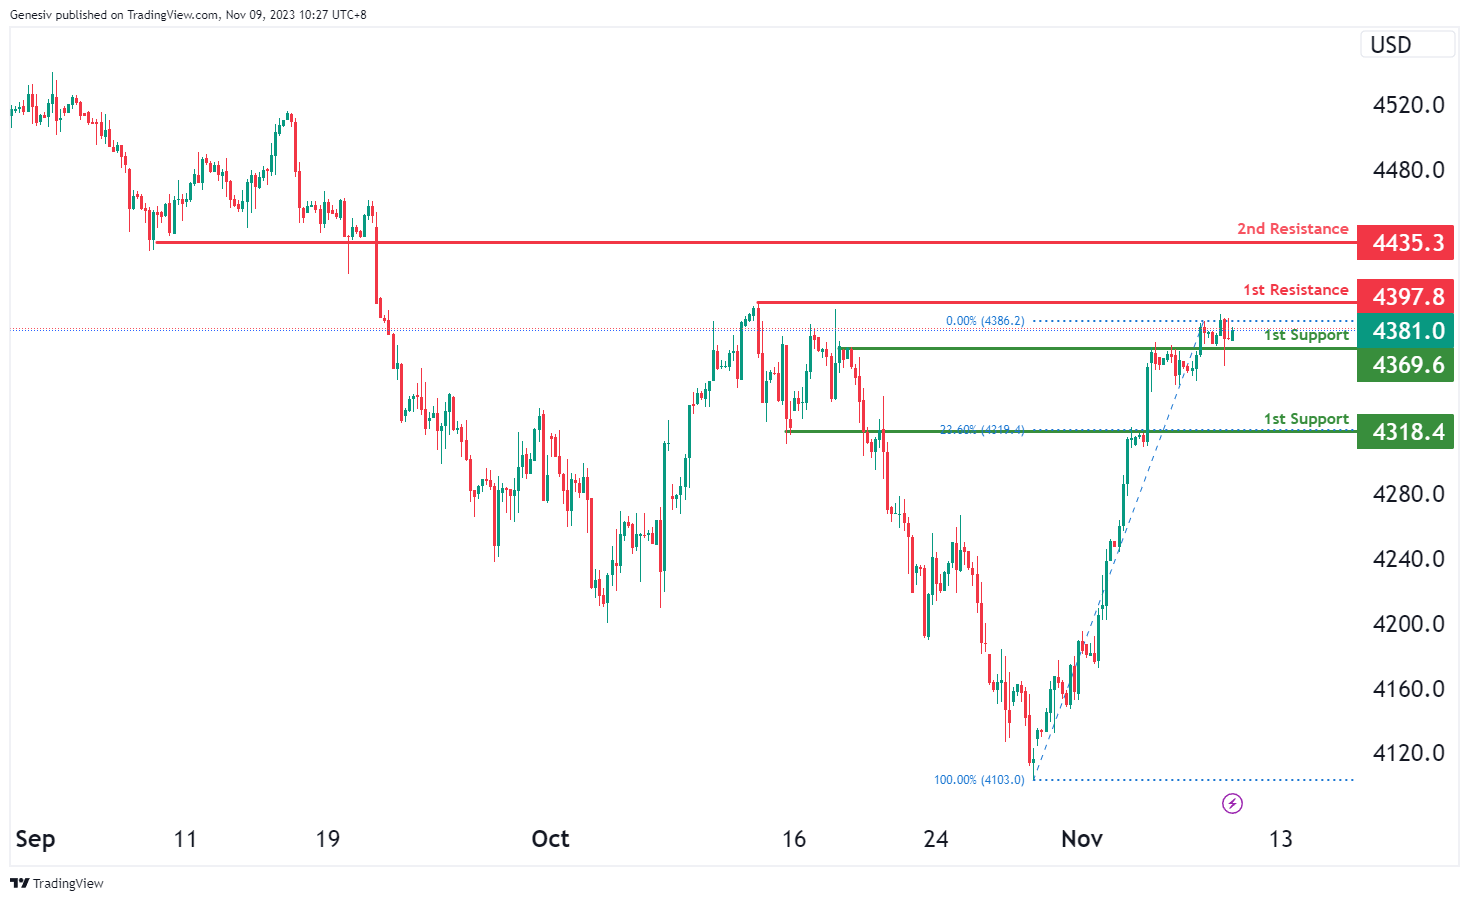
For US500, the current market momentum is bullish. Here’s an analysis of potential support and resistance levels:
1st support is identified at 4369.6, signified as an overlap support, which implies a historically significant level where the price might find initial support. This suggests that historically, the price has bounced back from this level.
The 2nd support at 4318.4 is also noted, classified as a pullback support and coinciding with the 23.60% Fibonacci Retracement level. This level signifies a potentially stronger support zone due to its alignment with a Fibonacci level.
On the resistance side, the 1st resistance is positioned at 4397.8, recognized as a swing high resistance. This level signifies a historically critical area where the price has previously reversed or stalled, reflecting a probable barrier to continued upward movement.
The 2nd resistance is observed at 4435.3, categorized as a pullback resistance. This level might serve as a point where selling pressure increases, potentially leading to a reversal or a slowdown in the bullish momentum.
BTC/USD:
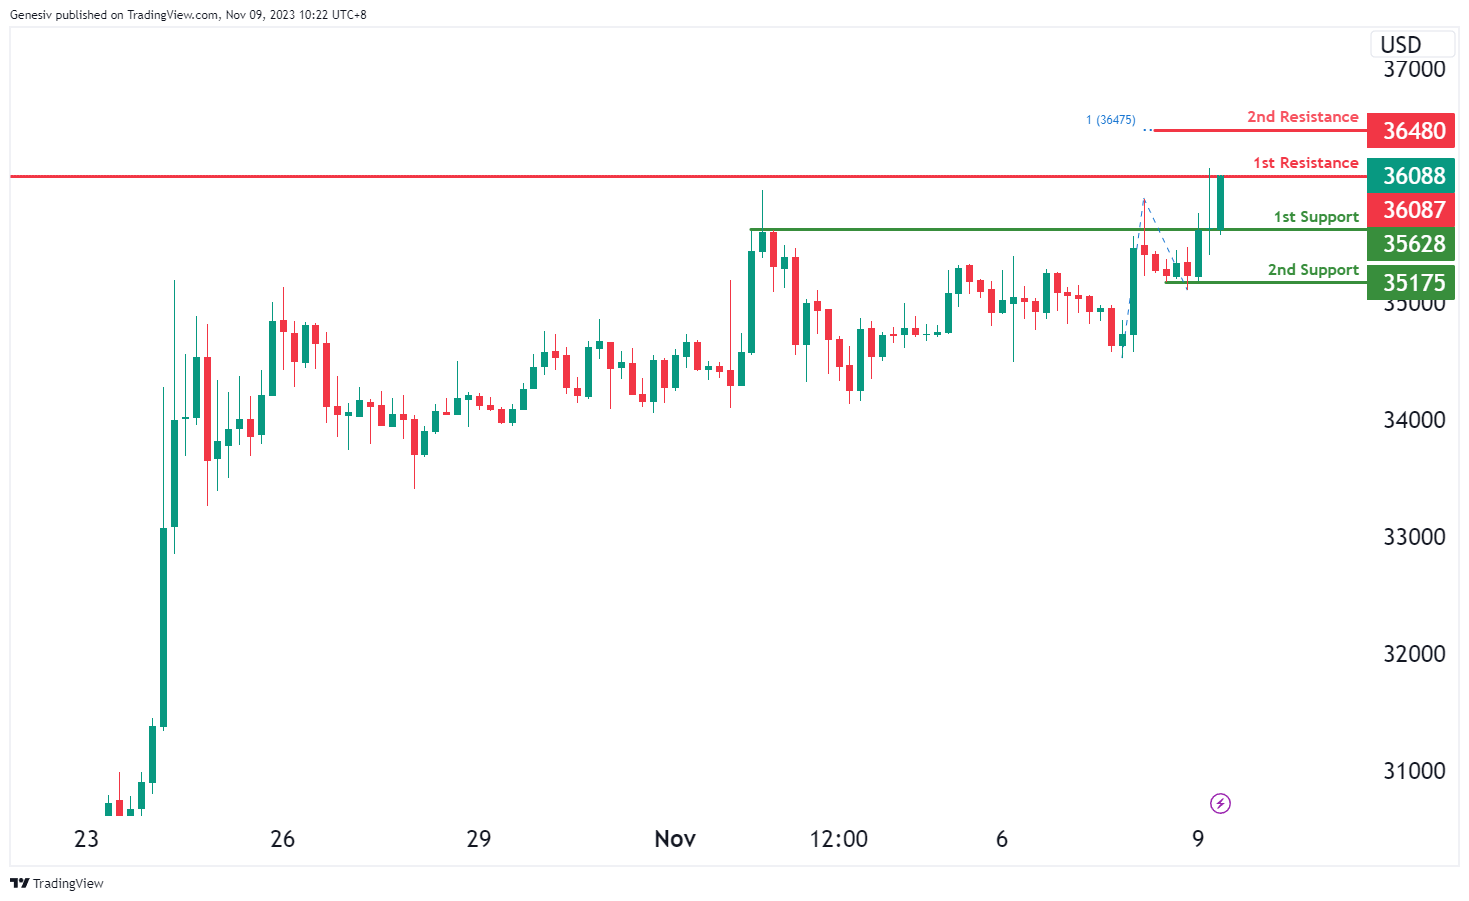
For BTC/USD, considering the current bullish momentum in the chart, there’s a potential scenario where the price might experience a bullish breakthrough past the first resistance level, potentially advancing towards the second resistance.
The provided levels are as follows:
1st support at 35628 is identified as a point of pullback support, indicating it as a significant level where the price might find substantial support during a pullback within the prevailing bullish trend.
The 2nd support at 35175 is recognized as a level of swing low support, suggesting it could serve as a critical area where the price might find support during downward movement.
On the resistance side, the 1st resistance at 36087 is characterized as an overlap resistance, representing a level where the price might encounter a significant barrier in its upward movement.
Moreover, the 2nd resistance at 36480 is identified as a level marked by the 100% Fibonacci Projection. This suggests it as a crucial level where the price might face strong resistance as it aims to surge further within the bullish trend.
ETH/USD:
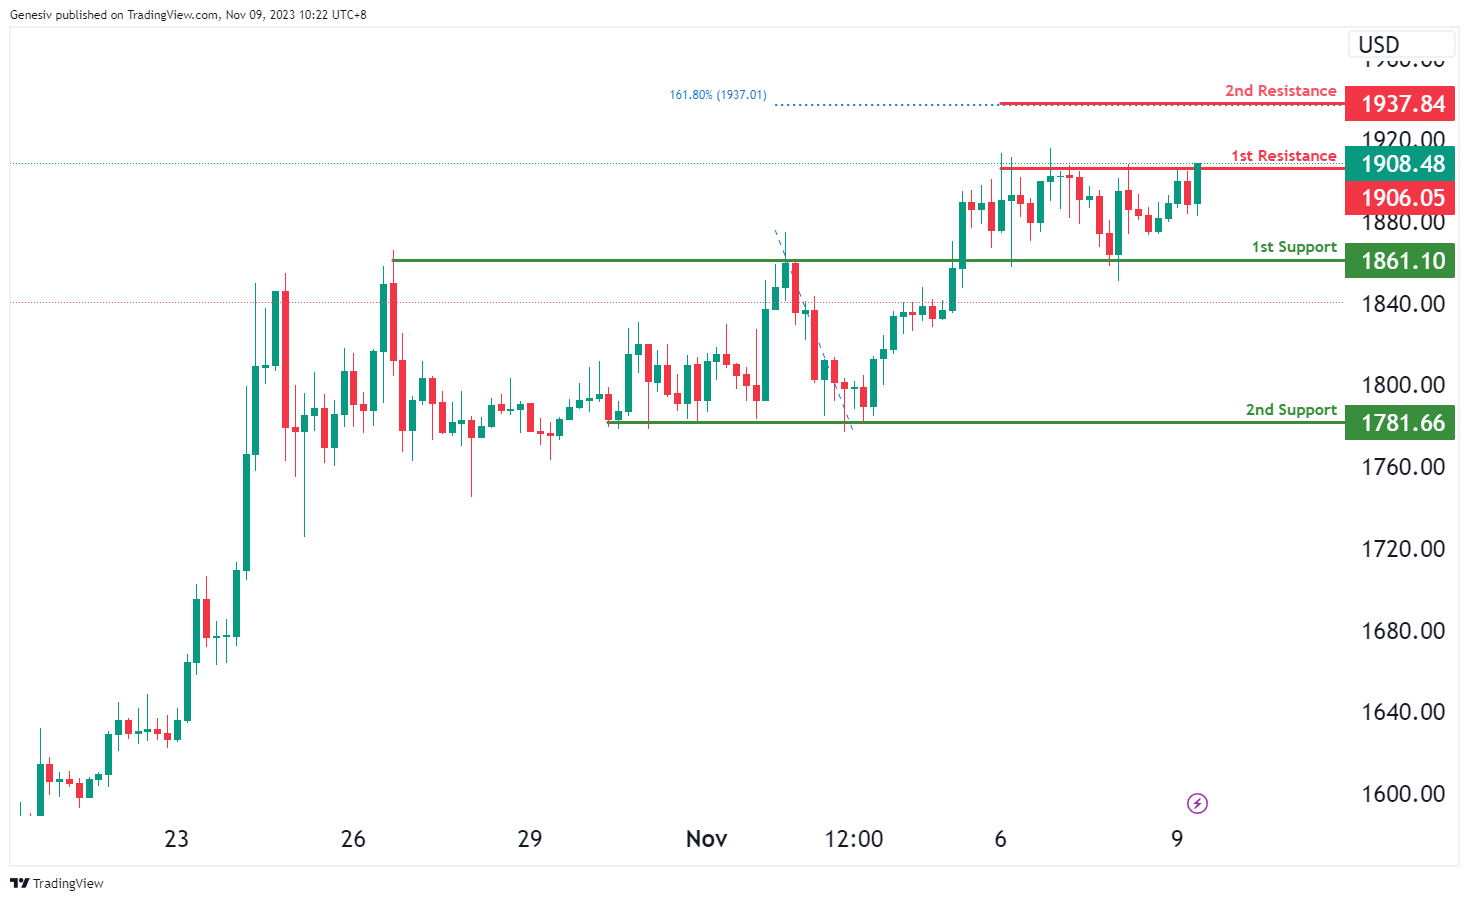
For ETH/USD, considering the current bullish momentum in the chart, there’s a potential scenario where the price might experience a bullish breakthrough past the first resistance level, potentially advancing towards the second resistance.
The provided levels are as follows:
1st support at 1861.10 is identified as an overlap support, indicating it as a significant level where the price might find support due to its historical relevance.
The 2nd support at 1781.66 is recognized as a level of multi-swing low support, suggesting it could serve as a critical area where the price might find strong support during downward movement.
On the resistance side, the 1st resistance at 1906.05 is characterized as a level of multi-swing high resistance, representing a point where the price might encounter substantial selling pressure due to historical highs.
Additionally, the 2nd resistance at 1937.84 is identified as a level marked by the 161.80% Fibonacci Extension. This indicates it as a crucial level where the price might face increased resistance as it aims to continue its bullish momentum.
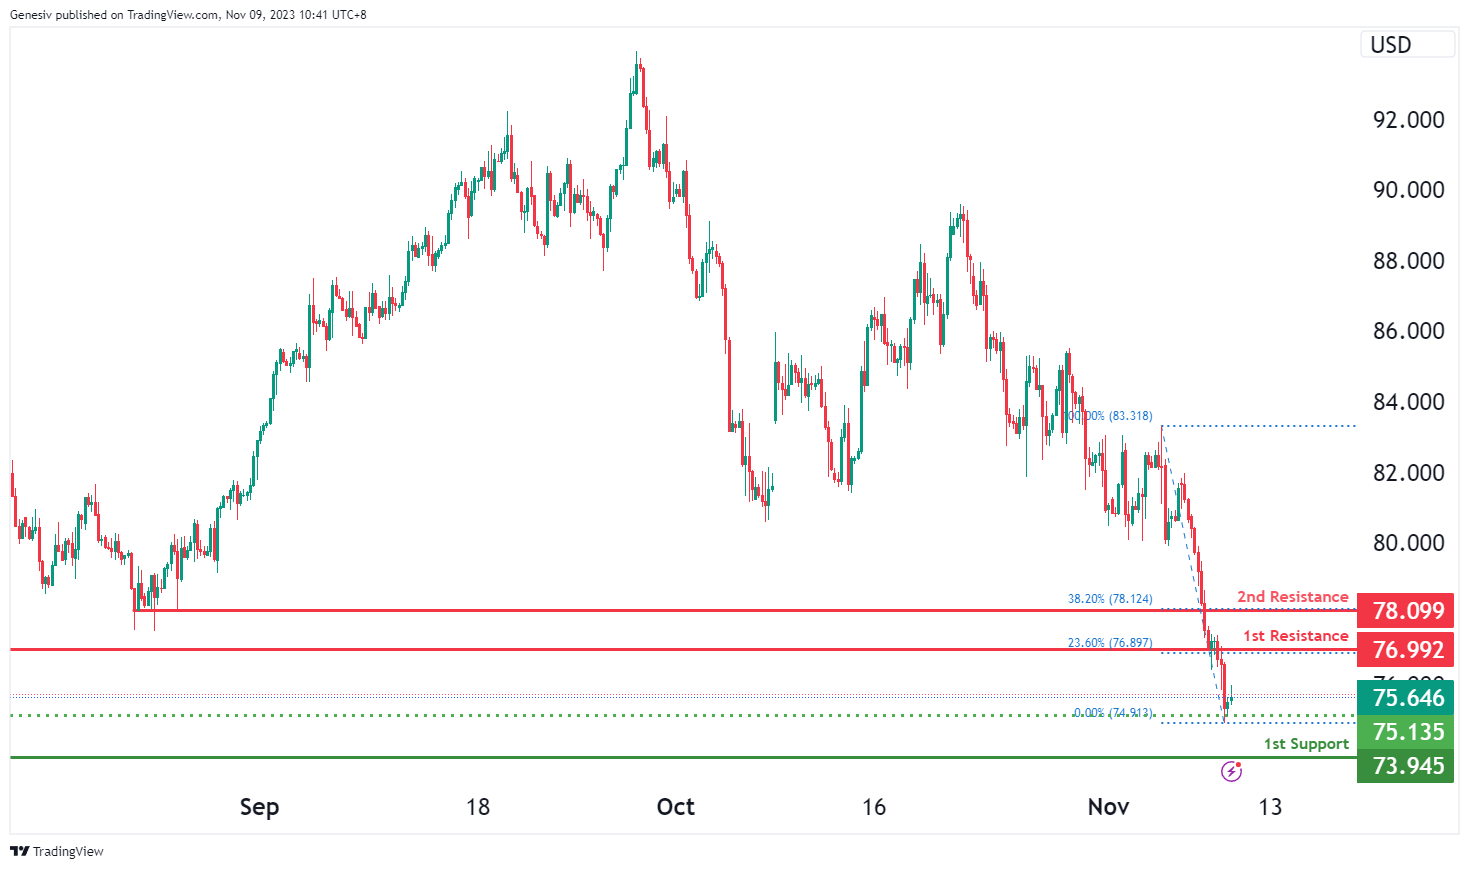
WTI/USD:
The WTI (West Texas Intermediate) chart currently demonstrates an overall bearish momentum. However, there is potential for price to rise towards the 1st resistance before making a bearish reaction and dropping towards the 1st support.
The 1st resistance level at 76.99 is identified as a pullback resistance that aligns with the 23.60% Fibonacci retracement level. Higher up, the 2nd resistance level at 78.09 is also noted a pullback resistance that aligns with the 38.20% Fibonacci retracement level, indicating another potential area where price could face resistance.
To the downside, the intermediate support level at 75.14 is identified as a pullback support. Further below, the 1st support level at 73.95 is marked as a swing-low support, potentially acting as a strong support zone.
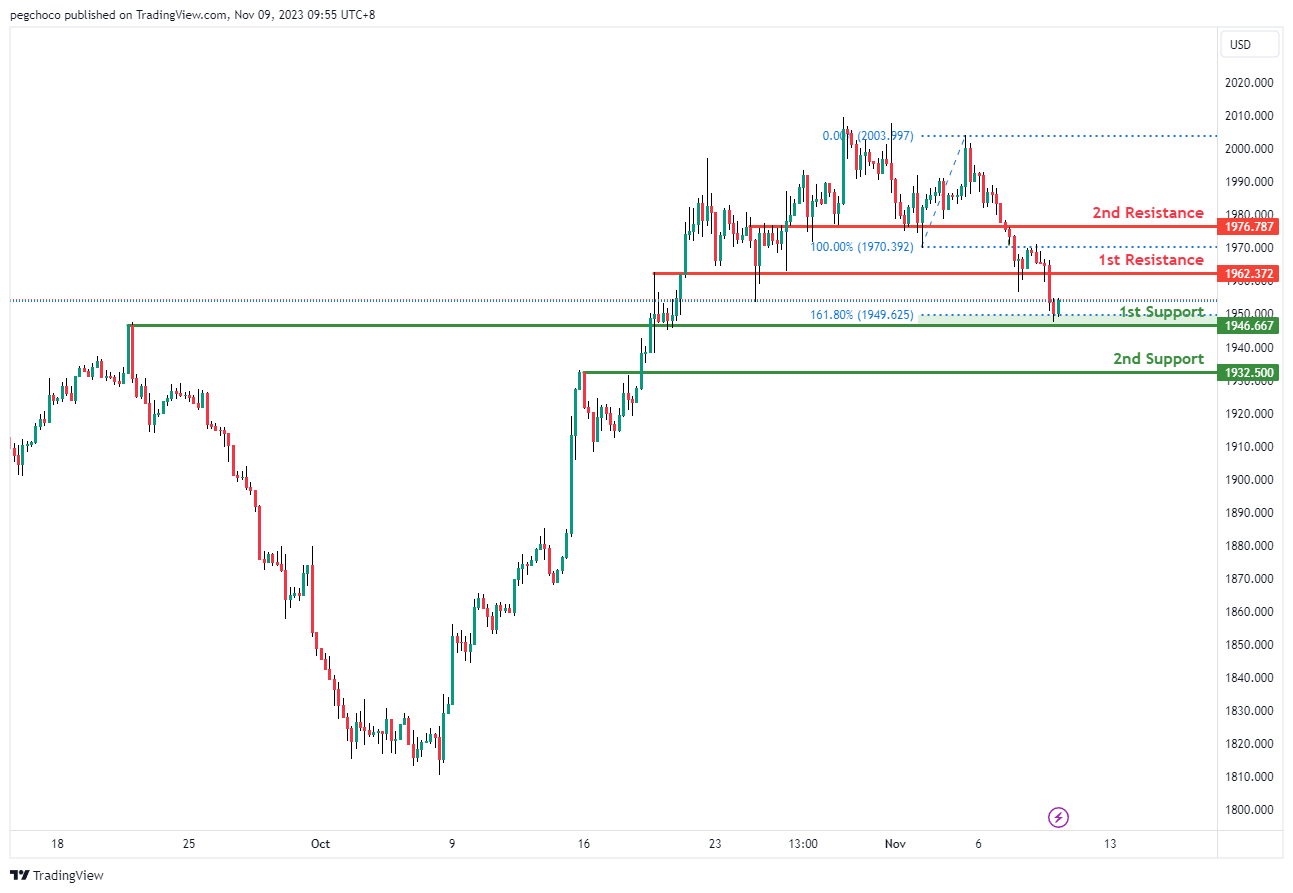
XAU/USD (GOLD):
The XAU/USD chart currently exhibits a bullish overall momentum, indicating the potential for a bullish continuation towards the 1st resistance level.
The 1st support at 1946.66 is identified as an overlap support, and it also aligns with the 161.80% Fibonacci Extension level. This confluence of support factors makes it a significant level where buyers may find interest, potentially providing a strong foundation for the price to bounce from.
The 2nd support at 1932.50 is considered a pullback support, reinforcing the potential support zone for XAU/USD.
On the resistance side, the 1st resistance at 1962.37 is categorized as a pullback resistance, suggesting it could act as a level where the price may face selling pressure as it attempts to move higher.
The 2nd resistance at 1976.78 is also noted as a pullback resistance, adding to the potential areas where the price might find resistance in its bullish journey.
BoC minutes reflect division on path forward for interest rate
The latest deliberations within BoC have revealed a divide among officials over the course of monetary policy, as they confront the challenge of reigning in inflation without further rate hikes. At the heart of the debate is whether the current 5.00% policy rate will suffice in guiding inflation back to the targeted 2%.
The minutes from the October 25 meeting, where BoC maintained the interest rate, reflect this uncertainty. A faction within the bank is leaning towards additional tightening measures. "Some members felt that it was more likely than not that the policy rate would need to increase further to return inflation to target," the minutes read, highlighting concerns that the current policy stance may not be enough to temper rising prices.
On the flip side, there is a sense of cautious optimism among other members, who believe that maintaining the current rate might achieve the desired effect over time. "Others viewed the most likely scenario as one where a five per cent policy rate would be sufficient to get inflation back to the two per cent target, provided it was maintained at that level for long enough," the minutes elaborated.
This divergence in views has culminated in a consensus to adopt a "patient" approach, reflecting a strategy of watchful waiting while assessing incoming data. "They agreed to revisit the need for a higher policy rate at future decisions with the benefit of more information," according to the documented discussions.
GBPAUD Wave Analysis
- GBPAUD reversed from support level 1.8945
- Likely to rise to resistance level 1.9325
GBPAUD currency pair recently reversed up from the pivotal support level 1.8945 (which has been reversing the pair from the start of July) coinciding with the lower daily Bollinger Band.
The upward reversal from the support level 1.8945 started the active intermediate impulse wave (3).
Given the strength of the active daily uptrend, GBPAUD can be expected to rise further toward the next resistance level 1.9325 (top of the previous impulse wave (1)).
EURJPY Wave Analysis
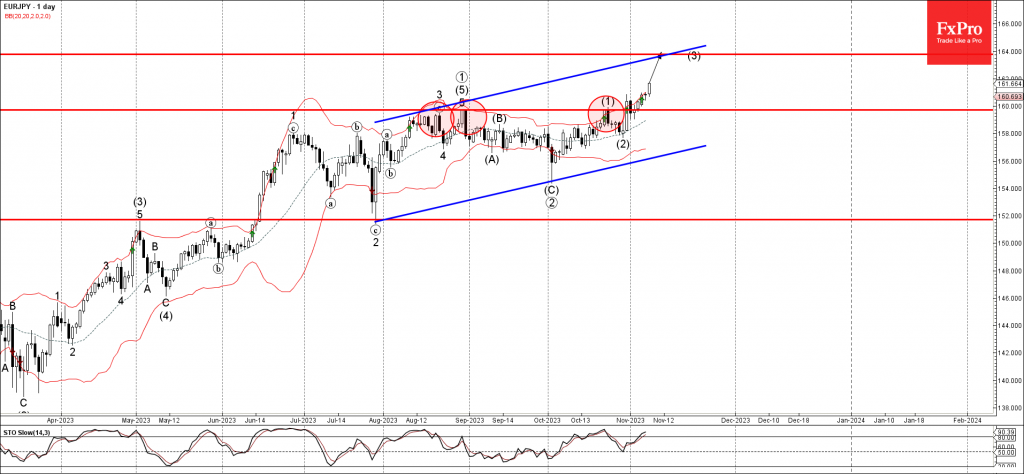
- EURJPY broke key resistance level 160.00
- Likely to rise to resistance level 164.00
EURJPY currency pair earlier broke above the key resistance level 160.00 (which has been reversing the pair from the middle of August).
The breakout of the resistance level 160.00 accelerated the active intermediate impulse wave (3).
Given the strength of the active daily uptrend and the impulse wave (3), EURJPY can be expected to rise further toward the next resistance level 164.00 (top of the active daily up channel).
Dollar Facing Headwinds, Swiss Franc Rebounding
Dollar making efforts to continue this week's rebound, but momentum appears to be lacking, except against Yen. Additionally, its ascent is being challenged by Swiss Franc, which currently stands as the day's strongest performer, propelled by substantial buying against Euro and Sterling. Commodity currencies are capitalizing on the stabilizing risk sentiment, slowly clawing back against Dollar's advances.
Investors are now turning their attention to the forthcoming comments from Fed officials, including Chair Jerome Powell and New York Fed President John Williams. Although Fed funds futures suggest only a modest 10% probability of a rate increase in December, the door remains open, and traders are eager for any hints about the leanings of each Fed member.
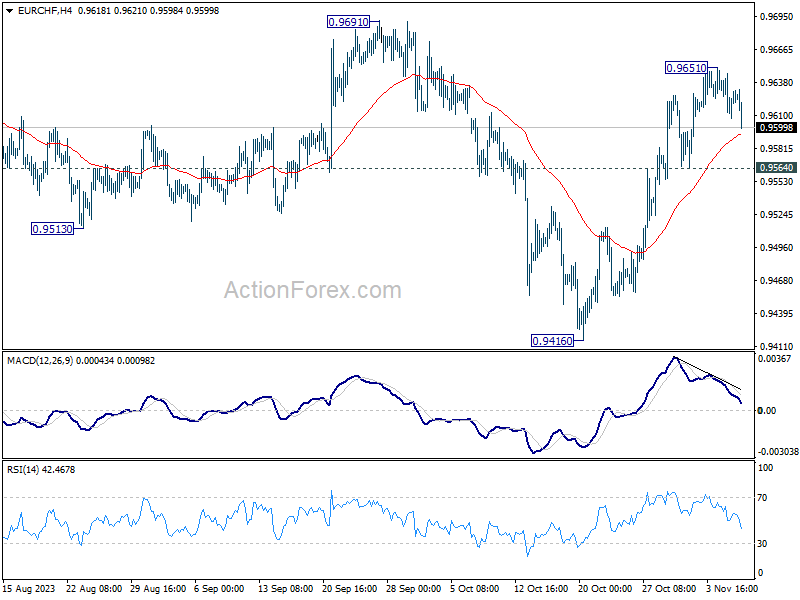
Technically, EUR/CHF's retreat from 0.9651 is extending today. The first line of defense is on 55 4H EMA (now at 0.9593). Ideally, selling should slow below the EMA, and gradually, a base is build at around 0.9564 support for resuming the rally from 0.9416. However, firm break of 0.9564 will argue that the rally is indeed over, and risk deeper fall. In the bearish case, extended selloff in EUR/CHF could drag EUR/USD down through 55 4H EMA too.
In Europe, at the time of writing, FTSE is up 0.05%. DAX is up 0.15%. CAC is up 0.30%. Germany 10-year yield is down -0.022 at 2.643. Earlier in Asia, Nikkei dropped -0.33%. Hong Kong HSI dropped -0.58%. China Shanghai SSE dropped -0.16%. Singapore Strait Times dropped -1.39%. Japan 10-year JGB yield fell -0.0276 to 0.849.
ECB's Lane: Some progress on underlying inflation, but not enough
ECB Chief Economist Philip Lane indicated that although there is "some progress" in mitigating underlying inflationary, he is not fully convinced of the sufficiency of these efforts to date.
"This is why we are in this period now of holding interest rates at a significantly high level until this process makes further progress," Lane explained,
Lane also conveyed his reservations about the steep decline in headline inflation numbers, attributing the fall primarily to the base effect from last year's energy price surges.
Looking ahead, Lane projected that the descent in inflation rates might pause, with inflation likely hovering in the "high twos or low threes" range in 2024.
He anticipates that a reversion to the ECB's desired 2% inflation target would not materialize until 2025, suggesting a prolonged journey ahead for the central bank in its fight against persistent inflation.
Bundesbank's Nagel stresses final push to inflation target as toughest hurdle
Bundesbank President Joachim Nagel likened the journey toward ECB's inflation target to an arduous "last mile," which "may well be the hardest".
Nagel pointed out that a key strategy for businesses would involve absorbing recent wage hikes—a move that will necessitate accepting slimmer profit margins.
On the other side, he emphasized the necessity of a more restrained fiscal approach from governments.
While wage increases are anticipated to exert some pressure on pricing, Nagel reassured that currently, there's no sign of a "self-reinforcing spiral" in wage-price dynamics. This suggests a cautious optimism that, while the path forward is steep, runaway inflation is not an imminent threat.
ECB Kazaks advocates for certainty over inflation before rate cut
ECB Governing Council member Martins Kazaks has expressed a steadfast stance on interest rates, emphasizing the need for absolute certainty that inflation is under control before considering any reductions.
Kazaks highlighted, "This decision right now to keep rates at current levels is to be really convinced inflation won't rise again."
"We have to be convinced that inflation has been beaten — then we can step by step lower rates," he articulated, pointing out the distinction between short-term suppression of inflation rates and the long-term confidence required to ensure they do not resurge.
Kazaks further clarified, "One thing is to push inflation lower; another is to be convinced inflation won't rise again."
Thus, "that's why there's this cautiousness."
ECB survey reveals heightened short-term inflation expectations and economic pessimism
ECB's latest Consumer Expectations Survey has provided a snapshot of the current economic mood, characterized a heightened anticipation of inflation pressures in the near term juxtaposed with a more pessimistic outlook on economic growth.
The survey results for September show a discernible uptick in median consumer inflation expectations for the coming year, escalating from 3.5% to 4.0%. However, that consumers' median inflation expectations over a three-year horizon held steady at 2.5%.
Contrastingly, the survey indicates no change in the mean expectations for nominal income growth, which remains anchored at 1.2%. This static view on income growth, coupled with the slight increase in anticipated nominal spending growth from 3.3% to 3.4%, hints at a potential squeeze on real consumer spending power.
The more negative tilt in expectations for economic growth, which have slipped from -0.8% to -1.2%, reflects an escalating concern over the economic direction. Furthermore, the anticipated unemployment rate has edged up from 11.1% to 11.4% for the coming year.
Eurozone retail sales down -0.3% mom in Sep, EU fell -0.2% mom
Eurozone retail sales volume fell -0.3% mom in September, worst than expectation of -0.2% mom. Volume of retail trade decreased by -1.9% for non-food products and by -0.9% for automotive fuels, while it increased by 1.4% for food, drinks and tobacco.
EU retail sales volume was down -0.2% mom, Among Member States for which data are available, the largest monthly decreases in the total retail trade volume were registered in Slovakia (-2.0%), Sweden (-1.1%), Germany and the Netherlands (both -0.8%). The highest increases were observed in Slovenia (+1.1%), Poland (+1.0%) and Denmark (+0.9%).
BoJ Ueda suggests easy policy exit could precede real wage gecovery
In an address to the parliament today, BoJ Governor Kazuo Ueda indicated a forward-looking approach to monetary policy, wherein the anticipation of rising real wages could be a determinant for policy normalization, rather than their current state.
Ueda posited, "Real wages would likely have turned positive when a positive wage-inflation cycle kicks off."
Delving into the timing of potential policy shifts, Ueda mentioned, "But in terms of how long we maintain our massive monetary easing... real wages don't necessarily have to turn positive before that decision is made."
Clarifying this point, he further elaborated that "The decision could be made if we can foresee with some certainty that real wages will turn positive ahead."
Ueda also addressed the persistent gap between current inflation rates and the bank's longstanding target, stating, "When looking at trend inflation, there's still some distance towards our 2% target. That is why we are continuing with massive easing."
Short-term inflation fears abate according to RBNZ survey
In the latest RBNZ quarterly Business Survey of Expectations, near-term outlook for inflation has cooled, with one-year-ahead expectations retreating from 4.17% to 3.60%, a significant decline of 57 basis points. On a two-year horizon, the expectation for inflation has seen a marginal dip of 7 basis points to 2.76%.
Conversely, expectations for inflation over a five and ten-year span have inched upwards. The survey revealed a mean five-year-ahead annual inflation expectation of 2.43%, marking an 18 basis points increase from the previous quarter's estimate. Ten-year expectations also saw a modest rise of 6 basis points to 2.28%.
With regard to the Official Cash Rate (OCR), the consensus is that it would hover at 5.50% by the end of December 2023. Looking one year ahead, the mean OCR expectation has fallen to 4.99%, indicating that businesses anticipate a loosening of monetary policy in the future once the immediate inflationary pressures have been mitigated.
On the growth front, respondents to the survey are more bullish. The mean one-year-ahead GDP growth expectation increased to 1.26%, up from 1.02%. The forecast for two-year-ahead GDP growth also saw an uptick, rising to 2.15% from the prior 1.95%.
EUR/USD Mid-Day Outlook
Daily Pivots: (S1) 1.0668; (P) 1.0696; (R1) 1.0727; More...
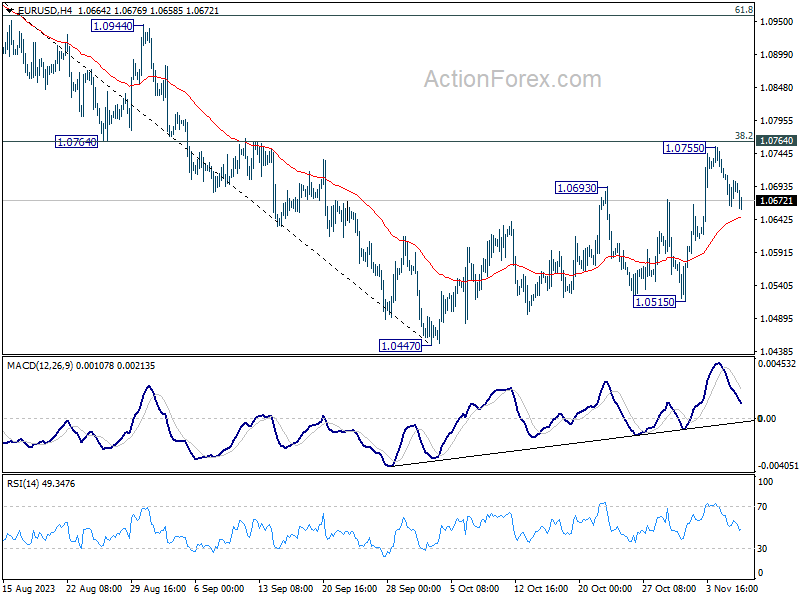
No change in EUR/USD's outlook and intraday bias remains neutral. Further rally is in favor as long as 55 4H EMA (now at 1.0646) holds. Decisive break of 1.0764 cluster resistance (38.2% retracement of 1.1274 to 1.0447 at 1.0763) will extend the rise from 1.0447 to 61.8% retracement at 1.0958 next. However, sustained break of 55 4H EMA will argue that the rebound has completed, and target 1.0515 support, and then 1.0447 low.
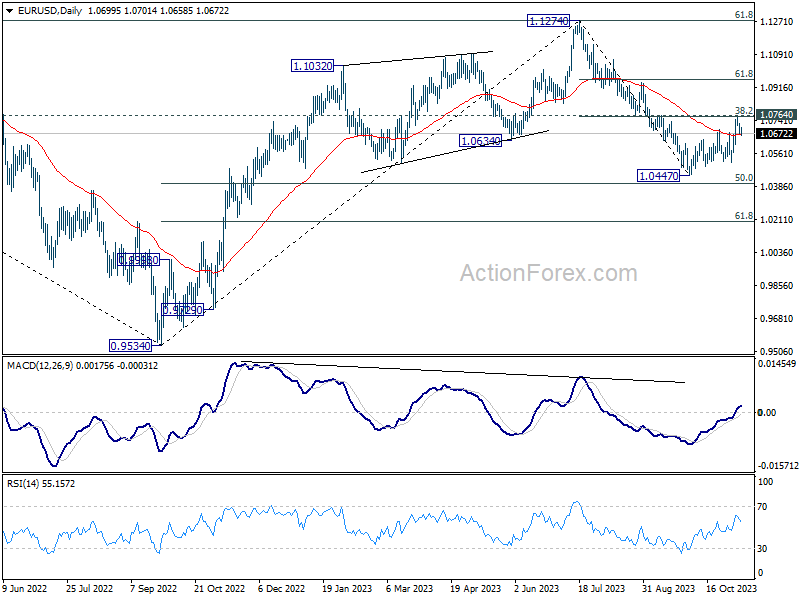
In the bigger picture, price actions from 1.1274 are viewed as a corrective pattern to rise from 0.9534 (2022 low). Rise from 1.0447 is tentatively seen as the second leg. Hence while further rally could be seen, upside should be limited by 1.1274 to bring the third leg of the pattern.
Economic Indicators Update
| GMT | Ccy | Events | Actual | Forecast | Previous | Revised |
|---|---|---|---|---|---|---|
| 02:00 | NZD | RBNZ Inflation Expectations Q4 | 2.76% | 2.83% | ||
| 05:00 | JPY | Leading Economic Index Sep P | 108.7 | 108.8 | 109.2 | |
| 07:00 | EUR | Germany CPI M/M Oct | 0.00% | 0.00% | 0.00% | |
| 07:00 | EUR | Germany CPI Y/Y Oct | 3.80% | 3.80% | 3.80% | |
| 07:45 | EUR | France Trade Balance (EUR) Sep | -8.9B | -8.1B | -8.2B | -8.3B |
| 09:00 | EUR | Italy Retail Sales M/M Sep | -0.30% | -0.20% | -0.40% | -0.70% |
| 10:00 | EUR | Eurozone Retail Sales M/M Sep | -0.30% | -0.20% | -1.20% | |
| 13:30 | CAD | Building Permits M/M Sep | 1.20% | 3.40% | ||
| 15:00 | USD | Wholesale Inventories Sep F | 0.00% | 0.00% |
Bundesbank’s Nagel stresses final push to inflation target as toughest hurdle
Bundesbank President Joachim Nagel likened the journey toward ECB's inflation target to an arduous "last mile," which "may well be the hardest".
Nagel pointed out that a key strategy for businesses would involve absorbing recent wage hikes—a move that will necessitate accepting slimmer profit margins.
On the other side, he emphasized the necessity of a more restrained fiscal approach from governments.
While wage increases are anticipated to exert some pressure on pricing, Nagel reassured that currently, there's no sign of a "self-reinforcing spiral" in wage-price dynamics. This suggests a cautious optimism that, while the path forward is steep, runaway inflation is not an imminent threat.
EUR/USD Mid-Day Outlook
Daily Pivots: (S1) 1.0668; (P) 1.0696; (R1) 1.0727; More...
No change in EUR/USD's outlook and intraday bias remains neutral. Further rally is in favor as long as 55 4H EMA (now at 1.0646) holds. Decisive break of 1.0764 cluster resistance (38.2% retracement of 1.1274 to 1.0447 at 1.0763) will extend the rise from 1.0447 to 61.8% retracement at 1.0958 next. However, sustained break of 55 4H EMA will argue that the rebound has completed, and target 1.0515 support, and then 1.0447 low.
In the bigger picture, price actions from 1.1274 are viewed as a corrective pattern to rise from 0.9534 (2022 low). Rise from 1.0447 is tentatively seen as the second leg. Hence while further rally could be seen, upside should be limited by 1.1274 to bring the third leg of the pattern.