Sample Category Title
USDJPY on the Rise Again, But for How Long?
- USDJPY enters 150 territory again, above SMAs
- Technical signals mixed; 2023 uptrend well intact
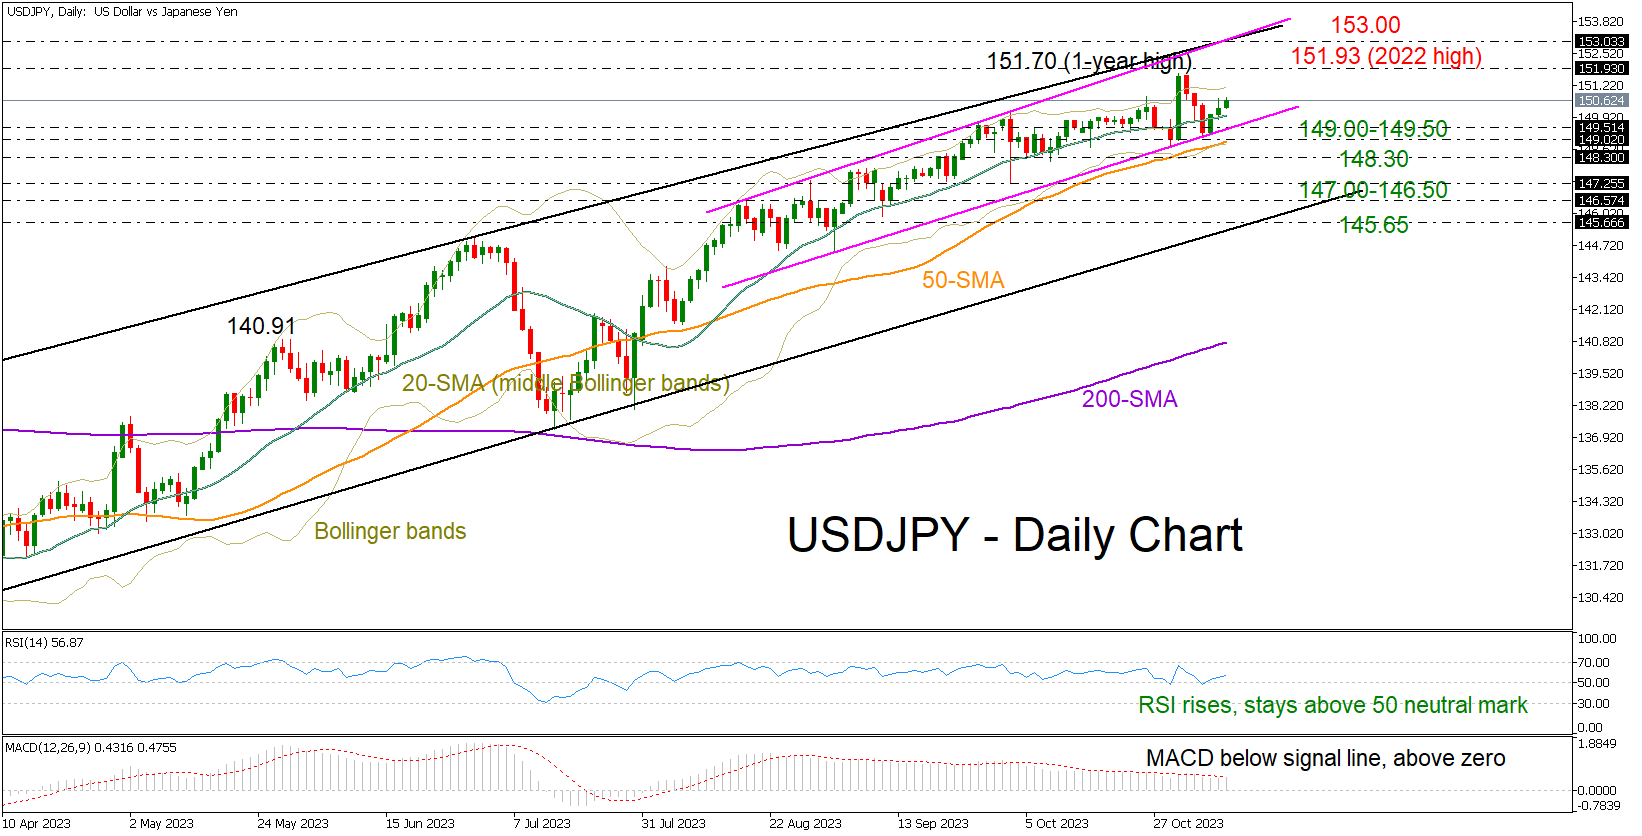
USDJPY is looking to resume its bullish trend ahead of Powell’s speech, having softly pivoted near the 149.30 level at the start of the week.
To attract new buyers, the bulls will have to surpass the nearby resistance of 151.65 and move beyond the 2022 top of 151.93. In this case, the price could pick up steam towards the important resistance trendline area at 153.00. Another successful battle there could see the price jumping into the 155.40-156.60 constraining zone taken from March-June 1990.
However, the mixed technical indicators do not convince traders of the bullish scenario. The narrowing Bollinger bands indicate a potential explosive move but the direction is unclear as the rising RSI has recently escaped a drop below its 50 neutral mark, whereas the MACD keeps lacking power below its red signal line.
Hence, a downside correction could still be possible in the coming sessions. If the pair slumps below the 149.00-149.50 range formed by the short-term ascending trendline from September and the 50-day simple moving average (SMA), it could stabilize near the 148.30 mark. Otherwise, the sell-off could expand towards the 146.55-147.30 territory. Yet only a clear close below the lower boundary of the broad bullish channel at 145.65 would disappoint medium-term traders.
Summing up, USDJPY has not eliminated downside risks yet, despite marking a positive week. To boost buying confidence, the pair will need to crawl above 151.93, and more importantly, strengthen its uptrend above 153.00. In such a case, though, it is worth considering that a sharp depreciation in the yen could prompt another round of FX intervention by Japanese authorities.
Oil Prices Fall to Lowest Level since July
As the chart shows, the price of WTI oil has dropped below USD 77.50 – the last time prices were this high was in mid-July.
The decline in oil prices was contributed to by:
- first, easing concerns about the escalation of the military conflict in the Middle East and interruptions in the supply of oil produced in the region;
- secondly, the data from Beijing. While China's crude oil imports rose in volume and value in October, the country's total exports fell 6.4% year on year, more than expected, CNBC reports. This points to a slowdown in demand in a world where central banks in many countries are keeping interest rates high to combat inflation.
Thus, supply forces prevail despite the fact that Russia and Saudi Arabia announced continued restrictions on oil production amid the conflict in the Middle East.
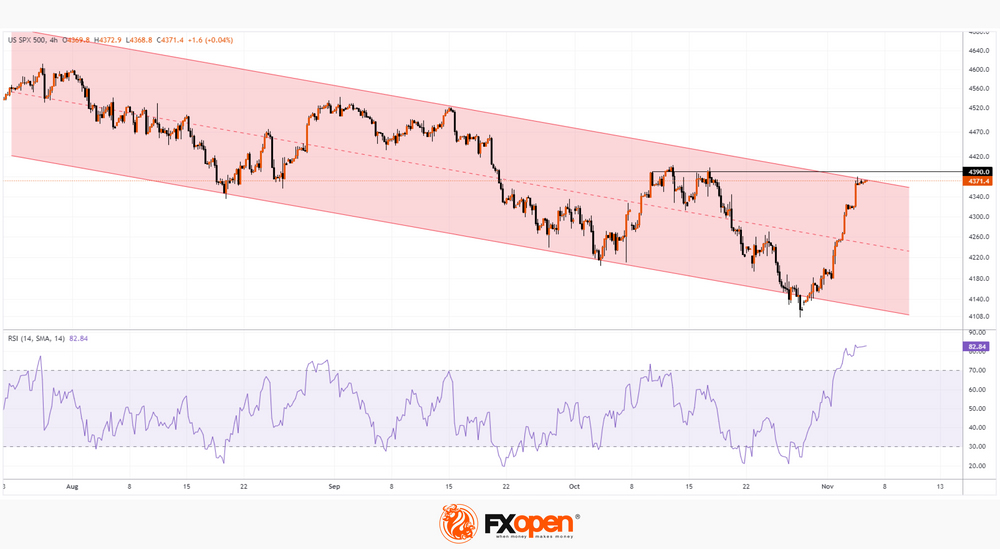
The oil price chart today shows that:
- the market is oversold, judging by the RSI indicator;
- the price is near the lower border of the downward channel.
Therefore, the market is vulnerable to some price recovery from the oversold zone. If this happens, the price will form a false breakout of the August lows and could then test the USD 80.00 level. It is possible that this psychological level, which provided support on November 1-3 after yesterday's bearish breakout, will act as resistance — similar to what happened with the USD 82.50 level.
This article represents the opinion of the Companies operating under the FXOpen brand only. It is not to be construed as an offer, solicitation, or recommendation with respect to products and services provided by the Companies operating under the FXOpen brand, nor is it to be considered financial advice.
ECB Kazaks advocates for certainty over inflation before rate cut
ECB Governing Council member Martins Kazaks has expressed a steadfast stance on interest rates, emphasizing the need for absolute certainty that inflation is under control before considering any reductions.
Kazaks highlighted, "This decision right now to keep rates at current levels is to be really convinced inflation won't rise again."
"We have to be convinced that inflation has been beaten — then we can step by step lower rates," he articulated, pointing out the distinction between short-term suppression of inflation rates and the long-term confidence required to ensure they do not resurge.
Kazaks further clarified, "One thing is to push inflation lower; another is to be convinced inflation won't rise again."
Thus, "that's why there's this cautiousness."
GBP/JPY Daily Outlook
Daily Pivots: (S1) 184.63; (P) 185.05; (R1) 185.44; More...
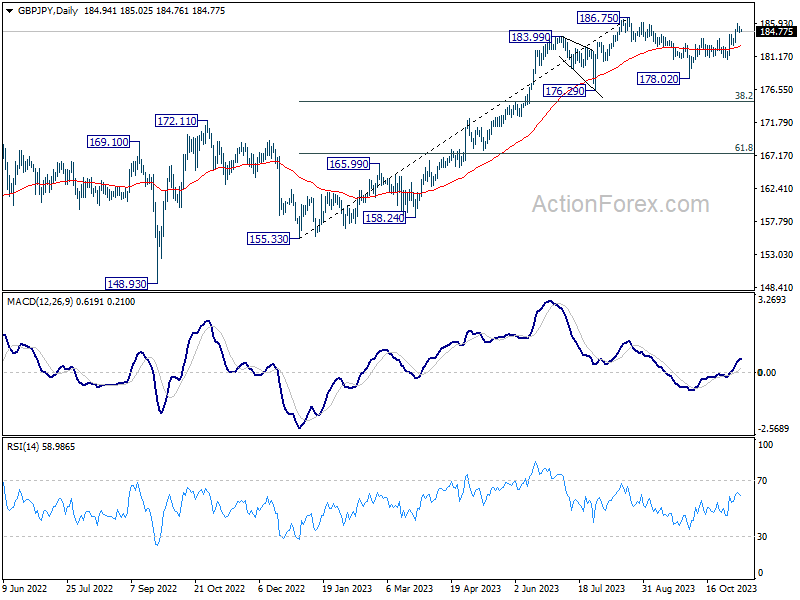
A temporary top is in place at 185.94 and intraday bias in GBP/JPY is turned neutral first. Further rally is expected as long as 182.71 support holds. Above 185.94 will resume the rebound from 178.02 to retest 186.76 resistance first. Decisive break there will resume larger up trend.
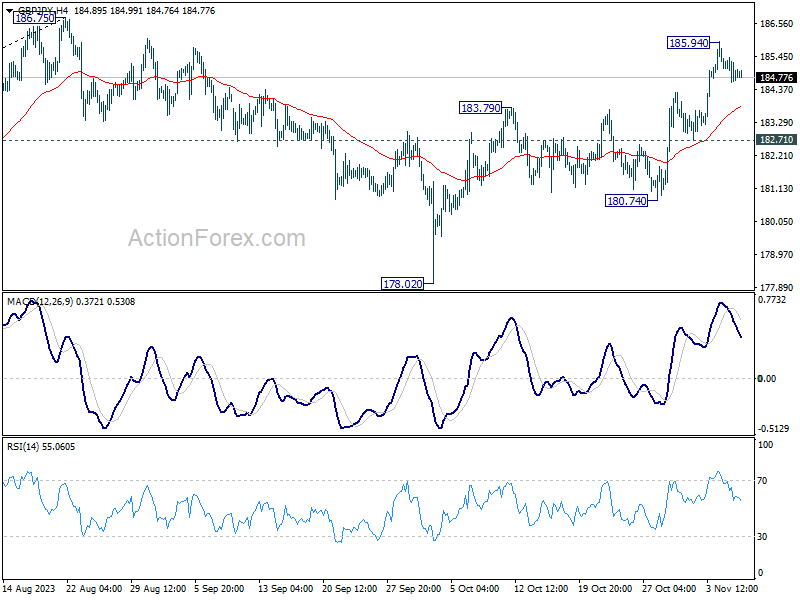
In the bigger picture, as long as 176.29 support holds, larger up trend from 123.94 (202 low) should still be in progress. Break of 186.75 will target 195.86 (2015 high). Nevertheless, firm break of 176.29 will confirm medium term topping, and bring lengthier and deeper consolidations.
EUR/JPY Daily Outlook
Daily Pivots: (S1) 160.58; (P) 160.81; (R1) 161.18; More....
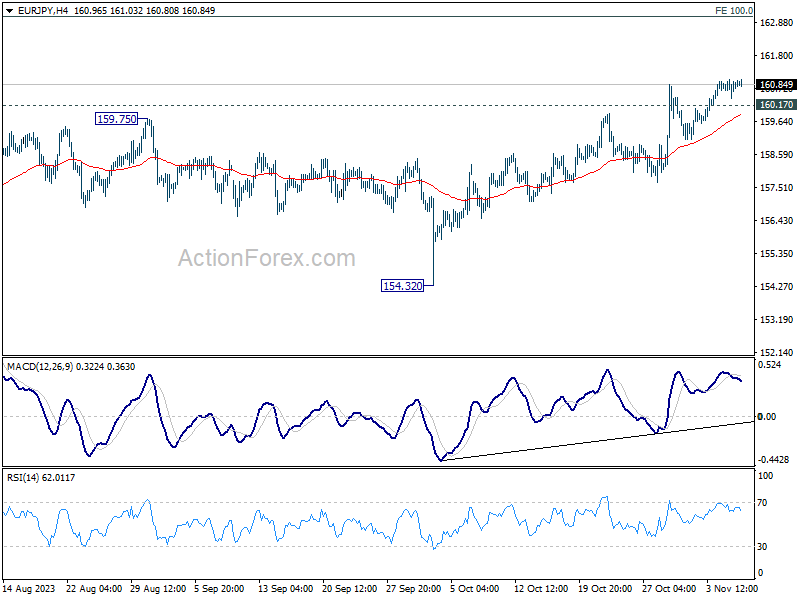
Despite some loss of upside momentum as seen in 4H MACD, intraday bias in EUR/JPY remains on the upside with 160.17 minor support intact. Current rally should extend to 163.06 projection level next. On the downside, however, break of 160.17 minor support will turn intraday bias neutral and bring consolidations first, before staging another rise.
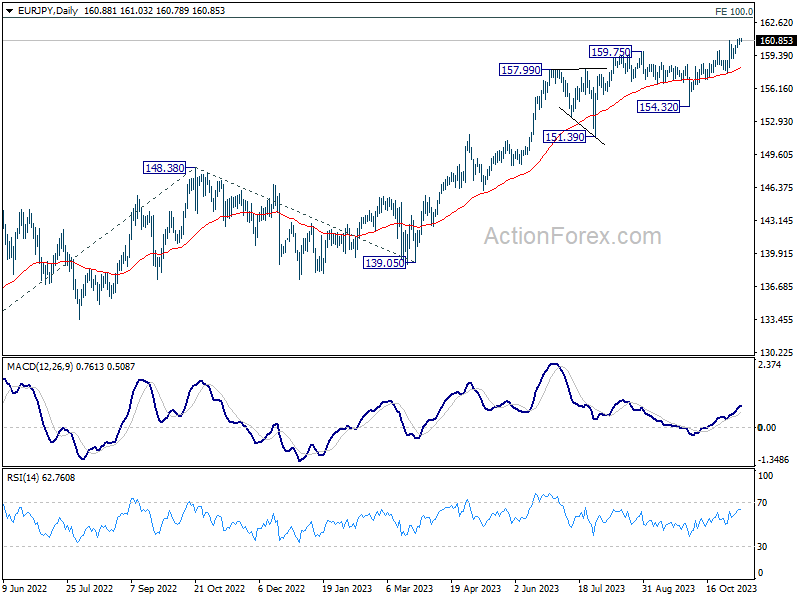
In the bigger picture, rise from 114.42 (2020 low) is in progress. Next target is 100% projection of 124.37 to 148.38 from 139.05 at 163.06. On the downside, break of 154.32 support is needed to be the first sign of medium term topping. Otherwise, outlook will remain bullish even in case of deep pullback.
EUR/GBP Daily Outlook
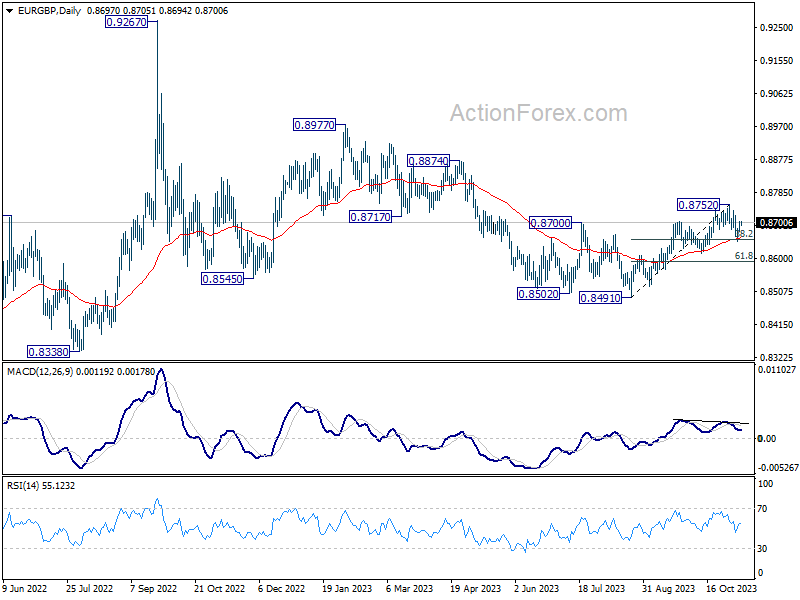
Daily Pivots: (S1) 0.8683; (P) 0.8694; (R1) 0.8709; More....
Intraday bias in EUR/GBP remains neutral at this point. Pull back from 0.8752 could still extend lower, but downside should be contained by 0.8614 support to bring rebound. Break of 0.8752 resistance to resume the rally from 0.8491 is expected at a later stage.
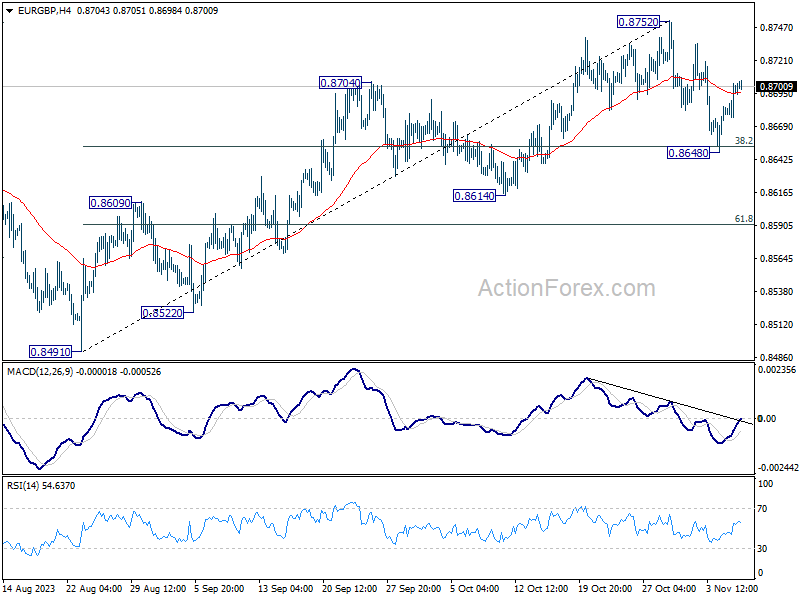
In the bigger picture, current development suggests that whole down trend from 0.9267 (2022 high) has completed with three down to to 0.8491. Rise from 0.8491 is seen as another leg inside that pattern from 0.9499 (2020 high). Further rally should be seen to 0.8977 resistance and above. This will remain the favored case as long as 0.8614 support holds.
EUR/AUD Daily Outlook
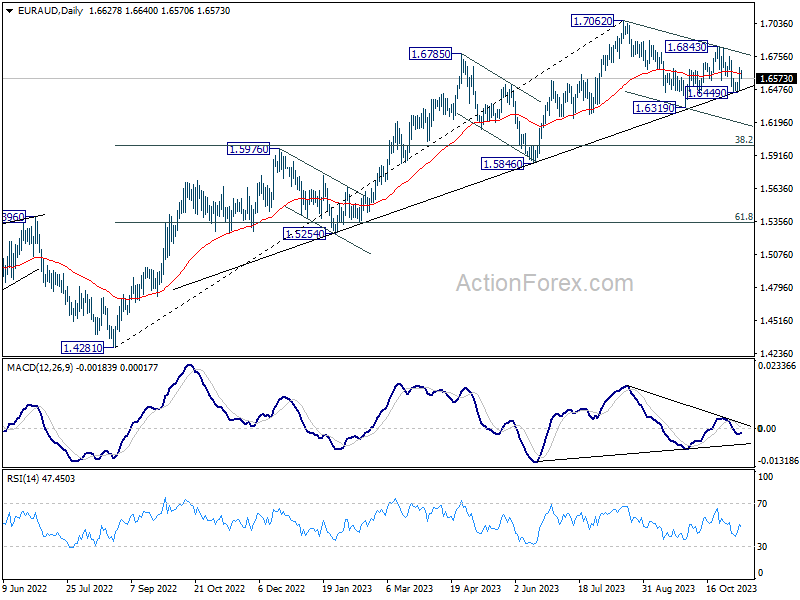
Daily Pivots: (S1) 1.6512; (P) 1.6589; (R1) 1.6700; More...
Intraday bias in EUR/AUD remains neutral at this point. On the downside, break of 1.6449 will target 1.6319 support first. Firm break there will resume the whole decline from 1.7062. However, above 1.6843 will resume the rebound from 1.6319 towards 1.7062 resistance instead.
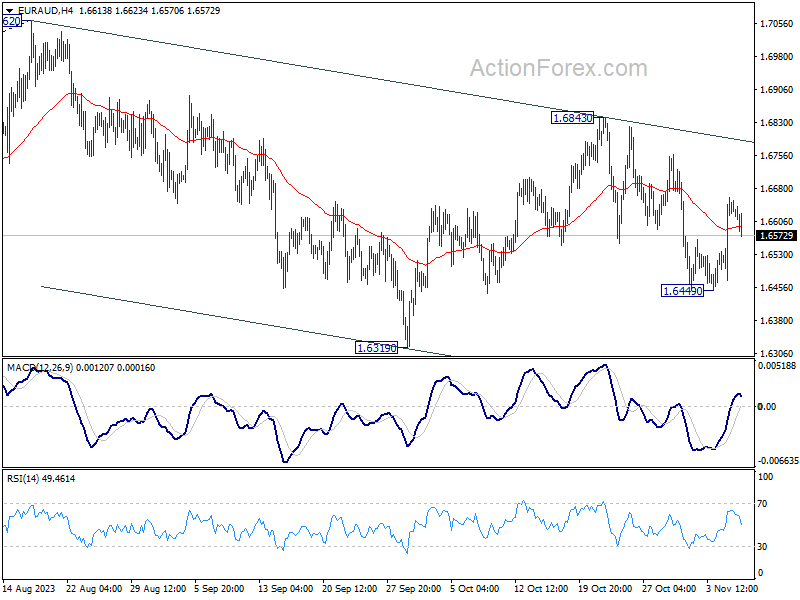
In the bigger picture, current development suggests that 1.7062 is already a medium term top. Fall from there is seen as a correction to the up trend from 1.4281 (2022 low). While deeper decline might be seen, strong support should emerge from 38.2% retracement of 1.4281 to 1.7062 at 1.6000 to contain downside. However, sustained break of 1.6000 will raise the chance of bearish tend reversal.
EUR/CHF Daily Outlook
Daily Pivots: (S1) 0.9612; (P) 0.9630; (R1) 0.9650; More...
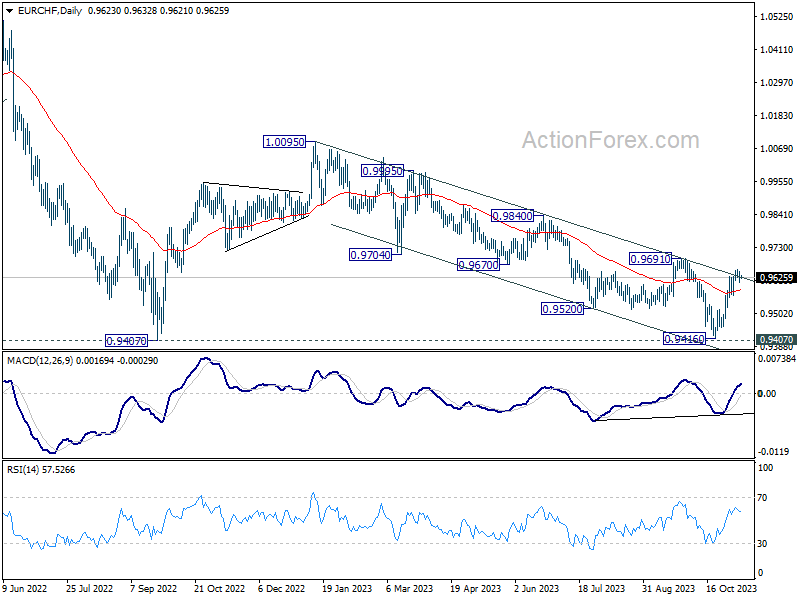
Intraday bias in EUR/CHF is turned neutral first with current retreat. Further rally is in favor as long as 0.9564 minor support holds. Above 0.9651 will resume the rebound form 0.9416 to 0.9691 resistance first. Firm break there will argue that whole decline from 1.0095 has completed at 0.9416, just ahead of 0.9407 support (2022 low). Nevertheless, break of 0.9564 will turn bias back to the downside for deeper fall.
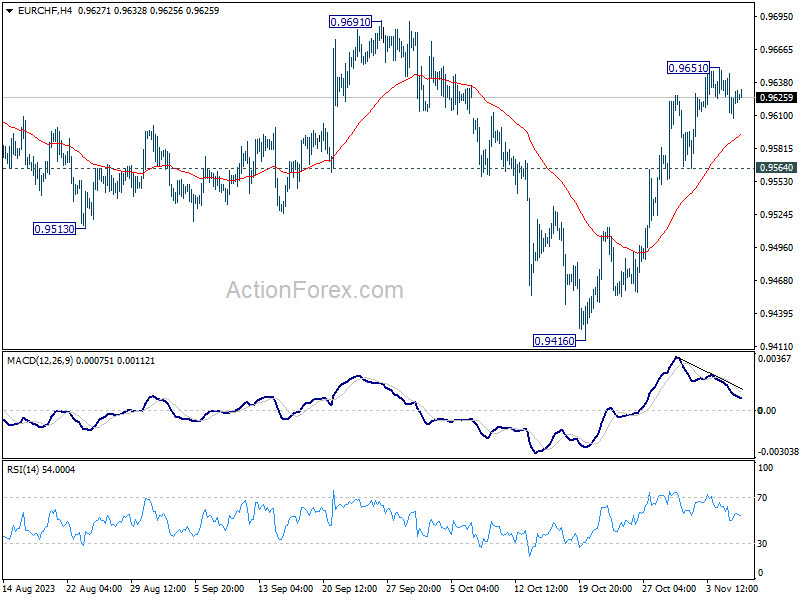
In the bigger picture, as long as 1.0095 resistance holds, price actions from 0.9407 are viewed as a three-wave consolidation pattern first. Current rise from 0.9416 might be the third leg. That is, larger down trend from 1.2004 (2018 high) might still resume through 0.9407 at a later stage. However, decisive break of 1.0095 will argue that the long term down trend is reversing.
EUR/USD Daily Outlook
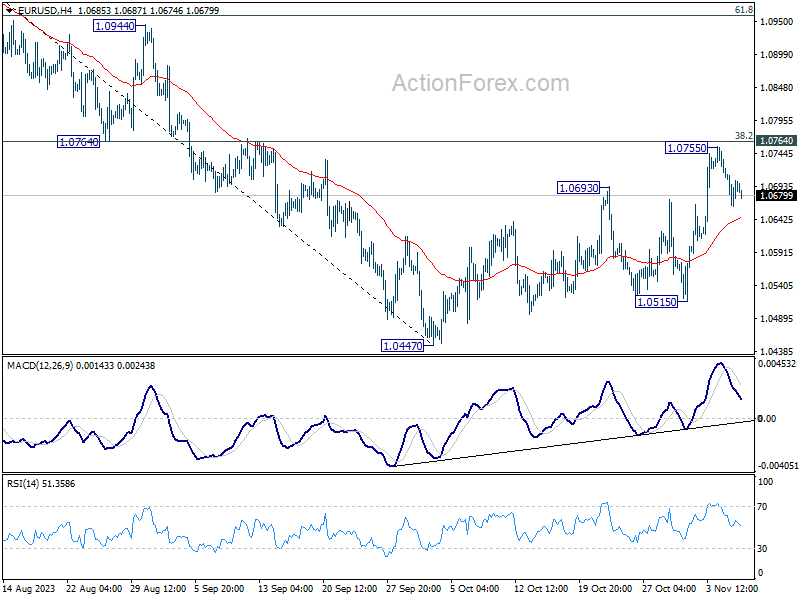
Daily Pivots: (S1) 1.0668; (P) 1.0696; (R1) 1.0727; More...
Intraday bias in EUR/USD remains neutral and outlook is unchanged. Further rally is in favor as long as 55 4H EMA (now at 1.0646) holds. Decisive break of 1.0764 cluster resistance (38.2% retracement of 1.1274 to 1.0447 at 1.0763) will extend the rise from 1.0447 to 61.8% retracement at 1.0958 next. However, sustained break of 55 4H EMA will argue that the rebound has completed, and target 1.0515 support, and then 1.0447 low.
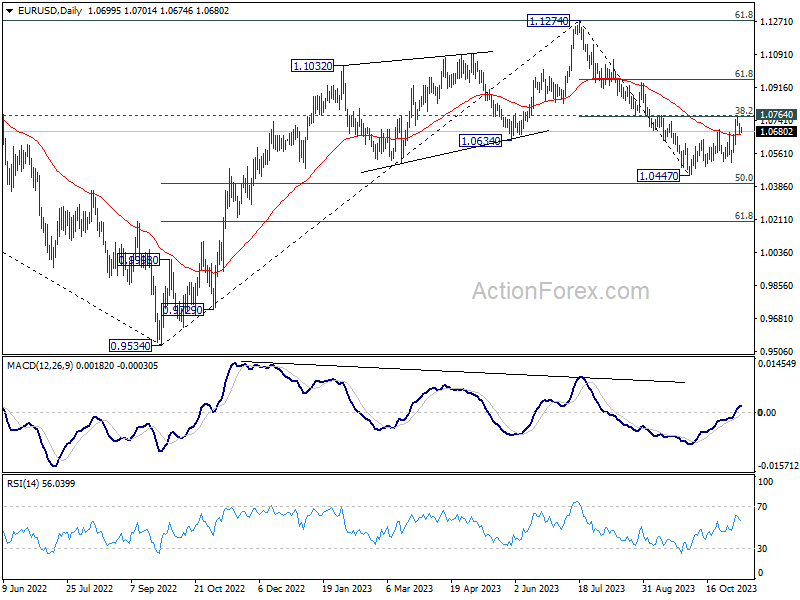
In the bigger picture, price actions from 1.1274 are viewed as a corrective pattern to rise from 0.9534 (2022 low). Rise from 1.0447 is tentatively seen as the second leg. Hence while further rally could be seen, upside should be limited by 1.1274 to bring the third leg of the pattern.
GBP/USD Daily Outlook
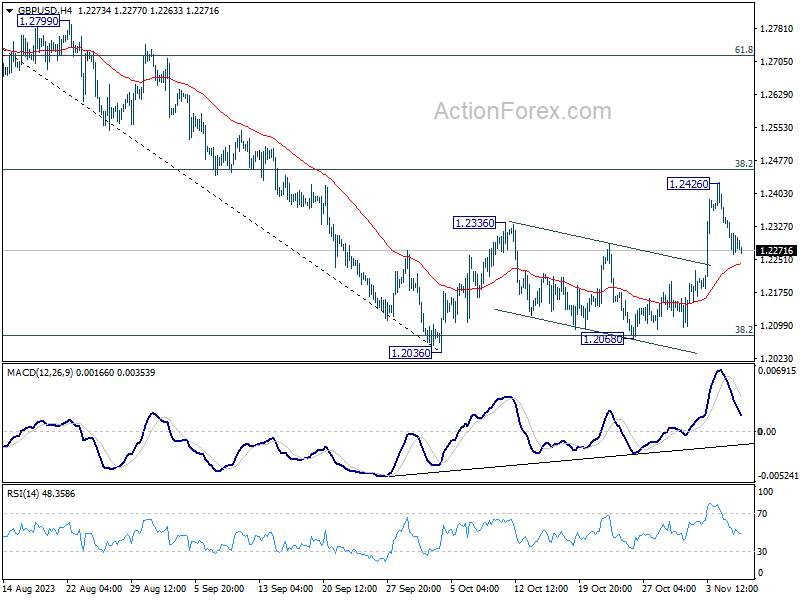
Daily Pivots: (S1) 1.2258; (P) 1.2305; (R1) 1.2348; More
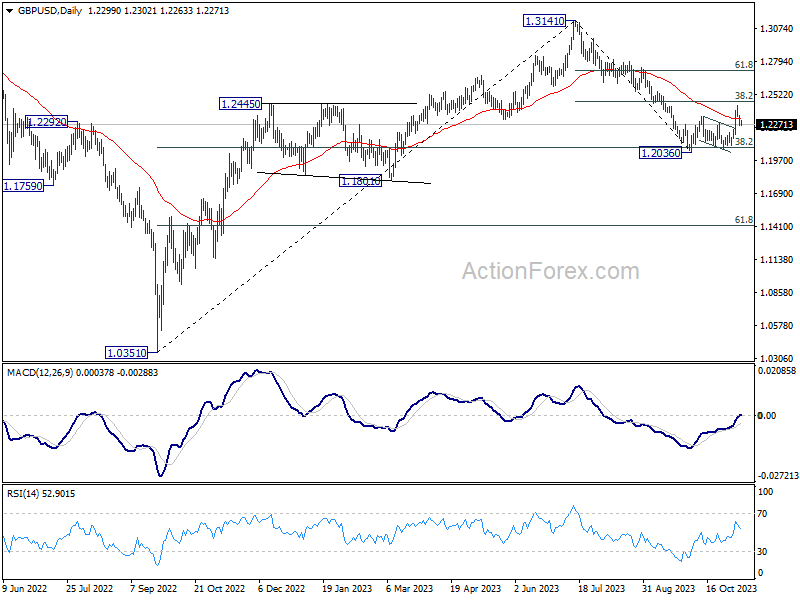
Intraday bias in GBP/USD stays neutral at this point. Further rise is in favor as as long as 4H 55 EMA (now at 1.2239) holds. Decisive break of 38.2% retracement of 1.3141 to 1.2036 at 1.2458 will pave the way to 61.8% retracement at 1.2783. However, sustained break of 4H 55 EMA will revive near term bearishness and bring retest of 1.2036 low.
In the bigger picture, the strong rebound from 38.2% retracement of 1.0351 to 1.3141 at 1.2075 argues that price action from 1.3141 are merely a correction to rise from 1.0351 (2022 low). Current rally from 1.2036 is tentatively seen as the second leg of the pattern. Hence, while further rally is in favor, upside should be limited by 1.3141 to start the third leg.