

Sample Category Title
USD/CHF Daily Outlook
Daily Pivots: (S1) 0.8967; (P) 0.8982; (R1) 0.9010; More....
USD/CHF is staying in range above 0.8952 temporary low and intraday bias remains neutral. On the downside, below 0.8952 will target a test on 0.8886 support first. Break there will resume whole decline from 0.9243 to 0.8815 fibonacci level. However, break of 0.9111 will resume the rebound from 0.8886 instead, and target 0.9243 resistance.
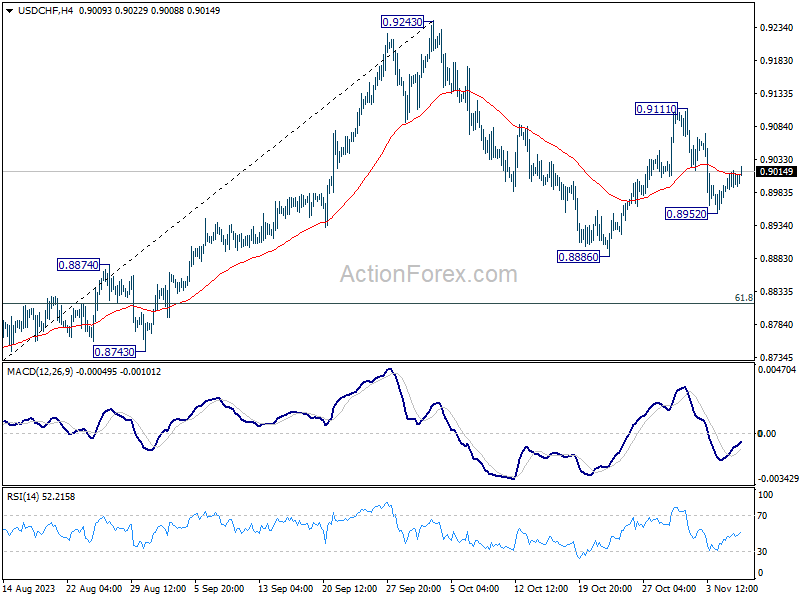
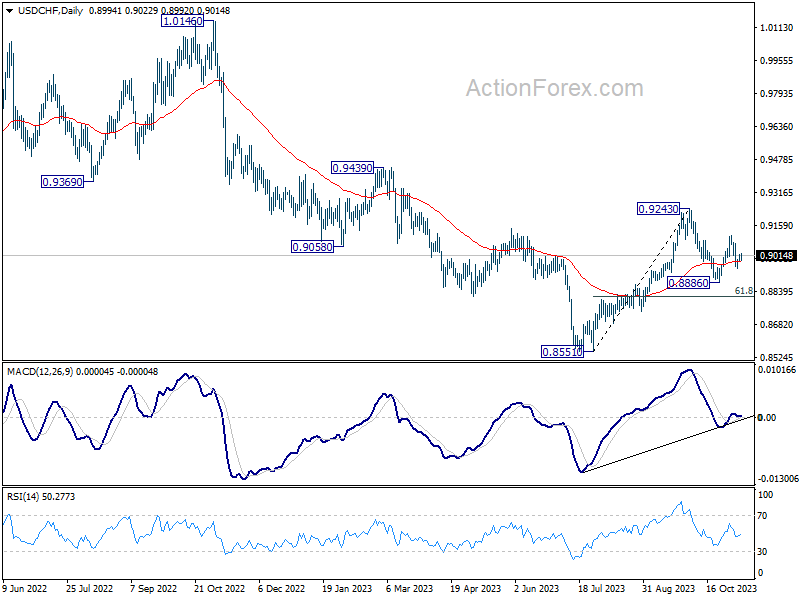
In the bigger picture, outlook is mixed up by the deeper than expected pull back from 0.9243. Yet there was no follow through selling after hitting 0.8886. On the upside, break of 0.9243 resistance will revive the case of medium term bottoming at 0.8851, and turn outlook bullish. However, sustained break of 61.8% retracement of 0.8551 to 0.9243 at 0.8815 will argue that larger decline from 1.0146 is ready to resume through 0.8551 low.
USD/JPY Daily Outlook
Daily Pivots: (S1) 150.01; (P) 150.35; (R1) 150.77; More...
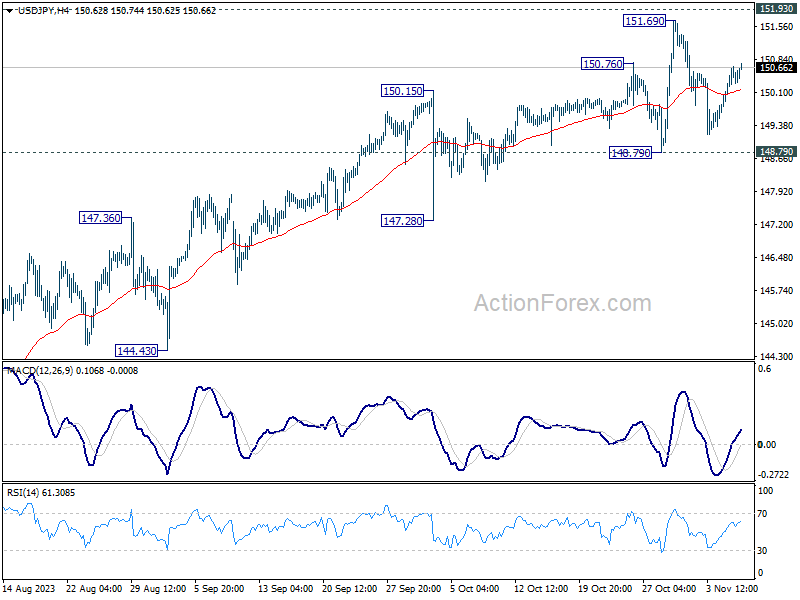
Range trading continues in USD/JPY and intraday bias remains neutral at this point. Further rally is expected as long as 148.79 support holds. Firm break of 151.69 high will resume larger up trend. However, decisive break of 148.79 will indicate rejection by 151.93 key resistance, and bring deeper fall through 147.28 support.
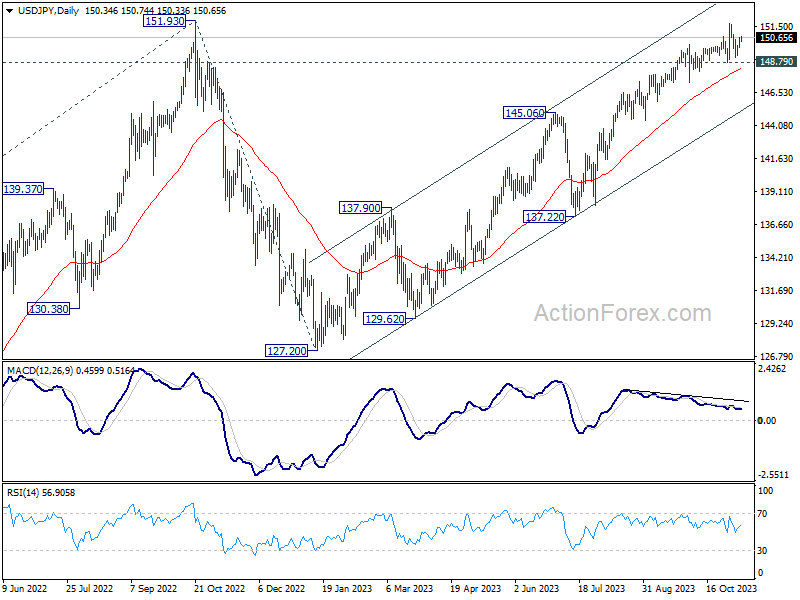
In the bigger picture, immediate focus is on 151.93 resistance (2022 high). Rejection by 151.93, followed by sustained break of 145.06 resistance turned support will argue that rise from 127.20 has completed, and turn outlook bearish for 137.22 support and below. However, sustained break of 151.93 will confirm resumption of long term up trend. Next target will be 61.8% projection of 102.58 to 151.93 from 127.20 at 157.69.
USD/CAD Daily Outlook
Daily Pivots: (S1) 1.3705; (P) 1.3744; (R1) 1.3805; More...
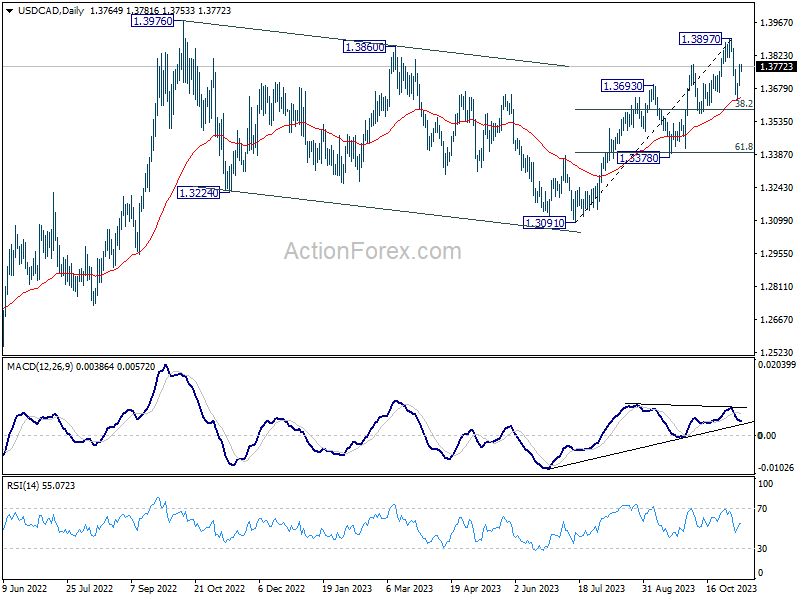
The break of 1.3759 minor resistance argues that pull back from 1.3897 has completed. Intraday bias in USD/CAD is back on the upside for retesting 1.3897 resistance next. In case of another fall, downside should be contained by 38.2% retracement of 1.3091 to 1.3897 at 1.3589 to bring rebound. However, sustained break of 1.3589 will bring deeper fall to 61.8% retracement at 1.3399 instead.
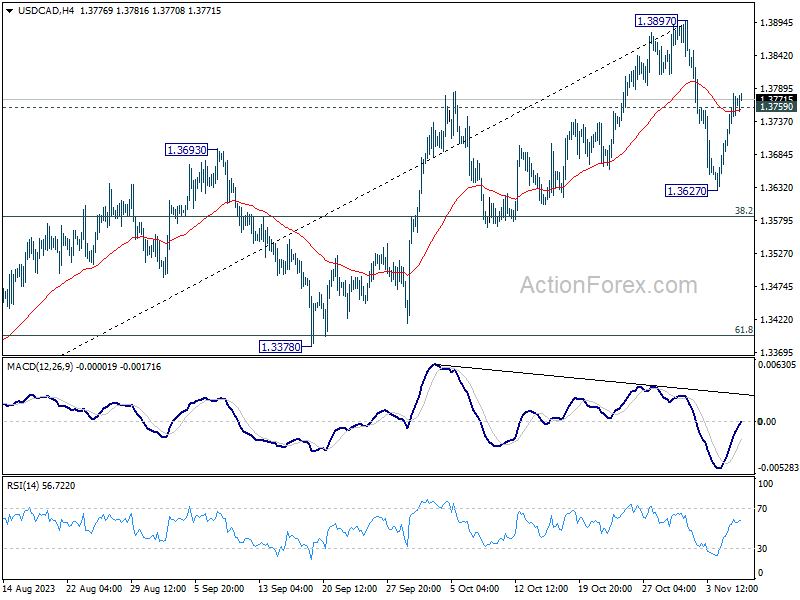
In the bigger picture, corrective pattern from 1.3976 (2022 high) should have completed with three waves down to 1.3091. Decisive break of 1.3976 high will confirm resumption of up trend from 1.2005 (2021 low). This will now remain the favored case as long as 1.3378 support holds. However, firm break of 1.3378 will argue that the pattern from 1.3976 is indeed still extending.
Plenty of ECB, Fed and BoE Governors Will Give Their View
Markets
In a session deprived of key economic data, (bond) markets were still looking for new input/a new equilibrium post last week’s rally. After a setback on Monday, bonds fought back, illustrating the absence of an unequivocal driver. US yields ceded between 1.7 bps (2-y) and 8.3 bps (30-y). Mostly hawkish oriented Fed governors (Bowman, Logan, Kashkari) basically indicated that growth remains strong and that it’s too early to conclude that financial conditions are tight enough to bring inflation back to target, even after the rise in long term yields since mid-July. The comments had little impact on trading. The $ 48 bln 3-y Treasury note auction went well, supporting the bond-friendly intra-day momentum. Even after yesterday’s setback, the US 10-y yield (4.6%) still has some margin left before reaching the key 4.50% support area. The move in European/German bond markets was even more outspoken with German yields declining between 3.9 bps (2-y) and 11.2 bps (30-y). Also here, there was little hard news to explain the move, except for weaker than expected German September production data. Long term German yields now again are nearing key support levels, with especially the 10-y yield testing the 2.685/2.63% area. Maybe the intraday collapse in the oil price was a positive external factor for bonds, illustrating market fears for ongoing soft global demand. Brent oil tumbled from the $85 p/b area to close the session near $81.5 p/b. The contract dropped below the $83.44 early October neckline and fully reversed the rise since the start of the Israel-Hamas conflict. Whether an oil price correction will be enough to change the inflation outlook in a sustainable way remains open to debate, but at least it might create some breathing space short-term. The impact of lower yields and a lower oil price on equities was mixed. Most European equities failed to avoid a negative close (Eurostoxx 50 -0.13%). US indices again outperformed (Nasdaq +0.9%). The dollar tried a further comeback off the post-payrolls correction low, but gains remain modest for now (DXY close 105.54, EUR/USD 1.07, USD/JPY 150.37). EUR/GBP closed again near the 0.87 big figure after gilts’ outperformance as BoE’s Pill didn’t excluded BoE rate cuts mid next year.
This morning, Asian equities fail to join the positive momentum from WS yesterday. US yields are regaining a few bps. The dollar still slightly outperforms (DXY 105.65, EUR/USD 1.0685). There are again hardly any important data, but plenty of ECB, Fed and BoE governors will give their view. The US Treasury will sell $40 bln of 10-y Notes. Most central bankers probably will hold their view. We look out whether BoE’s Bailey will join the soft assessment of its Chief economist. If so, EUR/GBP might weaken further beyond EUR/GBP 0.87. For EUR/USD, the test of the 1.0764/69 area is rejected for now, but the correction lower only develops in a very gradual way.
News & Views
The Financial Times conducted an interview with head of the IMF European department, Kammer, ahead of the publication of the institution’s annual report on Europe’s outlook. One of the topics raised by Kammer is that double-digit wage increases in central and eastern Europe risks eroding the region’s competitiveness with western European countries becoming reluctant to relocate production. Wages are expected to grow at a weighted average of 11% for 2023, slowing to 7% next year and 6% in 2025, according to the IMF outlook. Kammer indicates that these increases are not in line with productivity gains. The IMF’s good advice stretches from reducing budget deficits for governments to postponing policy rate cuts for central bankers. “Rates need to stay high at close to these levels for a considerable time for many of the central banks throughout 2024 in order to achieve their inflation targets in 2025.”
Gold (XAUUSD) Pullback Looking for Support to the Upside
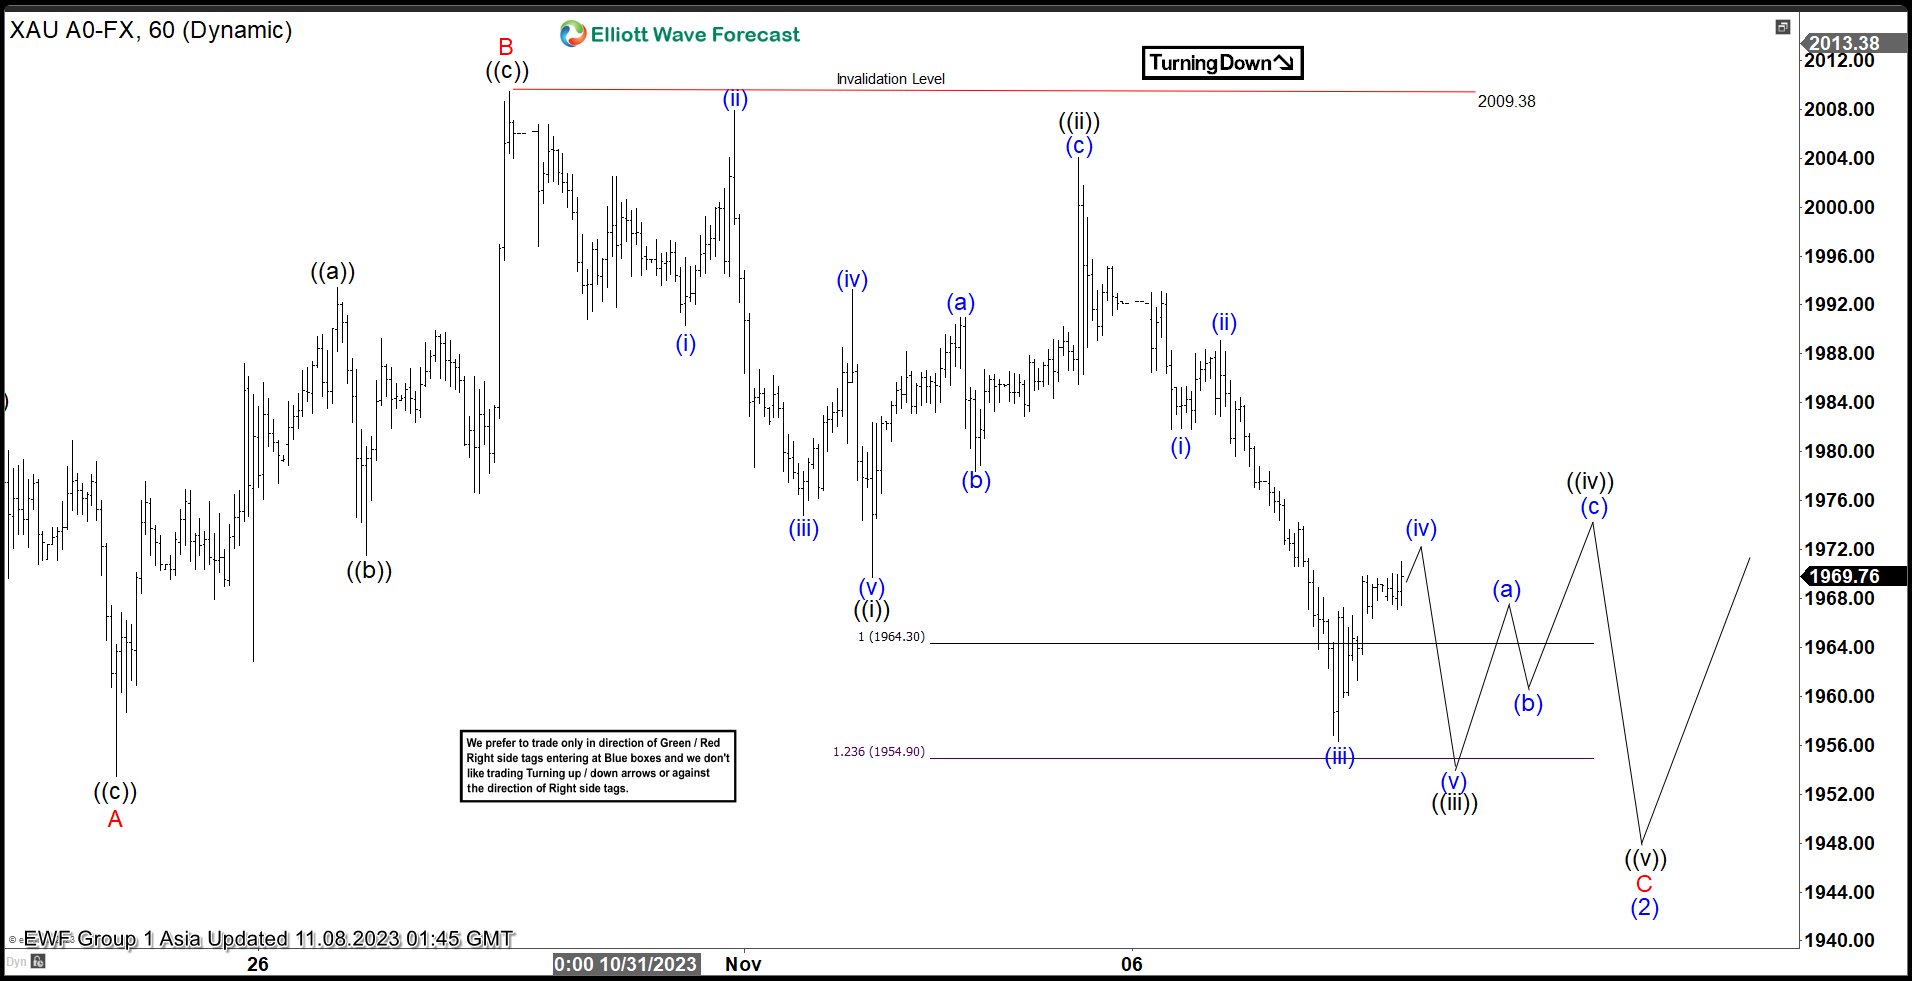
Short Term Elliott Wave in Gold (XAUUSD) suggests that the metal is correcting cycle from 10.6.2023 low. Up from 10.6.2023 low, wave (1) ended at1997.16. Pullback in wave (2) is in progress as an expanded Flat structure. Down from wave (1), wave A ended at 1953.4 and rally in wave B ended at 2009.38. Internal of wave (B) unfolded as a zigzag in lesser degree as the 1 hour chart below shows. Up from wave A, wave ((a)) ended at 1993.44 and pullback in wave ((b)) ended at 1971.50. Final leg wave ((c)) ended at 2009.38 which completed wave B.
Wave C lower is in progress as a 5 waves diagonal. Down from wave B, wave ((i)) ended at 1969.69 and rally in wave ((ii)) ended at 2004.07. The metal may see another leg lower to end wave ((iii)), then it should rally in wave ((iv)) before turning lower again 1 more time in wave ((v)) to end wave C of (2). Near term, as far as pivot at 2009.38 high stays intact, the metal has scope to extend a bit lower. However, in the higher degree, as long as Gold stays above 10.6.2022 low at 1810.58, the current wave (2) pullback should find support in 3, 7, or 11 swing for further upside.
XAUUSD 60 Minutes Elliott Wave Chart
Gold (XAUUSD) Elliott Wave Video
https://www.youtube.com/watch?v=Jd53S7mxjRk
EUR/USD Reclaims 1.0700 While USD/CHF Dips
EUR/USD started a recovery wave above the 1.0700 resistance. USD/CHF declined and now struggling below the 0.9010 resistance.
Important Takeaways for EUR/USD and USD/CHF Analysis Today
- The Euro gained pace after it broke the 1.0635 resistance against the US Dollar.
- There is a major bullish trend line forming with support near 1.0685 on the hourly chart of EUR/USD at FXOpen.
- USD/CHF declined below the 0.9030 and 0.9010 support levels.
- There is a connecting bearish trend line forming with resistance near 0.9010 on the hourly chart at FXOpen.
EUR/USD Technical Analysis
On the hourly chart of EUR/USD at FXOpen, the pair started a recovery wave from the 1.0525 level. The Euro cleared the 1.0635 resistance to move into a short-term bullish zone against the US Dollar.
The bulls pushed the pair above the 50-hour simple moving average and 1.0700. Finally, the pair tested the 1.0750 resistance. It is now correcting gains and trading below the 23.6% Fib retracement level of the upward wave from the 1.0517 swing low to the 1.0756 high.
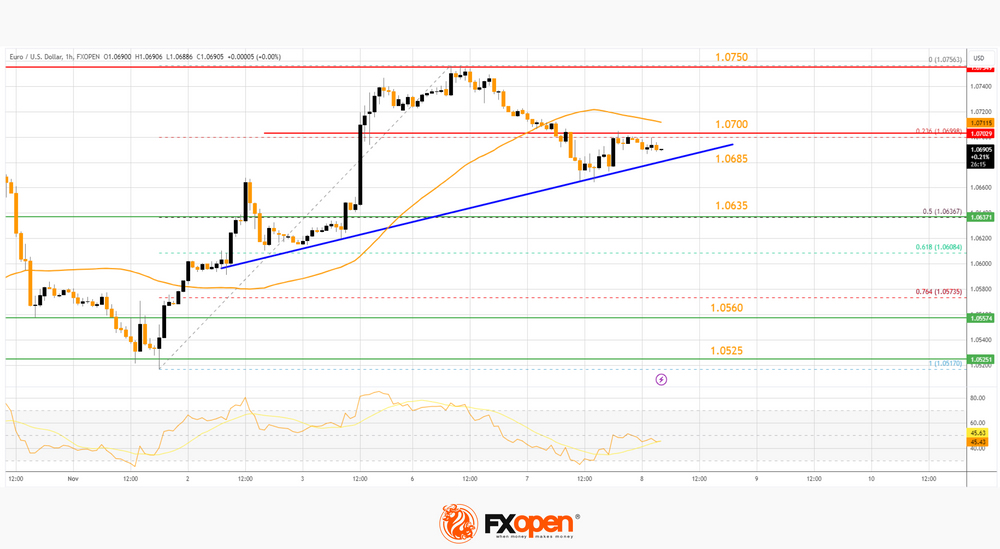
Immediate support on the downside is near a major bullish trend line at 1.0685. The next major support is near the 50% Fib retracement level of the upward wave from the 1.0517 swing low to the 1.0756 high at 1.0635.
A downside break below the 1.0635 support could send the pair toward the 1.0560 level. Any more losses might send the pair into a bearish zone to 1.0525.
Immediate resistance on the EUR/USD chart is near the 50-hour simple moving average at 1.0700. The first major resistance is near the 1.0750 level. An upside break above the 1.0750 level might send the pair toward the 1.0800 resistance.
The next major resistance is near the 1.0840 level. Any more gains might open the doors for a move toward the 1.0920 level.
USD/CHF Technical Analysis
On the hourly chart of USD/CHF at FXOpen, the pair started a fresh decline from the 0.9115 zone. The US Dollar dropped below the 0.9030 support to move into a negative zone against the Swiss Franc.
The bears pushed the pair below the 50-hour simple moving average and 0.9010. Finally, the bulls appeared near the 0.8950 level. A low is formed near 0.8953 and the pair is now attempting a recovery wave.
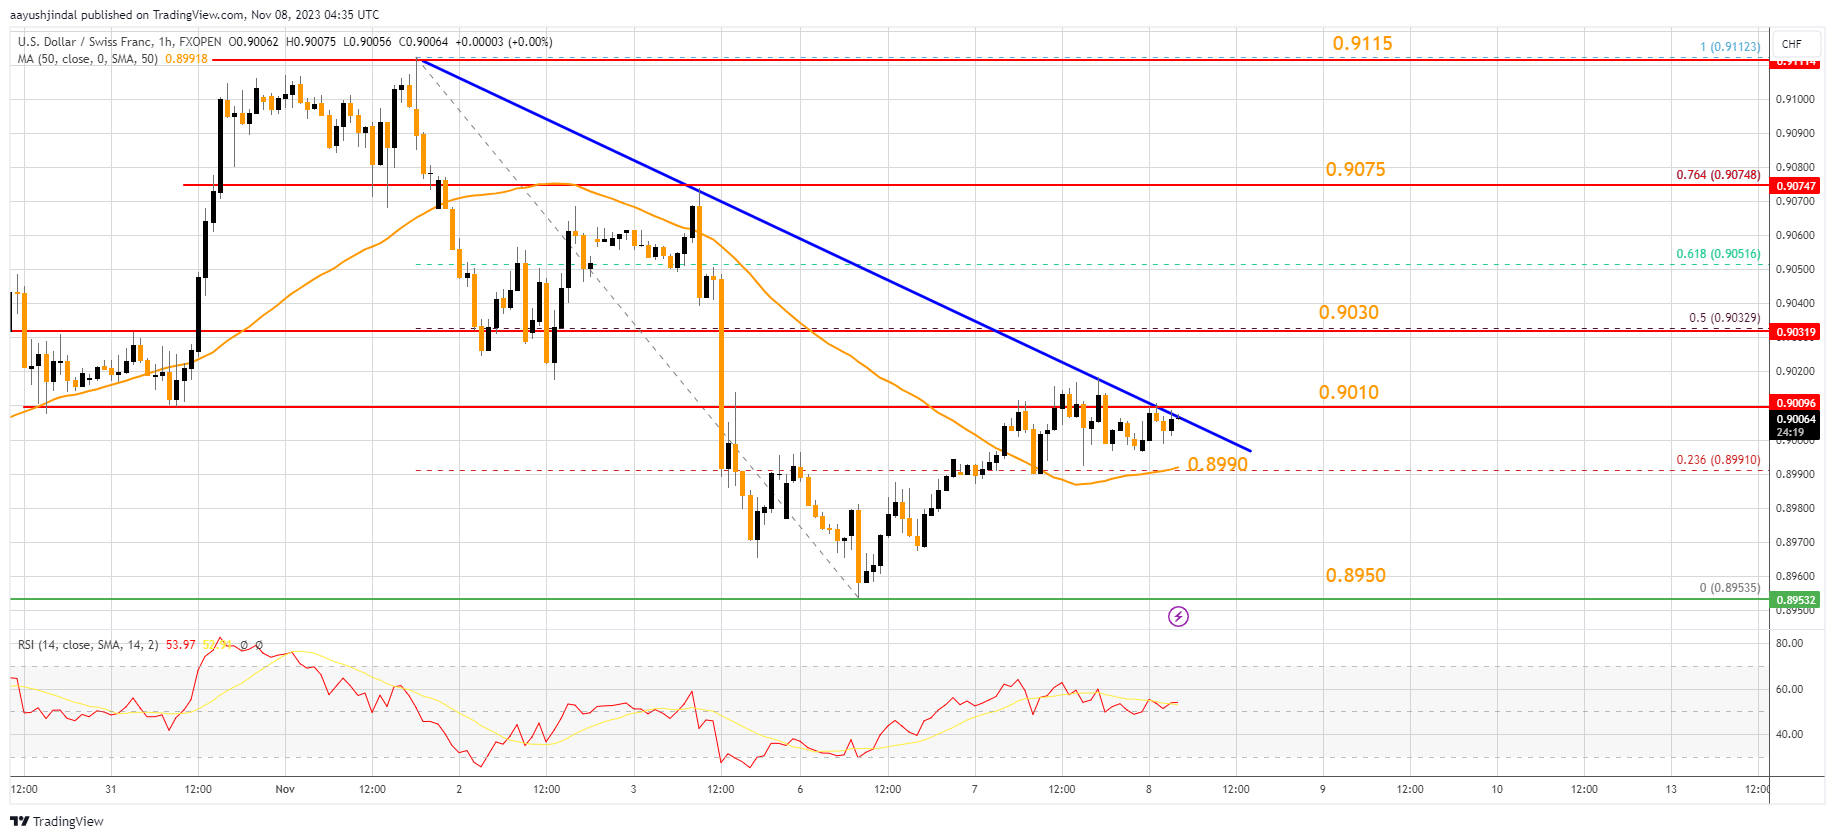
It is trading above the 50-hour simple moving average and the 23.6% Fib retracement level of the downward move from the 0.9112 swing high to the 0.8953 low.
On the upside, the pair could face resistance near a connecting bearish trend line at 0.9010. The next major resistance is near the 0.9030 level or the 50% Fib retracement level of the downward move from the 0.9112 swing high to the 0.8953 low.
If there is a clear break above the 0.9030 resistance zone, the pair could start another increase. In the stated case, it could even surpass 0.9075.
On the downside, immediate support on the USD/CHF chart is 0.8990. The first major support is near the 0.8950 level. The next major support is near 0.8910. Any more losses may possibly open the doors for a move toward the 0.8880 level in the coming days.
This article represents the opinion of the Companies operating under the FXOpen brand only. It is not to be construed as an offer, solicitation, or recommendation with respect to products and services provided by the Companies operating under the FXOpen brand, nor is it to be considered financial advice.
US Yields Fall Despite Cautious Fed Talk – Oil Near Oversold Territory
Portuguese markets were hit yesterday by the resignation of the country’s PM following an investigation into possible crimes of corruption involving lithium and hydrogen projects. The Portuguese PSI 20 fell more than 2.50% on political jitters and uncertainty. But the scandal didn’t resonate much in the rest of the European indices – which were little changed yesterday. The Stoxx 600 remained offered at the 445 level, which is an old support that turned resistance. The outlook remains negative due to the slowing European activity, and the EURUSD slipped below the 1.07 mark as the US dollar extended its gains for a second day.
Whatever
Yesterday was quite interesting in terms of the Federal Reserve (Fed) talk and the market reaction to the Fed talk. A few Fed speakers including Neel Kashkari and Michelle Bowman sent a cautious message to the market that the Fed’s battle against inflation is not won yet and tightening could continue. But in vain, the market reaction to the latest comments from the Fed speakers was a thick and determined ‘whatever’. The US 10-year yield fell below its 50-DMA, the 2-year yield steadied below the 5% mark, and the gap between the two is widening again as the dovish Fed expectations swamp the marketplace following the soft US jobs data released last week in the US and the Fed’s decision to pause for another month. The Fed President Powell is due to speak this week and will certainly say the same thing than his dear colleagues : that the Fed’s fight against inflation is not done yet and that they will watch the economic data to decide what’s the next step – which could be another pause, or a hike – but investors have made their mind and trade confidently on the expectation that the Fed is done hiking.
Now, I also think that if we don’t see inflation numbers take off, the Fed is gently done hiking. But the excess optimism in the market, and the falling yields will get the Fed to firm up its stance to make sure that the financial conditions don’t ease too fast too soon. A 50bp fall in the US 10-year yield and a strong rebound in the equity markets is not good for taming inflation. Therefore, I expect the bond rally to start slowing approaching the 4.50% level in the 10-year yield and expect the 2-year yield to return above the 5% mark.
In equities, the S&P500 is above its 50-DMA for the 3rd day and the rate-sensitive Nasdaq 100 broke above its summer down-trending channel top. At the current levels, the S&P500’s earnings yield is around 4%, and Nasdaq’s is around 3.70%. That means that the Fed should proceed with a couple of rate cuts and the sovereign yields should fall significantly more for these returns to look appealing in comparison. That’s why the equity rally doesn’t look like it’s on solid ground. Non-cyclical, value names are preferable. US equities could continue to outperform the European and Chinese peers.
Crude oil below 200-DMA
The barrel of crude oil fell almost 5% yesterday after the $80pb support gave in to the growing weight of the increasingly aggressive bears. The price fell below the 200-DMA, near the $78pb, in a swift move, and is consolidating below this level this morning. Trend and momentum indicators remain comfortably negative, but the RSI warns that crude oil is about to step into the oversold market territory, and that it will soon be time for a correction. Buyers are expected to come in at the $75/77 range, and a correction to $80/82 range is possible, with limited upside potential above that level. The risk of a sudden jump due to supportive geopolitical news is live, but if the Gaza war, the Iranian warnings that the war could escalate and spill to the region, and OPEC and Russia’s reminder that they will keep the production levels tight couldn’t prevent this month’s selloff, the slowing demand rhetoric will continue to outweigh the supply concerns and keep the market in the bearish waters. US crude remains in the bearish trend below the $85pb level.
AUD/USD Daily Report
Daily Pivots: (S1) 0.6393; (P) 0.6448; (R1) 0.6492; More...
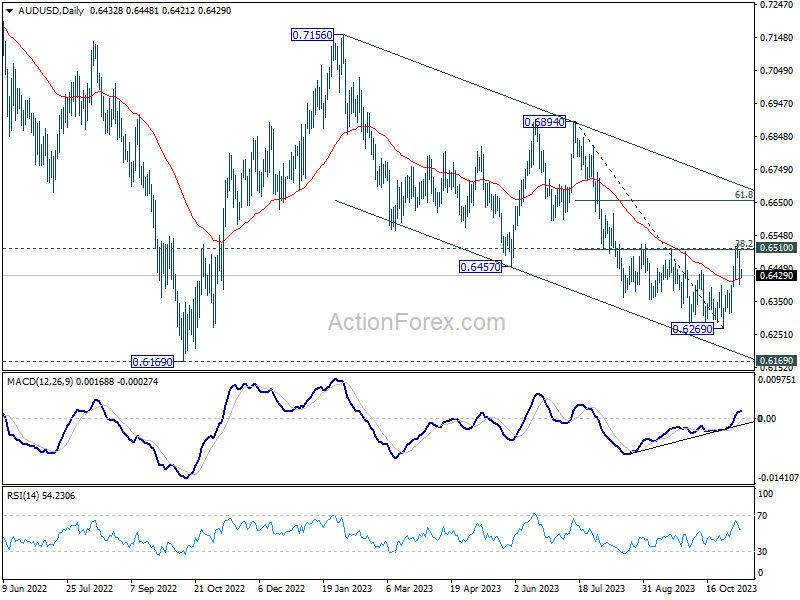
AUD/USD recovered after hitting 0.6411 minor support as well as 55 4H EMA. Intraday bias stays neutral first. On the downside, firm break of 0.6411 will indicate rejection by 0.6510 cluster resistance (38.2% retracement of 0.6894 to 0.6269 at 0.6508) , and turn bias back to the downside for retesting 0.6269 low. Nevertheless, decisive break of 0.6508/10 will argue that whole decline from 0.7156 might be completed with three waves down to 0.6269. Stronger rally should then be seen to medium term trend line resistance (now at 0.6700).
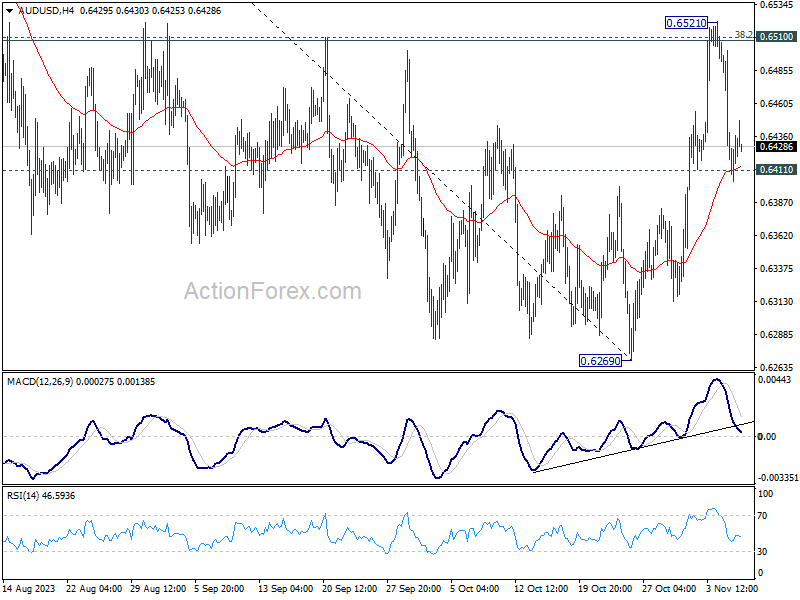
In the bigger picture, there is no confirmation that down trend from 0.8006 (2021 high) has completed. While current rebound from 0.6269 might extend higher, it could be the third leg of a corrective pattern from 0.6169 (2022 low) only. For now, medium term bearishness will remain as long as 0.6894 resistance holds.
Dollar Pauses Rebound, Await More Clues from Fed Officials
Dollar found itself hovering within a narrow range during Asian session, as market participants paused to reflect on recent comments from hawkish Fed members hinting at more tightening. Despite these hawkish tones, the overall risk mood found its footing after the US markets displayed resilience, with only a slight dip in Asian equities following suit.
Market focus is now shifting towards a lineup of speeches from various Fed officials scheduled for today. Fed Chair Jerome Powell. It is anticipated that Fed Chair Jerome Powell will adopt a balanced tone, potentially leaving the task of shaping market expectations to his colleagues. Of special interest is the perspective of New York Fed President John Williams, whose insights often carry significant weight.
In the currency arena, Dollar is leading the pack, with Swiss Franc and Euro trailing behind. Commodity-linked currencies, however, are languishing at the bottom, with Australian Dollar leading. Yen is an outlier, displaying mixed performance despite the supportive rhetoric from BoJ Governor, as traders show little enthusiasm for advancing Yen's position.
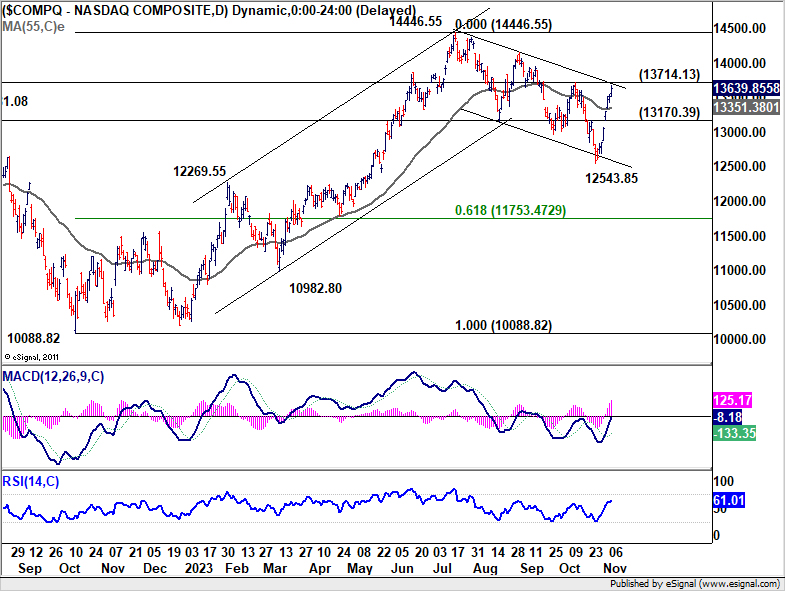
Technically, NASDAQ is in proximity to 13714.13 resistance, which is also close to falling channel resistance. Decisive break there would confirm that whole correction from 14446.55 has completed at 12543.85. Further rally should be seen to retest this high. If materializes, that would solidify near term risk-on sentiment in the overall markets. However, rejection by 13714.13 could open up another fall to extend the correction from 14446.55.
In Asia, at the time of writing, Nikkei is down -0.21%. Hong Kong HSI is down -0.50%. China Shanghai SSE is down -0.35%. Singapore Strait Times is down -1.46%. Japan 10-year JGB yield is down -0.0246 at 0.852. Overnight, DOW rose 0.17%. S&P 500 rose 0.28%. NASDAQ rose 0.90%. 10-year yield dropped -0.091 to 4.571.
Fed's Logan: Tight financial conditions crucial to steer inflation back to target
At a Fed conference overnight, Dallas Fed President Lorie Logan said that inflation appears to be "trending toward 3%", a figure still above the 2% target.
Despite a cooling labor market, Logan highlighted that it remains "too tight," implying that the job market's strength could continue to put upward pressure on wages and, consequently, inflation.
Logan emphasized the need "see tight financial conditions in order to bring inflation to 2% in a timely and sustainable way". She will be looking at "data" and "financial conditions" as the next meeting in December approaches.
With a particular focus on recent retracement in 10-year Treasury yield and broader financial conditions, Logan suggests these elements will play a pivotal role in shaping Fed's forthcoming monetary policy decisions.
Fed's Bowman expects to raise interest rates further
In a speech overnight, Fed Governor Michelle Bowman asserted, "I continue to expect that we will need to increase the federal funds rate further to bring inflation down to our 2% target in a timely way."
She acknowledged that interest rates "appears to be restrictive" while financial conditions "have tightened since September". However, "We don't yet know the effects of tightened financial conditions on economic activity and inflation, she cautioned.
"There is an unusually high level of uncertainty regarding the economy and my own economic outlook, especially considering recent surprises in the data, data revisions, and ongoing geopolitical risks," she noted.
BoJ Ueda suggests easy policy exit could precede real wage recovery
In an address to the parliament today, BoJ Governor Kazuo Ueda indicated a forward-looking approach to monetary policy, wherein the anticipation of rising real wages could be a determinant for policy normalization, rather than their current state.
Ueda posited, "Real wages would likely have turned positive when a positive wage-inflation cycle kicks off."
Delving into the timing of potential policy shifts, Ueda mentioned, "But in terms of how long we maintain our massive monetary easing... real wages don't necessarily have to turn positive before that decision is made."
Clarifying this point, he further elaborated that "The decision could be made if we can foresee with some certainty that real wages will turn positive ahead."
Ueda also addressed the persistent gap between current inflation rates and the bank's longstanding target, stating, "When looking at trend inflation, there's still some distance towards our 2% target. That is why we are continuing with massive easing."
Short-term inflation fears abate according to RBNZ survey
In the latest RBNZ quarterly Business Survey of Expectations, near-term outlook for inflation has cooled, with one-year-ahead expectations retreating from 4.17% to 3.60%, a significant decline of 57 basis points. On a two-year horizon, the expectation for inflation has seen a marginal dip of 7 basis points to 2.76%.
Conversely, expectations for inflation over a five and ten-year span have inched upwards. The survey revealed a mean five-year-ahead annual inflation expectation of 2.43%, marking an 18 basis points increase from the previous quarter's estimate. Ten-year expectations also saw a modest rise of 6 basis points to 2.28%.
With regard to the Official Cash Rate (OCR), the consensus is that it would hover at 5.50% by the end of December 2023. Looking one year ahead, the mean OCR expectation has fallen to 4.99%, indicating that businesses anticipate a loosening of monetary policy in the future once the immediate inflationary pressures have been mitigated.
On the growth front, respondents to the survey are more bullish. The mean one-year-ahead GDP growth expectation increased to 1.26%, up from 1.02%. The forecast for two-year-ahead GDP growth also saw an uptick, rising to 2.15% from the prior 1.95%.
Looking ahead
Germany CPI final, France trade balance, Italy retail sales, and Eurozone retail sales will be release in European session. Later in the day, US wholesale inventories final will be featured. Canada building permits and BoC summary of deliberations will be released too.
AUD/USD Daily Report
Daily Pivots: (S1) 0.6393; (P) 0.6448; (R1) 0.6492; More...
AUD/USD recovered after hitting 0.6411 minor support as well as 55 4H EMA. Intraday bias stays neutral first. On the downside, firm break of 0.6411 will indicate rejection by 0.6510 cluster resistance (38.2% retracement of 0.6894 to 0.6269 at 0.6508) , and turn bias back to the downside for retesting 0.6269 low. Nevertheless, decisive break of 0.6508/10 will argue that whole decline from 0.7156 might be completed with three waves down to 0.6269. Stronger rally should then be seen to medium term trend line resistance (now at 0.6700).
In the bigger picture, there is no confirmation that down trend from 0.8006 (2021 high) has completed. While current rebound from 0.6269 might extend higher, it could be the third leg of a corrective pattern from 0.6169 (2022 low) only. For now, medium term bearishness will remain as long as 0.6894 resistance holds.
Economic Indicators Update
| GMT | Ccy | Events | Actual | Forecast | Previous | Revised |
|---|---|---|---|---|---|---|
| 02:00 | NZD | RBNZ Inflation Expectations Q4 | 2.76% | 2.83% | ||
| 05:00 | JPY | Leading Economic Index Sep P | 108.7 | 108.8 | 109.2 | |
| 07:00 | EUR | Germany CPI M/M Oct | 0.00% | 0.00% | ||
| 07:00 | EUR | Germany CPI Y/Y Oct | 3.80% | 3.80% | ||
| 07:45 | EUR | France Trade Balance (EUR) Sep | -8.1B | -8.2B | ||
| 09:00 | EUR | Italy Retail Sales M/M Sep | -0.20% | -0.40% | ||
| 10:00 | EUR | Eurozone Retail Sales M/M Sep | -0.20% | -1.20% | ||
| 12:30 | CAD | Building Permits M/M Sep | 1.20% | 3.40% | ||
| 15:00 | USD | Wholesale Inventories Sep F | 0.00% | 0.00% |
Hang Seng Index Technical: Potential Bullish Reversal in Progress
- Daily MACD indicator has exhibited a potential medium-term trend change behaviour from bearish to bullish.
- Recent price actions have shaped a minor bullish “Double Bottom” breakout and traded above the 20-day moving average.
- Watch the short-term key support at 17,540.
In the past two weeks, the price actions of the Hong Kong 33 Index (a proxy of the Hang Seng Index futures) have started to exhibit short-term to medium-term bullish bottoming configurations.
Daily MACD continues to show a persistent slow-down in downside momentum
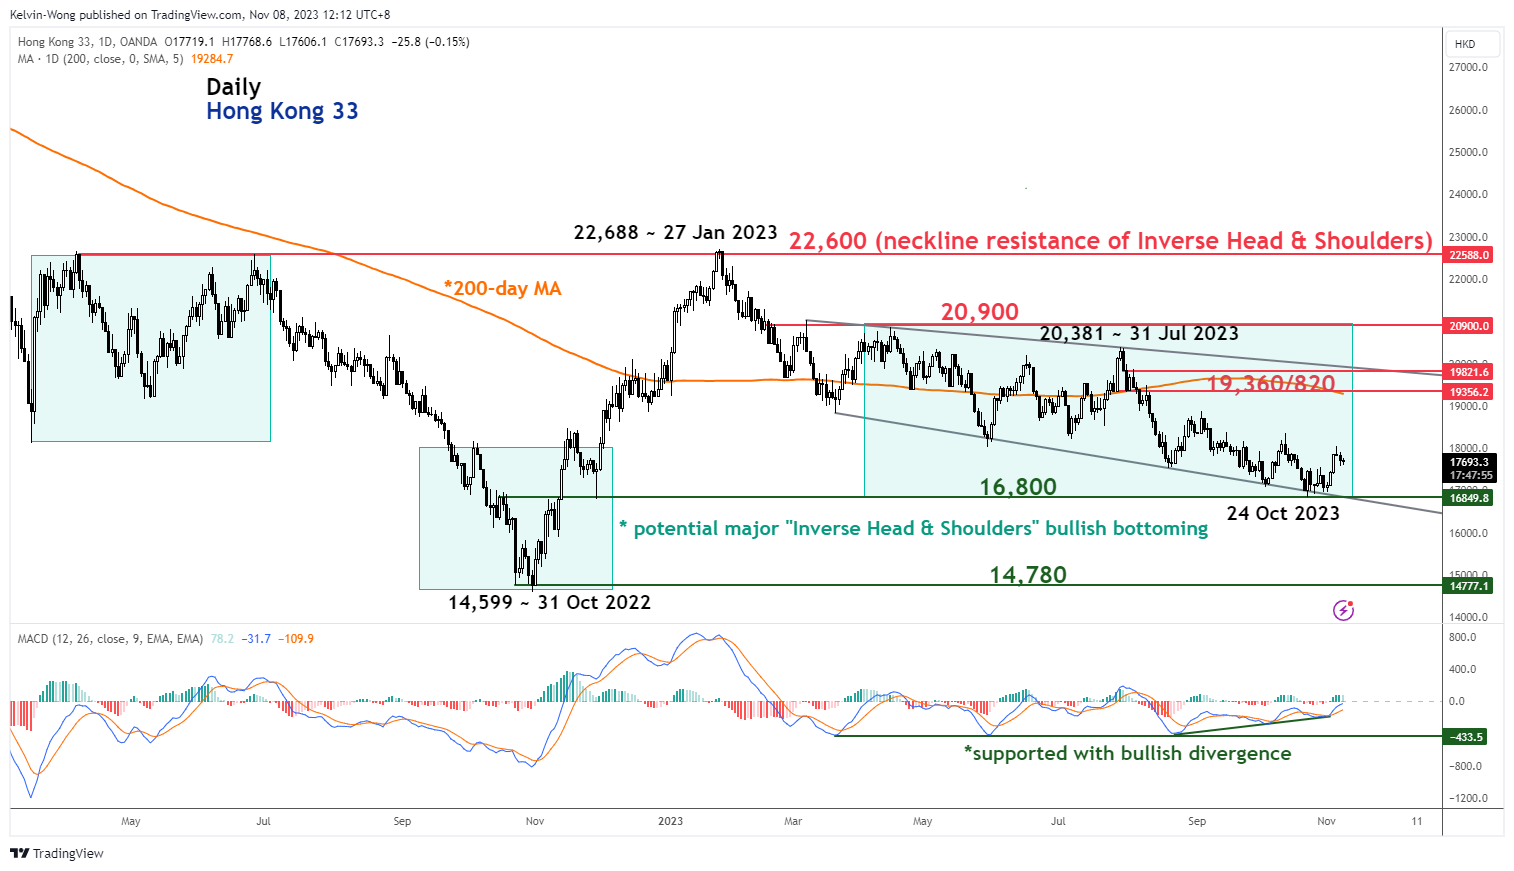
Fig 1: Hong Kong 33 medium-term trend as of 8 Nov 2023 (Source: TradingView, click to enlarge chart)
The medium-term downtrend phase in place since the 27 January 2023 high of 22,688 of the Hong Kong 33 Index has continued to trace out a series of “lower swing lows” attributed to fears of the deflationary spiral in China, geopolitical tensions between the US and China, and lack of ample stimulus measures from China top policymakers.
In the lens of technical analysis, our primary focus lies more on price actions and their reactions from news flows (analysis of how much has been priced into the tradable instruments from either positive or negative related news flow). For example, if market participants are fully aware of the available negative news flows that drive down the tradable price of a highly liquid transacted financial instrument in the current state, a tiny subtle infusion of positive news flow is likely to see a positive reversal in price actions as these negative news flows have been almost fully priced in.
Relative strength study (rate of change or momentum) is one of the major focuses in technical analysis to decipher potential reversal zones of highly liquid transacted financial instruments and also act as a gauge of the strength of trending behaviours as market participants digest and react to the related news flows.
The daily MACD indicator of the Hong Kong 33 Index has started to flash out a series of “higher lows” since 5 October 2023, a bullish divergence condition in contrast with the “lower lows” seen in the price actions of the Index over the same period (relative over here as the MACD is a momentum indicator as well on top of its trend-following elements).
This observation suggests the strength of the medium-term downtrend phase has started to ease which in turn suggests any subtle new positive news flow may trigger a potential sustainable upmove or bullish reversal in the price actions of the Index going forward.
Minor “Double Bottom” bullish breakout, watch the 17,540 key short-term support
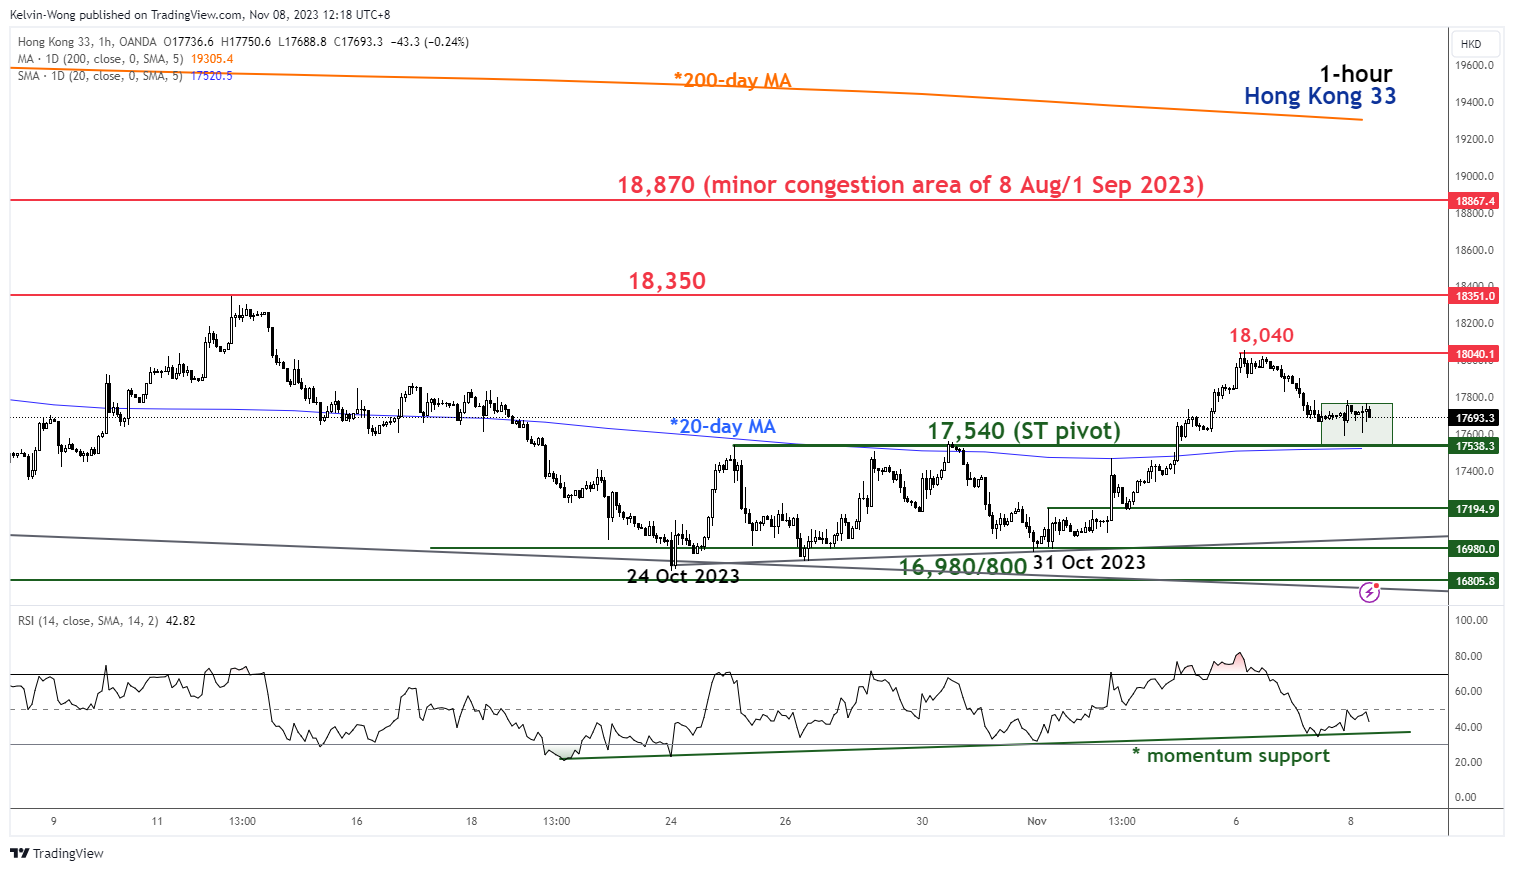
Fig 2: Hong Kong 33 minor short-term trend as of 8 Nov 2023 (Source: TradingView, click to enlarge chart)
In the short-term as seen on its hourly chart, the Index has traced out a minor bullish “Double Bottom” bullish reversal configuration via its recent price actions from 24 October to 31 October 2023.
It has staged a bullish breakout of the neckline resistance of the minor “Double Bottom” and 20-day moving average and price actions since Monday, 6 November have retraced/pull-backed towards these elements now acting as confluence support of 17,540.
In addition, the hourly RSI momentum indicator has managed to stage a rebound from its ascending support yesterday, 7 November which suggests a revival of short-term bullish momentum.
A clearance above 18,040 near-term resistance (6 November minor swing high) may see a further potential push-up towards the next immediate resistance at 18,350 in the first step.
On the flip side, failure to hold at the 17,540 short-term pivotal support negates the bullish tone for a slide to retest the 16,980/16,800 key medium-term support zone.