

Sample Category Title
GBP/USD Mid-Day Outlook
Daily Pivots: (S1) 1.2312; (P) 1.2370; (R1) 1.2402; More
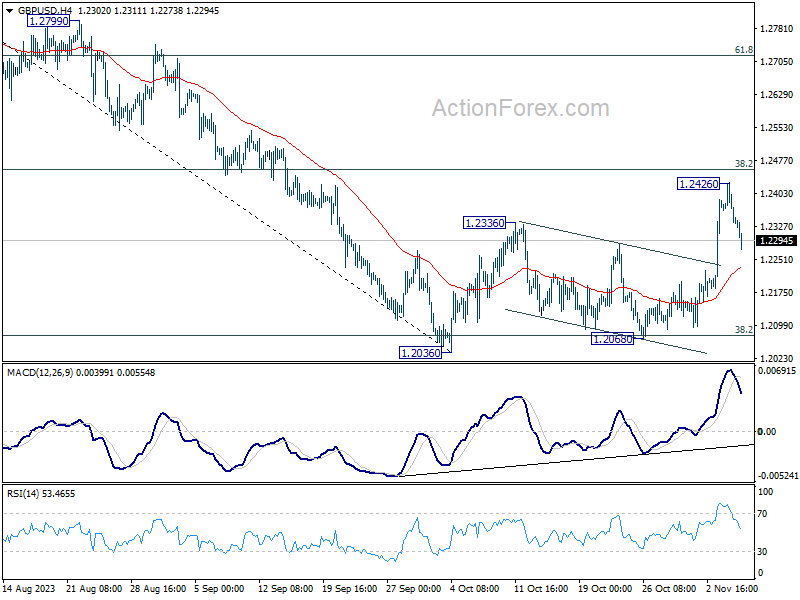
Intraday bias in GBP/USD remains neutral for the moment. Further rise is in favor as as long as 4H 55 EMA (now at 1.2230) holds. Decisive break of 38.2% retracement of 1.3141 to 1.2036 at 1.2458 will pave the way to 61.8% retracement at 1.2783. However, sustained break of 4H 55 EMA will revive near term bearishness and bring retest of 1.2036 low.
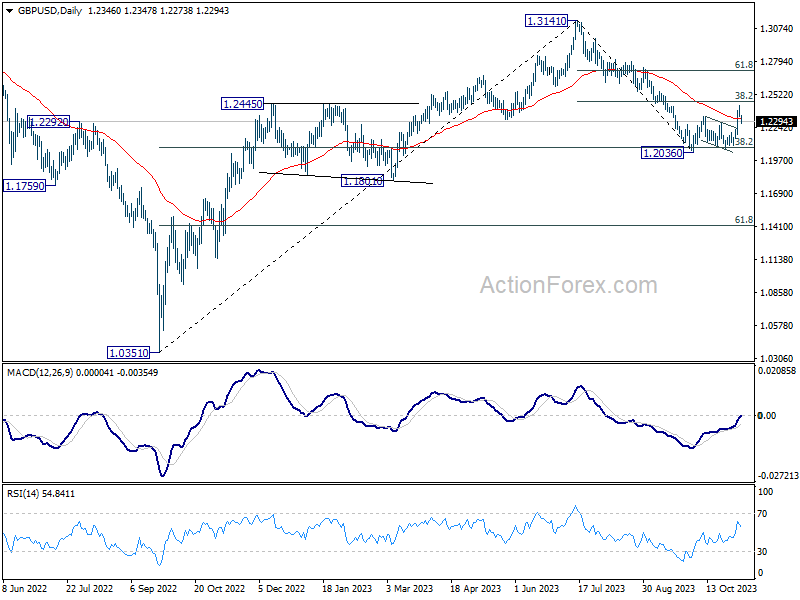
In the bigger picture, the strong rebound from 38.2% retracement of 1.0351 to 1.3141 at 1.2075 argues that price action from 1.3141 are merely a correction to rise from 1.0351 (2022 low). Current rally from 1.2036 is tentatively seen as the second leg of the pattern. Hence, while further rally is in favor, upside should be limited by 1.3141 to start the third leg.
USD/CHF Mid-Day Outlook
Daily Pivots: (S1) 0.8967; (P) 0.8982; (R1) 0.9010; More....
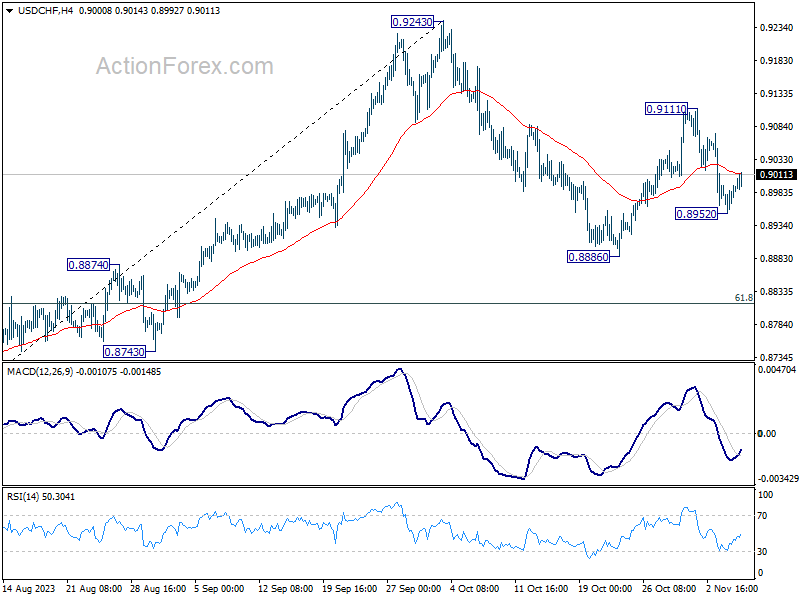
Intraday bias in USD/CHF stays neutral at this point. On the downside, below 0.8952 will target a test on 0.8886 support first. Break there will resume whole decline from 0.9243 to 0.8815 fibonacci level. However, break of 0.9111 will resume the rebound from 0.8886 instead, and target 0.9243 resistance.
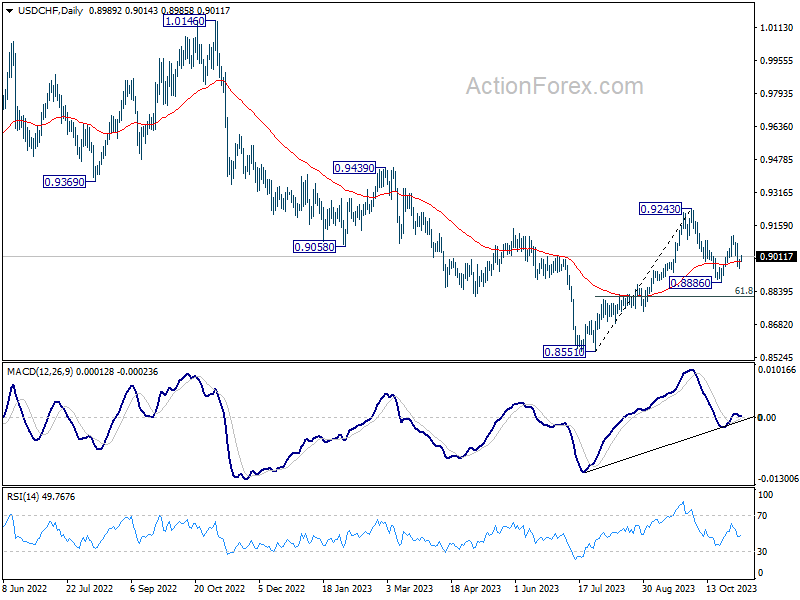
In the bigger picture, outlook is mixed up by the deeper than expected pull back from 0.9243. Yet there was no follow through selling after hitting 0.8886. On the upside, break of 0.9243 resistance will revive the case of medium term bottoming at 0.8851, and turn outlook bullish. However, sustained break of 61.8% retracement of 0.8551 to 0.9243 at 0.8815 will argue that larger decline from 1.0146 is ready to resume through 0.8551 low.
USD/JPY Mid-Day Outlook
Daily Pivots: (S1) 149.59; (P) 149.83; (R1) 150.33; More...
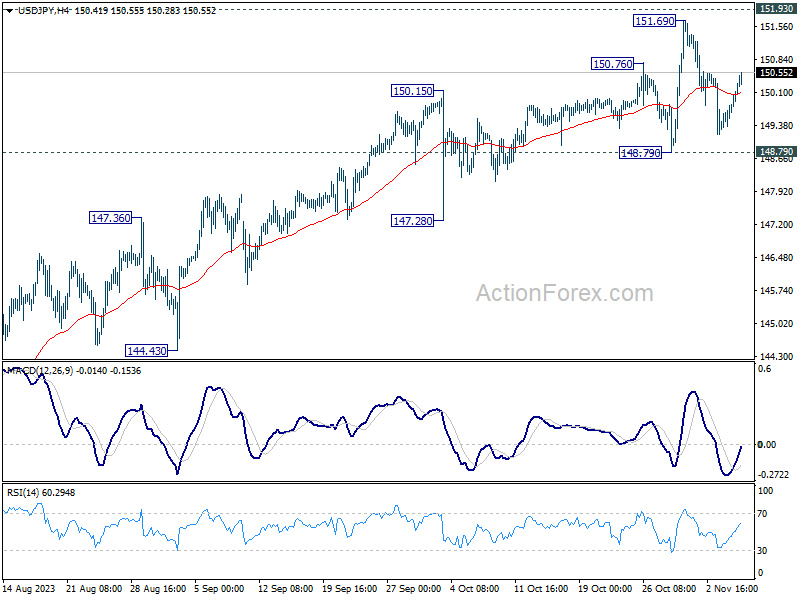
USD/JPY recovers further today but stays inside range of 148.79/151.69. Intraday bias remains neutral for the moment. Further rally is expected as long as 148.79 support holds. Firm break of 151.69 high will resume larger up trend. However, decisive break of 148.79 will indicate rejection by 151.93 key resistance, and bring deeper fall through 147.28 support.
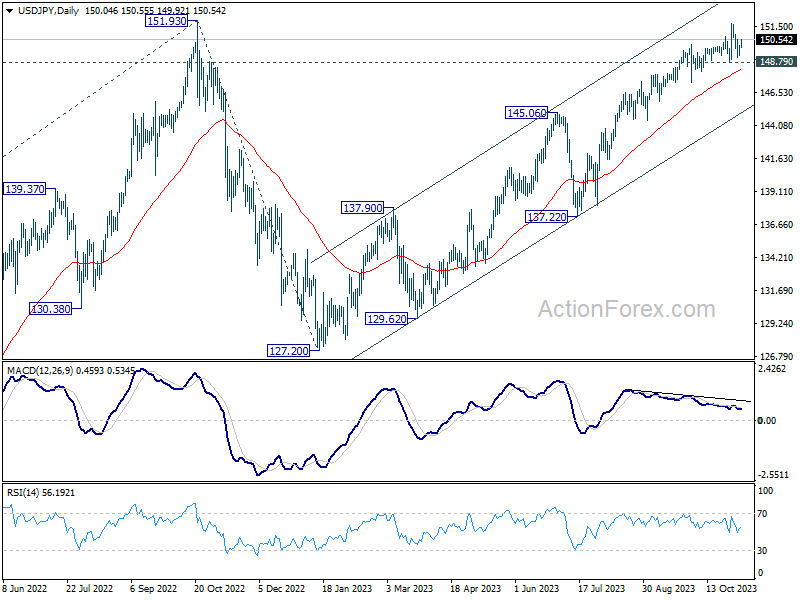
In the bigger picture, immediate focus is on 151.93 resistance (2022 high). Rejection by 151.93, followed by sustained break of 145.06 resistance turned support will argue that rise from 127.20 has completed, and turn outlook bearish for 137.22 support and below. However, sustained break of 151.93 will confirm resumption of long term up trend. Next target will be 61.8% projection of 102.58 to 151.93 from 127.20 at 157.69.
Australian Dollar Plunges after RBA Hike
- RBA raises rates but eases tightening bias
- Australian dollar slides over 1%
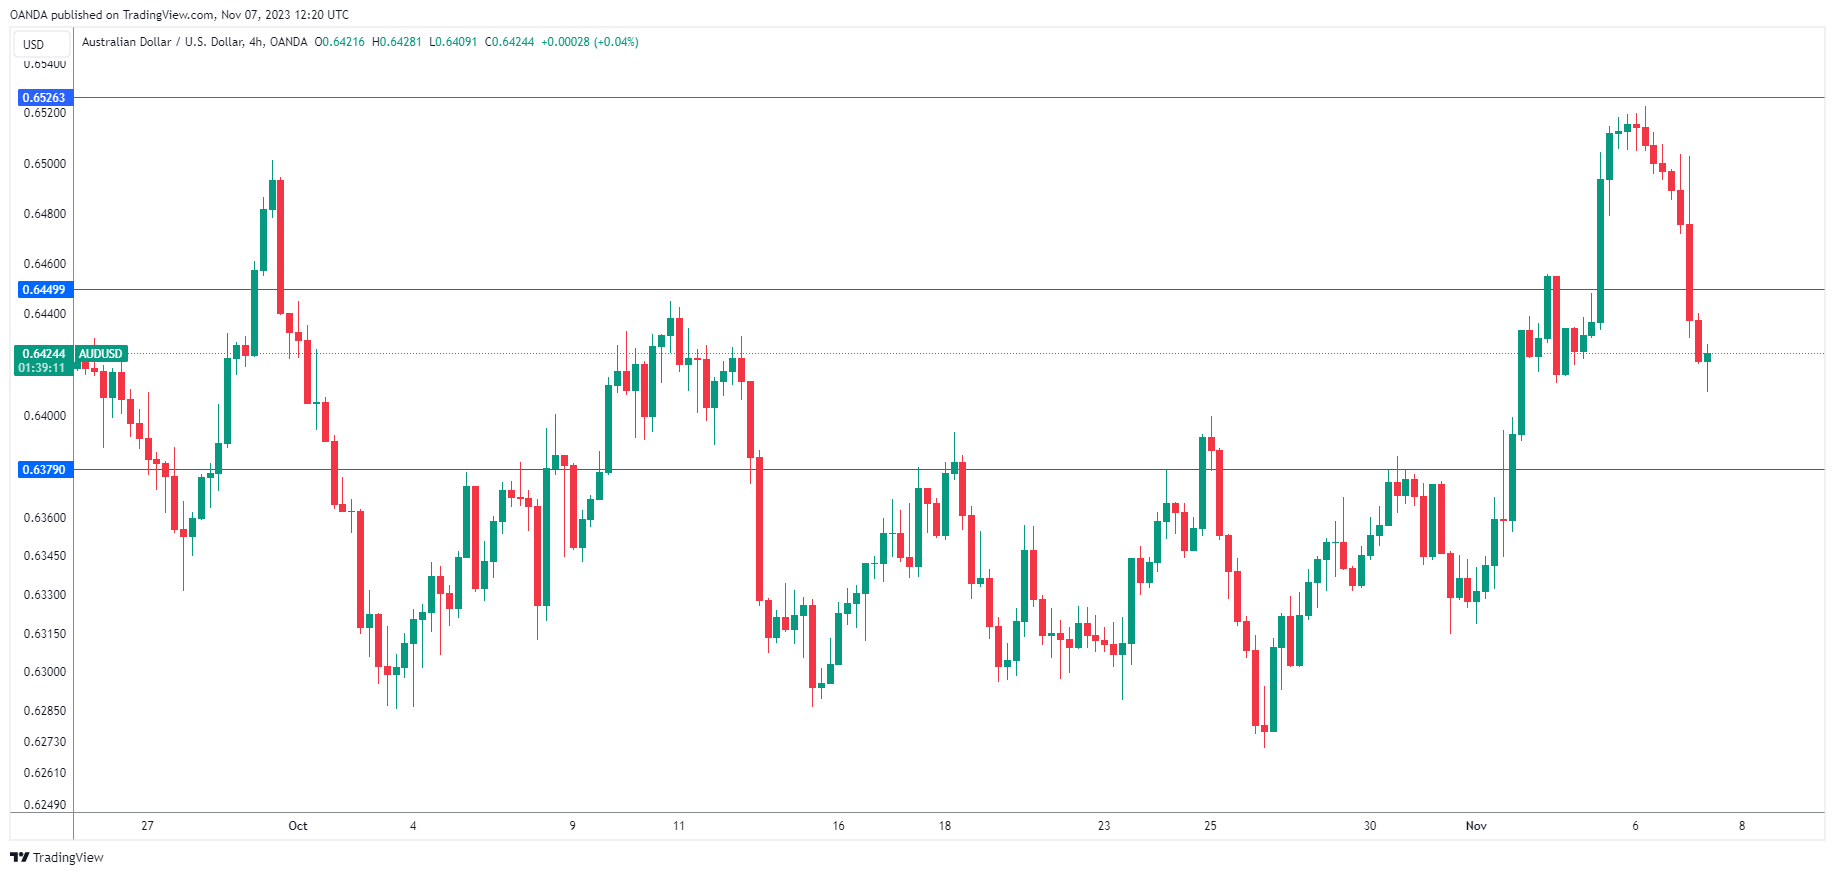
The Australian dollar has recorded massive losses on Monday. In the European session, AUD/USD is trading at 0.6422, down 1.05%. The Aussie continues to show strong volatility after climbing 2.8% last week.
RBA hikes but markets not impressed
The RBA was expected to raise rates today, after holding rates for four straight times. Governor Michelle Bullock duly followed with a quarter-point rate increase, bringing the cash rate to 4.35%. Whenever central banks raise rates, the local currency often rises, but the opposite happened today as the Aussie took a huge drop. At first glance that may seem puzzling, but a close look at the RBA statement can help explain the market reaction.
The RBA statement noted that the rate increase was meant to ensure that “inflation would return to target in a reasonable timeframe.” This points to an easing of the RBA’s tightening basis and raised expectations that the RBA is close to wrapping up its current tightening cycle or may even be done. The statement included the usual rhetoric that future rate decisions would be data-dependent and rate hikes were still on the table, but the cat was out of the bag as the markets viewed today’s move as a ‘dovish hike’ and the Australian dollar took a tumble.
The battle to subdue inflation is by no means over and Governor Bullock acknowledged in the statement that “progress looks to be slower than earlier expected” and that the risk of inflation remaining “higher for longer” has increased. Investors don’t appear as concerned as Bullock about the inflation risk, as indicated by the Aussie’s sharp downturn.
AUD/USD Technical
- There is resistance at 0.6526 and 0.6582
- 0.6449 and 0.6379 are providing support
Gold completes head and shoulder top, how low will it go?
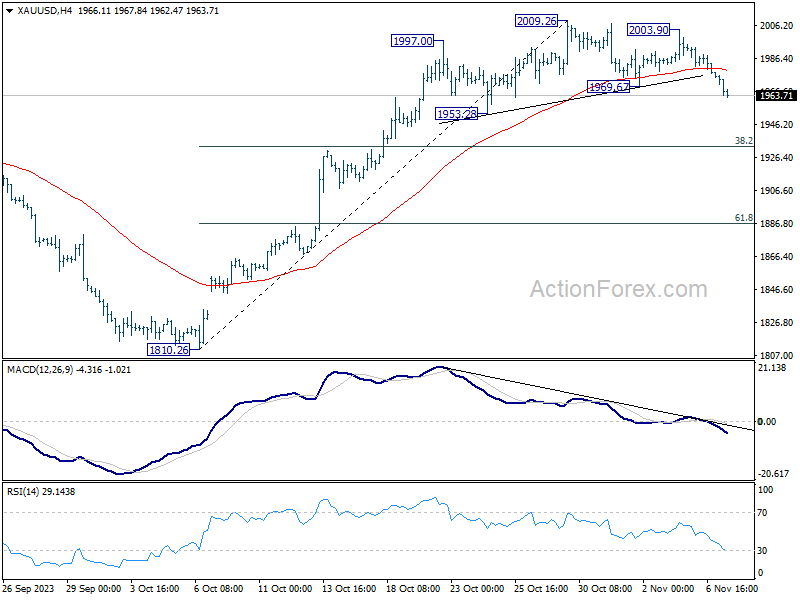
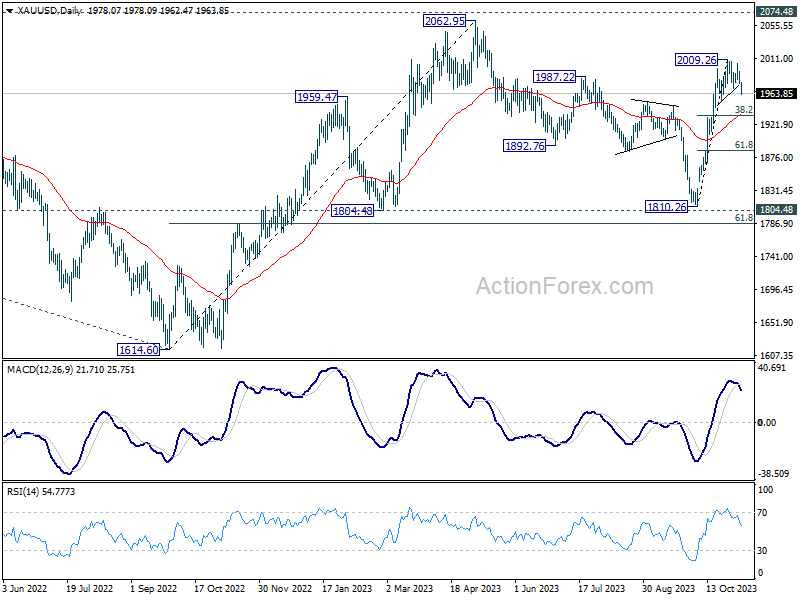
Gold's decline from 2009.26 continued today and the break of 1969.67 support completed a head and shoulder top pattern (ls: 1997.00, h: 2009.26, rs: 2003.90). The development suggests that it's already in correction to the whole rally from 1810.26. Further decline should be seen towards 38.2% retracement of 1810.26 to 2009.26 at 1933.24.
Overall outlook is unchanged that correction from 2062.95 has completed with three waves down to 1810.26. Hence, strong support should be seen from 1933.24, which is close to 55 D EMA (now at 1933.62), to contained downside. Another rally through 2009.26 to retest 2062.95 high should be seen sooner rather than later.
However, sustained break of 1933 support zone, will dampen this above bullish view, and open up deeper fall 61.8% retracement at 1886.27, and possibly below.
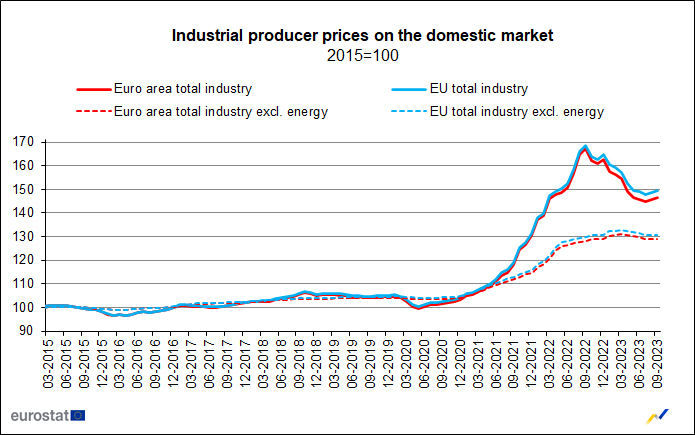
Eurozone’s PPI at 0.5% mom, -12.4% yoy in Sep
Eurozone PPI came in at 0.5% mom, -12.4% yoy in September, versus expectation of 0.3% mom, -12.5% yoy. For the month, Industrial producer prices increased by 2.2% in the energy sector, while prices remained stable for capital goods and for durable consumer goods, and prices decreased by 0.2% for both intermediate goods and non-durable consumer goods. Prices in total industry excluding energy decreased by 0.1%.
EU PPI came in at -0.6% mom, -11.2% yoy. The biggest monthly increases in industrial producer prices were observed in Luxembourg (+28.5%), Romania (+2.6%) and Bulgaria (+2.1%), while the largest decreases were recorded in Finland (-0.9%), Cyprus and Poland (both -0.3%) and Germany (-0.2%).
Bullish Price Action on Crude May Not Be Over Yet
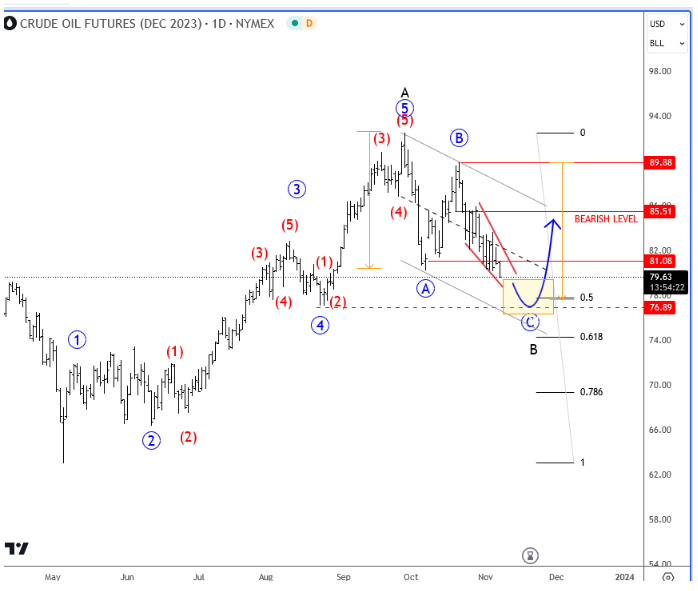
Crude oil bounced sharply back in October after attacks between Israel and Hamas. We have seen a jump of around 10% on crude oil to $90 in just a few days. In fact, back then, analysts started calling for $100 per barrel, so for me it was a bit overcrowded expectation, and that’s why we expected the opposite. Keep in mind that the market is the most sensitive when the news comes out, but then, after a few days the dust settles, and trading goes back to normal. And thats exactly what I have been expecting; a continuation lower, which makes sense from an Elliott wave perspective as energy showed us a top formation already at the end of September at 92-93 area. That was an end of an impulsive recovery from May to October, which we see it as first higher degree leg A of a three-wave A-B-C recovery, so more upside is still expected for wave C, ideally now as current A-B-C subwaves in wave B are coming into some attractive support. We are tracking final stages of wave C of B that can ideally find the base at the former wave 4 swing low, between 50% – 61,8% Fibonacci retracement that comes around $76-78 area.
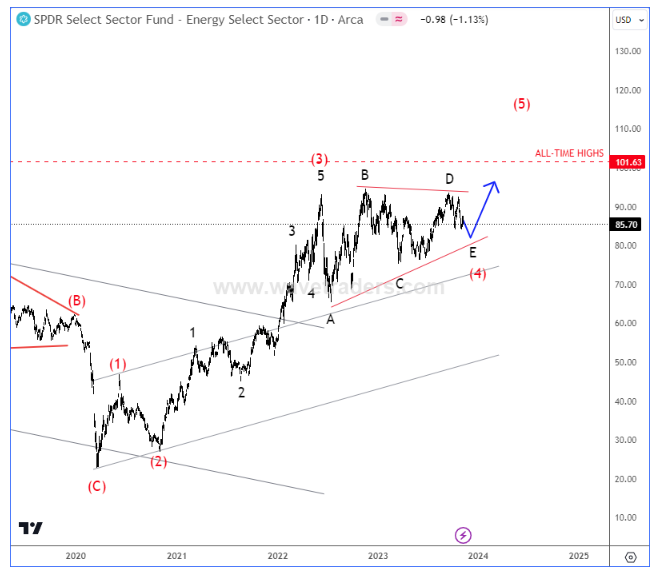
The main reason why Crude oil can see another recovery is also the energy sector (XLE), which we see it consolidating within a bullish running triangle pattern for wave (4) that can push the price into all-time highs for wave (5).
As soon as Crude oil and XLE charts complete their corrections, this is when we can expect a continuation higher, ideally now at the end of 2023 or at the beginning of 2024.
Can EURJPY Carry on Recording Higher Highs?
- EURJPY makes new 15-year high
- Intervention threat has not dented bullish appetite
- Bullish momentum indicators but exhaustion signs appear
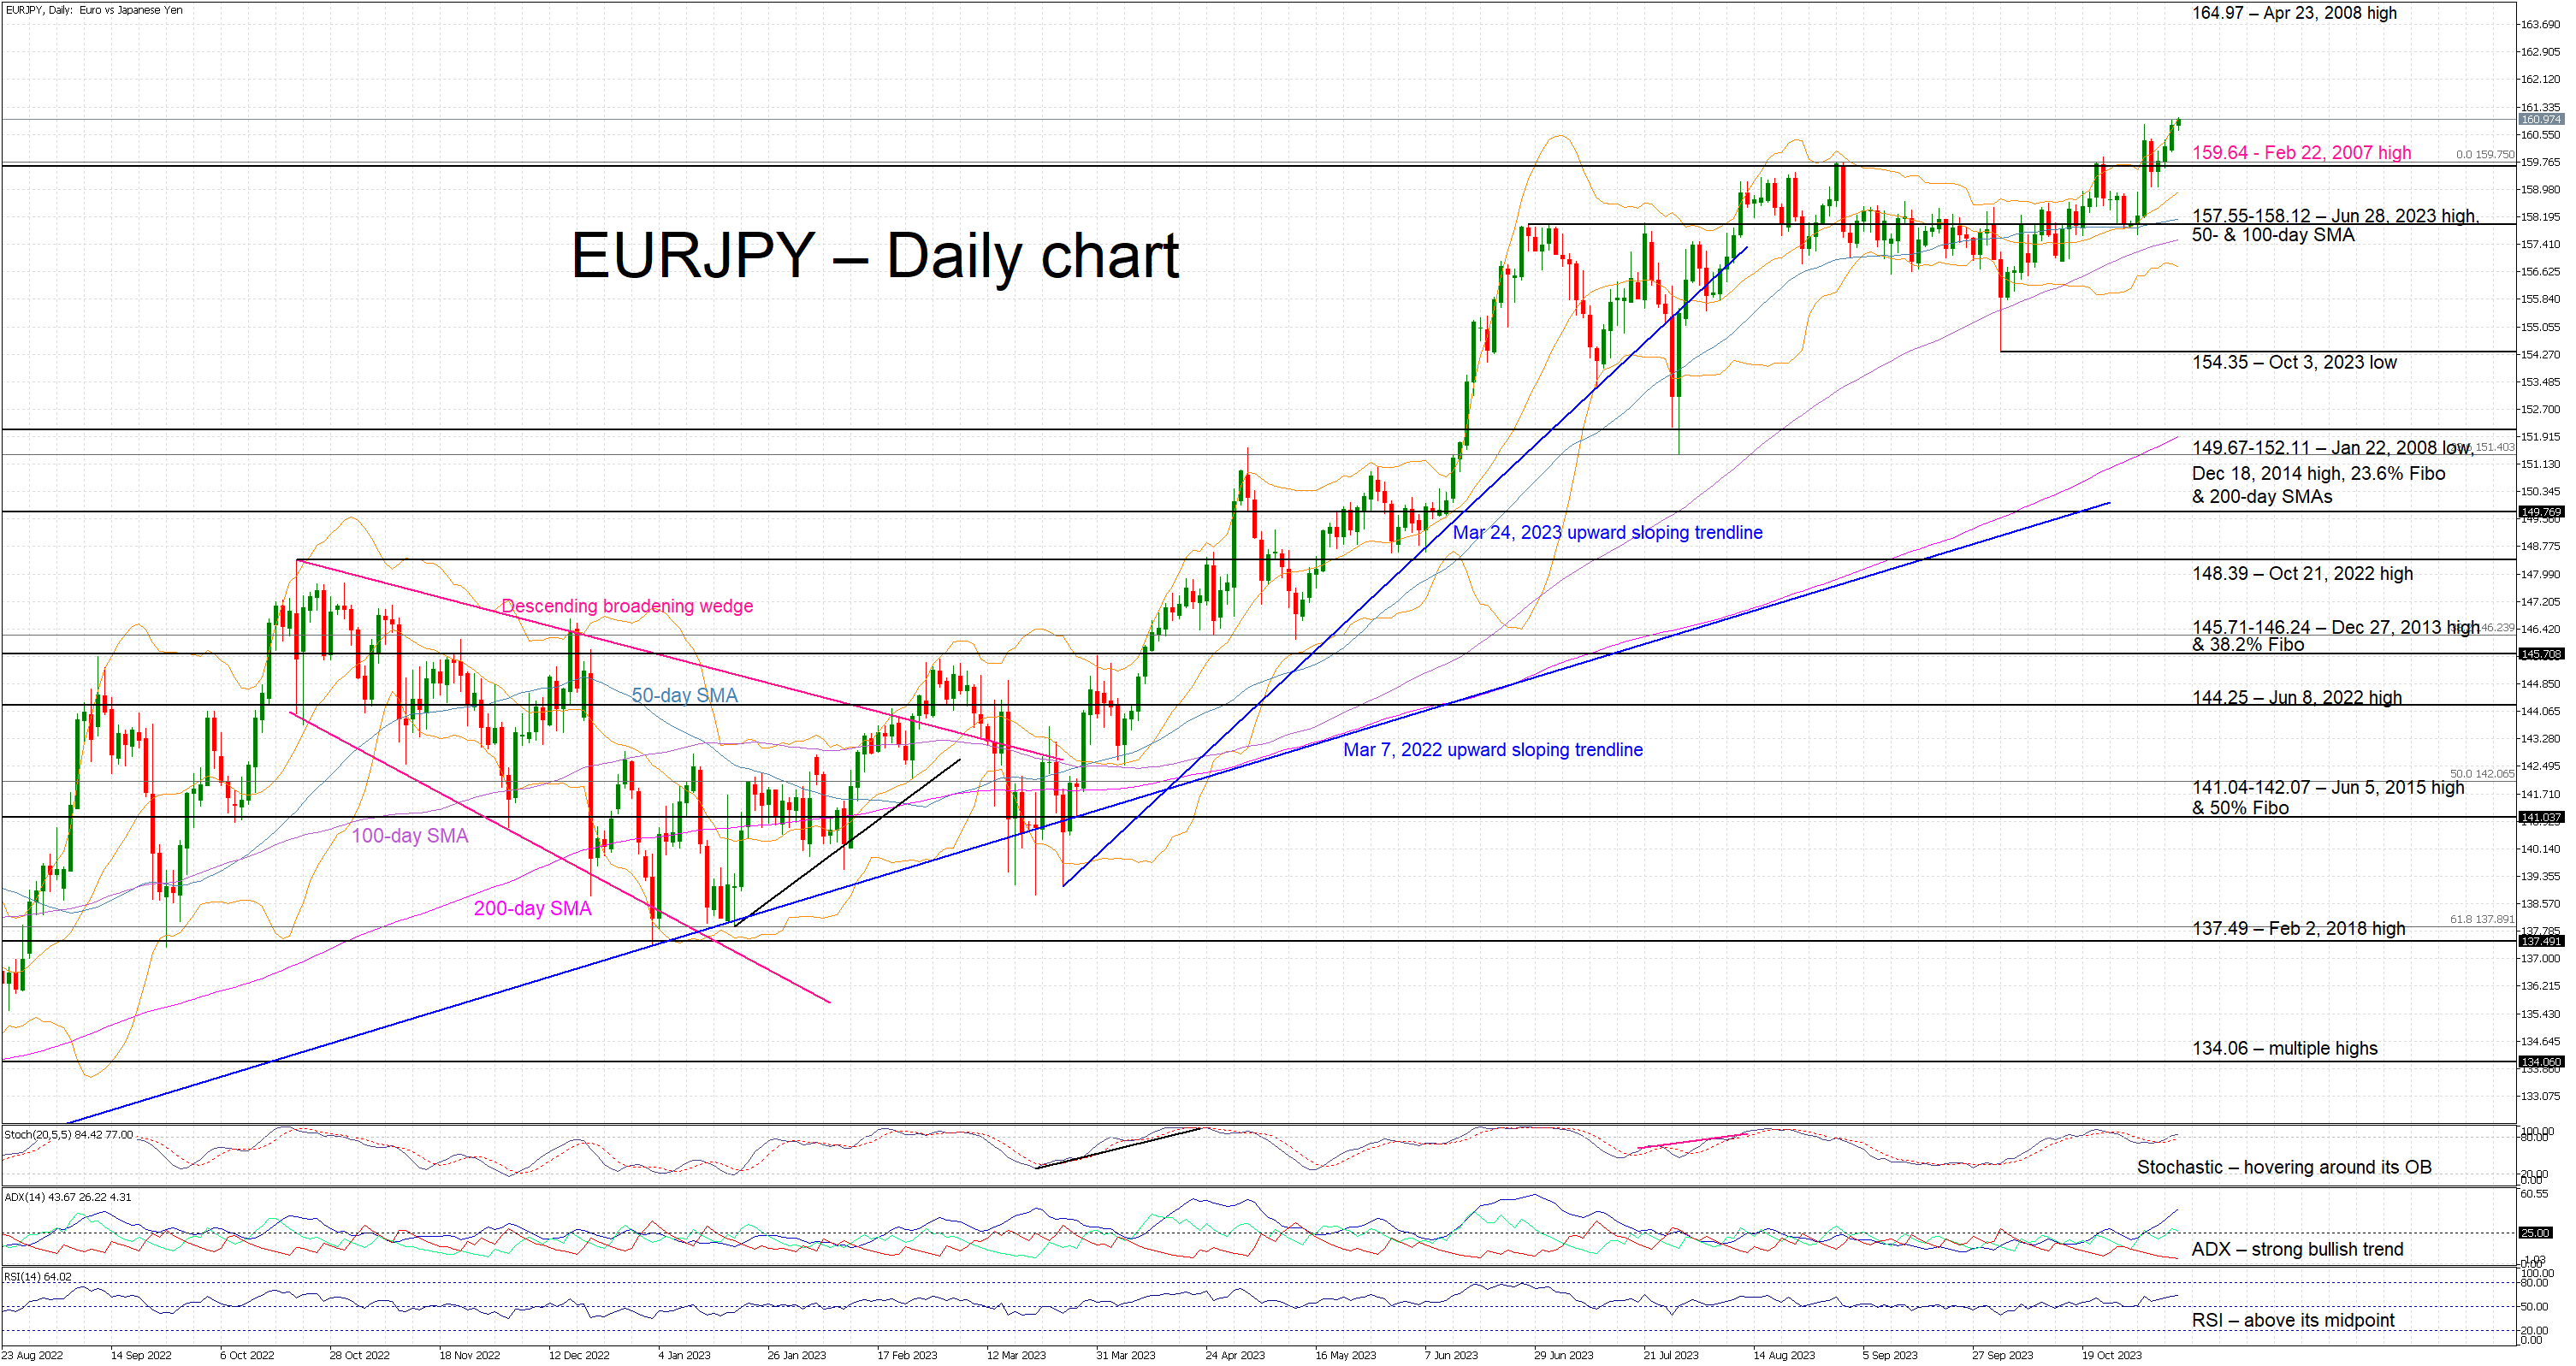
EURJPY is edging higher today, trying to record its fourth consecutive green candle. It has made a new 15-year high after finally managing to surpass the 159.64 level that has greatly been troubling the bulls over the past three months. Last week’s BoJ meeting announcements and the intervention threat do not seem to dent the bullish appetite.
Turning to the momentum indicators and there is strong support for the current upleg. In more detail, the Average Directional Movement Index (ADX) is edging higher, far above its 25-threshold, and signaling a strong bullish trend in the market. Similarly, the RSI remains above its midpoint and close to a 4-month high. More importantly, the stochastic oscillator has rejoined its overbought territory, confirming the current bullishness in the EURJPY. However, the higher high in this currency pair has been met by a lower high in the stochastic and thus raises questions about the viability of the current upleg.
Should the bulls ignore the intervention threat, they would aim to keep EURJPY above 159.64 and record a new higher high on a daily basis. They could gradually try to push EURJPY towards the April 23, 2008 high at 164.97.
On the other hand, the bears are desperately trying to recoup part of their losses. They could attempt to push EURJPY back below the February 22, 2007 high at 159.64 and then test the support set by the busy 157.55-158.12 area. This is defined by the June 28, 2023 high and the 50- and 100-day simple moving averages (SMAs). If successful, the bears could have a go at reaching the October 3, 2023 low at 154.35.
To sum up, EURJPY bulls remain in control of the market and are recording multiple higher highs despite the intervention threat and the stochastic oscillator showing some early signs of rally exhaustion.
GBP/USD Turns Green While USD/CAD Eyes Fresh Increase
GBP/USD started a decent increase above the 1.2225 resistance. USD/CAD is recovering and might aim for a move toward the 1.3795 resistance.
Important Takeaways for GBP/USD and USD/CAD Analysis Today
- The British Pound climbed above the 1.2225 and 1.2315 resistance levels.
- There is a connecting bullish trend line forming with support near 1.2315 on the hourly chart of GBP/USD at FXOpen.
- USD/CAD declined toward the 1.3635 zone before the bulls took a stand.
- It broke a major bearish trend line with resistance near 1.3660 on the hourly chart at FXOpen.
GBP/USD Technical Analysis
On the hourly chart of GBP/USD at FXOpen, the pair found support near the 1.2100 zone. The British Pound formed a base and started a recovery wave above 1.2225 against the US Dollar.
The pair was able to clear the 1.2315 resistance and the 50-hour simple moving average. Finally, it spiked toward 1.2430. A high is formed near 1.2430 and the pair is now correcting gains. There was a move below the 23.6% Fib retracement level of the upward move from the 1.2097 swing low to the 1.2428 high.
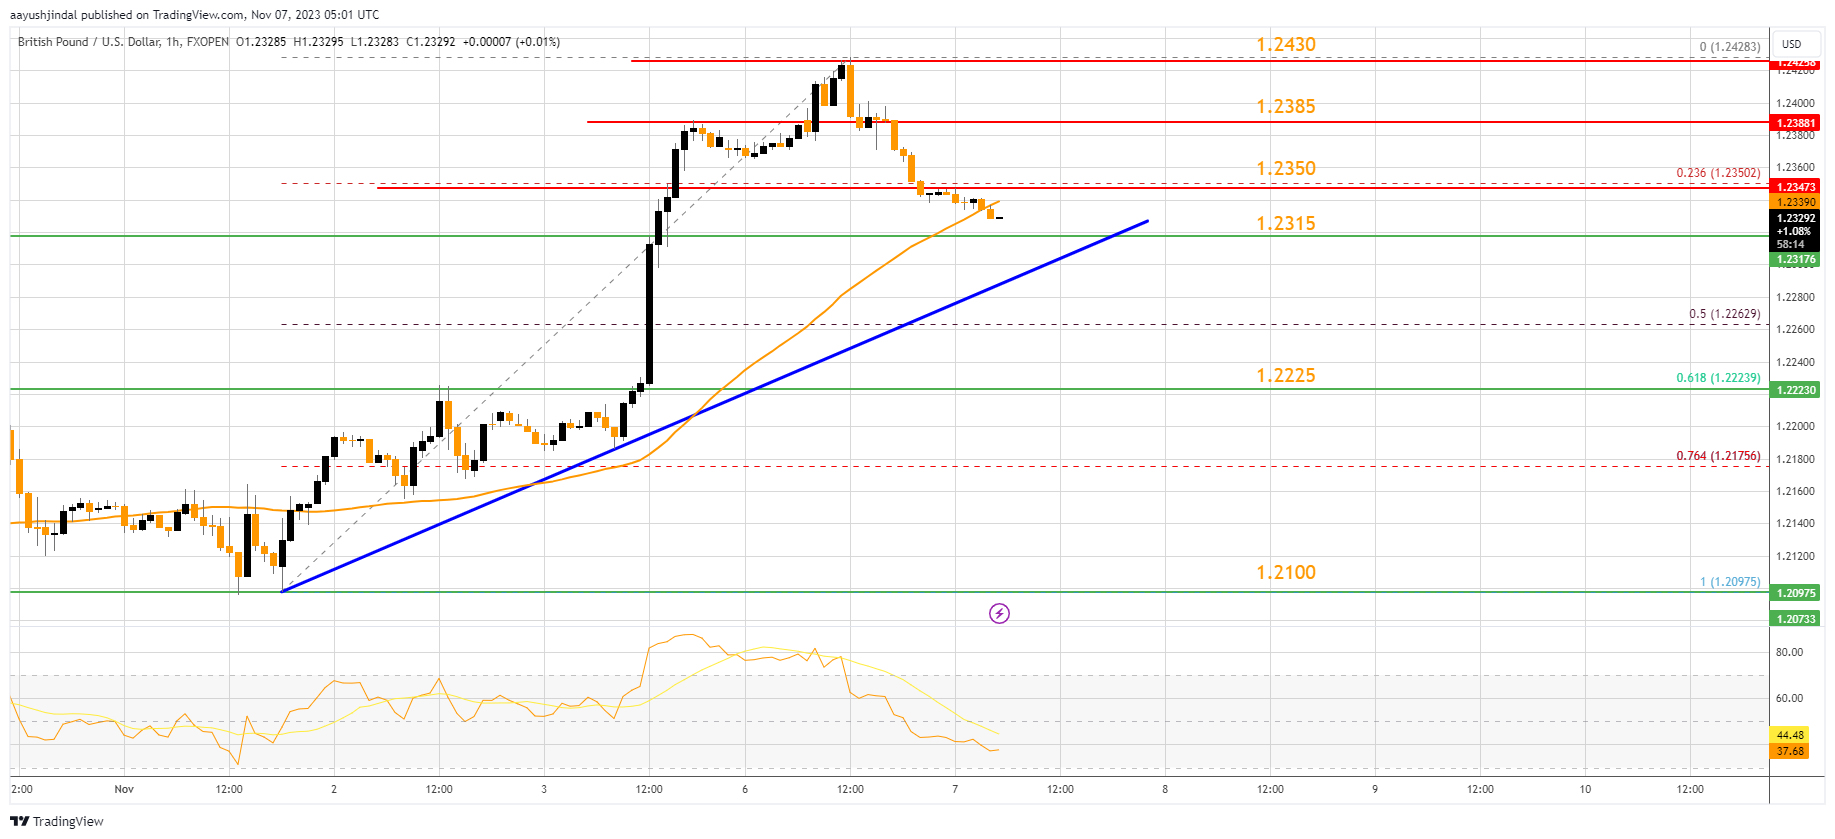
The RSI moved below the 40 level on the GBP/USD chart and the pair is now approaching a major support at 1.2315. There is also a connecting bullish trend line forming with support near 1.2315.
A downside break below the trend line might send the pair toward the 61.8% Fib retracement level of the upward move from the 1.2097 swing low to the 1.2428 high at 1.2225. The next major support is 1.2100. Any more losses might call for a test of the 1.2000 support.
On the upside, the pair might face resistance near 1.2350. The next resistance is near 1.2385. An upside break above the 1.2385 zone could send the pair toward 1.2430. Any more gains might open the doors for a test of 1.2500.
USD/CAD Technical Analysis
On the hourly chart of USD/CAD at FXOpen, the pair rallied toward the 1.3900 resistance zone before the bears appeared. The US Dollar formed a high near 1.3899 and recently declined below the 1.3765 support against the Canadian Dollar.
The pair even tested the 1.3636 zone and recently started a recovery wave. It broke a major bearish trend line with resistance near 1.3660.
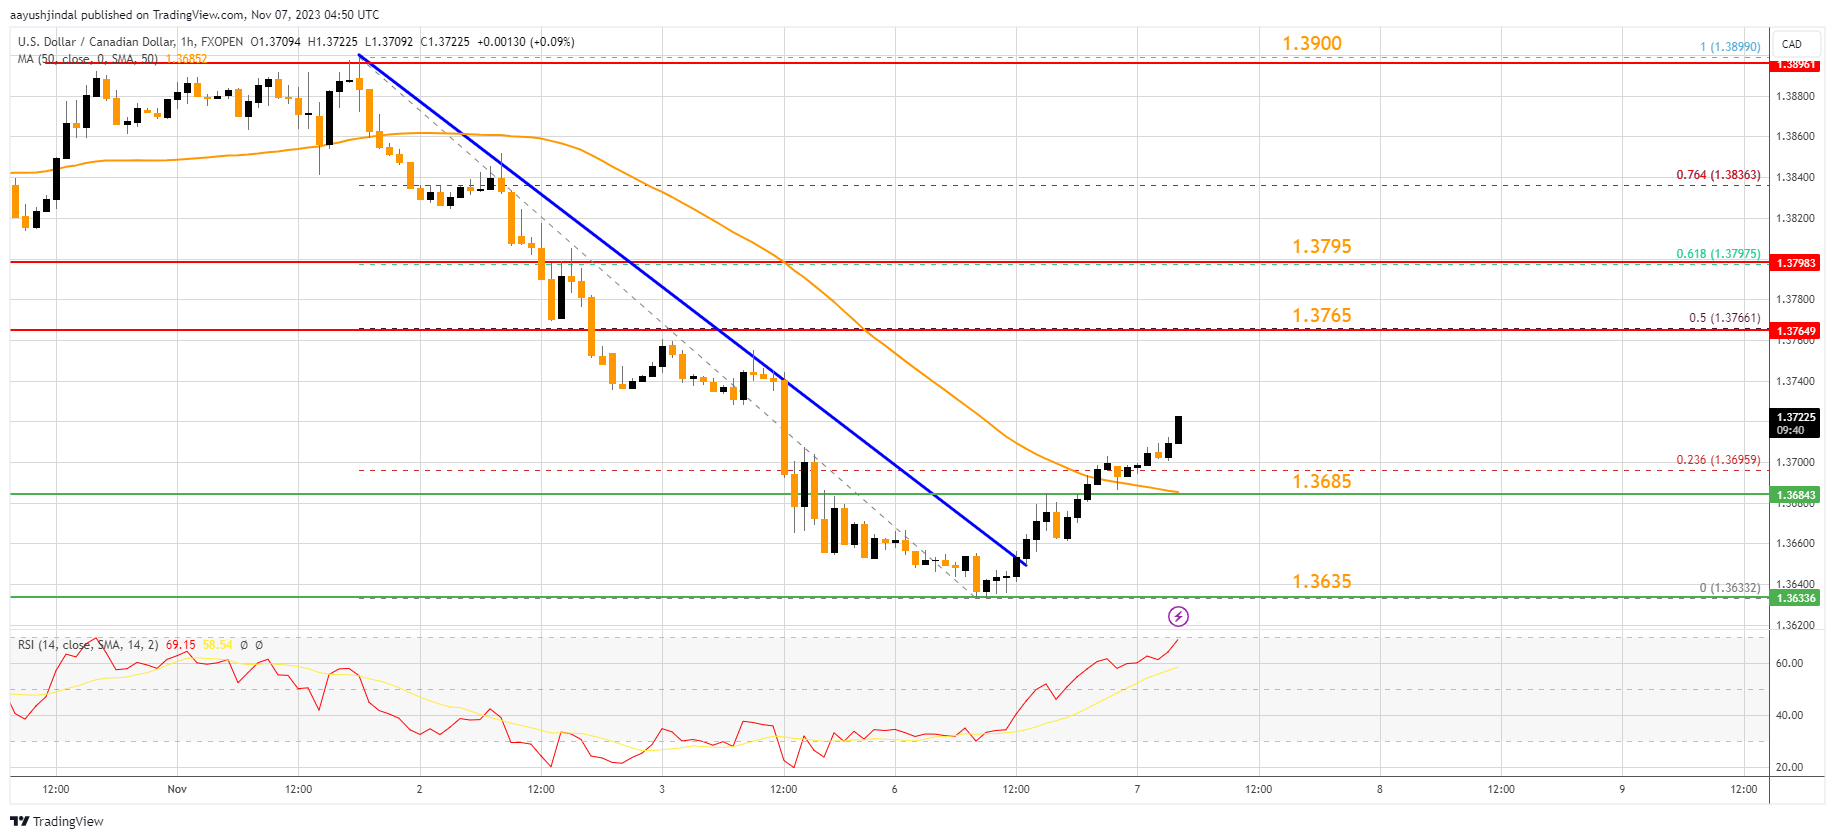
There was a move above the 50-hour simple moving average and the 23.6% Fib retracement level of the downward move from the 1.3900 swing high to the 1.3633 low. The pair is now showing positive signs and might aim for more upsides.
Immediate resistance is near the 50% Fib retracement level of the downward move from the 1.3900 swing high to the 1.3633 low at 1.3765. The next key resistance on the USD/CAD chart is 1.3795.
If there is an upside break above 1.3795, the pair could rise toward the 1.3900 resistance. The next major resistance is near the 1.3920 level, above which it could rise steadily toward the 1.4000 resistance zone.
If not, the pair might decline again. Immediate support is near the 50-hour simple moving average at 1.3685. The first major support is 1.3635. A close below the 1.3635 level might trigger a strong decline. In the stated case, USD/CAD might test 1.3550. Any more losses may possibly open the doors for a drop toward the 1.3500 support.
Trade global forex with the Innovative Broker of 2022*. Choose from 50+ forex markets 24/5. Open your FXOpen account now or learn more about trading forex with FXOpen.
* FXOpen International, Innovative Broker of 2022, according to the IAFT
This article represents the opinion of the Companies operating under the FXOpen brand only. It is not to be construed as an offer, solicitation, or recommendation with respect to products and services provided by the Companies operating under the FXOpen brand, nor is it to be considered financial advice.
Stocks Continue to Climb: Nasdaq’s Impressive Winning Streak
The stock market saw modest gains on Monday, building upon the robust rally it experienced last week. The Nasdaq Composite, in particular, achieved its lengthiest positive streak since January, marking a significant milestone for the tech-heavy index.
Closing the day at 13,518.78, the Nasdaq surged by 0.3%. Meanwhile, the S&P 500 inched up 0.18%, settling at 4,365.98. The Dow Jones Industrial Average displayed a subtle increase, gaining 34.54 points, equivalent to 0.1%, and concluding at 34,095.86.
The market's current demeanour can be attributed to its endeavour to assimilate the substantial rally from the previous week. As it pauses to consolidate recent gains, investors eagerly await the emergence of the next bullish catalyst. This catalyst could potentially be influenced by the decisions of Federal Reserve policymakers, particularly Jerome Powell, or by the forthcoming corporate earnings season.
In a notable streak, the Nasdaq Composite logged seven consecutive days of gains, a feat unseen since January. In tandem, the Dow and S&P 500 secured their sixth consecutive day of growth, a remarkable achievement given that this had not occurred since July and June, respectively.
Investor sentiment was bolstered by a surge of optimism from Bank of America, propelling Nvidia's shares by approximately 1.7%. Conversely, Bumble faced a 4.4% dip in its shares following the announcement of its CEO's resignation scheduled for January. On the flip side, SolarEdge Technologies experienced a 5.1% decline after Wells Fargo issued a downgrade.
Yields, in contrast to last week's trend, displayed an upward trajectory, with the 10-year Treasury yield registering a 9-basis point increase, reaching approximately 4.653%.
The stock market's performance during the past week marked the strongest of 2023. The Dow secured its most substantial weekly gain since October 2022, while the S&P and Nasdaq both celebrated their most impressive weeks since November 2022. Contributing to this surge was a soft monthly jobs report that lowered bond yields, providing a boost to equities.
November has witnessed a robust start in the stock market, coinciding with the prevalent sentiment indicators. Although the surge in yields had prompted concerns, the hope remains that the impact on US equities may be limited.
The upcoming week is anticipated to bring a lull in economic data and company earnings releases.
However, seasonal tailwinds might serve as a driving force behind the stock market's recovery. November is renowned as the best-performing month for the S&P, according to the Stock Traders' Almanac. LPL Financial's Adam Turnquist noted that it also heralds the commencement of the market's most lucrative six-month return period since 1950. On average, the S&P has yielded a 7% return from November through April during this period.
While earnings season is winding down, investors are keenly awaiting updates from prominent companies like Walt Disney, Wynn, MGM Resorts, and Occidental Petroleum.
Furthermore, Federal Reserve Chair Jerome Powell is set to make two appearances in the coming days. Last week, the central bank chose to maintain the current interest rates for the second consecutive meeting, primarily in response to declining bond yields. Investors are closely monitoring the possibility of the Fed's rate-hiking campaign drawing to a close.
This article represents the opinion of the Companies operating under the FXOpen brand only. It is not to be construed as an offer, solicitation, or recommendation with respect to products and services provided by the Companies operating under the FXOpen brand, nor is it to be considered financial advice.