

Sample Category Title
RBA Hikes, China Trade Data Disappoints
Market movers today
Today we have a light calendar with no tier-1 data releases.
In the euro area, we receive September PPI figures. Producer prices have dropped like a stick this year after the sharp increases last year. In August, the index fell 11.5% and consensus looks for a further decline to 12.5% y/y in September.
In Germany, industrial production figures for September are due. The figures are interesting since GDP declined less than expected in Q3. If industrial production comes in weaker than expected Q3 GDP growth might be revised slightly down.
The 60 second overview
Fed SLOOS: The Fed's Q3 Senior Loan Officer Opinion Survey (SLOOS) showed that a somewhat lower share of US banks' reported tightening lending standards for commercial and industrial (C&I) loans compared to Q1 and Q2. Similarly, fewer banks reported weaker demand, although the share of banks reporting a recovery in loan demand also remained low. Lending standards for commercial real estate sector (CRE) continued tightening, as was the case for most consumer lending as well. Overall credit conditions still remain clearly restrictive, even if the pace of tightening is moderating towards the end of the policy rate hiking cycle. As financial conditions continued to tighten over the survey period, an increasing number of FOMC participants have now signalled that policy rate hikes are likely over. Last night, the Fed's Lisa Cook echoed her colleagues' recent commentary saying that she 'hopes that current policy settings are restrictive enough'.
RBA: The Reserve Bank of Australia (RBA) hiked the Cash Rate by 25bp to 4.35% this morning after four consecutive holds in previous meetings. The decision followed an upside surprise in Q3 CPI, and RBA saw especially the sticky services inflation increasing the risk of price pressures becoming more persistent than anticipated. That said, its forward guidance was somewhat more dovish than earlier, as the statement no longer indicated that 'further tightening may be required'. The door for hiking the policy rate is still open, but given the recent tightening in global financial conditions, we think the RBA is likely to remain on hold from here. The hike was widely anticipated by the consensus and mostly priced in by the markets ahead of the meeting, and the initial uptick in AUD/USD faded quickly. We still maintain a downward-sloping forecast profile for the cross in 12m horizon (0.62).
China: The October international trade data overnight was a mixed bag. Imports recovered more than expected (+3.0% y/y, consensus -4.8%), which could suggest that the recent policy easing is supporting domestic demand. But in contrast, exports fell more sharply than anticipated (-6.4% y/y, consensus -3.3%), as tightening financial conditions are restricting demand elsewhere. Overall trade balance weakened, with surplus declining to USD56.5 billion (from USD77.7).
Equities: Global equities were higher yesterday as the optimism from last week continued. However, the move in yields yesterday was not the driver of optimism but rather the expectation that peak yields are behind us. It is interesting to see in surveys how investors fear inflation less and less every month (Sentix yesterday). The turnaround in yields yesterday gave headwinds to REITs and small caps while the massive underperformance of defensives we saw last week paused. In US Dow +0.1%, S&P 500 +0.2%, Nasdaq +0.3% and Russell 2000 (1.29%). Sentiment in Asia much sourer this morning as volatile Chinese export data underwhelms. Futures in Europe and US are lower as well.
FI: European yield curves steepened from the long end with 30y Bunds up by 9bp on the day. This follows from the setback in yields seen last week and in particular following the FOMC meeting on Wednesday. The move was mostly observed in the cash bond space with EUR swap rates only partially following the move. 10y Bund ASW spread tightened 2.7bp to 52.9bp, which is a level not observed since early 2022. ECB's Holzmann tried to push back on the dovish pricing in markets as he said that ECB should be ready to hike if needed. He also said that QT is not coming this year via end of PEPP reinvestments. Amid this, real rates were slightly lower on the day.
FX: The G10 FX market digested last week's data and big central bank meetings on Monday. CHF, USD and EUR posted small gains vis-à-vis JPY, AUD, NZD and CAD. EUR/USD traded above 1.07 and USD/JPY below 150.
Credit: Secondary credit markets had a relatively uneventful day with muted activity. iTraxx Main was 1bp wider at 78bp while iTraxx Xover widened 5bp to 418vp. On a positive note the primary market activity was relatively high with a number of new issues - among others from Danone, Suez SACA and EPH Financing International. Furthermore, we saw financial issuance from the likes of Danske Bank, BNP Paribas SA, Deutsche Bank and Swedbank. Overall issuers took advantage of slightly improved market conditions and a clearer calendar to come to the market.
Nordic macro
Sweden: The SNDO publishes October figures for the Swedish budget balance (CET 8:00). Their own forecast from two weeks ago indicates a deficit of SEK4bn for the month. The 2023 full-year forecast was revised higher to a surplus of SEK31bn, up from a deficit of SEK15bn. For the coming two years the SNDO expect a deficit of SEK 49bn and SEK 60bn, respectively. Deputy Governor Martin Flodén will discuss the Riksbank's view of the economy and work on monetary policy in a troubled world tomorrow at CET 15:10.
EUR/USD Daily Outlook
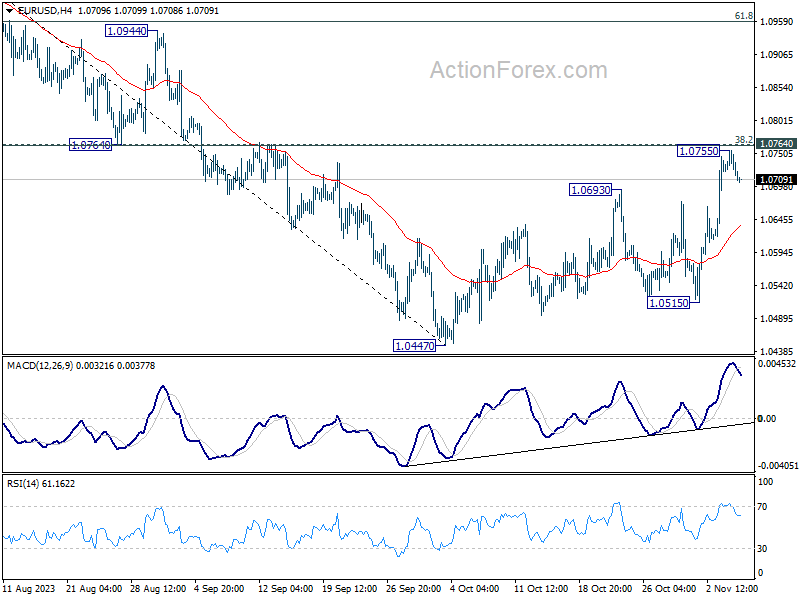
Daily Pivots: (S1) 1.0703; (P) 1.0730; (R1) 1.0743; More...
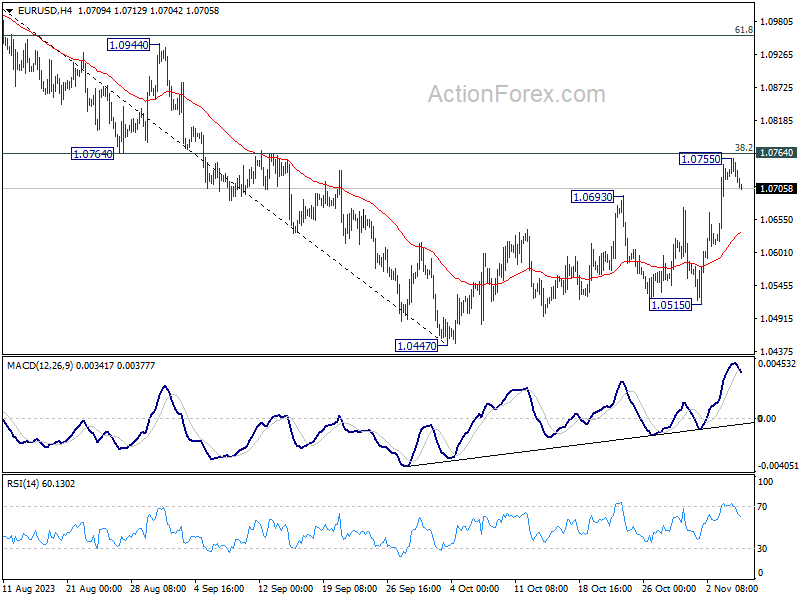
Intraday bias in EUR/USD is turned neutral with current retreat, and some consolidations could be seen. But further rally is in favor as long as 55 4H EMA (now at 1.0637) holds. Decisive break of 1.0764 cluster resistance (38.2% retracement of 1.1274 to 1.0447 at 1.0763) will extend the rise from 1.0447 to 61.8% retracement at 1.0958 next. However, sustained break of 55 4H EMA will argue that the rebound has completed, and target 1.0515 support, and then 1.0447 low.
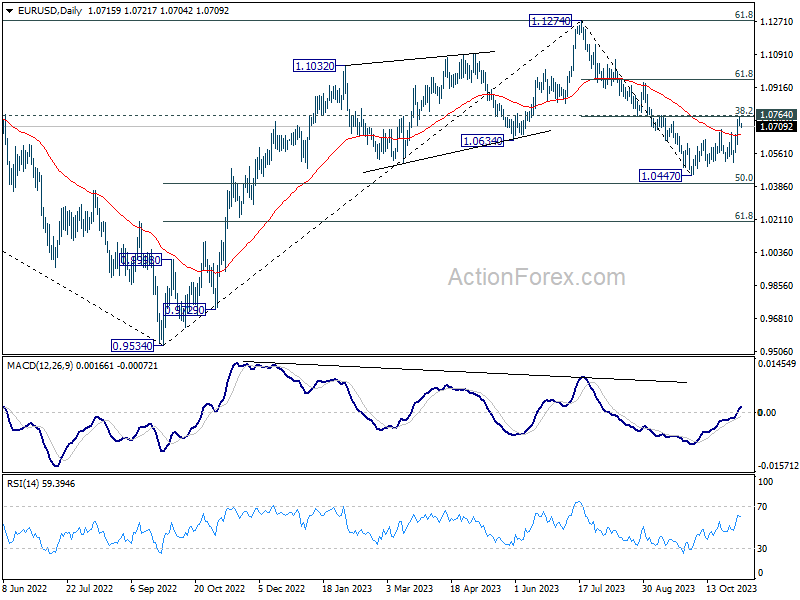
In the bigger picture, price actions from 1.1274 are viewed as a corrective pattern to rise from 0.9534 (2022 low). Rise from 1.0447 is tentatively seen as the second leg. Hence while further rally could be seen, upside should be limited by 1.1274 to bring the third leg of the pattern.
GBP/USD Daily Outlook
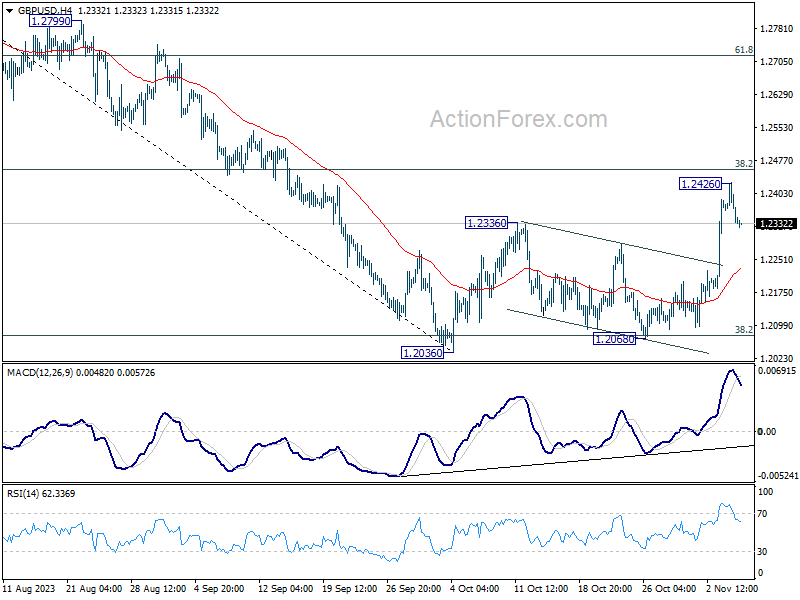
Daily Pivots: (S1) 1.2312; (P) 1.2370; (R1) 1.2402; More
Intraday bias in GBP/USD is turned neutral with current retreat and some consolidations could be seen first. Further rise is in favor as as long as 4H 55 EMA (now at 1.2223) holds. Decisive break of 38.2% retracement of 1.3141 to 1.2036 at 1.2458 will pave the way to 61.8% retracement at 1.2783. However, sustained break of 4H 55 EMA will revive near term bearishness and bring retest of 1.2036 low.
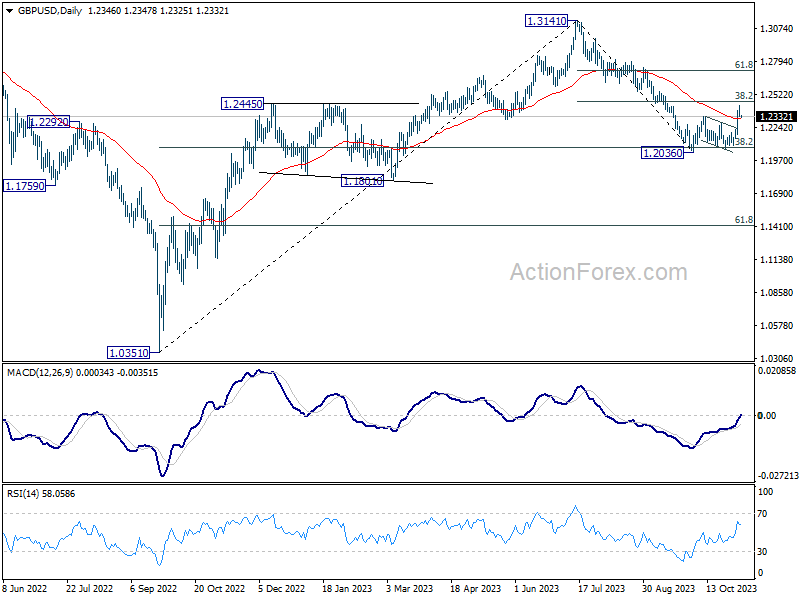
In the bigger picture, the strong rebound from 38.2% retracement of 1.0351 to 1.3141 at 1.2075 argues that price action from 1.3141 are merely a correction to rise from 1.0351 (2022 low). Current rally from 1.2036 is tentatively seen as the second leg of the pattern. Hence, while further rally is in favor, upside should be limited by 1.3141 to start the third leg.
USD/CHF Daily Outlook
Daily Pivots: (S1) 0.8967; (P) 0.8982; (R1) 0.9010; More....
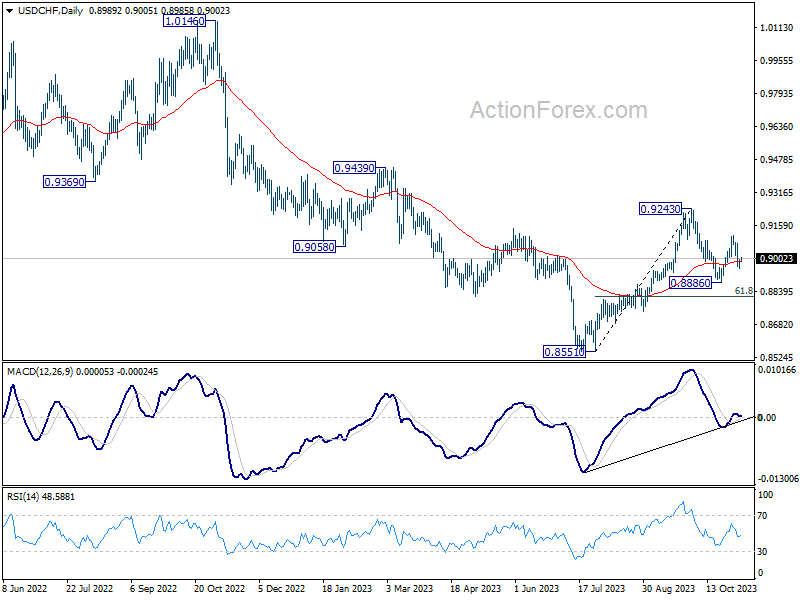
Intraday bias in USD/CHF is turned neutral with current recovery. On the downside, below 0.8952 will target a test on 0.8886 support first. Break there will resume whole decline from 0.9243 to 0.8815 fibonacci level. However, break of 0.9111 will resume the rebound from 0.8886 instead, and target 0.9243 resistance.
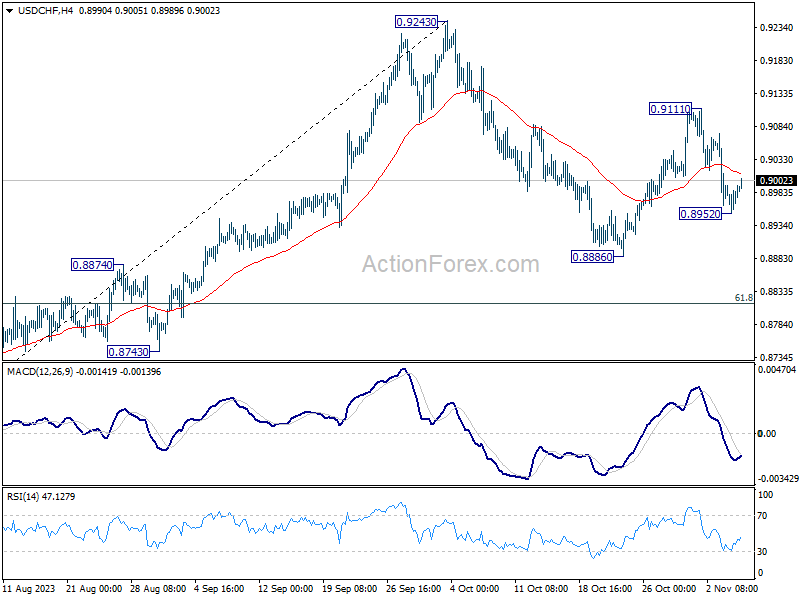
In the bigger picture, outlook is mixed up by the deeper than expected pull back from 0.9243. Yet there was no follow through selling after hitting 0.8886. On the upside, break of 0.9243 resistance will revive the case of medium term bottoming at 0.8851, and turn outlook bullish. However, sustained break of 61.8% retracement of 0.8551 to 0.9243 at 0.8815 will argue that larger decline from 1.0146 is ready to resume through 0.8551 low.
USD/JPY Daily Outlook
Daily Pivots: (S1) 149.59; (P) 149.83; (R1) 150.33; More...
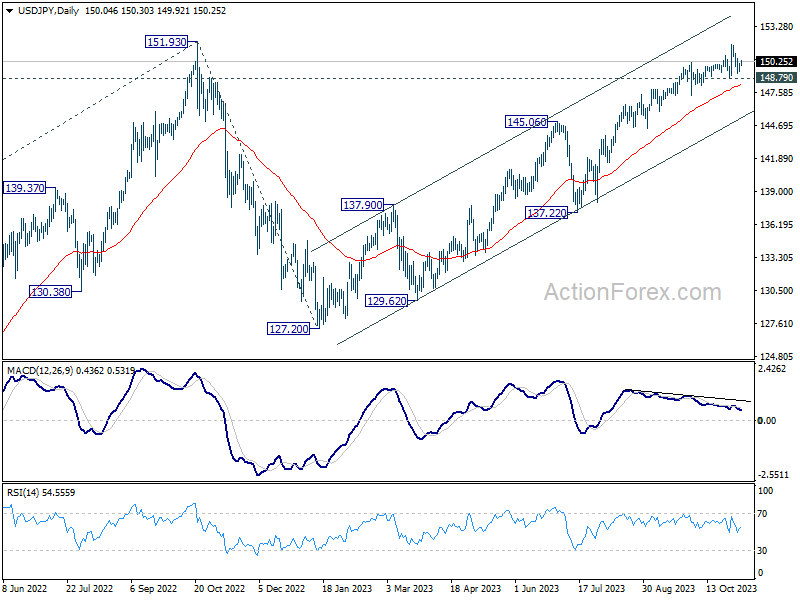
Intraday bias in USD/JPY stays neutral as consolidation from 151.69 is extending. Further rally is expected as long as 148.79 support holds. Firm break of 151.69 high will resume larger up trend. However, decisive break of 148.79 will indicate rejection by 151.93 key resistance, and bring deeper fall through 147.28 support.
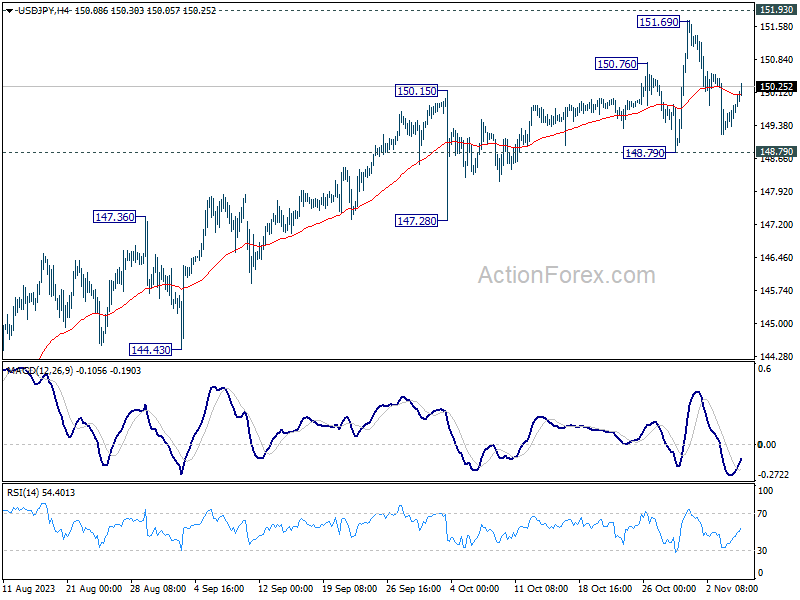
In the bigger picture, immediate focus is on 151.93 resistance (2022 high). Rejection by 151.93, followed by sustained break of 145.06 resistance turned support will argue that rise from 127.20 has completed, and turn outlook bearish for 137.22 support and below. However, sustained break of 151.93 will confirm resumption of long term up trend. Next target will be 61.8% projection of 102.58 to 151.93 from 127.20 at 157.69.
USD/CAD Daily Outlook
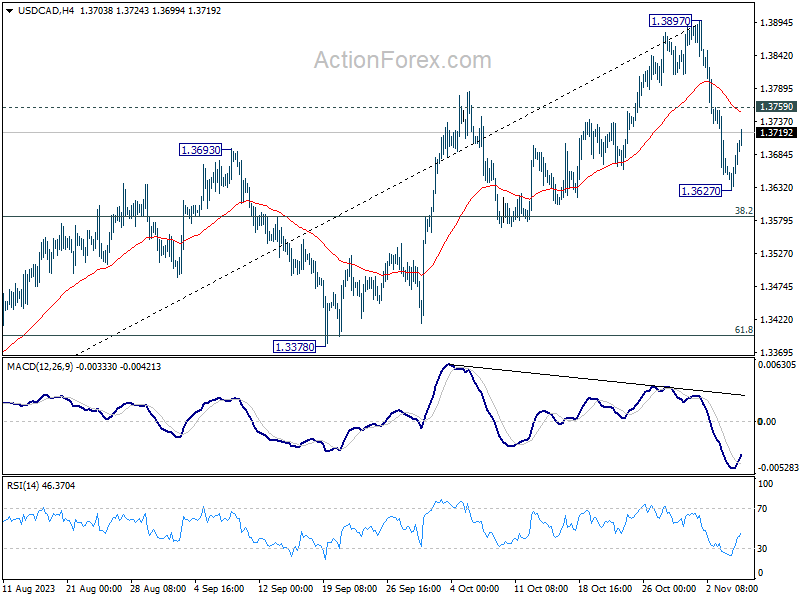
Daily Pivots: (S1) 1.3652; (P) 1.3678; (R1) 1.3725; More...
Intraday bias in USD/CAD is turned neutral first with current recovery. While fall from 1.3897 might still extend further, strong support should be seen from 38.2% retracement of 1.3091 to 1.3897 at 1.3589 to bring rebound. On the upside, above 1.3759 minor resistance will bring retest of 1.3897. However, sustained break of 1.3589 will bring deeper fall to 61.8% retracement at 1.3399 instead.
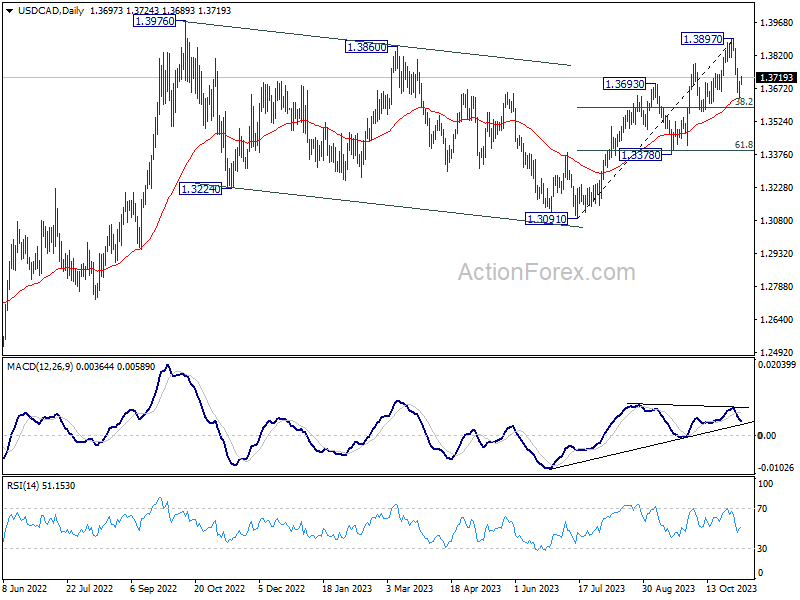
In the bigger picture, corrective pattern from 1.3976 (2022 high) should have completed with three waves down to 1.3091. Decisive break of 1.3976 high will confirm resumption of up trend from 1.2005 (2021 low). This will now remain the favored case as long as 1.3378 support holds. However, firm break of 1.3378 will argue that the pattern from 1.3976 is indeed still extending.
Technical Outlook and Review
DXY:
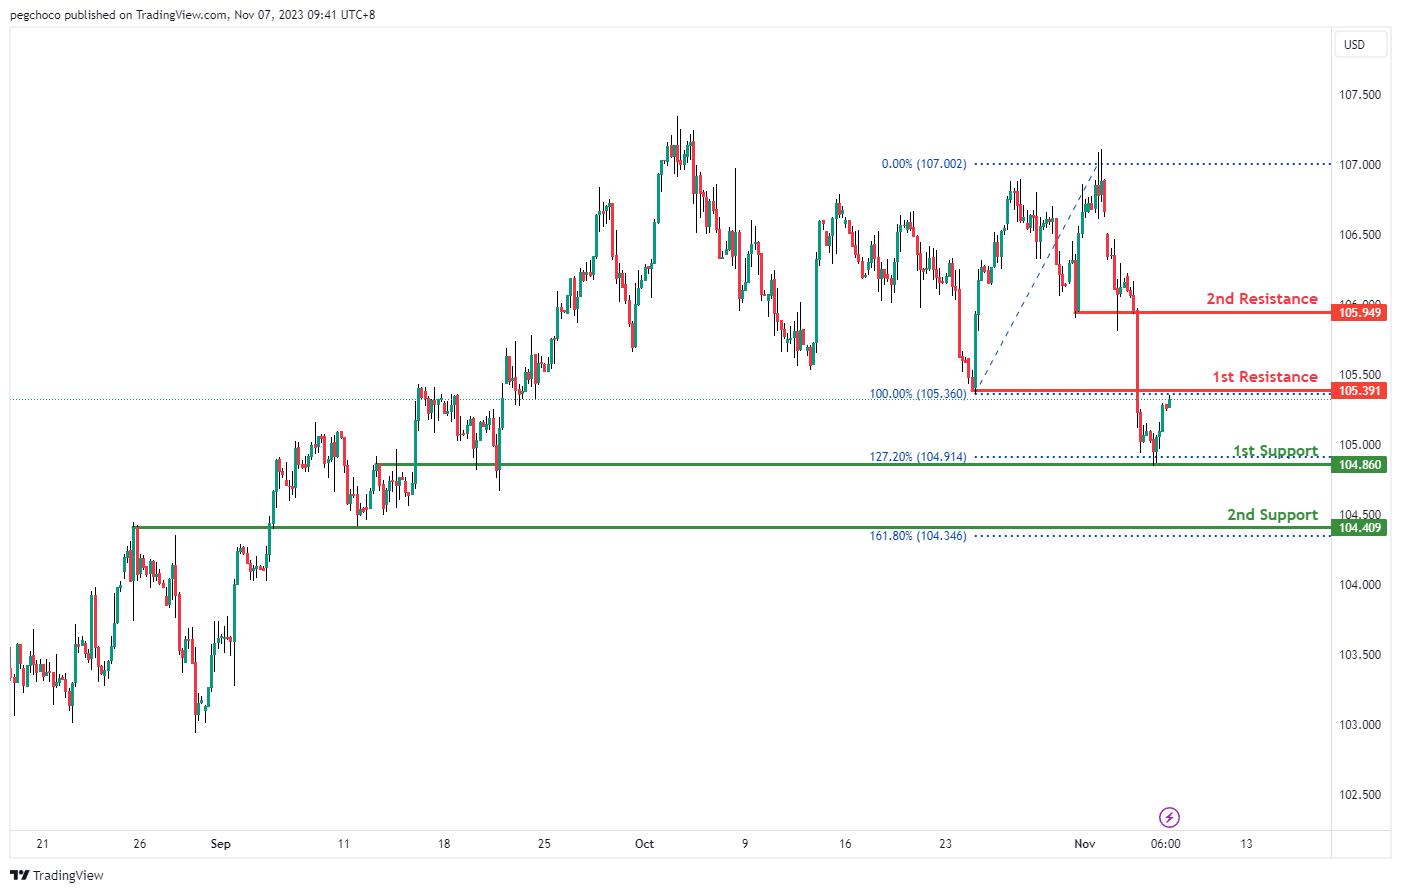
The DXY (US Dollar Index) chart currently has a bearish overall momentum, suggesting the potential for a bearish reaction off the 1st resistance and a drop towards the 1st support.
The 1st support at 104.86 is identified as an overlap support, and it also aligns with the 127.20% Fibonacci Extension level, indicating it could be a significant level where the price might find some buying interest.
The 2nd support at 104.40 is considered an overlap support as well, and it coincides with the 161.80% Fibonacci Extension level, further reinforcing its potential as a support level.
On the resistance side, the 1st resistance at 105.39 is categorized as a pullback resistance, suggesting it could act as a level where the price may face selling pressure.
The 2nd resistance at 105.94 is also identified as a pullback resistance, indicating another potential level where the price may encounter obstacles in its upward movement.
EUR/USD:
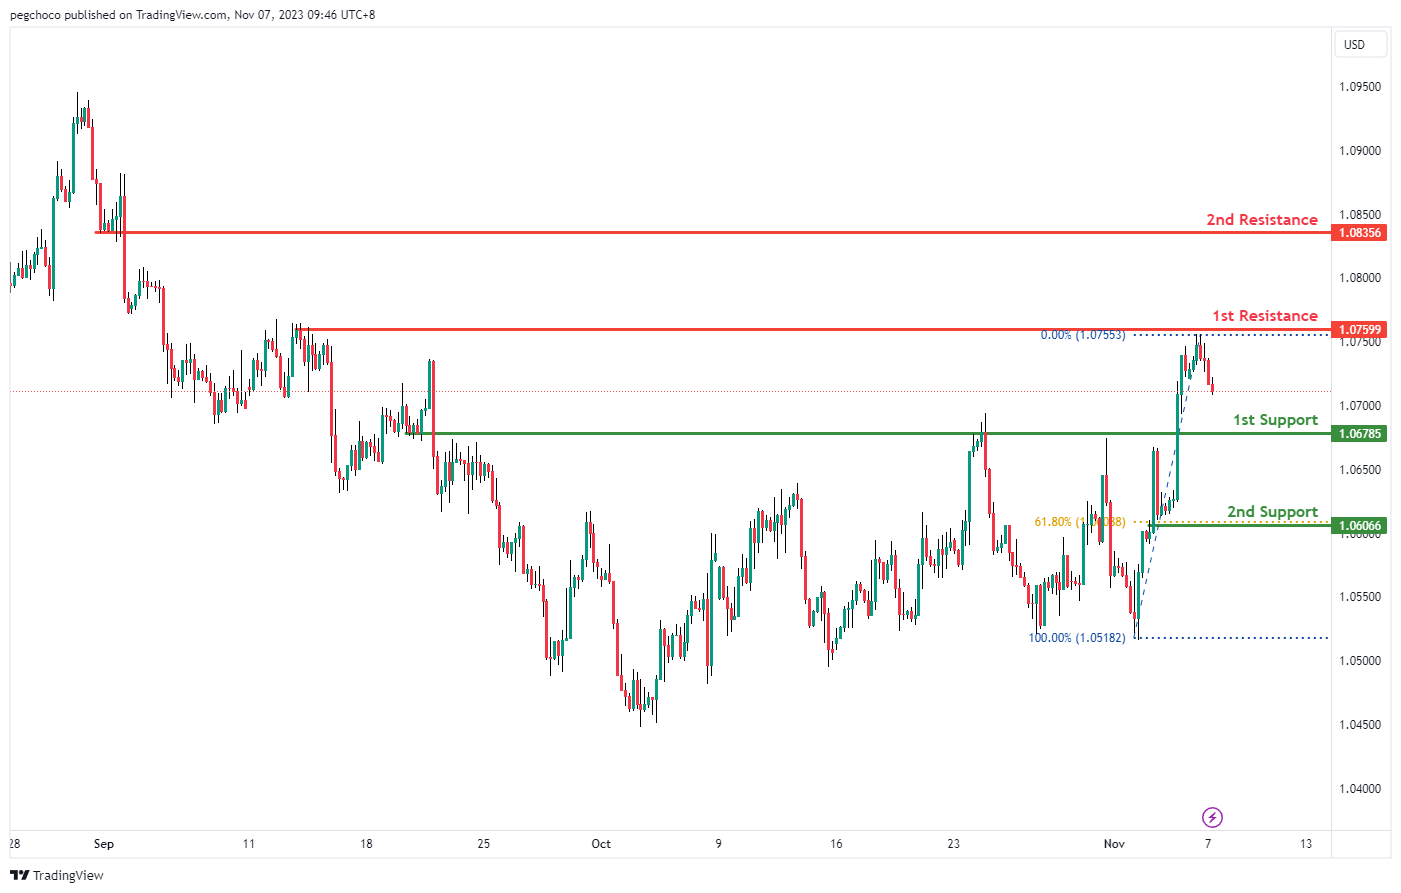
The EUR/USD chart currently has a bearish overall momentum, suggesting the potential for a bearish continuation towards the 1st support.
The 1st support at 1.0678 is identified as a pullback support, indicating it could be a significant level where the price might find some buying interest.
The 2nd support at 1.0606 is also considered a support level, and it coincides with the 61.80% Fibonacci Retracement level, further reinforcing its potential as a support zone.
On the resistance side, the 1st resistance at 1.0759 is categorized as a multi-swing high resistance, suggesting it could act as a level where the price may face selling pressure.
The 2nd resistance at 1.0835 is identified as a pullback resistance, indicating another potential level where the price may encounter obstacles in its upward movement.
EUR/JPY:
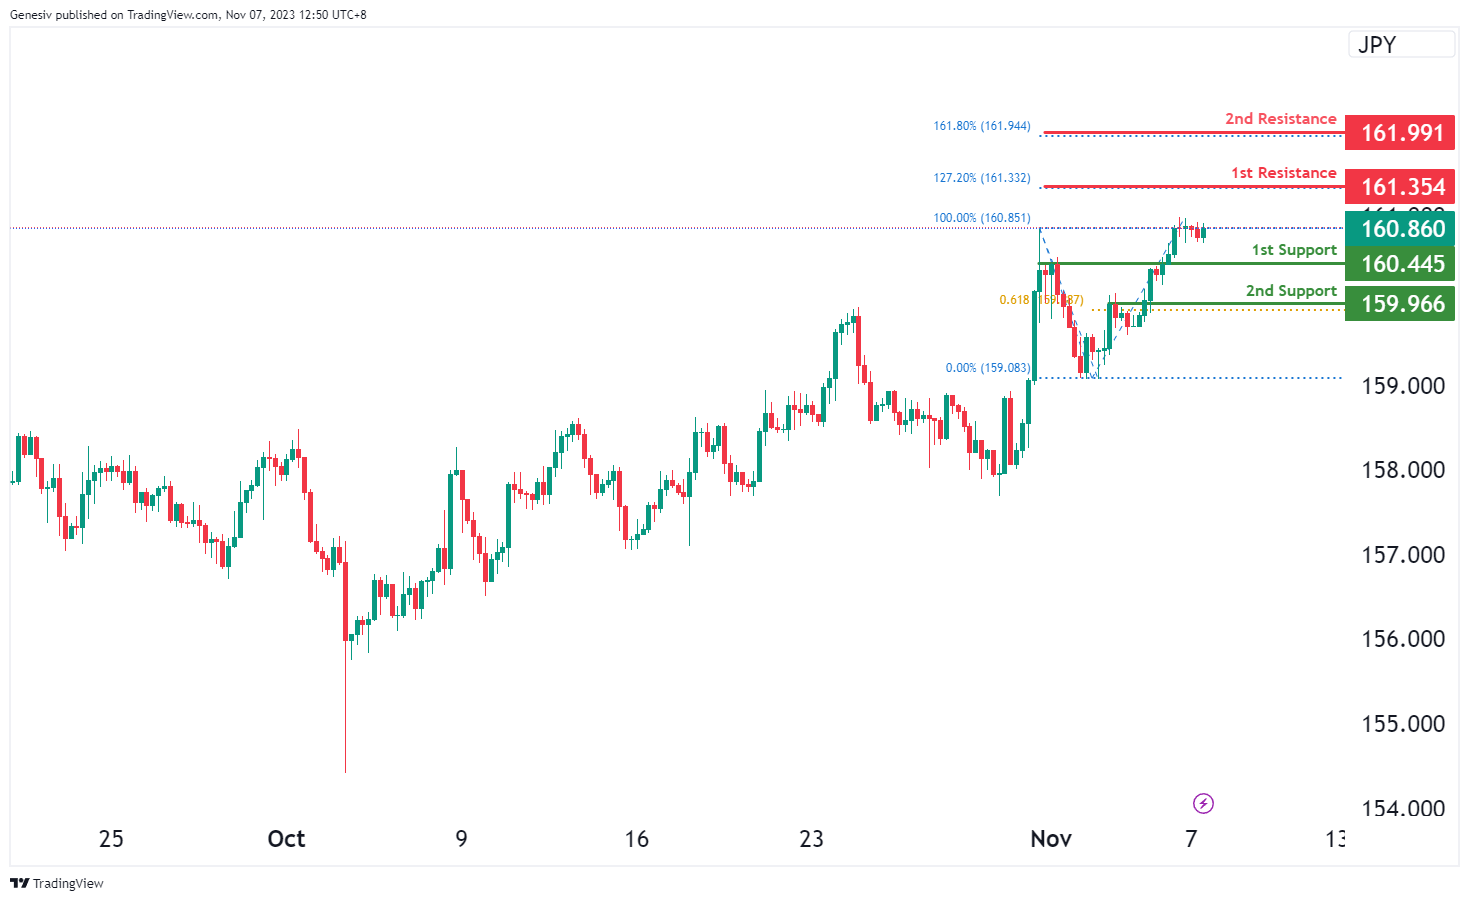
For EUR/JPY, with a current bearish momentum, there’s a potential scenario of a short-term rise towards the first resistance, followed by a reversal and potential drop towards the first support.
The first support at 160.45 is recognized as a level of pullback support, indicating a point where the price might find support during a potential retracement in the bearish trend.
The second support at 159.96 is also identified as pullback support and coincides with the 61.80% Fibonacci Projection, suggesting it as an additional level of potential support.
On the resistance side, the first resistance at 161.35 is associated with the 127.20% Fibonacci Extension, indicating a significant level that might act as a barrier to the price’s upward movement in the short term within the current bearish context.
Moreover, the second resistance at 161.99 aligns with the 161.80% Fibonacci Extension, suggesting it as another significant level that could potentially hinder the price’s upward movement within the prevailing bearish trend.
EUR/GBP:
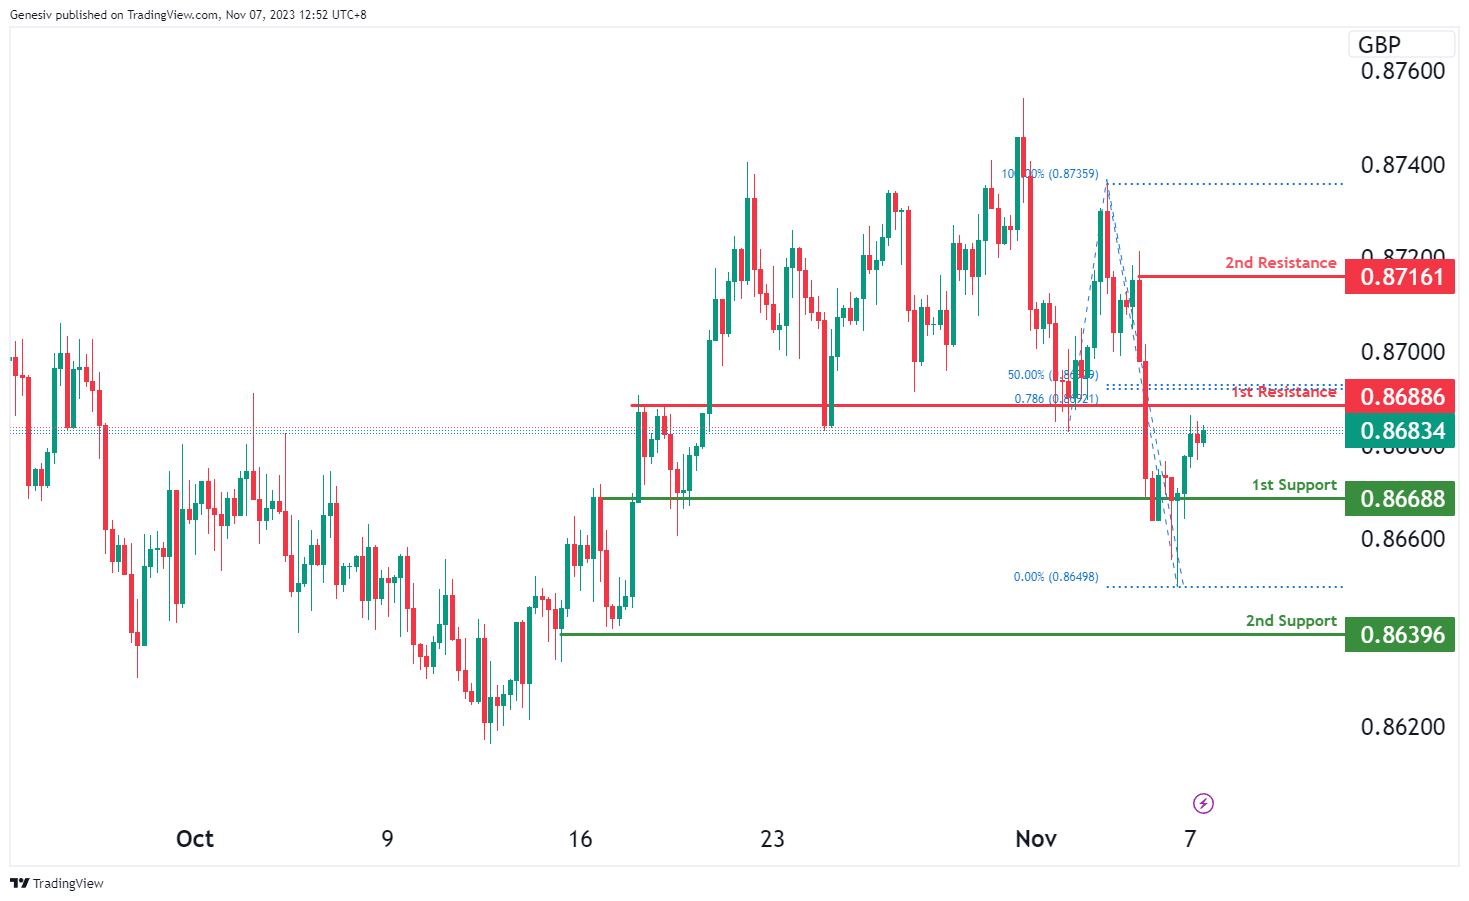
For EUR/GBP, with the chart’s current bearish momentum, there’s a potential scenario where the price might rise towards the first resistance in the short term, followed by a reversal and a potential drop towards the first support.
The first support at 0.8668 is identified as a level of pullback support, suggesting a point where the price might find support during a potential retracement in the bearish trend.
The second support at 0.8639 is recognized as multi-swing low support, indicating an additional level that might offer support during the bearish trend.
On the resistance side, the first resistance at 0.8688 is characterized as pullback resistance, aligning with both the 50% Fibonacci Retracement and the 78.60% Fibonacci Projection. This indicates a confluence of Fibonacci levels, making it a significant barrier to the price’s upward movement in the short term within the prevailing bearish context.
Furthermore, the second resistance at 0.8716 is identified as a swing high resistance, suggesting it as an additional level that could impede the price’s upward movement within the current bearish trend.
GBP/USD:
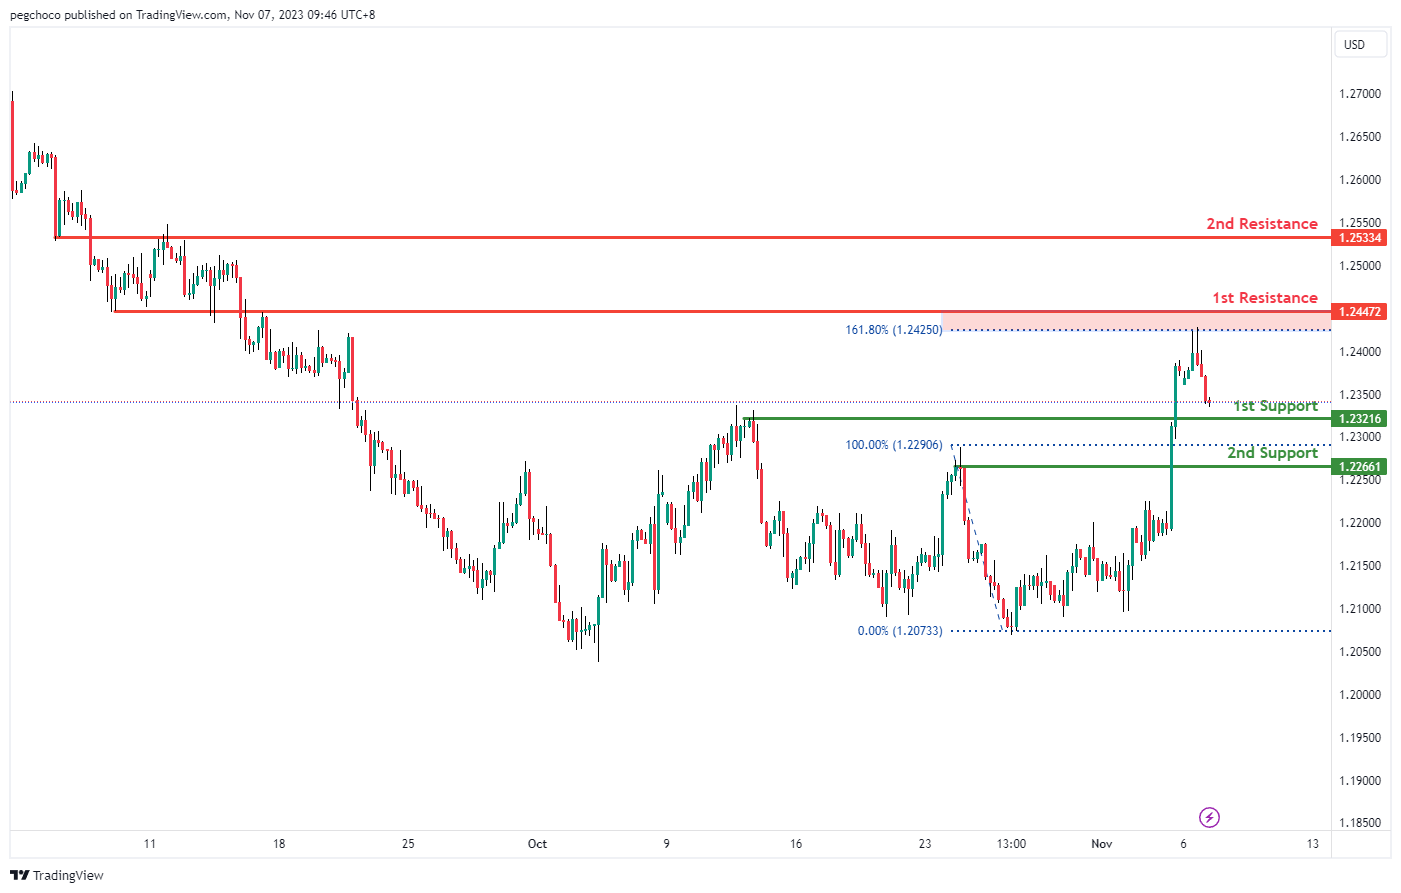
The GBP/USD chart currently has a bearish overall momentum, suggesting the potential for a bearish continuation towards the 1st support.
The 1st support at 1.2321 is identified as a pullback support, indicating it could be a significant level where the price might find some buying interest.
The 2nd support at 1.2266 is also considered a pullback support, adding to the potential support zone.
On the resistance side, the 1st resistance at 1.2447 is categorized as an overlap resistance, and it coincides with the 161.80% Fibonacci Extension level, suggesting it could act as a level where the price may face selling pressure.
The 2nd resistance at 1.2533 is also identified as an overlap resistance, further reinforcing its potential as a resistance level.
GBP/JPY:
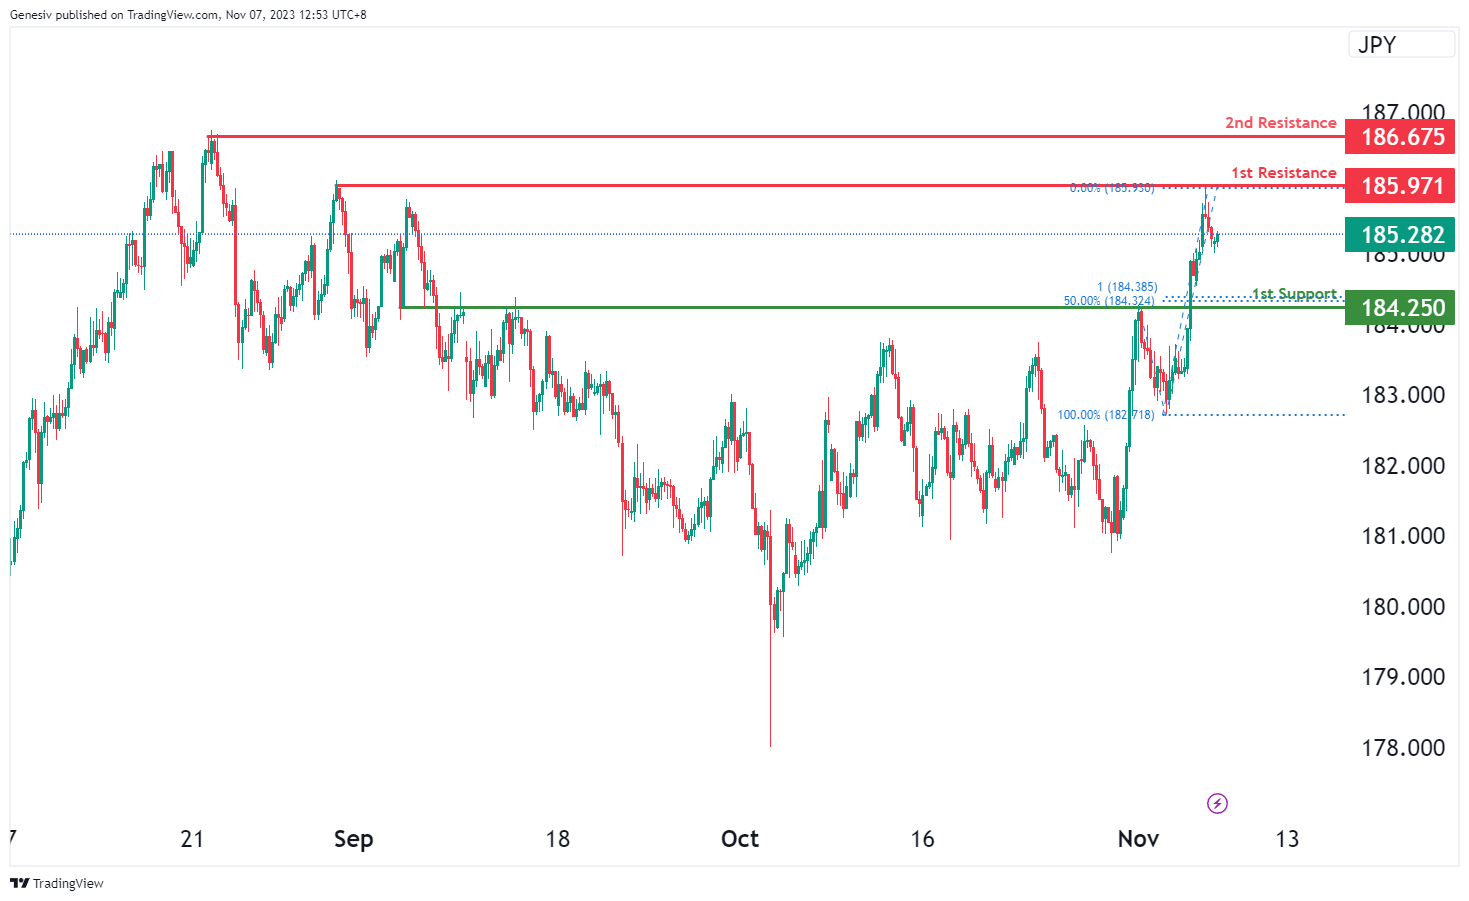
For GBP/JPY, with the prevailing bearish momentum, there’s a potential scenario for a bearish continuation towards the first support.
The first support at 184.25 is identified as a level of pullback support and aligns with both the 50% Fibonacci Retracement and the 100% Fibonacci Projection, indicating a confluence of Fibonacci levels. This signifies it as a crucial area where the price might find substantial support during the bearish movement.
On the resistance side, the first resistance at 185.97 is characterized as multi-swing high resistance, indicating a significant barrier to the price’s downward movement within the current bearish scenario.
Additionally, the second resistance at 186.67 is recognized as a swing high resistance, suggesting it as an additional significant obstacle to the price’s downward movement within the prevailing bearish trend.
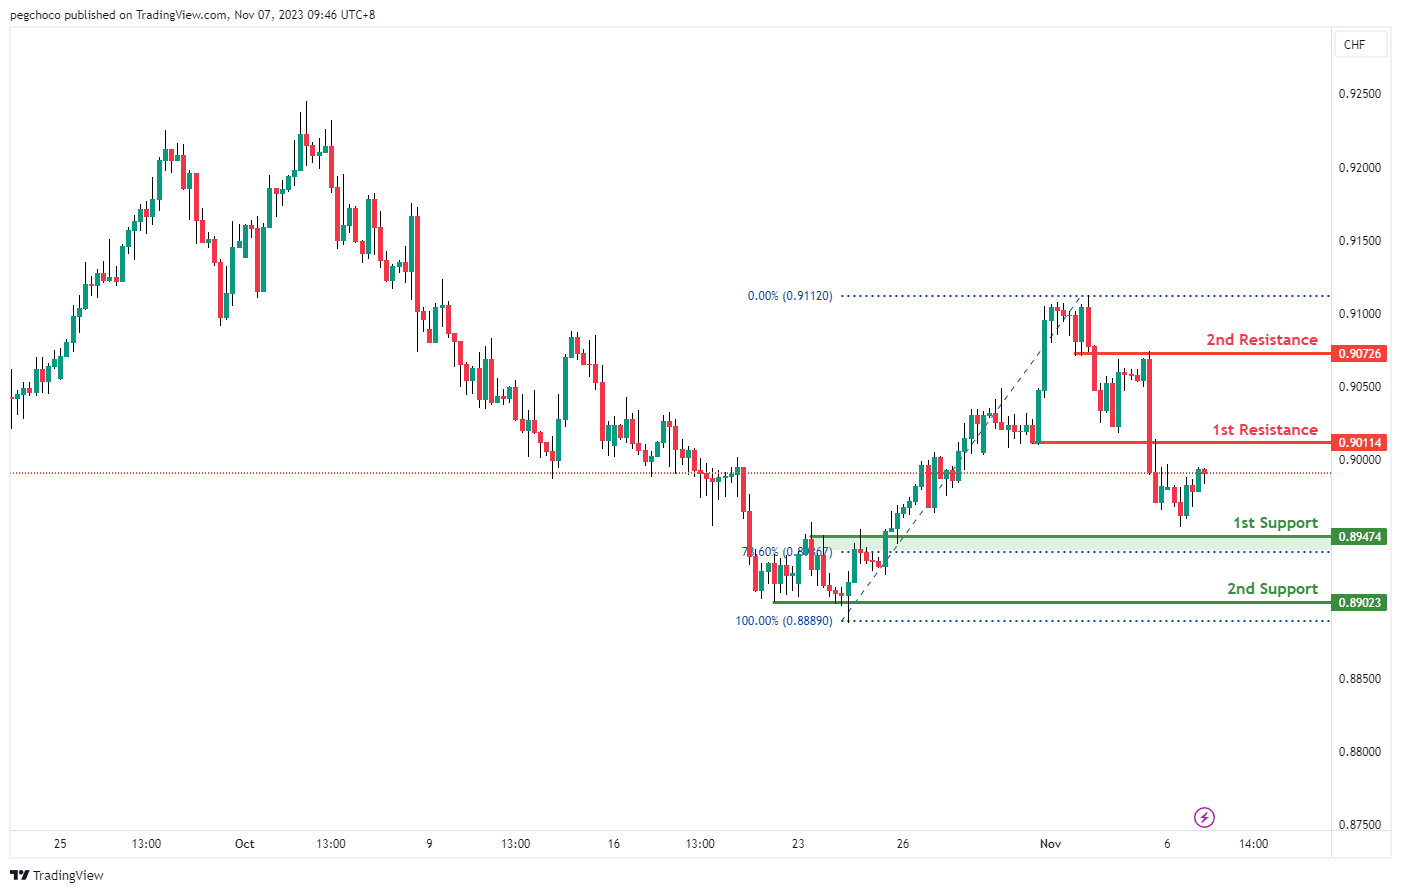
USD/CHF:
The USD/CHF chart currently has a bullish overall momentum, suggesting the potential for a bullish continuation towards the 1st resistance.
The 1st support at 0.8947 is identified as an overlap support, and it coincides with the 78.60% Fibonacci Retracement level, indicating it could be a significant level where the price might find buying interest.
The 2nd support at 0.8902 is categorized as a multi-swing low support, further reinforcing its potential as a support level.
On the resistance side, the 1st resistance at 0.9011 is also identified as an overlap resistance, and it marks a potential level where the price may face selling pressure.
The 2nd resistance at 0.9072 is categorized as another overlap resistance, adding to the potential resistance zone.
USD/JPY:
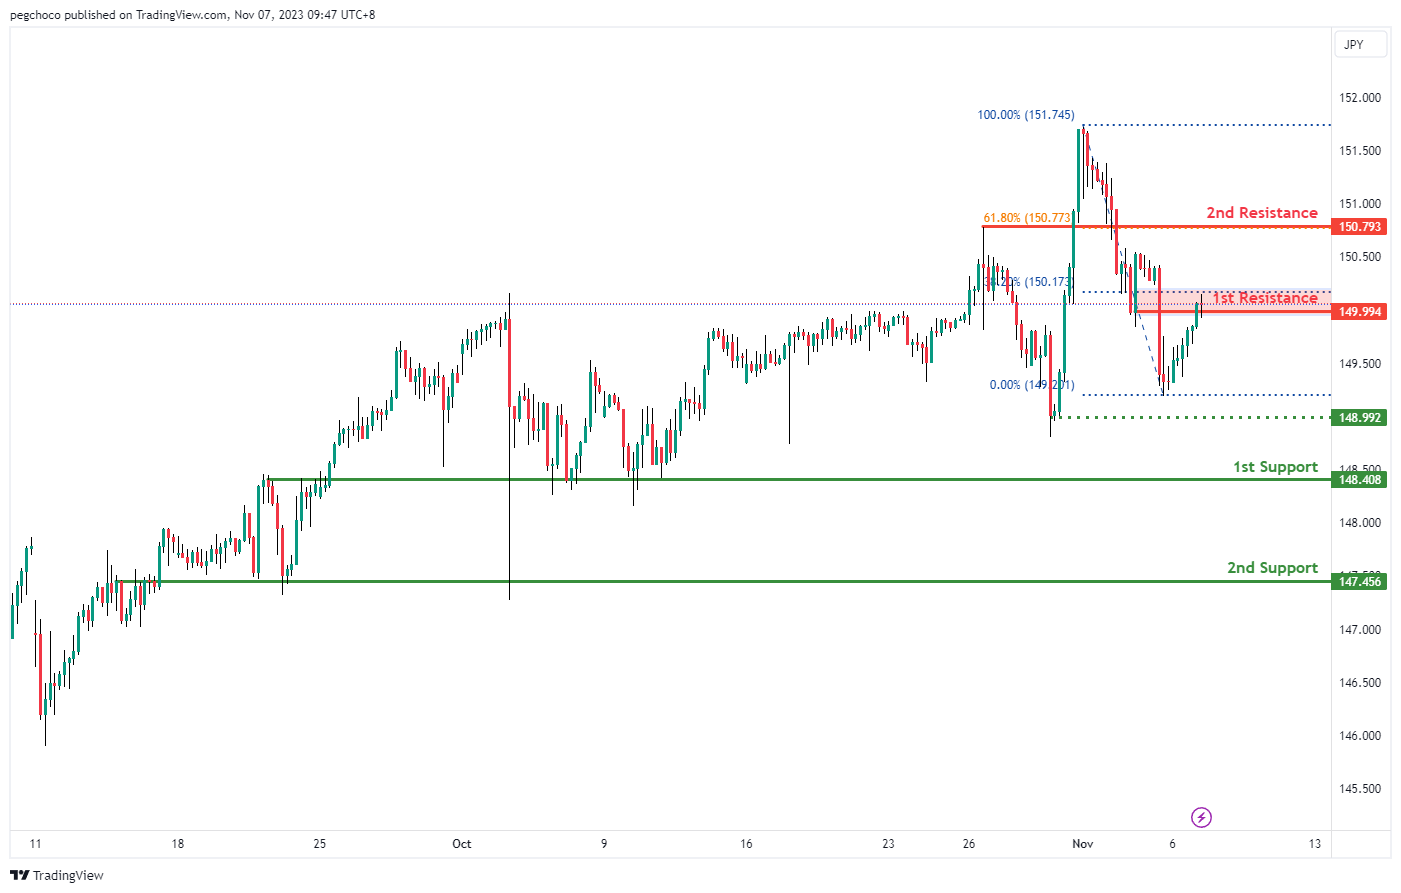
The USD/JPY chart currently has a bearish overall momentum, suggesting the potential for a bearish reaction off the 1st resistance level and a drop towards the 1st support level.
The 1st support at 148.40 is identified as an overlap support, indicating it could be a significant level where the price might find some buying interest.
The 2nd support at 147.45 is also considered an overlap support, further reinforcing its potential as a support level.
On the resistance side, the 1st resistance at 149.99 is categorized as a pullback resistance, suggesting it could act as a level where the price may face selling pressure.
The 2nd resistance at 150.79 is identified as a pullback resistance and coincides with the 61.80% Fibonacci Retracement level, indicating it could be a strong resistance level where the price may encounter obstacles in its upward movement.
Intermediate support at 148.99 is noted as a swing low support, adding another potential support level to watch for price movements.
USD/CAD:
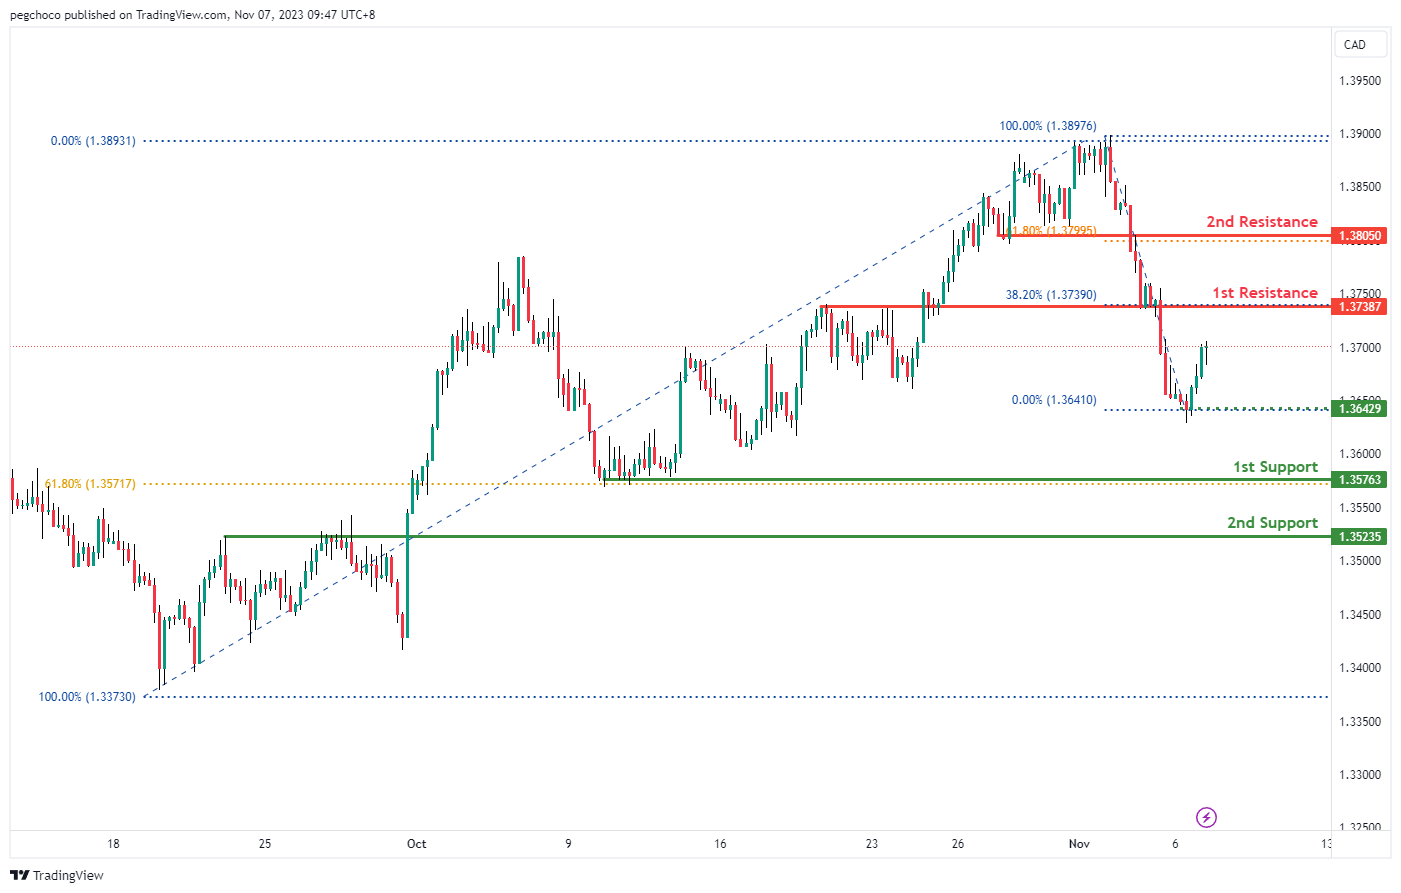
The USD/CAD chart is currently exhibiting a bearish overall momentum, indicating the potential for a bearish reaction off the 1st resistance level and a subsequent drop towards the 1st support level.
The 1st support level at 1.3576 is considered a significant level as it is a multi-swing low support and is further reinforced by the presence of the 61.80% Fibonacci Retracement, suggesting that it may act as a strong support zone where buyers could become active.
In addition, the 2nd support level at 1.3523 is categorized as a pullback support, adding to its potential as a level where the price could find support and reverse its downward movement.
On the resistance side, the 1st resistance level at 1.3738 is identified as a pullback resistance, indicating it could serve as a level where the price encounters selling pressure and potentially reverses.
Furthermore, the 2nd resistance level at 1.3805 is also considered a pullback resistance, reinforced by the presence of the 61.80% Fibonacci Retracement, suggesting that it may act as a strong resistance zone.
Intermediate support at 1.3642 is noted as a swing low support, providing an additional support level to watch.
AUD/USD:
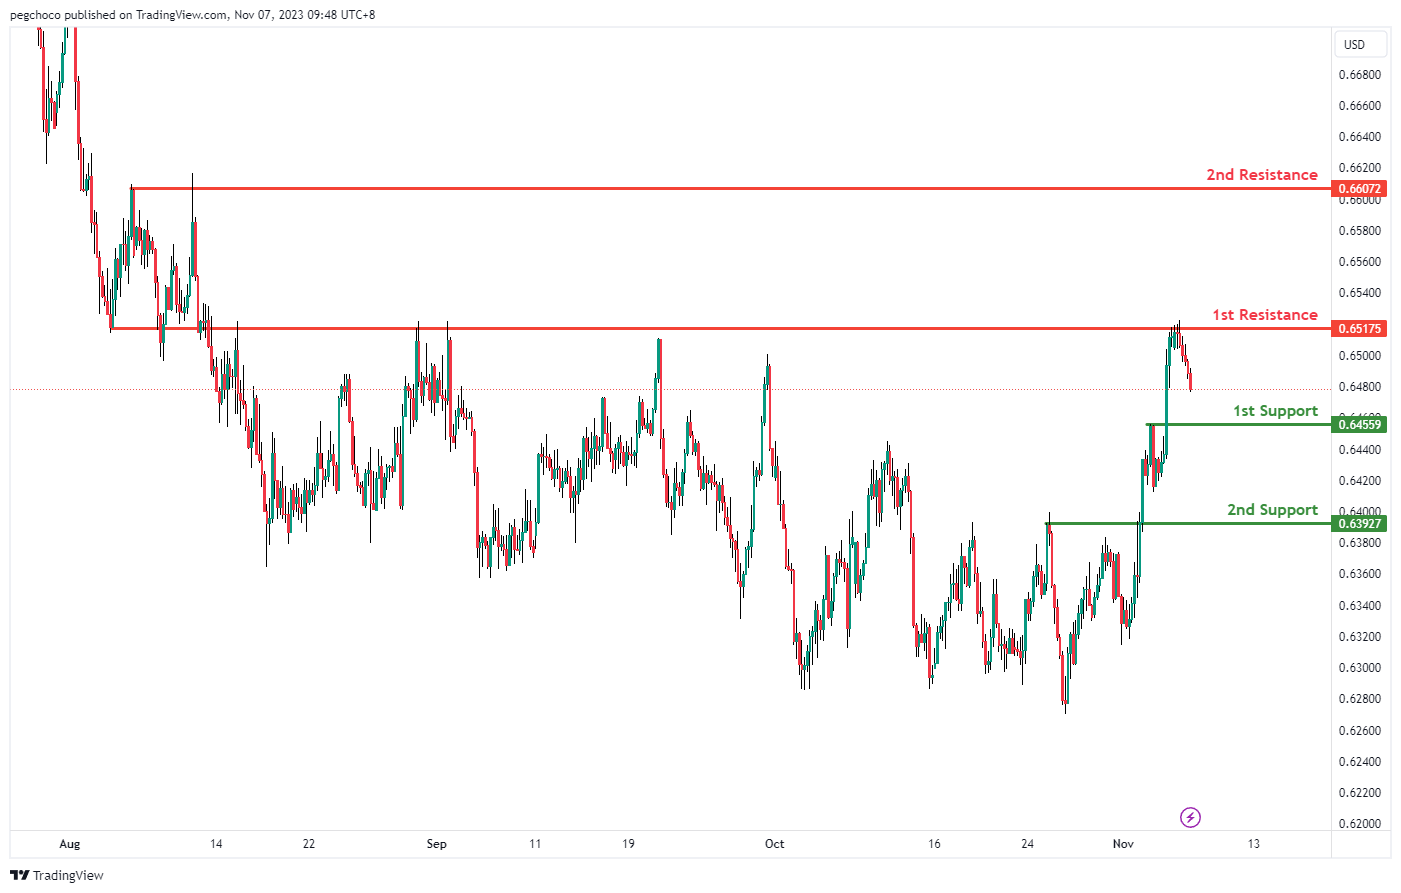
The AUD/USD chart is currently characterized by a bearish overall momentum, indicating the potential for a bearish continuation towards the 1st support level.
The 1st support level at 0.6455 is identified as a pullback support, suggesting it could be a significant level where the price might find buying interest and potentially reverse its downward movement.
Additionally, the 2nd support level at 0.6392 is also categorized as a pullback support, reinforcing its potential as a level of support for the price.
On the resistance side, the 1st resistance level at 0.6517 is considered an overlap resistance, implying that it could act as a level where the price encounters selling pressure.
Furthermore, the 2nd resistance level at 0.6607 is categorized as a swing high resistance, indicating another potential obstacle for the price’s upward movement.
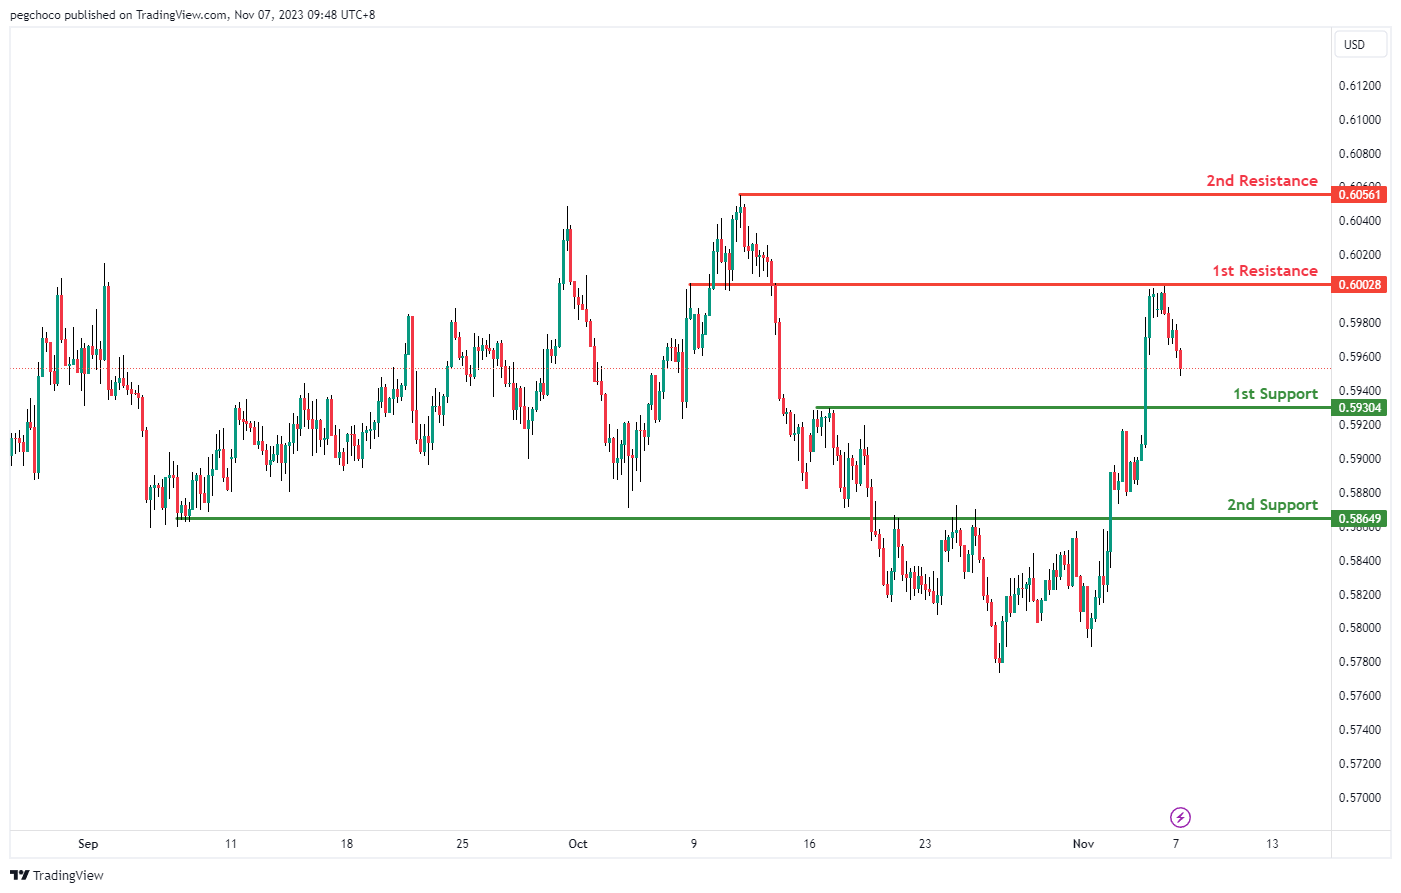
NZD/USD
The NZD/USD chart currently exhibits a bearish overall momentum, suggesting the potential for a bearish continuation towards the 1st support level.
The 1st support level at 0.5930 is identified as a pullback support, indicating it could serve as a significant level where the price may find buying interest and potentially reverse its downward movement.
Further down, the 2nd support at 0.5864 is also categorized as a pullback support, reinforcing its potential significance as a level of support.
On the resistance side, the 1st resistance at 0.6002 is considered an overlap resistance, suggesting that it could act as a level where the price encounters selling pressure.
Similarly, the 2nd resistance at 0.6056 is categorized as a swing high resistance, indicating another potential level where the price may face obstacles in its upward movement.
DJ30:
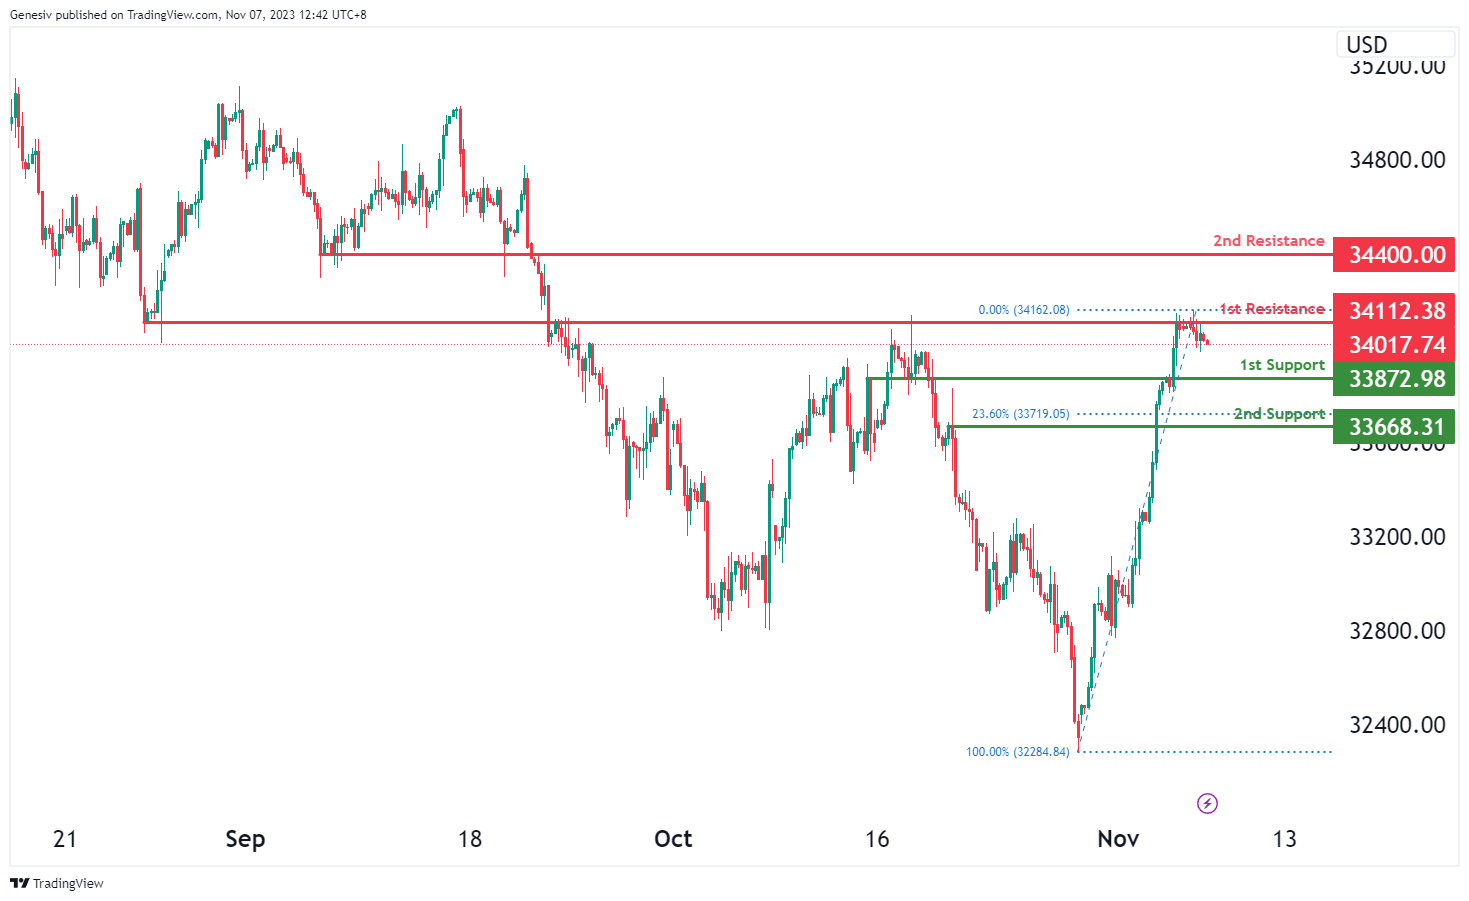
For DJ30, the chart is currently reflecting a bearish momentum, suggesting a potential scenario for a bearish continuation towards the first support level.
The first support at 33872.98 is identified as a level of pullback support, indicating a significant area where the price might find support during its potential downward movement in the bearish trend.
The second support at 33668.31 is also recognized as pullback support, providing an additional level that might offer support during the bearish trend.
On the resistance side, the first resistance at 34112.38 is characterized as an overlap resistance, signifying a significant barrier to the price’s downward movement within the current bearish scenario.
Furthermore, the second resistance at 34400.00 is identified as pullback resistance, suggesting it could act as another substantial barrier to the price’s downward movement within the prevailing bearish trend.
GER40:
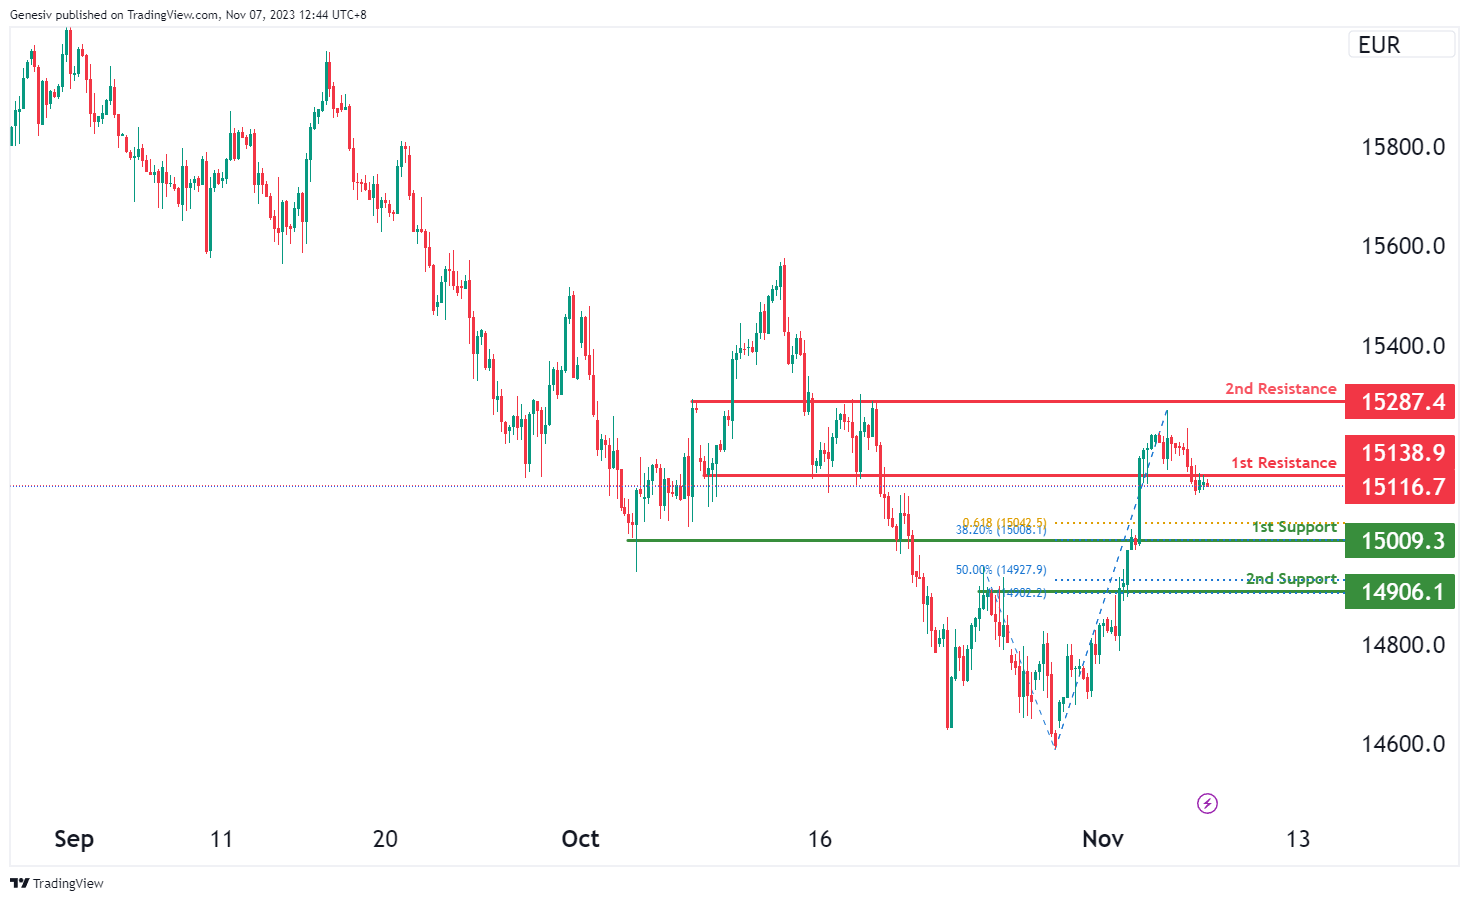
For GER40, the current momentum of the chart indicates a bearish trend, suggesting a potential scenario for a bearish reaction off the first resistance, potentially leading to a drop towards the first support.
The first support at 15009.30 is identified as a level of pullback support, signifying a crucial area where the price might find support during a potential downward movement. This level aligns with both the 38.20% Fibonacci Retracement and the 61.80% Fibonacci Projection, indicating a confluence of Fibonacci levels, making it a significant support zone.
The second support at 14906.10 is also recognized as pullback support and aligns with the 50% Fibonacci Retracement and the 100% Fibonacci Projection, indicating another zone of Fibonacci confluence, making it another crucial area of potential support during a bearish movement.
On the resistance side, the first resistance at 15138.90 is characterized as an overlap resistance, representing a significant barrier to the price’s upward movement within the current bearish scenario.
Additionally, the second resistance at 15287.40 is also identified as an overlap resistance, suggesting it as another considerable obstacle to the price’s upward movement within the prevailing bearish trend.
US500
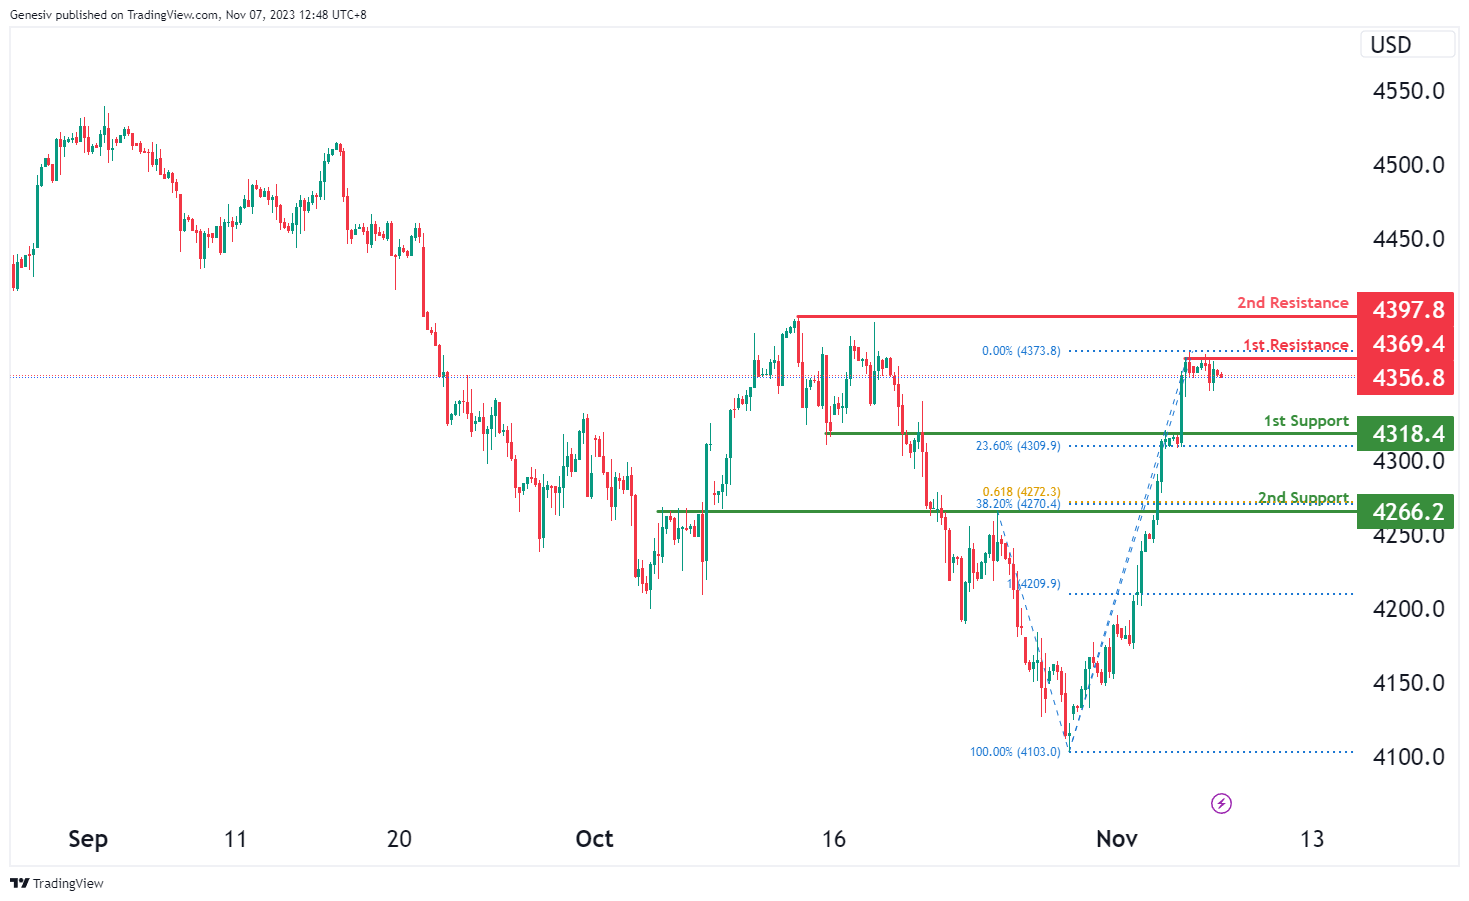
For US500, the current chart momentum indicates a bearish trend, suggesting a potential scenario for a bearish continuation towards the first support level.
The first support at 4318.4 is identified as a pullback support and coincides with the 23.60% Fibonacci Retracement, marking a significant level where the price might find support during its potential downward movement.
The second support at 4266.2 is also recognized as pullback support, aligning with both the 38.20% Fibonacci Retracement and the 61.80% Fibonacci Projection, indicating a confluence of Fibonacci levels. This signifies it as a crucial level of potential support during a bearish movement.
On the resistance side, the first resistance at 4369.4 is characterized as multi-swing high resistance, representing a significant barrier to the price’s upward movement within the current bearish scenario.
Additionally, the second resistance at 4397.8 is also identified as multi-swing high resistance, suggesting it as another considerable obstacle to the price’s upward movement within the prevailing bearish trend.
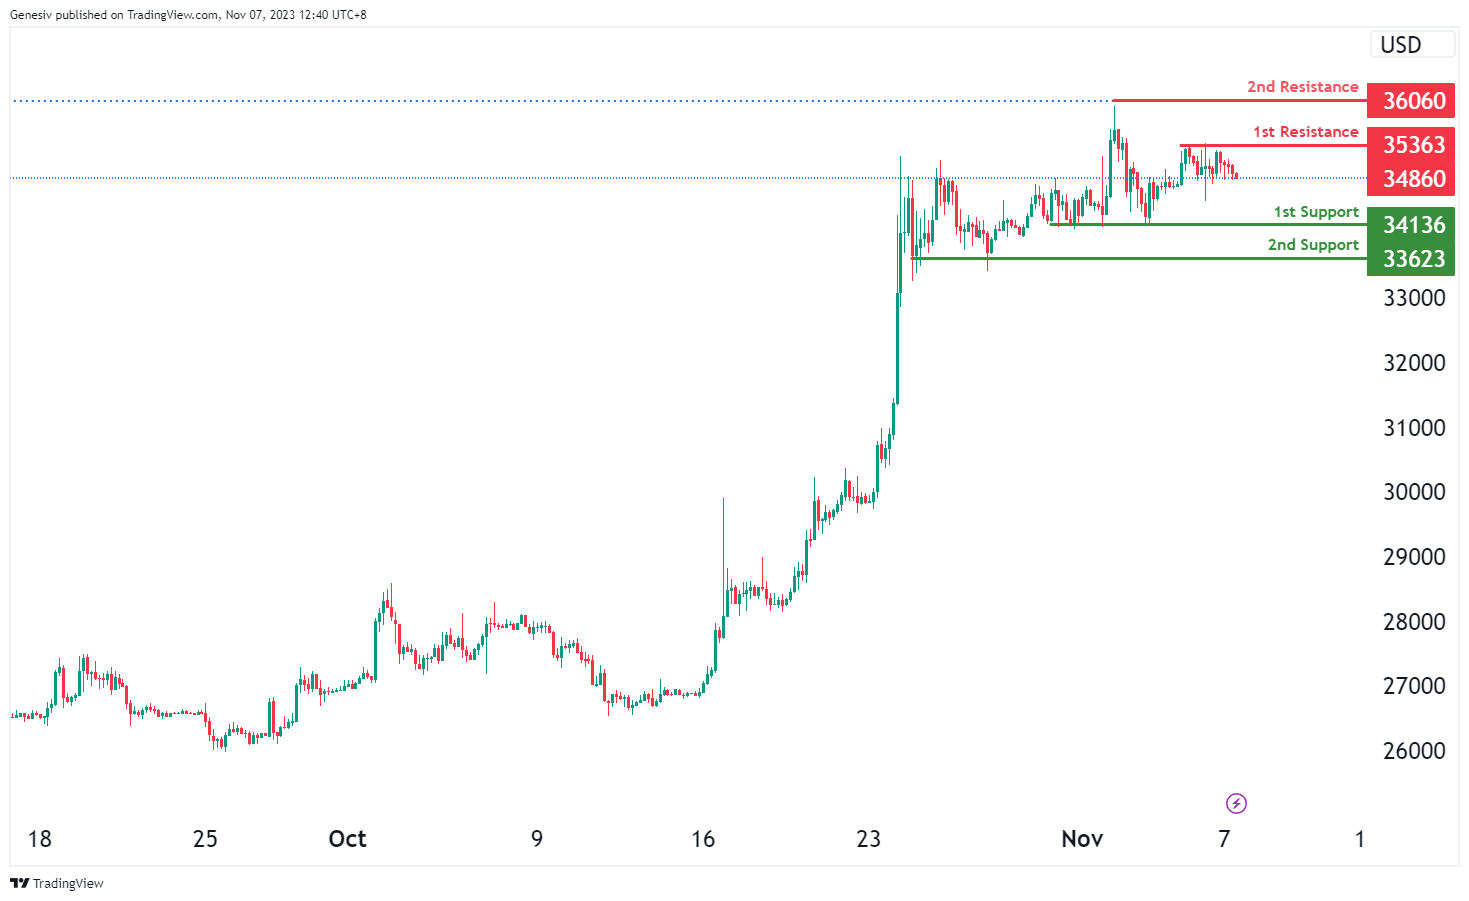
BTC/USD:
For BTC/USD, the current chart reflects a neutral momentum, suggesting a potential scenario for price fluctuation between the first resistance and the first support levels.
The first support at 34136 is attributed to multi-swing low support, indicating a level where the price might find support during any potential decline.
The second support at 33623 is also identified as multi-swing low support, offering an additional level that might provide support in case the price experiences a decline.
On the resistance side, the first resistance at 35363 is characterized as multi-swing high resistance, representing a significant barrier to the price’s upward movement in the neutral scenario.
Additionally, the second resistance at 36060 is recognized as swing high resistance, suggesting it could pose another substantial barrier to the price’s upward movement within the prevailing neutral trend.
ETH/USD:
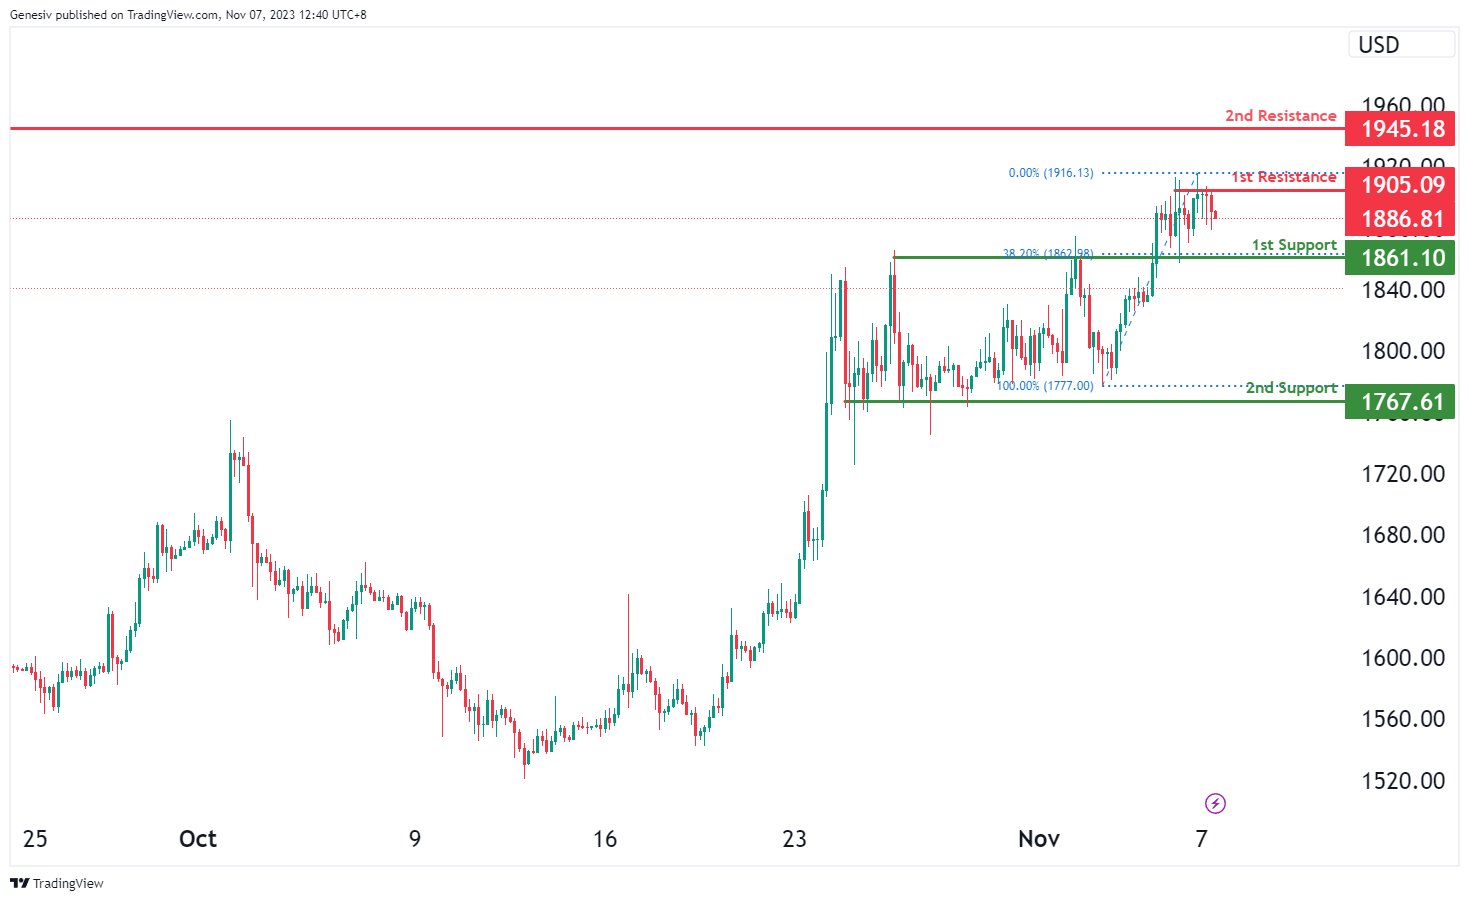
For ETH/USD, the current chart shows a neutral momentum, indicating a potential scenario where the price could fluctuate between the first resistance and the first support levels.
The first support at 1861.10 is identified as an overlap support, suggesting a level where the price might find support during any potential decline.
The second support at 1767.61 is recognized as multi-swing low support, providing an additional level that might offer substantial support in case of a price decline.
On the resistance side, the first resistance at 1905.09 is characterized as multi-swing high resistance, representing a significant barrier to the price’s upward movement in the neutral scenario.
Moreover, the second resistance at 1945.18 is also identified as multi-swing high resistance, further suggesting it as a substantial barrier to the price’s upward movement within the prevailing neutral trend.
WTI/USD:
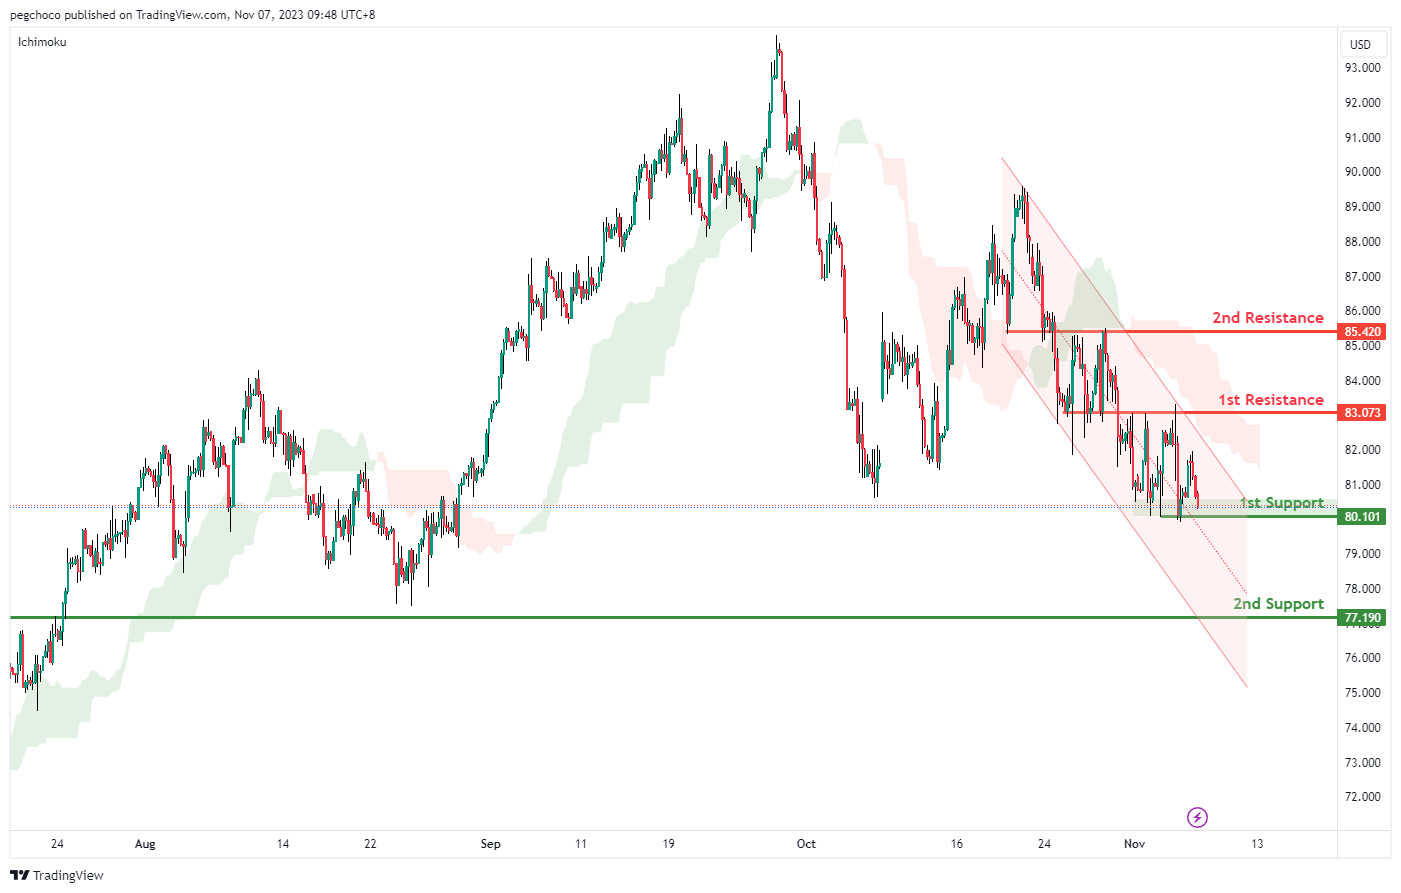
The WTI (West Texas Intermediate) chart currently demonstrates a bearish overall momentum, primarily influenced by two key factors. First, the price is within a bearish descending channel, indicating a consistent pattern of lower highs and lower lows. Second, the price is positioned below the bearish Ichimoku cloud, which typically suggests a bearish sentiment and reinforces the downward momentum.
Given this prevailing bearish sentiment, there is a potential scenario where the price breaks bearishly below the 1st support and continues to decline towards the 2nd support level.
The 1st support level at 80.10 holds significance as it represents a multi-swing low support, implying that it could attract buying interest and potentially act as a price reversal point.
Further down, the 2nd support at 77.19 is identified as an overlap support, further emphasizing its role as a substantial level of potential support.
On the resistance side, the 1st resistance at 83.07 is categorized as an overlap resistance, signifying a level where selling pressure may emerge.
Similarly, the 2nd resistance at 85.42 is also considered an overlap resistance, indicating another potential area where price could face resistance.
XAU/USD (GOLD):
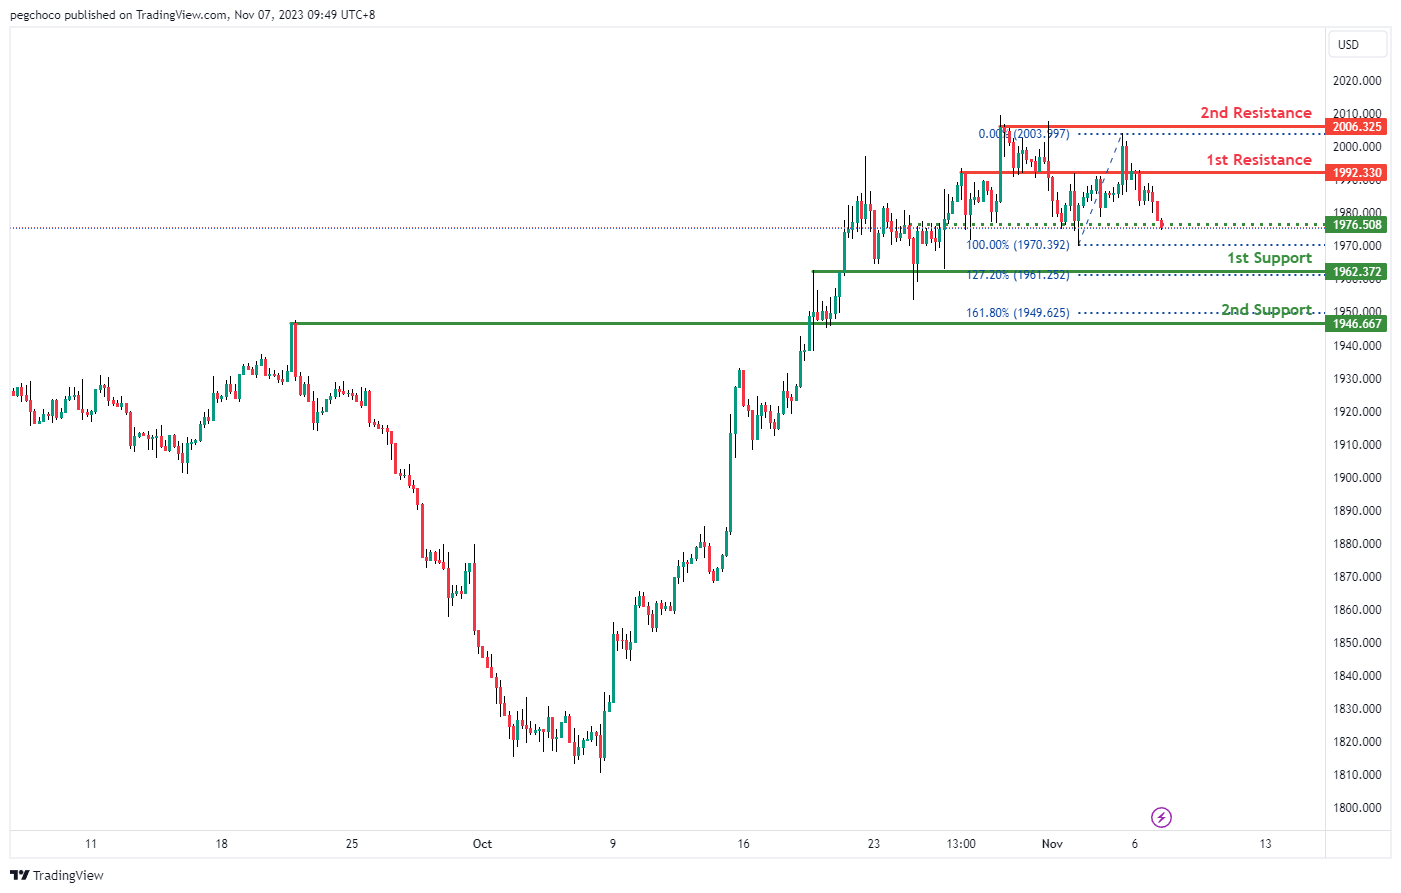
The XAU/USD chart currently has a bearish overall momentum, indicating the potential for a bearish continuation towards the 1st support level.
The 1st support at 1962.37 is identified as an overlap support and coincides with the 127.20% Fibonacci Extension level, suggesting it could be a significant level where the price might find some buying interest.
The 2nd support at 1946.66 is considered a pullback support and aligns with the 161.80% Fibonacci Extension level, further reinforcing its potential as a support level.
On the resistance side, the 1st resistance at 1992.33 is categorized as an overlap resistance, suggesting it could act as a level where the price may face selling pressure.
The 2nd resistance at 2006.32 is noted as a multi-swing high resistance, indicating another potential level where the price may encounter obstacles in its upward movement.
AUD/USD Daily Report
Daily Pivots: (S1) 0.6449; (P) 0.6484; (R1) 0.6547; More...
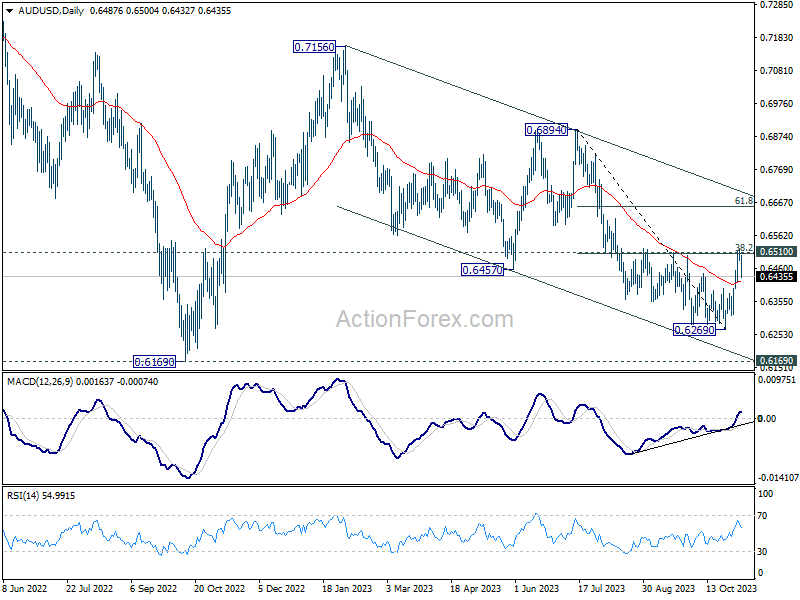
Intraday bias in AUD/USD is turned neutral first with today's steep retreat. For now, another rise will remain mildly in favor as long as 0.6411 minor support holds. Sustained break of 0.6510 cluster resistance (38.2% retracement of 0.6894 to 0.6269 at 0.6508) will argue that whole decline from 0.7156 might be completed with three waves down to 0.6269. Stronger rally should then be seen to medium term trend line resistance (now at 0.6700). However, firm break of 0.6411 will indicate rejection by 0.6510, and turn bias back to the downside for retesting 0.6269 low.
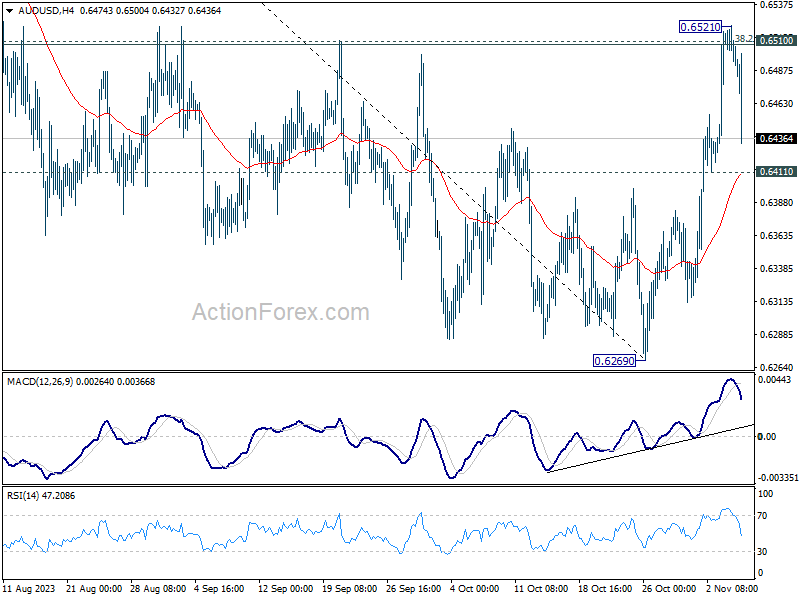
In the bigger picture, there is no confirmation that down trend from 0.8006 (2021 high) has completed. While current rebound from 0.6269 might extend higher, it could be the third leg of a corrective pattern from 0.6169 (2022 low) only. For now, medium term bearishness will remain as long as 0.6894 resistance holds.
Aussie Dips Post-RBA Hike Amid Softened Hawkish Stance and Weak Risk Appetite
Australian Dollar is taking a surprising dip today despite RBA's anticipated decision to raise the cash rate target by 25bps. Investors have taken this opportunity to lock in profits, influenced by the central bank's softened rhetoric on the immediate need for further rate hikes. It appears RBA is likely to pause again to evaluate the impact of its policy measures, likely awaiting Q4 data in February before considering additional moves.
The mood in Asia also influenced commodity currencies, with a dour risk sentiment catalyzed by China's unexpectedly steep drop in trade surplus. Although nominal wages in Japan edged higher, the overall weakness in Yen suggests that such positive data is insufficient to counterbalance the ongoing slide in real wages growth and household expenditure.
On the flip side, Dollar emerged as one of the strongest performers of the day so far, closely followed by Swiss Franc. Euro and British Pound are also making headway, with Sterling exhibiting a minor advantage over the common currency.
From a technical standpoint, Dollar's recent downward momentum appears to be waning. A recovery could be imminent, yet it's premature to declare a bullish reversal. A critical point of interest for Forex traders will be 55 4H EMA (now at 1.0643) in EUR/USD. Should Euro sustain above this level, it could signal that choppy rise from 1.0447 is set to continue through 1.0755 resistance later on. Conversely, sustained break below the 55 4H EMA might suggest the rebound is over, and send EUR/USD through 1.0515 support to retest 1.0447 low.
In Asia, at the time of writing, Nikkei is down -1.26%. Hong Kong HSI is down -1.50%. China Shanghai SSE is down -0.35%. Singapore Strait Times is down -0.33%. Japan 10-year JGB yield is up 0.0074 at 0.881. Overnight, DOW rose 0.10%. S&P 500 rose 0.18%. NASDAQ rose 0.30%. 10-year yield rose 0.104 to 4.662.
RBA hikes to 4.35%, future path hinges on evolving data
RBA announced an increase in cash rate target by 25 bps to 4.35%, aligning with market anticipations. Accompanying this move, RBA signaled a shift to a neutral policy stance, indicating that "whether further tightening of monetary policy is required... will depend upon the data and the evolving assessment of risks ."
In the statement, RBA said inflation is "still too high" and is proving "more persistent than expected a few months ago". A rate hike was was warranted today to be "more assured" that inflation would return to target in a "reasonable timeframe".
The central bank's outlook is tempered by "significant uncertainties," particularly regarding the persistence of services inflation which has been notably resilient internationally and could mirror in the Australian market.
The effectiveness of monetary policy changes and the response of wage settings and pricing decisions amid a slowdown in economic growth are areas of unpredictability, especially given the current tightness of the labor market. Household consumption prospects are also veiled with uncertainty, too. T
Looking abroad, RBA's statement brought to light the ongoing global uncertainties, notably the economic trajectory of China and the far-reaching consequences of international conflicts, adding further dimensions to the central bank's considerations.
China's export decline deepens while imports rebound
China's export figures have taken a sharper downturn than anticipated in October, contracting by -6.4% yoy to USD 274.8B, exceeding market predictions of -3.1% yoy. This downturn marks the sixth consecutive month where China's exports have receded.
In contrast, imports defied expectations with a 3.0% yoy increase, a significant departure from the forecasted -5.4% yoy decline, and putting an end to an 11-month streak of contraction.
The culmination of these trade activities resulted in a considerable narrowing of the trade surplus, which shrunk from USD 77.7B to USD 56.5B. This is a stark contraction compared to the anticipated figure of USD 84.2B.
Japan's labor cash earnings up 1.2% yoy, but real wages down for 18th month
Japan reported a modest increase in nominal labor cash earnings in September, with 1.2% yoy rise that slightly exceeded market expectations of 1.0% yoy gain. This uptick, an improvement from the previous month's 0.8%, may seem like a positive indicator at first glance, with base salary growth also marking an increase to 1.4% yoy from August's 1.2% yoy.
However, not all components of earnings showed strength. Special payments, often a volatile category, continued to decline by -6.0% yoy , albeit a less severe contraction than -6.3% yoy reported in August. Meanwhile, overtime pay exhibited a marginal increase, rising 0.7% yoy, suggesting a modest uptick in extra working hours.
The nuanced picture of Japan's wage situation becomes more concerning when adjusted for inflation. Real wages, which reflect the purchasing power of income, fell sharply by -2.4% yoy compared to the same month last year, marking the 18th consecutive month of decline. This persistent slide in real wages points to the squeeze on household income as inflation outpaces nominal wage growth.
In line with the strain on incomes, household spending dipped by -2.8% yoy , although the figure is marginally better than the anticipated -3.0% yoy fall. This marks the seventh straight month of decline, underscoring the ongoing reticence of Japanese consumers to open their wallets amid economic uncertainties.
On a more positive note, on a seasonally adjusted basis, household spending saw an unexpected increase of 0.3% mom, defying expectations of a -0.4% mom decline.
BoE's Pill suggests rate cuts by mid-2024 "not totally unreasonable"
In an online event overnight, BoE Chief Economist Huw Pill acknowledged the slower pace of reduction compared to global counterparts. The UK has also seen inflation climbed higher. Despite this lag, he expressed confidence that "We're going to see the UK get down to levels more comparable to what we're seeing in the rest of the world."
Pill's remarks came amid the backdrop of market expectations that have priced in a potential rate cut as early as August 2024. He finds this timing "not totally unreasonable," highlighting it's a period when the Bank might reassess its stance, albeit with the usual caveat that economic conditions are fluid and subject to change.
Moreover, Pill tempered expectations of a return to the ultra-low interest rate environment seen pre-pandemic, indicating that future rates are more likely to find a middle ground. This perspective reinforces the notion that the era of zero interest rates was an anomaly rather than a standard monetary condition.
Fed's Kashkari signals preference for stronger policy action to tame inflation target
Minneapolis Federal Reserve President Neel Kashkari expressed concern over the consequences of insufficient tightening in a WSJ interview, saying, "Under-tightening will not get us back to 2% in a reasonable time." He favored a stance that leans toward an aggressive policy rather than a cautious one.
In a subsequent conversation with Fox News, Kashkari drew attention to the economy's endurance despite Fed's recent rounds of rate increases. "The economy has proved to be really resilient even though we've raised interest rates a lot over the past couple of years. That's good news," he said. This resilience suggests that the economy might be better positioned to handle further rate hikes, should they be deemed necessary.
However, Kashkari was clear that the Fed's job is far from over, as inflation remains a critical challenge. "We need to let the data keep coming to us to see if we really have got the inflation genie back in the bottle so to speak," he conveyed, emphasizing the need for ongoing vigilance. He added, "We haven't completely solved the inflation problem. We still have more work ahead of us to get it done."
Looking ahead
Germany industrial production, Swiss foreign currency reserves, Eurozone PPI will be released in European session. Later in the day, trade balance from Canada and US will be featured.
AUD/USD Daily Report
Daily Pivots: (S1) 0.6449; (P) 0.6484; (R1) 0.6547; More...
Intraday bias in AUD/USD is turned neutral first with today's steep retreat. For now, another rise will remain mildly in favor as long as 0.6411 minor support holds. Sustained break of 0.6510 cluster resistance (38.2% retracement of 0.6894 to 0.6269 at 0.6508) will argue that whole decline from 0.7156 might be completed with three waves down to 0.6269. Stronger rally should then be seen to medium term trend line resistance (now at 0.6700). However, firm break of 0.6411 will indicate rejection by 0.6510, and turn bias back to the downside for retesting 0.6269 low.
In the bigger picture, there is no confirmation that down trend from 0.8006 (2021 high) has completed. While current rebound from 0.6269 might extend higher, it could be the third leg of a corrective pattern from 0.6169 (2022 low) only. For now, medium term bearishness will remain as long as 0.6894 resistance holds.
Economic Indicators Update
| GMT | Ccy | Events | Actual | Forecast | Previous | Revised |
|---|---|---|---|---|---|---|
| 23:30 | JPY | Labor Cash Earnings Y/Y Sep | 1.20% | 1.00% | 1.10% | 0.80% |
| 23:30 | JPY | Overall Household Spending Y/Y Sep | -2.80% | -3.00% | -2.50% | |
| 00:01 | GBP | BRC Like-For-Like Retail Sales Y/Y Oct | 2.60% | 2.80% | ||
| 03:00 | CNY | Trade Balance (USD) Oct | 56.5B | 84.2B | 77.7B | |
| 03:30 | AUD | RBA Interest Rate Decision | 4.35% | 4.35% | 4.10% | |
| 07:00 | EUR | Germany Industrial Production M/M Sep | -0.30% | -0.20% | ||
| 08:00 | CHF | Foreign Currency Reserves (CHF) Oct | 678B | |||
| 10:00 | EUR | Eurozone PPI M/M Sep | 0.30% | 0.60% | ||
| 10:00 | EUR | Eurozone PPI Y/Y Sep | -12.50% | -11.50% | ||
| 12:30 | CAD | Trade Balance (CAD) Sep | 1.0B | 0.7B | ||
| 13:30 | USD | Trade Balance (USD) Sep | -60.5B | -58.3B |
Nasdaq (NQ_F) Rally Corrective or Start of New Bullish Leg?
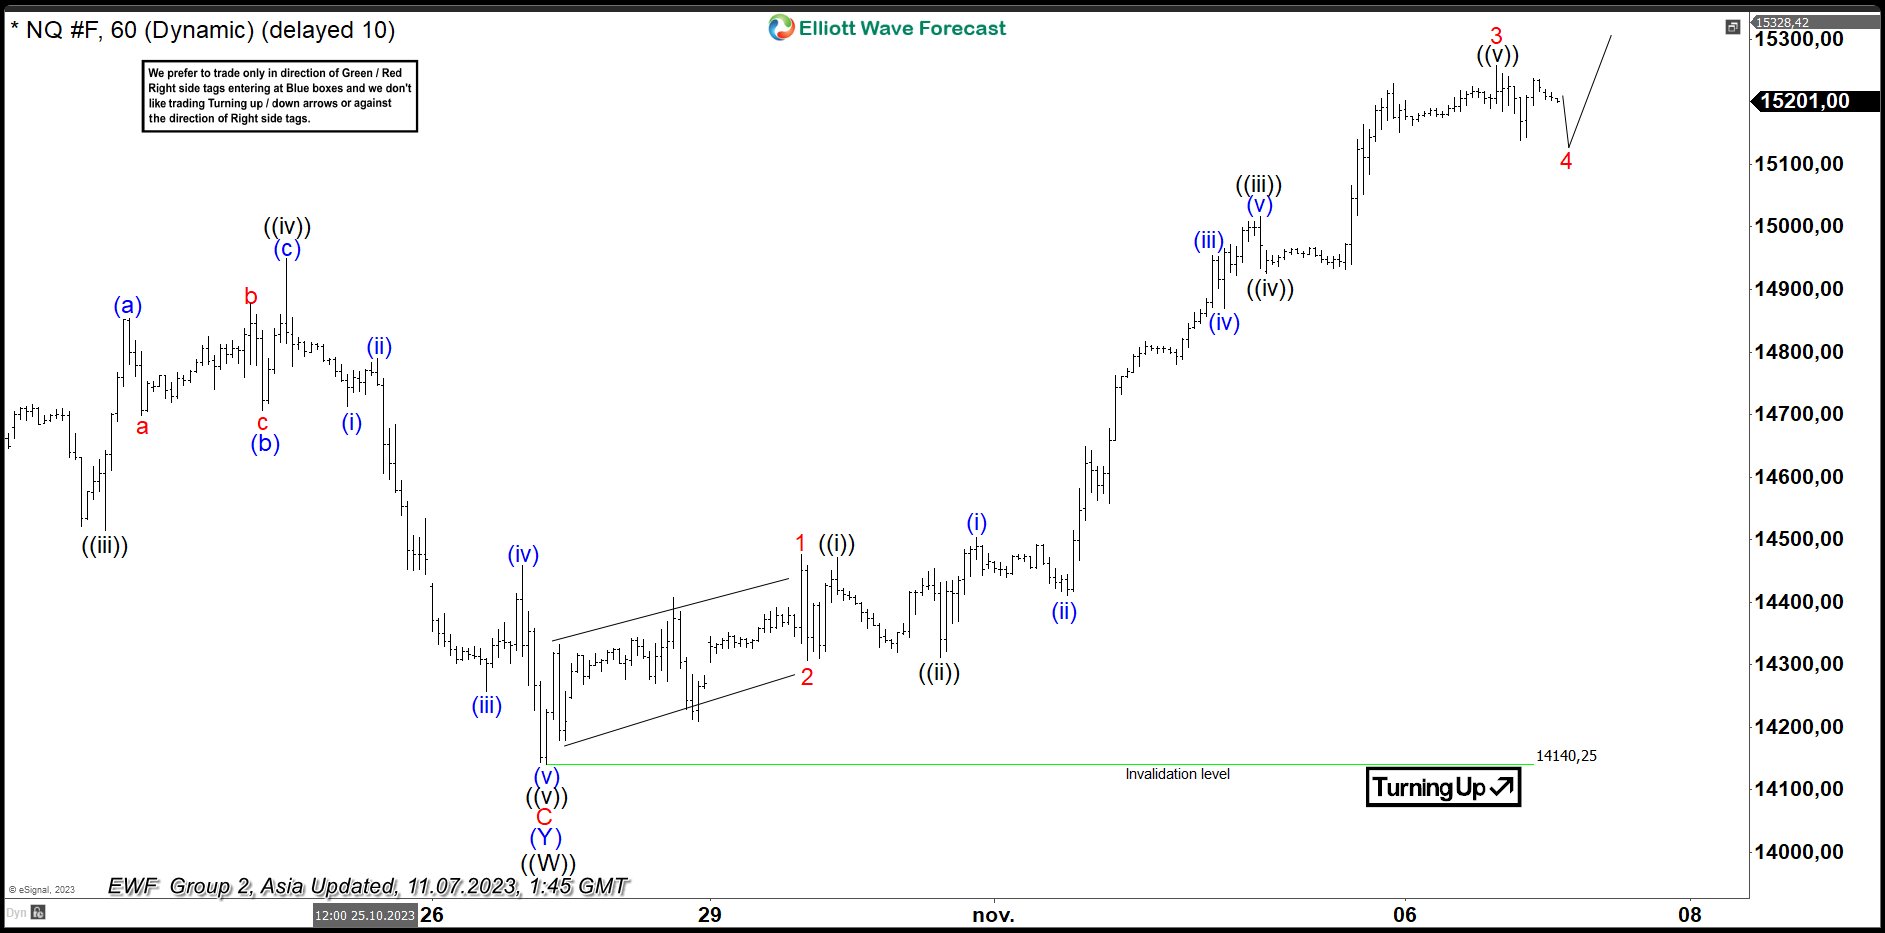
Short Term Elliott Wave in Nasdaq Futures (NQ_F) shows the Index ended wave ((W)) at 14140.25. The Index rallies to correct cycle from 7.19.2023 high in wave ((X)). Internal of wave ((X)) is unfolding as a zigzag Elliott Wave structure. Up from wave ((W)), wave (A) is in progress as a nesting impulse. Wave 1 rally ended at 14476.5 and pulback in wave 2 ended at 14306.25. Index then nested higher. Up from wave 2, wave ((i)) ended at 14472 and dips in wave ((ii)) ended at 14311.25. The Index then extended higher again in wave ((iii)) towards 15017.25.
Pullback in wave ((iv)) ended at 14925.50. Final leg higher wave ((v)) ended at 15275.5 which completed wave 3. Expect the Index to pullback in wave 4 and see support in 3, 7, 11 swing for more upside in wave 5 to end wave (A) of ((X)). Wave 4 may reach 23.6 – 38.2% Fibonacci retracement of wave 3 which comes at 14892 – 15030. Once wave 5 of (A) ends, the Index should pullback in larger degree wave (B) to correct cycle from 10.27.2023 low before it turns higher again. Near term, as far as pivot at 14140.25 low stays intact, expect dips to find support in 3, 7, or 11 swing for further upside.
Nasdaq (NQ_F) 60 Minutes Elliott Wave Chart From 11.03.2023
NQ_F Elliott Wave Video
https://www.youtube.com/watch?v=Ca1l7Ym_gIs