

Sample Category Title
EUR/USD Daily Outlook
Daily Pivots: (S1) 1.0648; (P) 1.0698; (R1) 1.0780; More...
Intraday bias in EUR/USD remains on the upside at this point. Decisive break of 1.0764 cluster resistance (38.2% retracement of 1.1274 to 1.0447 at 1.0763) will extend the rise from 1.0447 to 61.8% retracement at 1.0958 next. On the downside, below 1.0666 minor support will turn intraday bias neutral first.
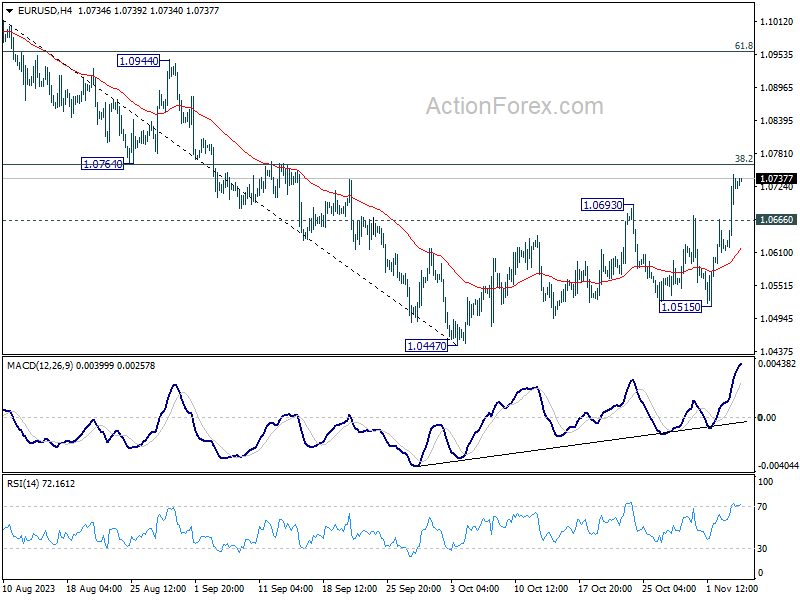
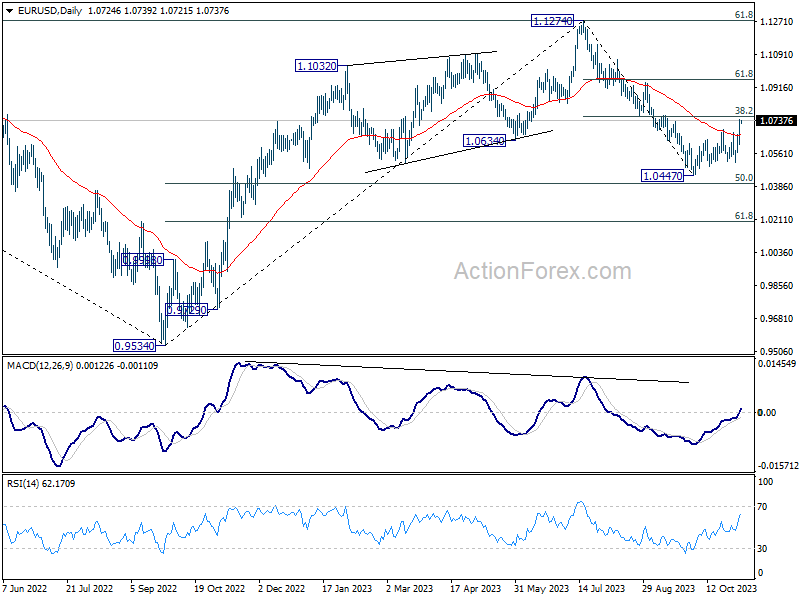
In the bigger picture, price actions from 1.1274 are viewed as a corrective pattern to rise from 0.9534 (2022 low). Rise from 1.0447 is tentatively seen as the second leg. Hence while further rally could be seen, upside should be limited by 1.1274 to bring the third leg of the pattern.
Potential Bullish Tactical Movements Arise for Hong Kong and China Equities Due to USD Weakness
- The latest set of lacklustre US non-farm payrolls and ISM Services PMI data for October has reinforced further US dollar weakness.
- The narrowing of the 2-year US Treasury yield over the 2-year China sovereign bond has negated the current major downtrend of the offshore yuan (CNH) against the US dollar.
- A further breakdown below 7.2675 on the USD/CNH may trigger a potential tactical multi-month up moves in China and Hong Kong equities.
In the past week, the medium-term uptrend of the US dollar strength in place since mid-July 2023 has started to show signs of a potential multi-week bearish reversal in progress where the US Dollar Index broke below its 50-day moving average last Friday, 3 November where it has been acting as a support since early August 2023.
Two primary catalysts reinforced this current bout of weak US dollar movement; the less hawkish vibes from the recently concluded Fed Chair’s Powell ex-post FOMC press conference and lacklustre key US economic data that came in below expectations; non-farm payrolls and ISM Services PMI for October.
Hence, it has shifted the dial on the expectations of the trajectory of the Fed funds rate where the expectations of the potential last 25 basis points (bps) hike pencilled in the December Federal Open Market Committee (FOMC) meeting has been greatly reduced to a mere chance of 4.6% from 19.2% seen a week ago based on data implied by the 30-day Fed funds futures.
In addition, an increase in the expectation for the first Fed funds rate cut of 25 bps has been brought forward as early as May next year with a chance of 71%.
All in all, these sets of interlinked movements have triggered softness in both the long and short end of the US Treasury curve which in turn reduces the US Treasury yield premium against the rest of the world.
USD/CNH is looking vulnerable after the bearish breakdown of its 50-day moving average
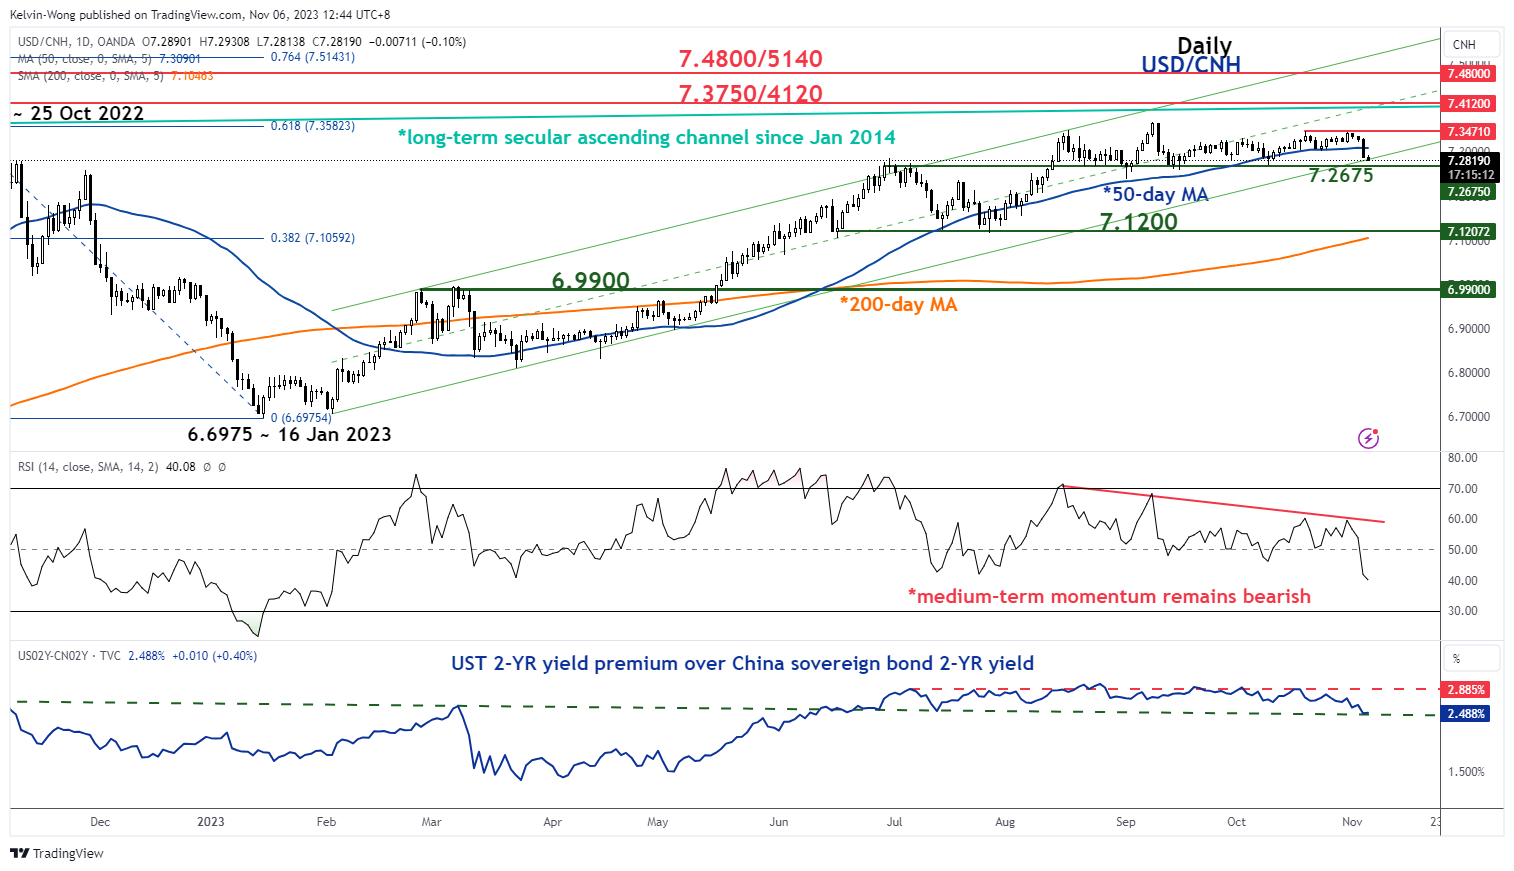
Fig 1: USD/CNH medium-term trend as of 6 Nov 2023 (Source: TradingView, click to enlarge chart)
The major downtrend seen in the Chinese offshore yuan (CNH) against the US dollar has been negated where the USD/CNH pair has broken down the 50-day moving average and now looks vulnerable for a crack below its immediate support at 7.2675 to expose further potential weakness towards the key 200-day moving average acting as a support at 7.1200.
Also, the 2-year yield premium of the US Treasury note over China sovereign bond of similar maturity has continued to narrow which in turn also advocates further US dollar weakness.
Further USD weakness may benefit China and Hong Kong equities in the medium-term
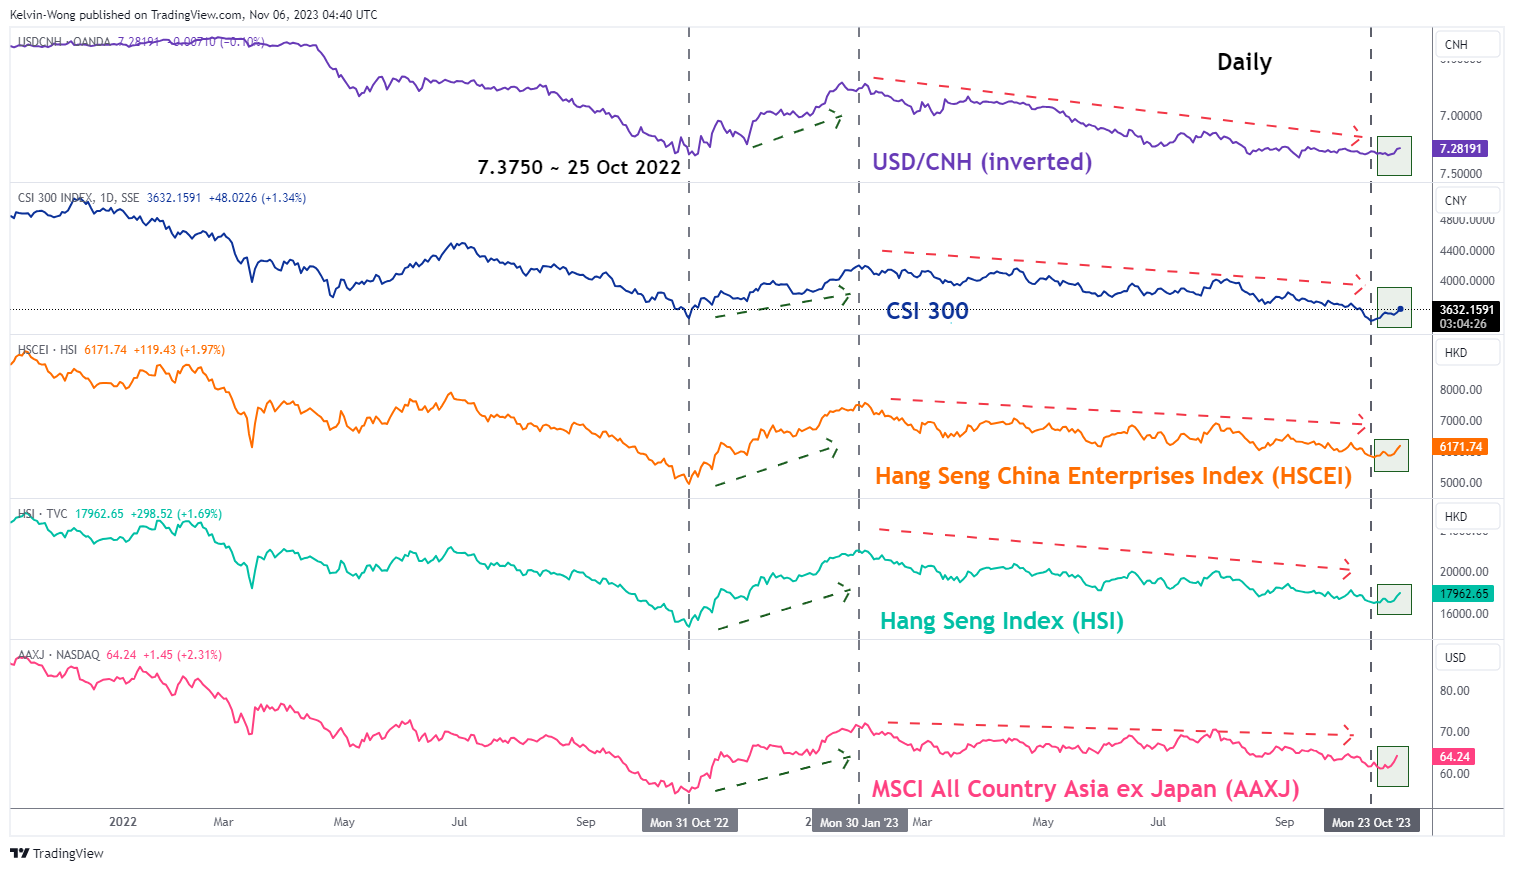
Fig 2: Correlation of USD/CNH with CSI 300, HSI, HSCEI & AAXJ as of 6 Nov 2023 (Source: TradingView, click to enlarge chart)
Given the high direct correlation between USD/CNH (inverted) with the China and Hong Kong benchmark stock indices; CSI 300 Hang Seng Index (HSI), and Hang Seng China Enterprise Index (HSCEI) since late October 2022, further potential weakness in the USD/CNH towards its 200-day moving average may trigger a potential medium-term (multi-month) positive feedback loop into China and Hong Kong equities in general.
In the longer-term perspective, a more sustainable recovery in China and Hong Kong stock markets is more dependable on removing the persistent liquidity crunch in China’s property development sector, and the normalisation of US-China relationships in terms of geopolitical and commercial. Unfortunately, the emergence of positive developments in these key aspects is still murky.
GBP/USD Daily Outlook
Daily Pivots: (S1) 1.2247; (P) 1.2318; (R1) 1.2452; More
GBP/USD retreats mildly today intraday bias stays on the upside at this point. Further rally should be seen to 38.2% retracement of 1.3141 to 1.2036 at 1.2458. Sustained break there will pave the way to 61.8% retracement at 1.2783. On the downside, below 1.2309 minor support will turn intraday bias neutral first.
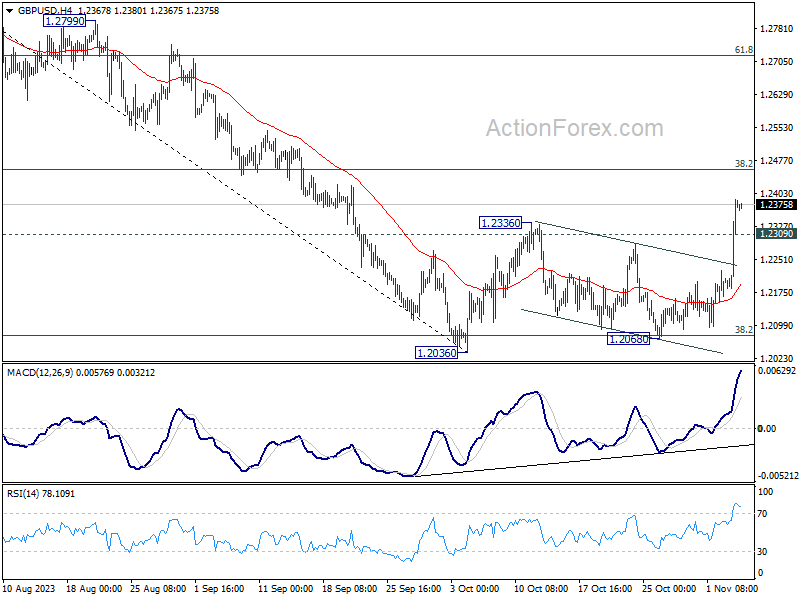
In the bigger picture, the strong rebound from 38.2% retracement of 1.0351 to 1.3141 at 1.2075 argues that price action from 1.3141 are merely a correction to rise from 1.0351 (2022 low). Current rally from 1.2036 is tentatively seen as the second leg of the pattern. Hence, while further rally is in favor, upside should be limited by 1.3141 to start the third leg.
Forex Markets Hold Steady; Anticipation Builds for RBA Hike on Tuesday
As the new trading week opens, the forex markets present a scene of relative tranquility during the Asian session. Dollar is attempting a modest recovery from last week's downturn, yet the impetus for a decisive rally seems absent. In contrast to the upbeat sentiment in Asian equity markets, spurred by Friday's surge on Wall Street, currencies such as the Australian and New Zealand Dollars are not following suit, entering a phase of consolidation instead. Yen has shown vulnerability in response to BoJ Governor Kazuo Ueda's reaffirmation of a dovish policy outlook. Meanwhile, Swiss Franc has edged ahead, together with Euro, as the British Pound trails its continental counterparts.
Today's economic calendar will feature Eurozone PMI services final and Sentix investor confidence, complemented by UK's construction PMI and Canada's Ivey PMI. These figures, however, are not expected to be the catalysts for significant market movement. Market participants seem poised to hold their breath for more definitive events, such as tomorrow's widely anticipated rate decision by RBA and the forthcoming Japanese wage statistics, which could provide fresh directional inspirations.
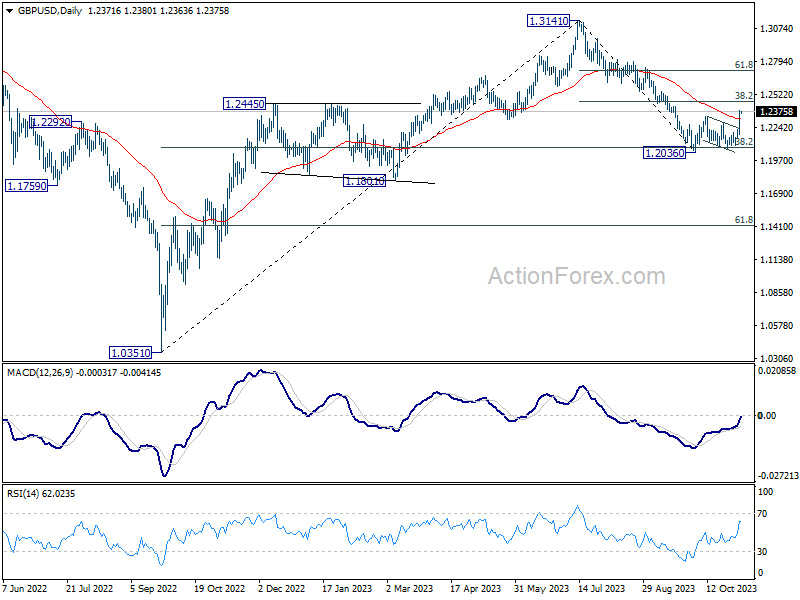
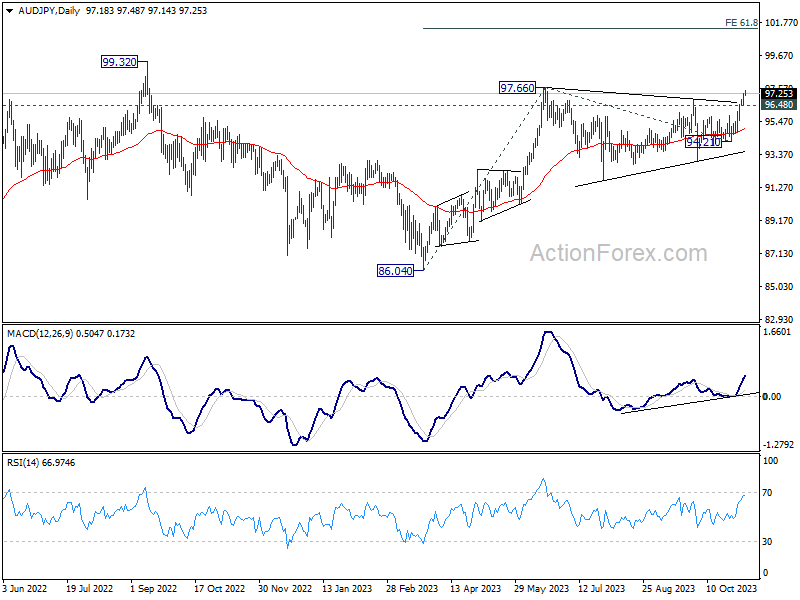
In this context, AUD/JPY currency pair stands out as one to watch. Technically speaking, AUD/JPY's triangle consolidation from 97.66 is likely completed already and rise from 86.04 is ready to resume. Break of 97.66 resistance will confirm this bullish case and target 99.32 high. Firm break there will resume larger up trend from 59.85 (2020 low). Next target will be 61.8% projection of 86.04 to 97.66 from 94.21 at 101.39. However, break of 96.48 will delay the bullish case and bring retreat first.
In Asia, at the time of writing, Nikkei is up 2.23%. Hong Kong HSI is up 1.71%. China Shanghai SSE is up 0.83%. Singapore Strait Times is up 0.49%. Japan 10-year JGB yield is down -0.040 at 0.876.
ECB's Lagarde determined to bring inflation down to 2%
In an interview with Kathimerini, ECB President Christine Lagarde enunciated the bank's determined path: "We are determined to bring inflation down to 2%. According to our projections, we will get there in 2025."
This determination comes against a backdrop of soaring prices affecting economies worldwide, with ECB focusing not just on the broader inflationary metric but also on its constituent parts. "When we measure inflation, we pay attention to the headline rate,"
Delving into the specifics, Lagarde acknowledged the significant volatility in food prices, a primary concern for policy-makers and consumers alike. She highlighted a future clouded by environmental uncertainty: "Is the price of food going to be higher in the future? That's a possibility if you look at the impact of climate change."
Lagarde also touched on the societal impact of inflation, particularly the strain on the vulnerable populations. "Let me say that our mandate is to ensure price stability, and this is the best contribution we can make to social peace and to society, to the most vulnerable of its members in particular."
BoJ Governor Ueda affirms commitment to easing amid uncertain inflation-wage dynamics
BoJ Governor Kazuo Ueda reaffirmed today the central bank's commitment to its accommodative stance.
"We're seeing more positive signs than before in corporate wage and price-setting behavior," Ueda stated, acknowledging the nascent signs of a healthier inflation-wage cycle. However, he also underscored the prevailing uncertainties, admitting, "there's still uncertainty on whether the positive cycle will strengthen, as we predict."
With an eye on supporting economic activity, Ueda emphasized the central bank's resolve, "We will patiently maintain monetary easing," indicating no immediate shift from BoJ's long-standing dovish position.
Last week's decision to relax the 1% cap on 10-year JGB yield, allowing greater movement in long-term borrowing costs, was a nod to flexibility in BoJ's approach. Today, Ueda elaborated, "We will conduct nimble market operations when interest rates rise, depending on the level and speed of moves of long-term rates."
Ueda also sought to temper market expectations regarding the potential for sharp rises in long-term yields. "Even if long-term rates come under upward pressure, don't expect the 10-year JGB yield to sharply exceed 1%," he stated.
The Governor's comments reflect a deep consideration of the "real" interest rate, which factors in inflation expectations. He explained, "Long-term rates may rise somewhat but what's important is to look at the real interest rate that takes into account inflation expectations."
He reassured markets, "Even if long-term rates rise, real interest rates will move in negative territory so monetary conditions will be sufficiently accommodative."
Japan's PMI services finalized at 51.6, growth is on the wane
Japan's PMI Services was finalized at 51.6 in October, down from previous month's 53.8. PMI Composite figure similarly declined to 50.5 from September's 52.1.
Andrew Harker of S&P Global Market Intelligence highlighted the subdued performance: "While the PMI data continue to make positive reading for the Japanese service sector, the recent trends suggest that growth is on the wane."
He elaborates that the slowdown is notably marked by the softest increases in activity and new orders witnessed since the year's inception, which could herald a persistent deceleration as we edge closer to the year's end.
This softening expansion has raised concerns regarding the service sector's capacity to buoy the broader economy, particularly as manufacturing continues to lag. Harker notes the stagnation of new orders in October, halting an eight-month stretch of growth and presenting a cautionary backdrop for the upcoming months.
This week's market movers: RBA , BoJ opinions, Fed comments, and UK GDP
RBA gears up for a widely anticipated rate hike amidst stubbornly strong inflation figures. With inflation showing no signs of a slowdown, indicated by a quarterly CPI jump of 1.2% and a monthly CPI acceleration to 5.6% yoy, all eyes are on the RBA's rate decision and its subsequent implications on monetary policy.
Investors and analysts alike are bracing for a 25 basis point increase to 4.35%, but the larger narrative lies in RBA's inflation forecasts and the strategic path set for future rates. The uncertainty is palpable, and the forthcoming Statement on Monetary Policy is expected to shed light on these pivotal questions.
Simultaneously, BoJ is slated to release Summary of Opinions from its late October meeting. The bank's subtle shift in language, hinting at a more flexible stance on the 1% yield cap, has stoked interest in the details of this adjustment and the broader implications for Japan's protracted negative interest rate policy. Upcoming cash earnings data from Japan will also be scrutinized as wages growth is a prerequisite to sustainable inflation.
Adding to the mix, BoC and ECB will also be under examination as they publish summaries of deliberation and an economic bulletin, respectively. Additionally, as the Fed's blackout period ended, the financial world awaits policymakers' insights, particularly their perspectives on the timing and extent of future rate reductions.
On the data front, UK's GDP figures are expected to be a highlight too, with current indicators hinting at the UK skirting the edges of a recession. Negative deviations from expected GDP outcomes could solidify the narrative that BoE's rate hikes have reached their peak already.
Lastly, as the global economic pulse is continually assessed, China's upcoming reports on trade balance, CPI, and PPI will provide valuable data points, offering a glimpse into the resilience of the world's second-largest economy amid widespread deflation and slowdown concerns.
Here are some highlights for the week:
- Monday: BoJ minutes; Germany factory orders; Eurozone PMI Services final, Sentix investor confidence; UK PMI construction; Canada Ivey PMI.
- Tuesday: Japan average cash earnings, household spending; China trade balance; RBA rate decision; Swiss unemployment rate, foreign currency reserves; Germany industrial production; Eurozone PPI; Canada trade balance; US trade balance.
- Wednesday: New Zealand inflation expectations; Germany CPI final; France trade balance; Italy retail sales; Eurozone retail sales; Canada building permits; BoC summary of deliberations.
- Thursday: BoJ summary of opinions; China CPI, PPI; ECB monthly bulletin; US jobless claims.
- Friday: UK GDP, production, trade balance; US U of Michigan consumer sentiment.
GBP/USD Daily Outlook
Daily Pivots: (S1) 1.2247; (P) 1.2318; (R1) 1.2452; More
GBP/USD retreats mildly today intraday bias stays on the upside at this point. Further rally should be seen to 38.2% retracement of 1.3141 to 1.2036 at 1.2458. Sustained break there will pave the way to 61.8% retracement at 1.2783. On the downside, below 1.2309 minor support will turn intraday bias neutral first.
In the bigger picture, the strong rebound from 38.2% retracement of 1.0351 to 1.3141 at 1.2075 argues that price action from 1.3141 are merely a correction to rise from 1.0351 (2022 low). Current rally from 1.2036 is tentatively seen as the second leg of the pattern. Hence, while further rally is in favor, upside should be limited by 1.3141 to start the third leg.
Economic Indicators Update
| GMT | Ccy | Events | Actual | Forecast | Previous | Revised |
|---|---|---|---|---|---|---|
| 23:50 | JPY | BoJ Minutes | ||||
| 00:00 | AUD | TD Securities Inflation M/M Oct | -0.10% | 0.00% | ||
| 07:00 | EUR | Germany Factory Orders M/M Sep | -1.40% | 3.90% | ||
| 08:45 | EUR | Italy Services PMI Oct | 48.5 | 49.9 | ||
| 08:50 | EUR | France Services PMI Oct | 46.1 | 46.1 | ||
| 08:55 | EUR | Germany Services PMI Oct | 48 | 48 | ||
| 09:00 | EUR | Eurozone Services PMI Oct | 47.8 | 47.8 | ||
| 09:30 | EUR | Eurozone Sentix Investor Confidence Nov | -22.5 | -21.9 | ||
| 09:30 | GBP | Construction PMI Oct | 46.2 | 45 | ||
| 15:00 | CAD | Ivey PMI Oct | 54 | 53.1 |
Technical Outlook and Review
DXY:
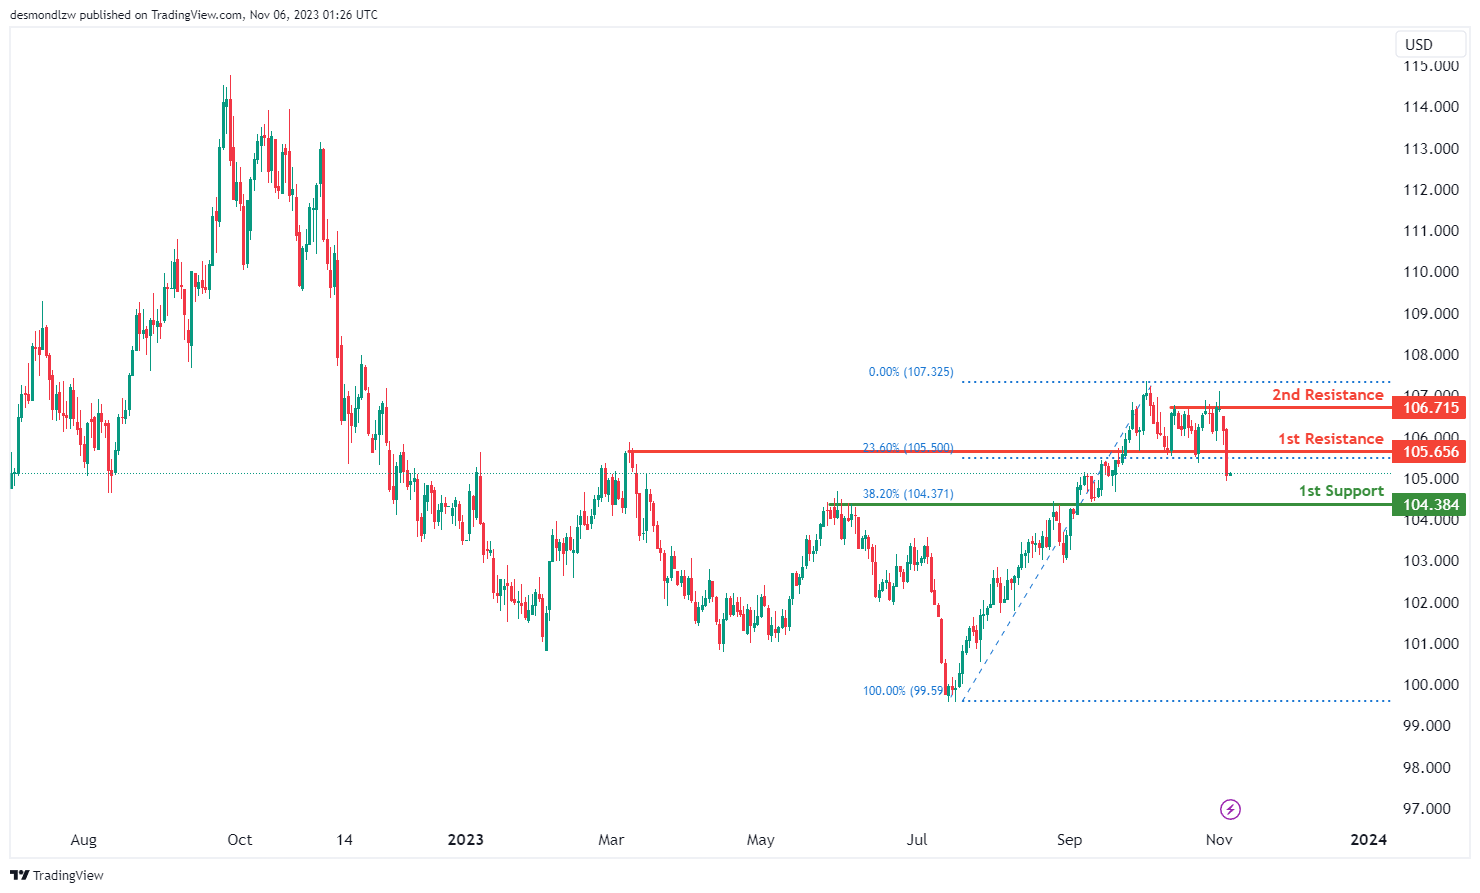
The DXY (US Dollar Index) chart currently has a bearish overall momentum, suggesting the potential for a bearish reaction off the 1st resistance level and a drop towards the 1st support.
The 1st support at 104.38 is identified as an overlap support and is associated with the 38.20% Fibonacci Retracement level, indicating it could be a significant level where the price might find some buying interest.
On the resistance side, the 1st resistance at 105.65 is categorized as a pullback resistance, suggesting it could act as a level where the price may face selling pressure.
The 2nd resistance at 106.71 is defined as a multi-swing high resistance, indicating another potential level where the price may encounter obstacles in its upward movement.
EUR/USD:
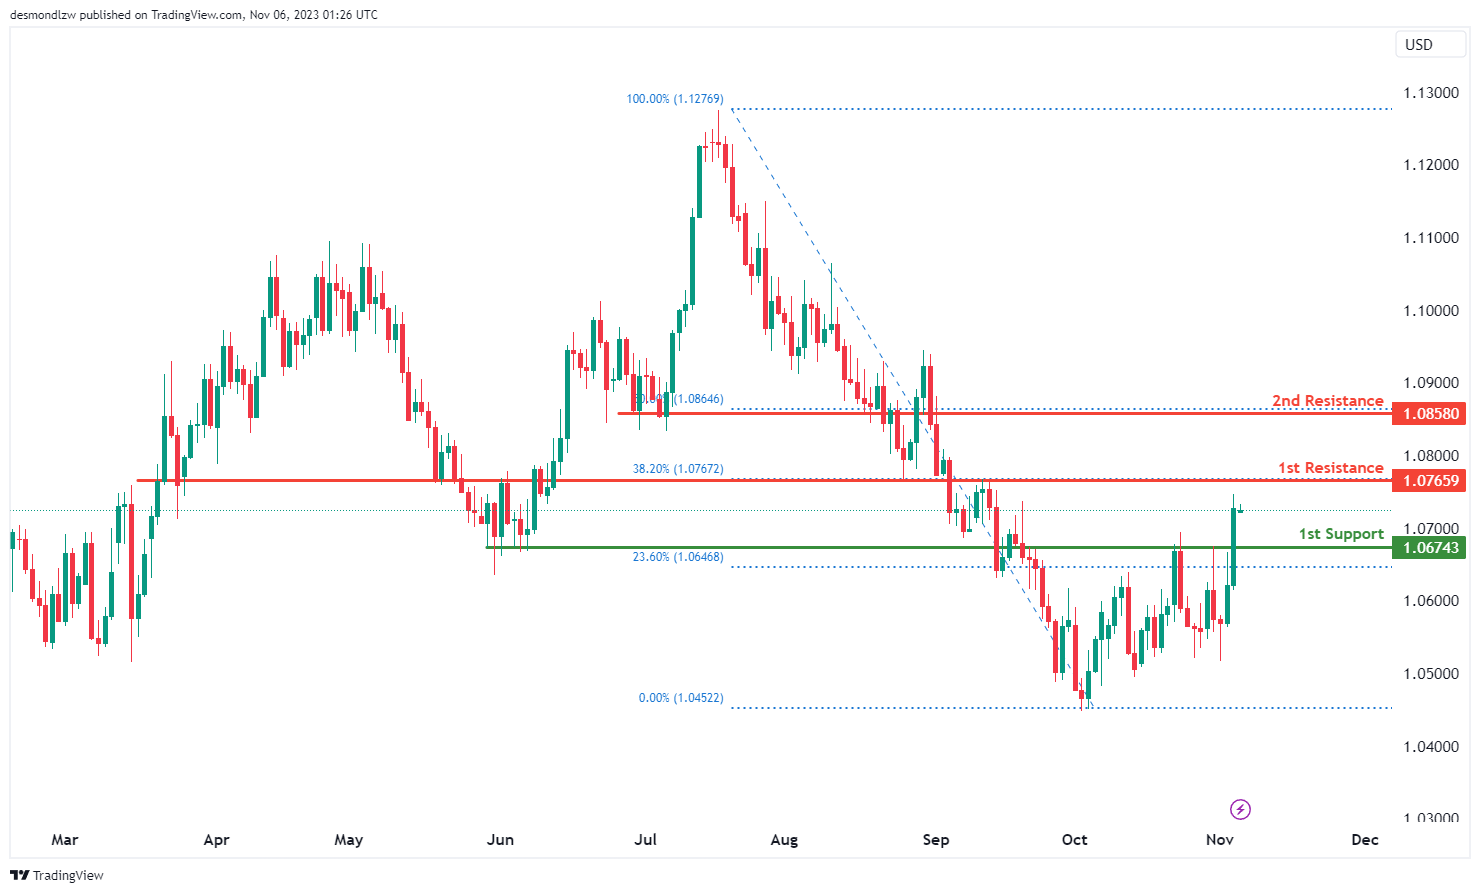
The EUR/USD chart currently has a bullish overall momentum, indicating the potential for a bullish continuation towards the 1st resistance.
The 1st support at 1.0674 is identified as a pullback support and is associated with the 23.60% Fibonacci Retracement level, suggesting it could be a significant level where the price might find buying interest.
On the resistance side, the 1st resistance at 1.0765 is categorized as an overlap resistance and is linked to the 38.20% Fibonacci Retracement level, indicating it could act as a level where the price may encounter selling pressure.
The 2nd resistance at 1.0858 is identified as a pullback resistance and is related to the 50% Fibonacci Retracement level, further reinforcing its potential as a level where the price might face obstacles in its upward movement.
EUR/JPY:
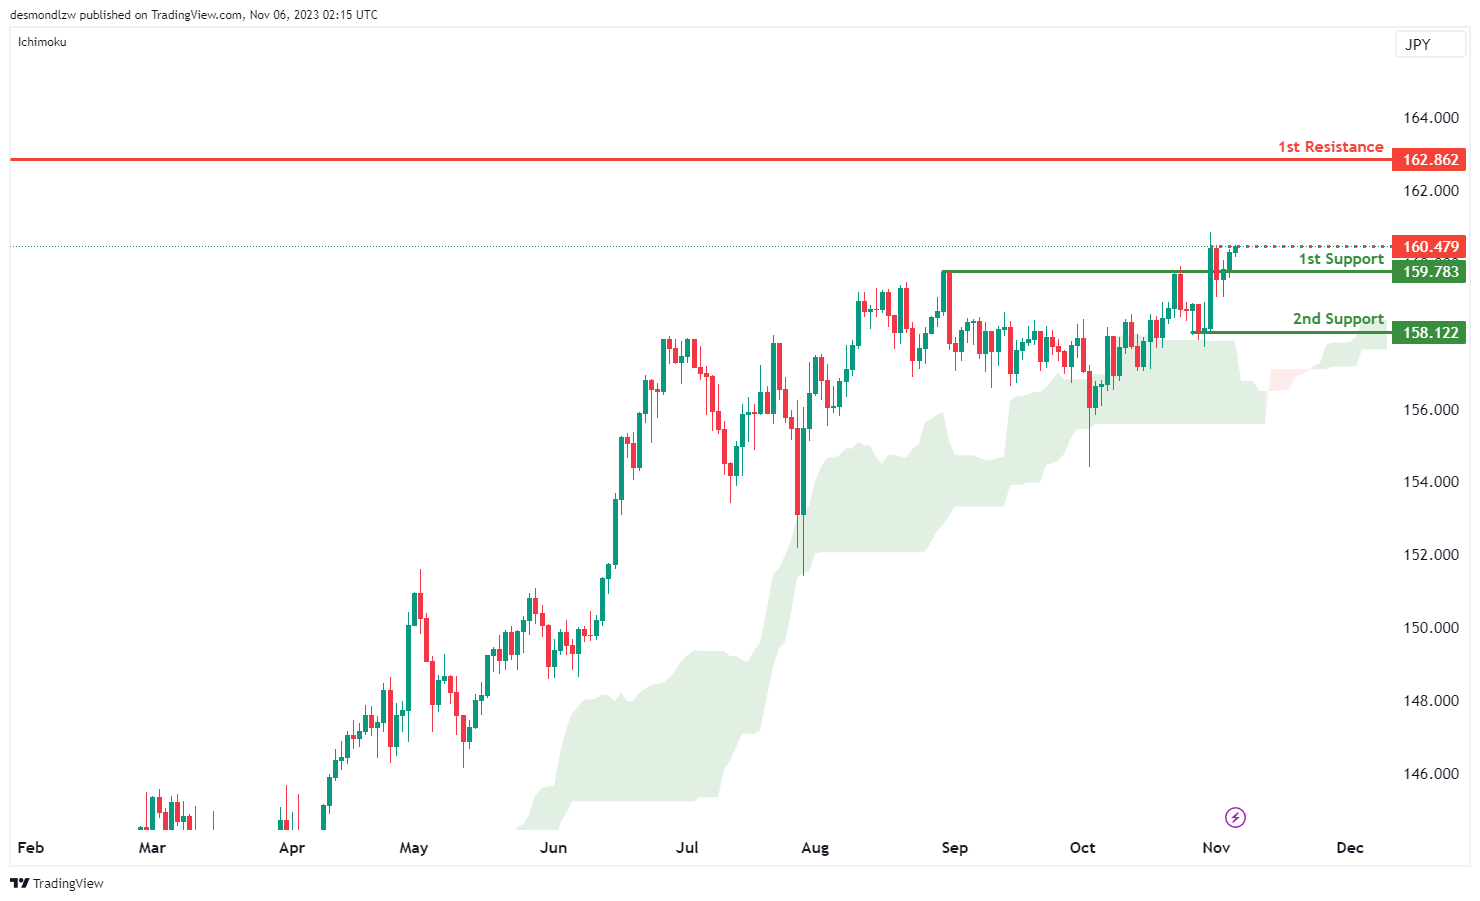
For EUR/JPY, the chart’s overall momentum is currently bullish, supported by the price trading above the bullish Ichimoku cloud. There’s a potential for a bullish continuation towards the first resistance.
The first support at 159.78 is identified as a pullback support, representing a level where the price might find support during any potential retracement in the bullish trend.
The second support at 158.12 is recognized as swing low support, indicating an additional level that might offer support during the bullish trend.
On the resistance side, the first resistance at 162.86 is characterized as swing high resistance, signifying a level that could potentially act as a significant barrier to the price’s upward movement within the current bullish scenario.
Additionally, an intermediate resistance at 160.47 is associated with swing high resistance, further supporting a potential level that could pose an obstacle to the price’s upward movement within the bullish trend.
EUR/GBP:
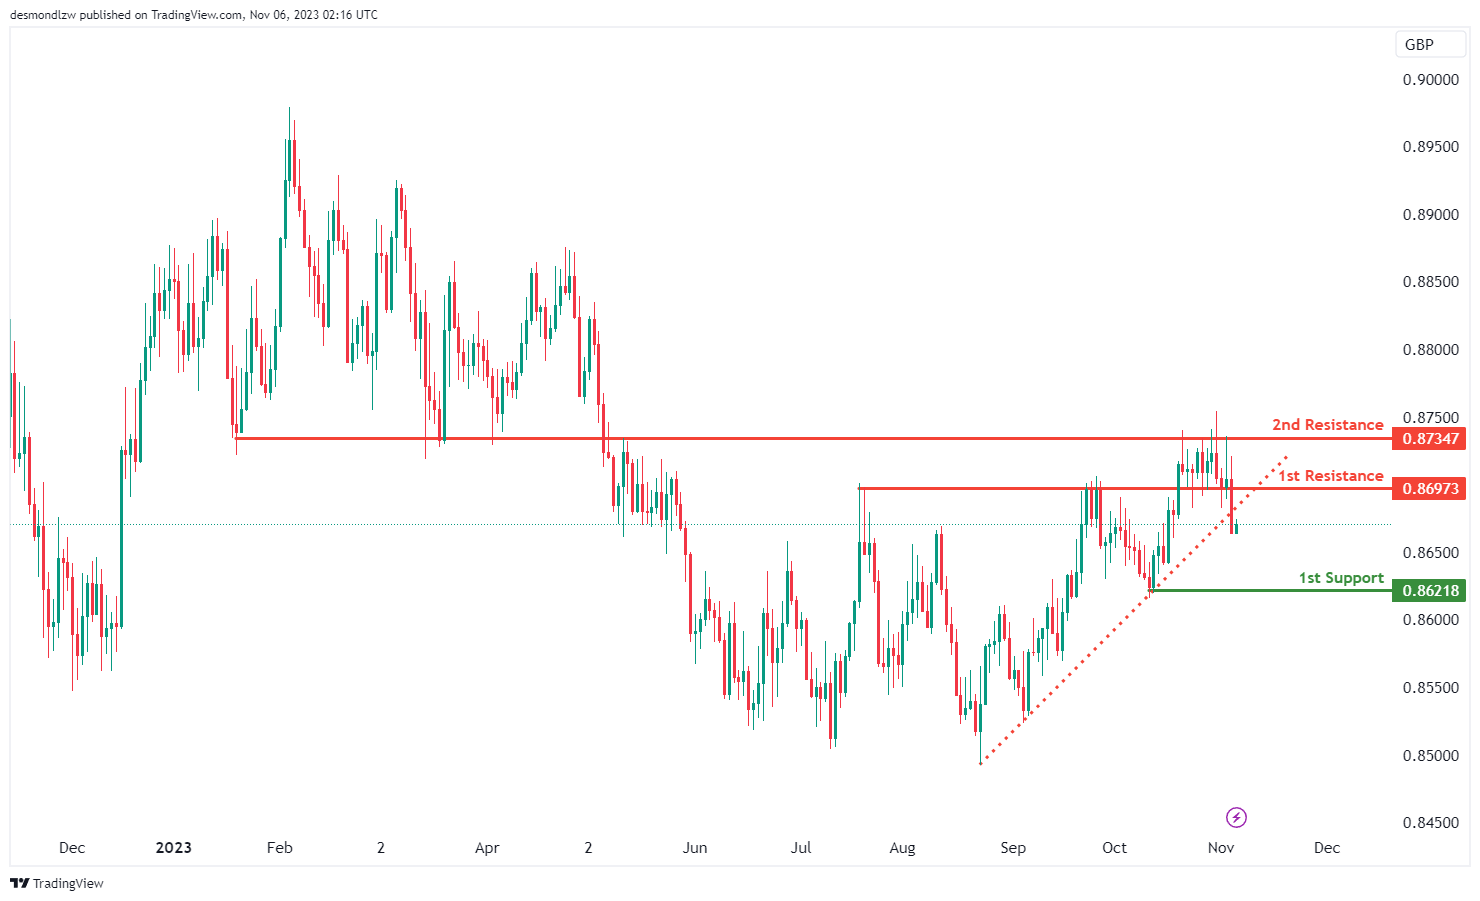
For EUR/GBP, the overall momentum of the chart is presently bearish, triggered by the price breaking below an ascending support line, suggesting a potential for a bearish move.
There’s a possibility that the price might rise towards the first resistance at 0.8697 in the short term before reversing and potentially dropping towards the first support.
The first support at 0.8621 is recognized as a level of swing low support, indicating a point where the price might find support during a potential downward movement.
On the resistance side, the first resistance at 0.8697 is identified as pullback resistance, suggesting a level that could potentially act as a barrier to the short-term upward movement within the overall bearish context.
Furthermore, the second resistance at 0.8734 is characterized as an overlap resistance, indicating it could serve as an additional substantial barrier to the price’s upward movement within the prevailing bearish trend.
GBP/USD:
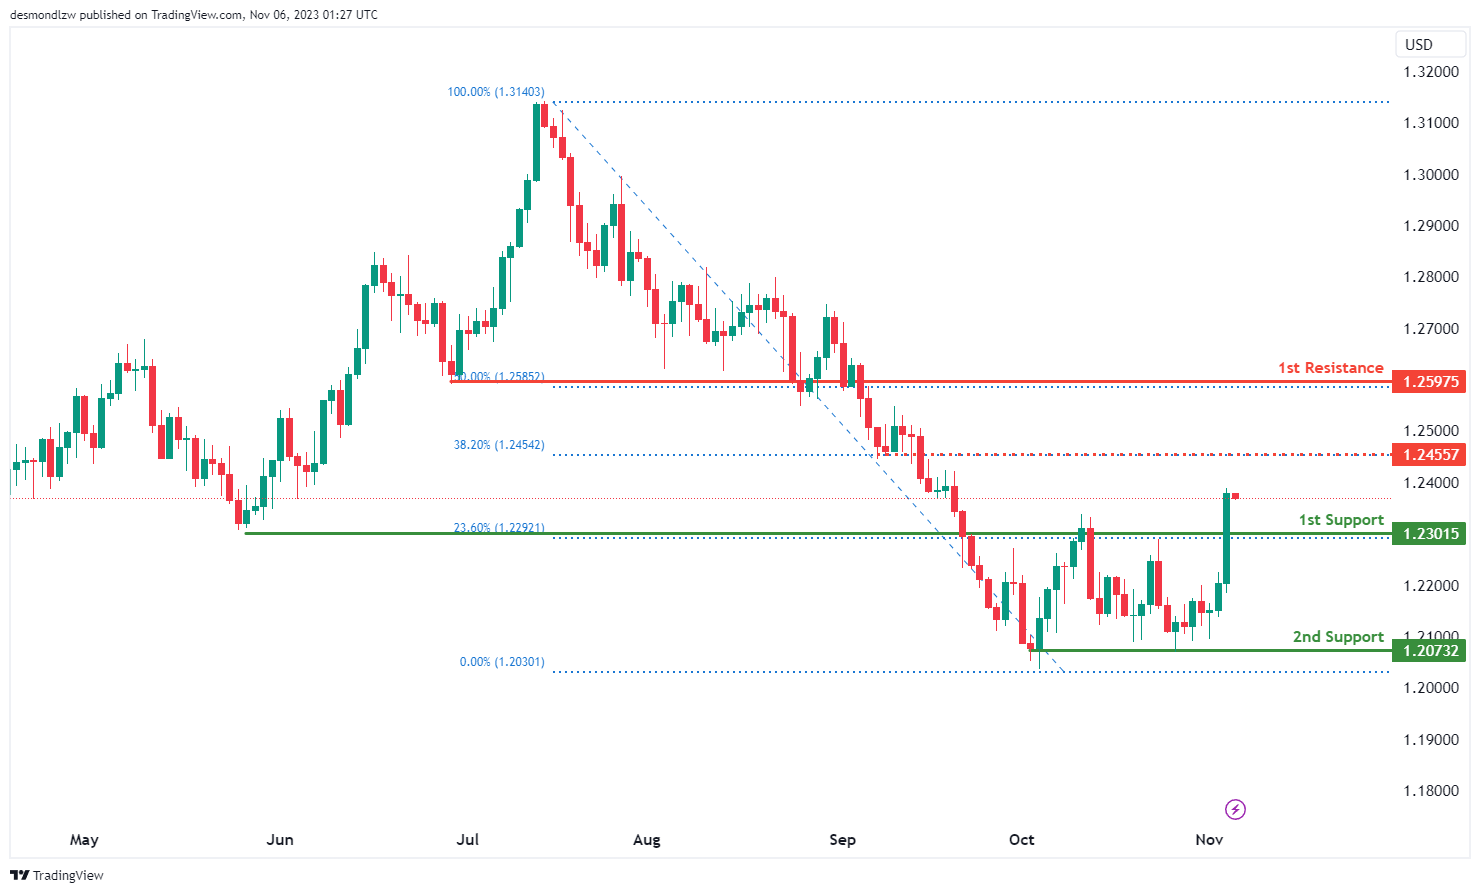
The GBP/USD chart currently has a bullish overall momentum, suggesting the potential for a bullish continuation towards the 1st resistance.
The 1st support at 1.2301 is identified as a pullback support and is associated with the 23.60% Fibonacci Retracement level, indicating it could be a significant level where the price might find buying interest.
The 2nd support at 1.2073 is considered a multi-swing low support, further reinforcing its potential as a support level.
On the resistance side, the 1st resistance at 1.2597 is categorized as a pullback resistance and is linked to the 50% Fibonacci Retracement level, suggesting it could act as a level where the price may encounter selling pressure.
Intermediate resistance at 1.2455 is also noted as a pullback resistance and is related to the 38.20% Fibonacci Retracement level, adding to the potential areas where the price might find resistance.
GBP/JPY:
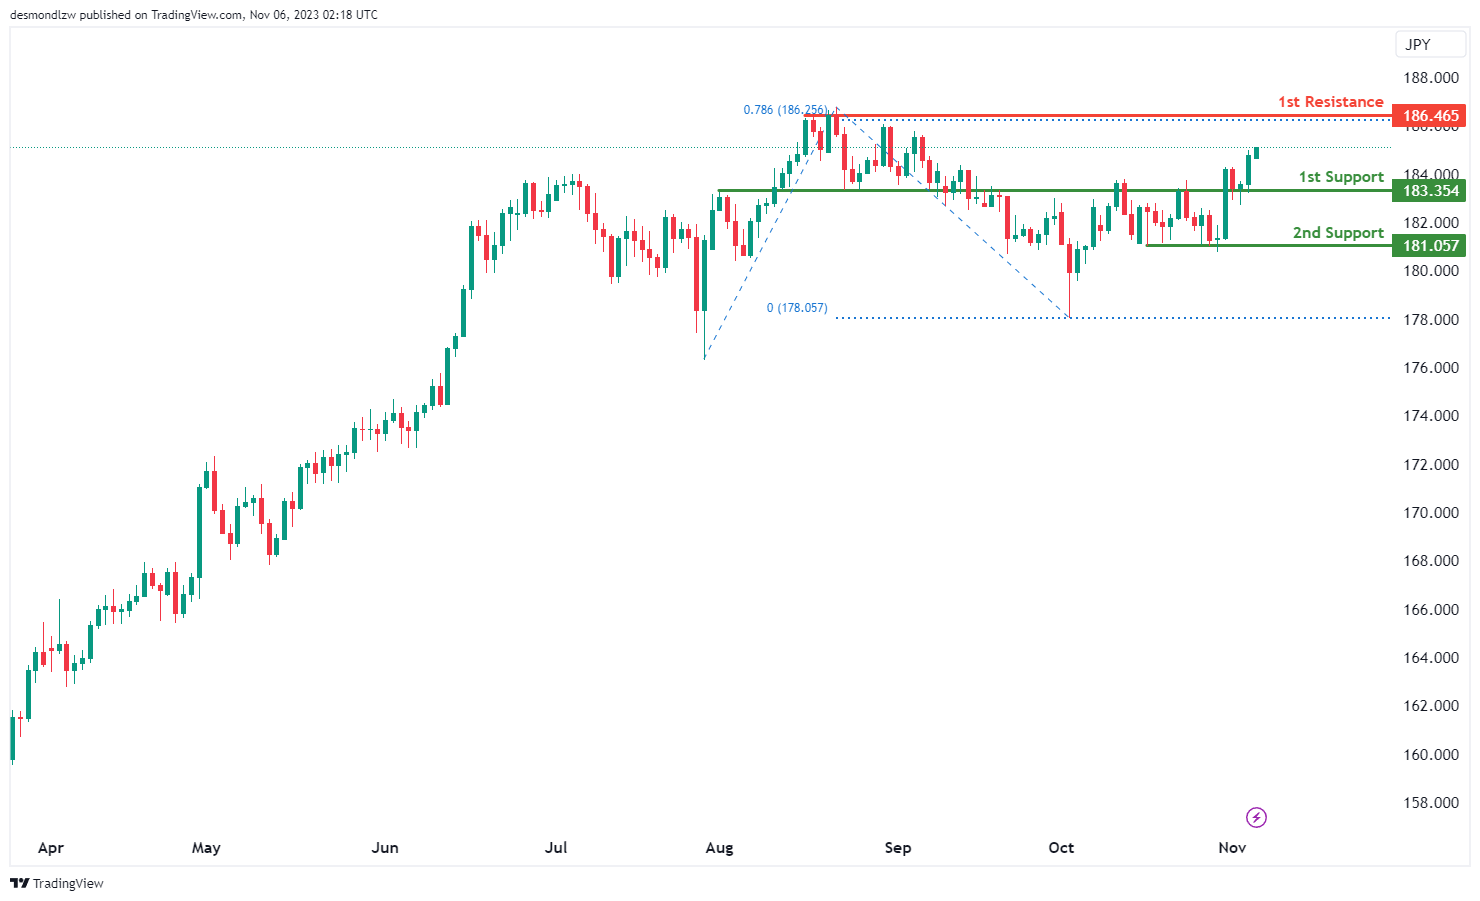
For GBP/JPY, the chart currently reflects a bullish momentum, indicating a potential scenario for a bullish continuation towards the first resistance.
The first support at 183.35 is identified as a level of pullback support, suggesting it might act as a supportive level during any potential retracement in the bullish trend.
The second support at 181.05 is recognized as multi-swing low support, providing an additional level that might offer support during the bullish trend.
On the resistance side, the first resistance at 186.46 is characterized as multi-swing high resistance, coinciding with the 78.60% Fibonacci Projection. This suggests that it could act as a significant level, potentially hindering further bullish movement within the current upward trend.
USD/CHF:
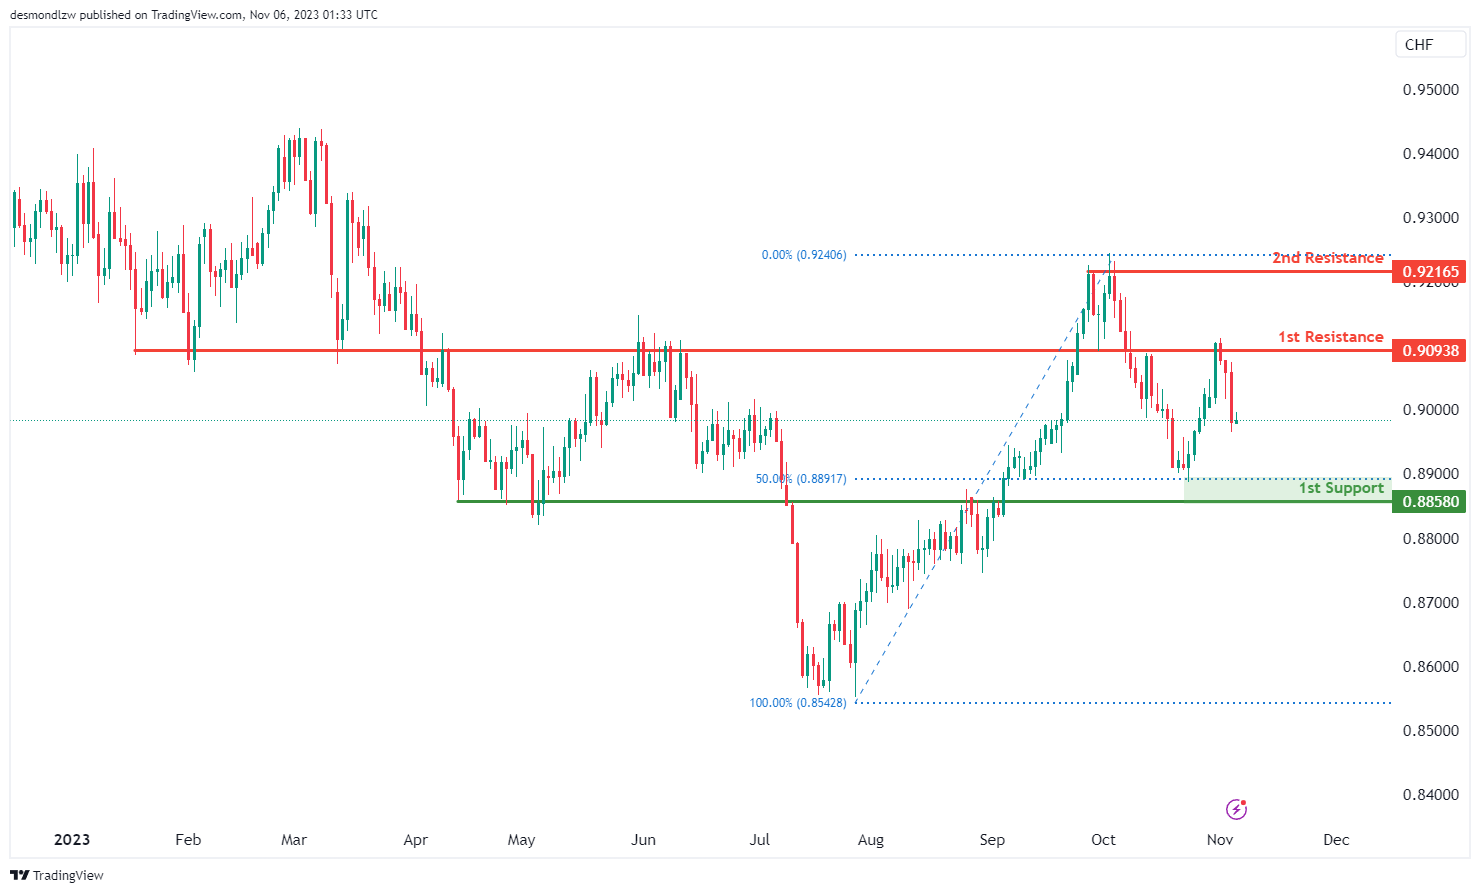
The USD/CHF chart currently has a bearish overall momentum, suggesting the potential for a bearish continuation towards the 1st support.
The 1st support at 0.8858 is identified as an overlap support and is associated with the 50% level, indicating it could be a significant level where the price might find some buying interest.
On the resistance side, the 1st resistance at 0.9093 is categorized as an overlap resistance, suggesting it could act as a level where the price may face selling pressure.
The 2nd resistance at 0.9216 is considered a multi-swing high resistance, indicating another potential level where the price may encounter obstacles in its upward movement.
USD/JPY:
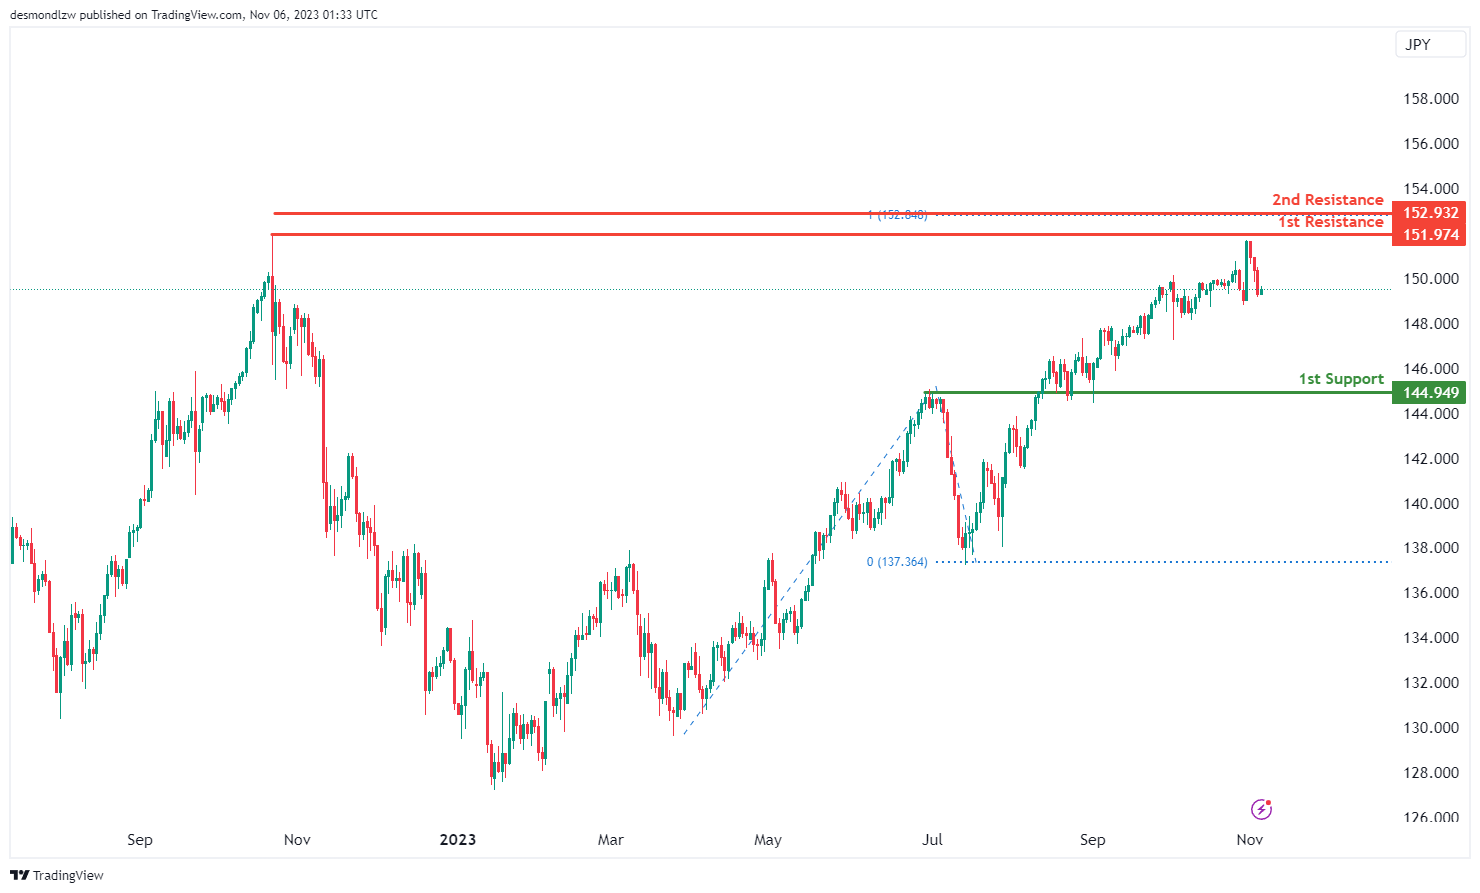
The USD/JPY chart currently has a bearish overall momentum, suggesting the potential for a bearish continuation towards the 1st support.
The 1st support at 144.94 is identified as an overlap support, indicating it could be a significant level where the price might find some buying interest.
On the resistance side, the 1st resistance at 151.97 is categorized as a swing high resistance, suggesting it could act as a level where the price may face selling pressure.
The 2nd resistance at 152.93 is associated with the 100% Fibonacci Projection, indicating another potential level where the price may encounter obstacles in its upward movement.
USD/CAD:
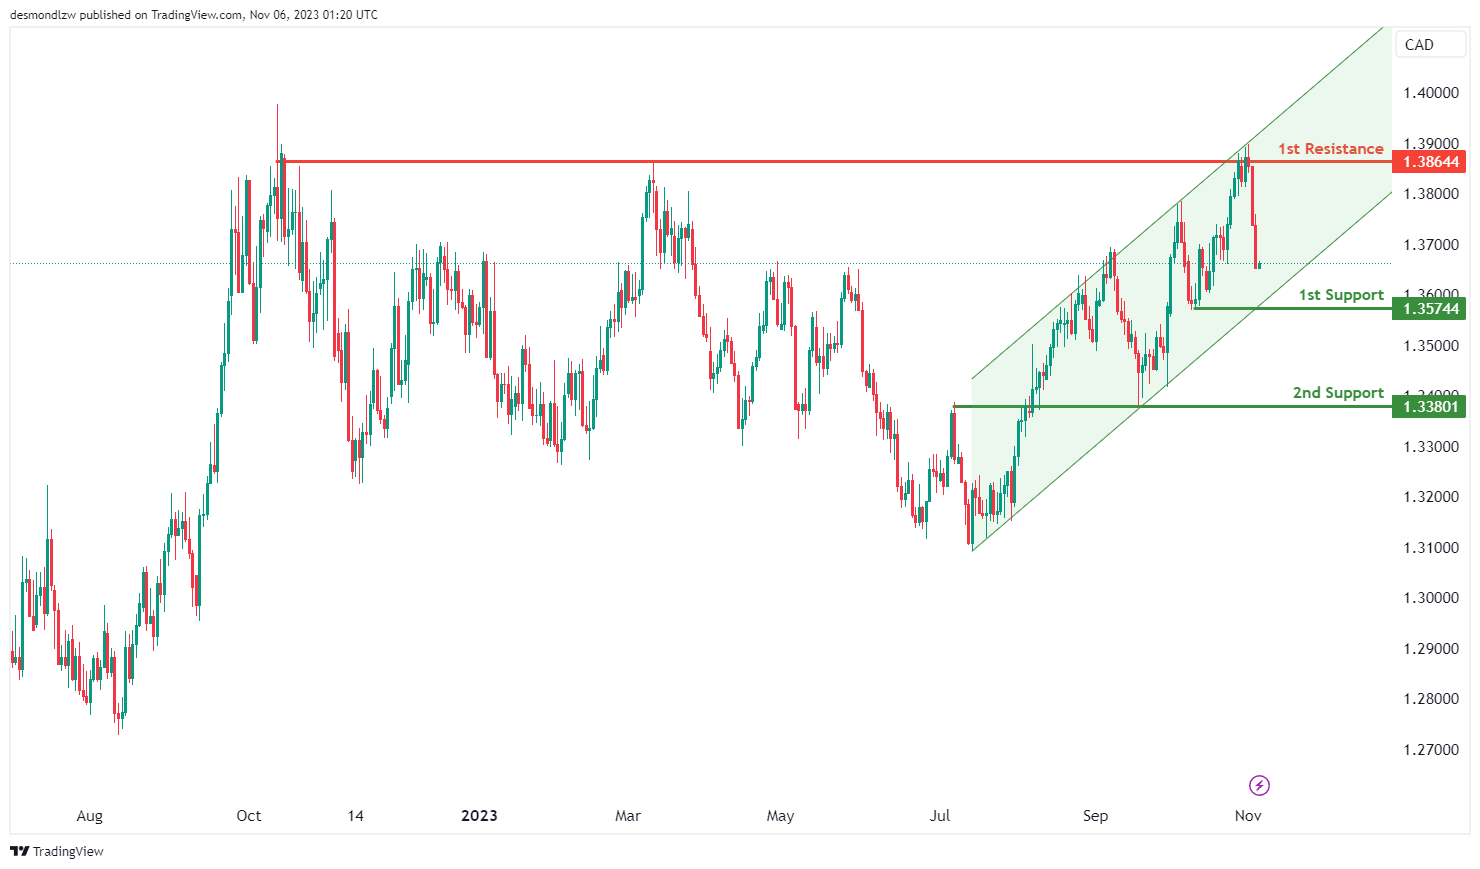
The USD/CAD chart currently demonstrates an overall bearish momentum. However, there is a potential scenario for price to make a bullish bounce off the 1st support. Price is also trading within a bullish channel, potentially acting as a support zone.
The 1st support level at 1.3574 is identified as a pullback support. Further below, the 2nd support level at 1.3380 is marked as an overlap support, indicating a potential area of price support.
To the upside, the 1st resistance level at 1.3864 is identified as a multi-swing-high resistance that aligns close to the upper trendline of the bullish channel, further reinforcing the potential for resistance in that region.
AUD/USD:
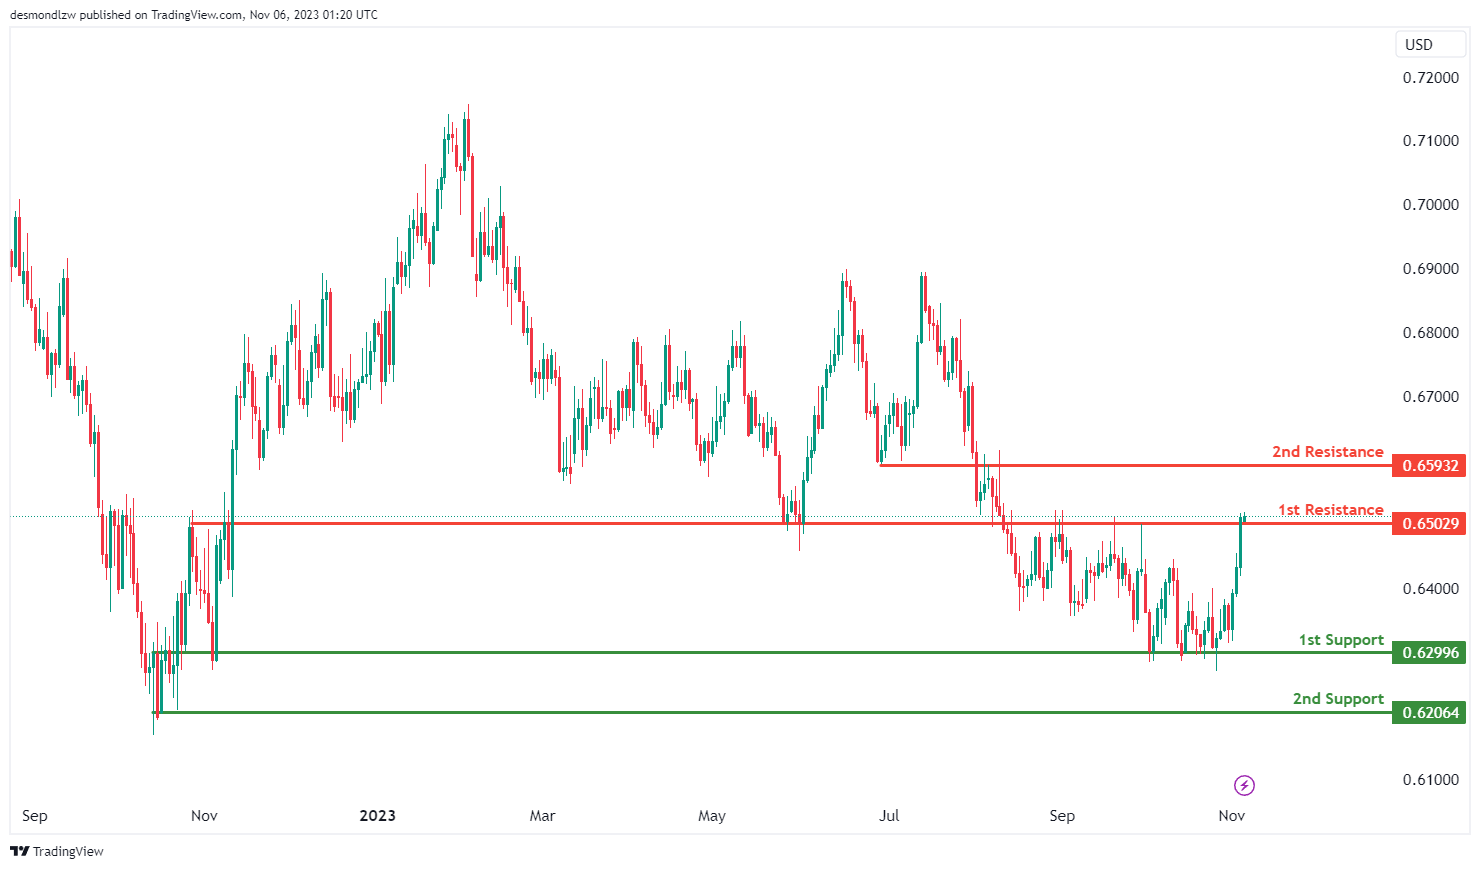
The AUD/USD chart currently exhibits an overall bullish momentum, suggesting a potential for a bullish breakout of the 1st resistance and move higher towards the 2nd resistance.
The 1st resistance level at 0.6503 is identified as an overlap resistance. Higher up, the 2nd resistance level at 0.6593 is also noted as an overlap resistance.
To the downside, the 1st support level at 0.6299 is identified as an overlap support. Further below, the 2nd support level at 0.6206 is marked as a swing-low support, indicating a potential for a strong price support.
NZD/USD
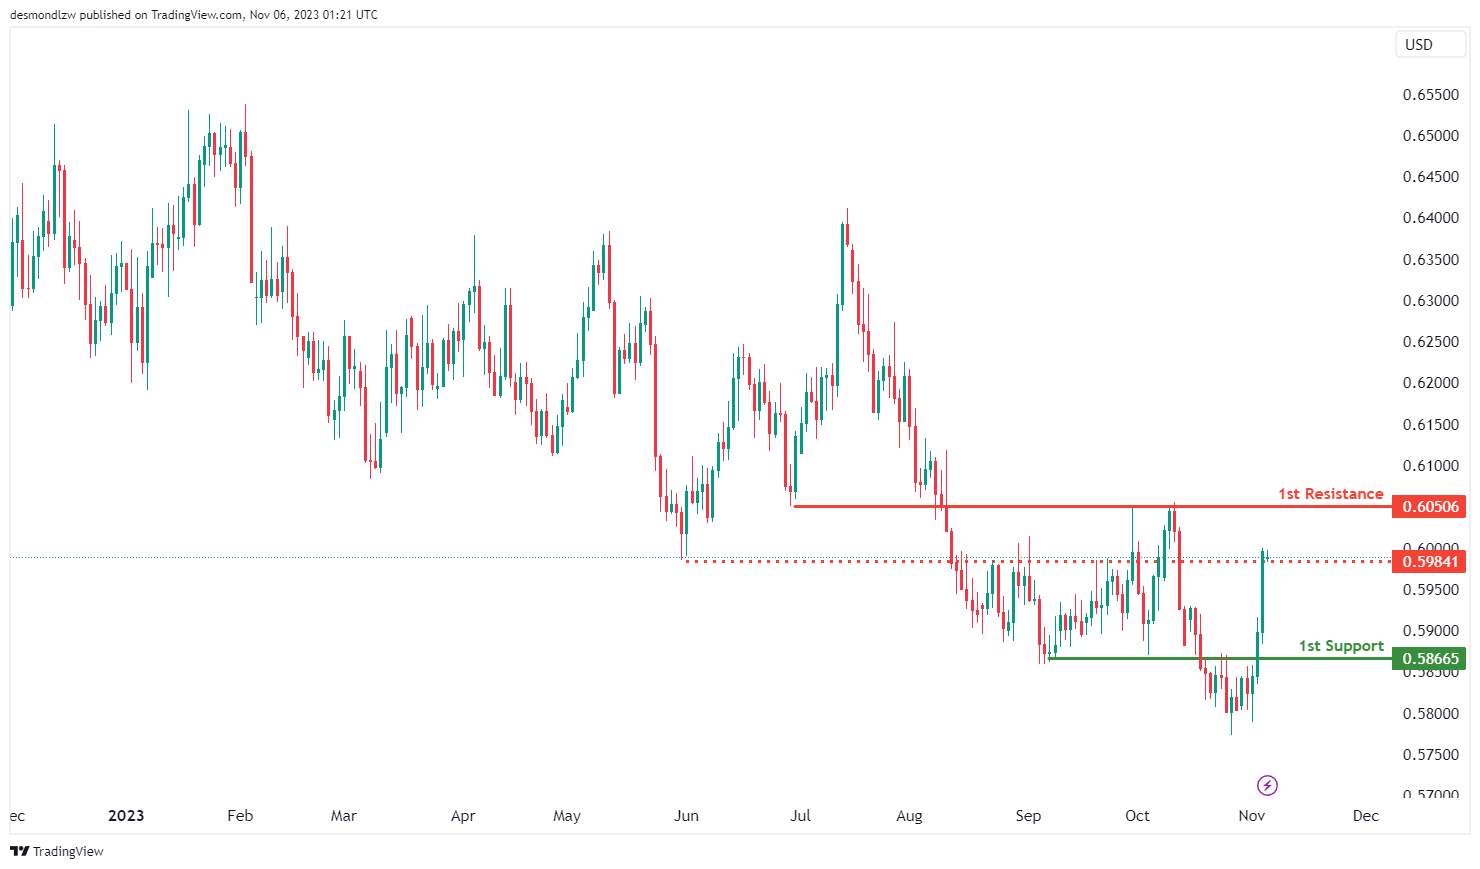
The NZD/USD chart currently demonstrates an overall bullish momentum, suggesting a potential for a bullish continuation towards the 1st resistance.
The intermediate resistance level at 0.5984 is identified as an overlap resistance while the 1st resistance level at 0.6051 is also marked as an overlap resistance, acting as a potential barrier to upward price movements.
To the downside, the 1st support level at 0.5867 is identified as an overlap support, potentially acting as a strong support zone.
DJ30:
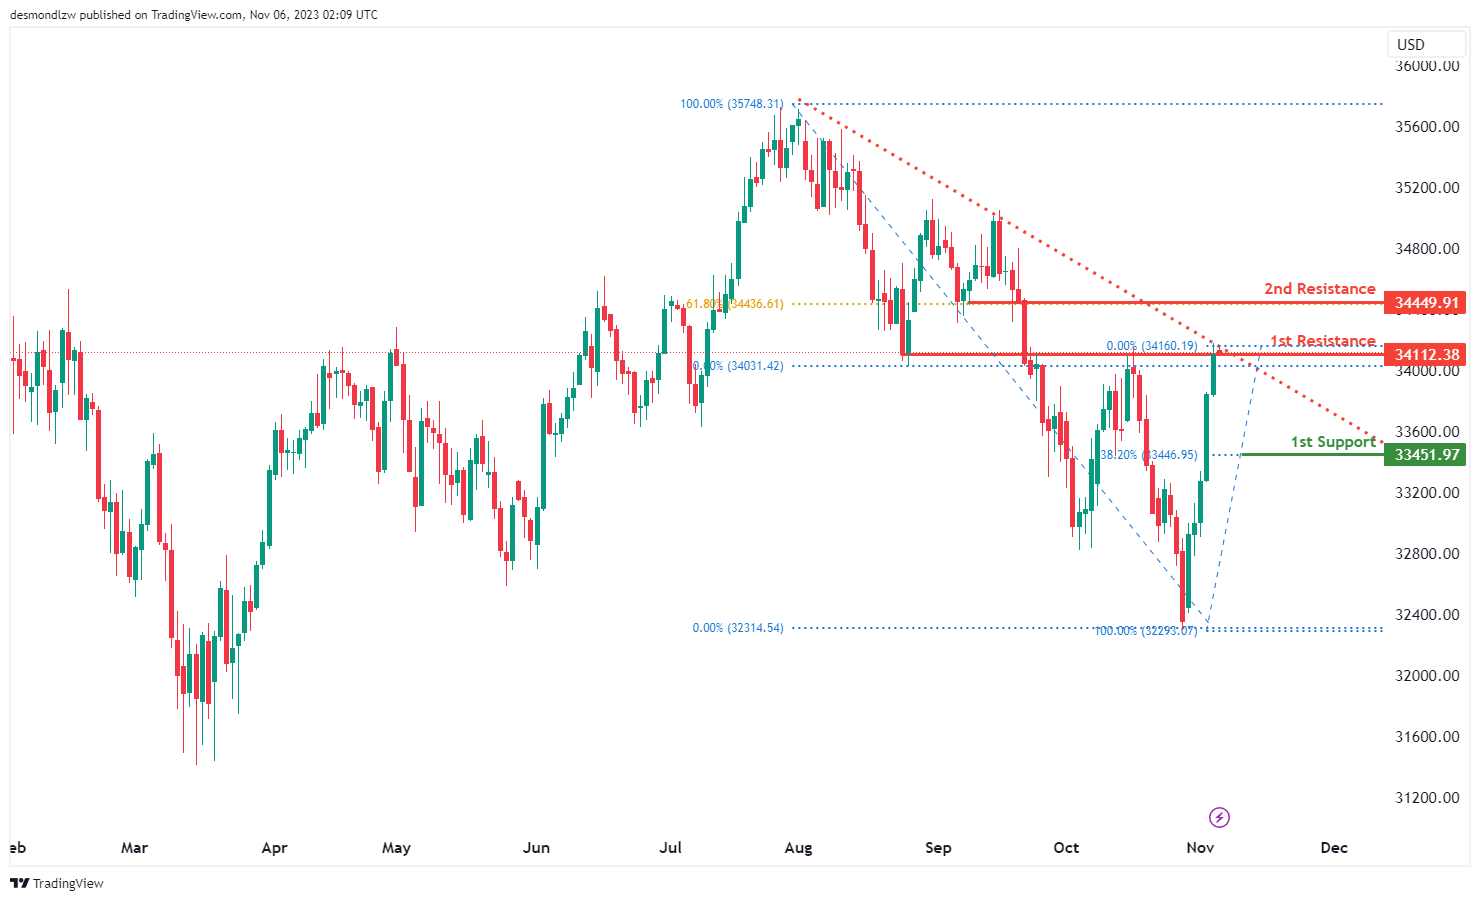
The DJ30 chart currently shows a bearish momentum, characterized by the price being below a major descending trend line, suggesting a potential continuation of bearish sentiment.
There is a likelihood for a bearish reaction off the first resistance at 34112.38, potentially leading to a drop to the first support.
The first support at 33451.97 is associated with the 38.20% Fibonacci Retracement, indicating a level where the price might find support during its potential decline in the bearish trend.
On the resistance side, the first resistance at 34112.38 is recognized as an overlap resistance, representing a significant barrier to the price’s upward movement in the current bearish scenario.
The second resistance at 34449.91 is identified as pullback resistance, suggesting it might pose another substantial obstacle for the price’s upward movement within the prevailing bearish trend.
GER40:
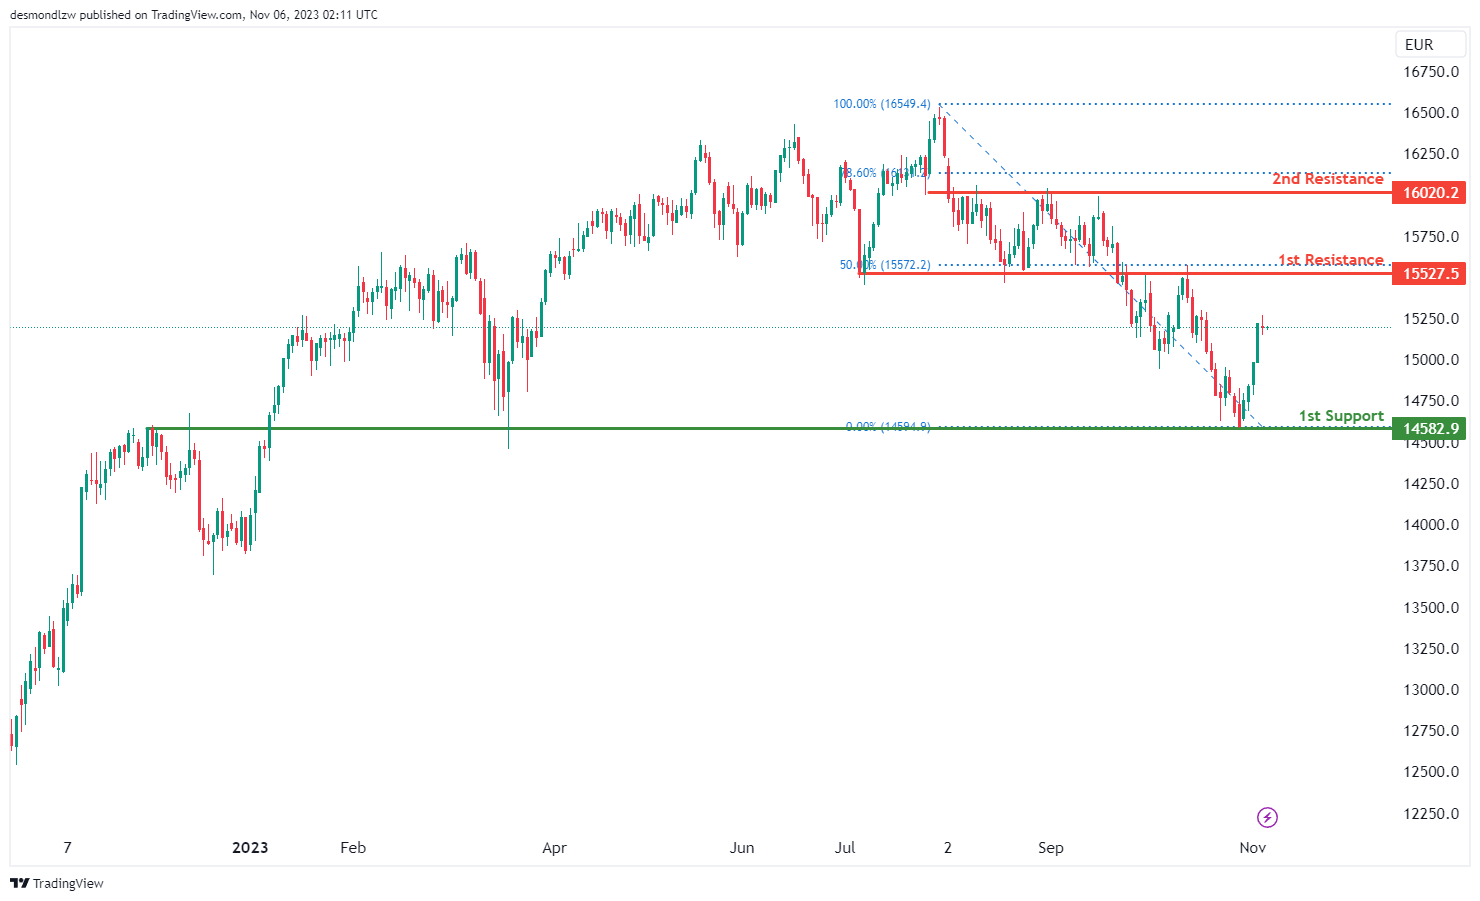
For GER40, the chart currently demonstrates a bullish momentum, suggesting a potential scenario for a bullish continuation towards the first resistance.
The first support at 14582.90 is recognized as an overlap support, indicating a level where the price might find support during any potential retracement or decline in the bullish trend.
On the resistance side, the first resistance at 15527.50 is characterized as an overlap resistance and coincides with the 50% Fibonacci Retracement level, suggesting it as a significant barrier to the price’s upward movement in the current bullish scenario.
Moreover, the second resistance at 16020.20 aligns with another overlap resistance and the 78.60% Fibonacci Retracement, further solidifying it as a potentially stronger level that could impede the price’s upward movement within the bullish trend.
US500
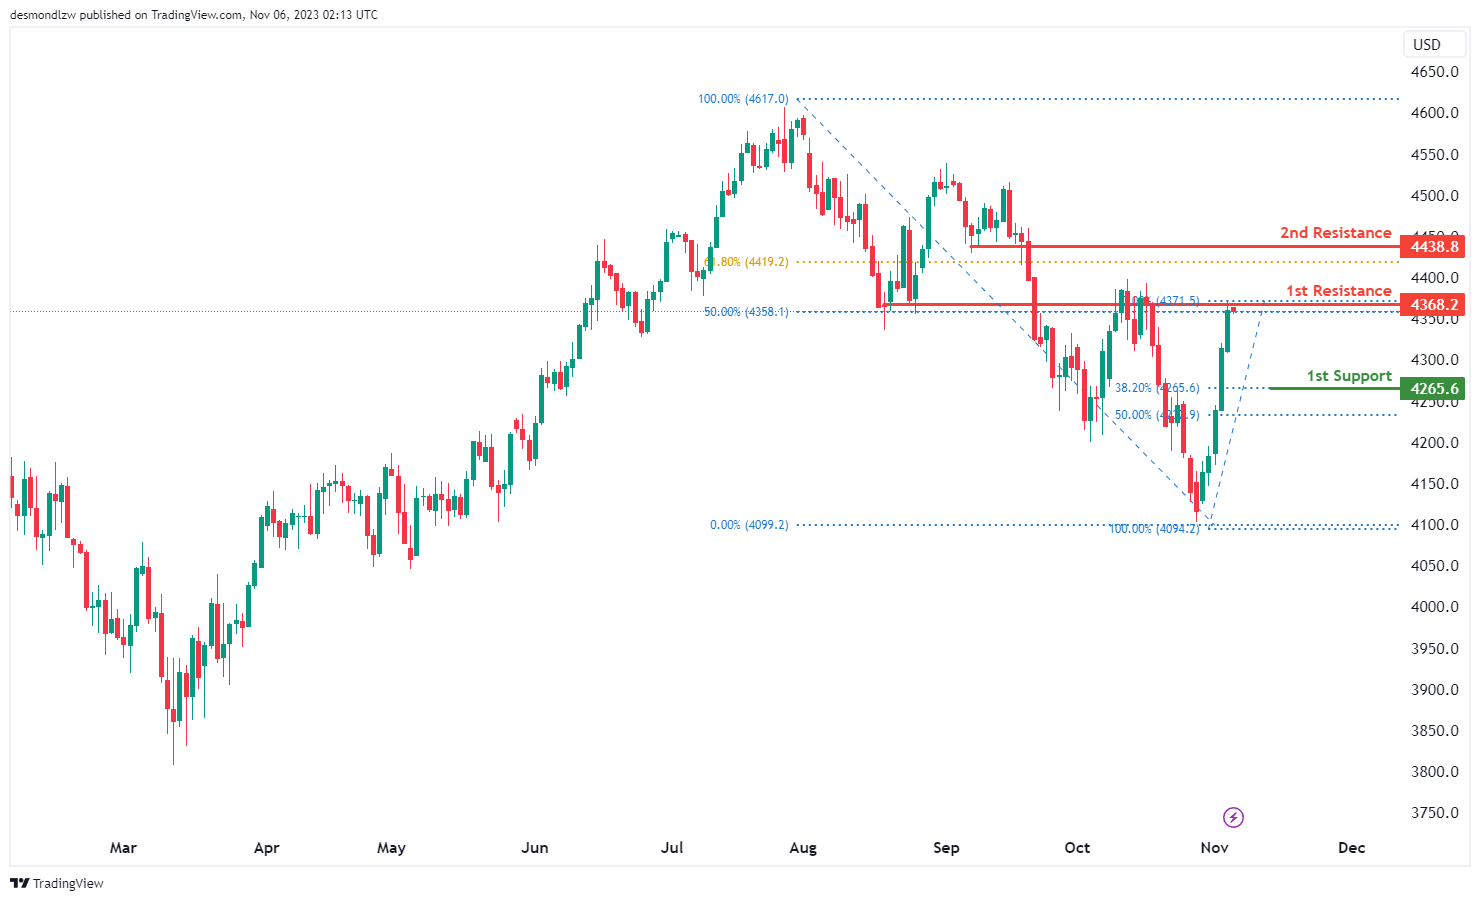
For US500, the chart currently indicates a bearish momentum, suggesting a potential scenario for a bearish reaction off the first resistance at 4368.2, possibly leading to a drop to the first support.
The first support at 4265.6 is related to the 38.20% Fibonacci Retracement, suggesting a level where the price might find support during its potential decline in the bearish trend.
On the resistance side, the first resistance at 4368.2 is identified as an overlap resistance and coincides with the 50% Fibonacci Retracement, indicating a significant barrier to the price’s upward movement in the current bearish scenario.
Furthermore, the second resistance at 4438.8 aligns with pullback resistance and the 61.80% Fibonacci Retracement, suggesting it as another potentially strong level that could act as a significant barrier to the price’s upward movement within the bearish trend.
BTC/USD:
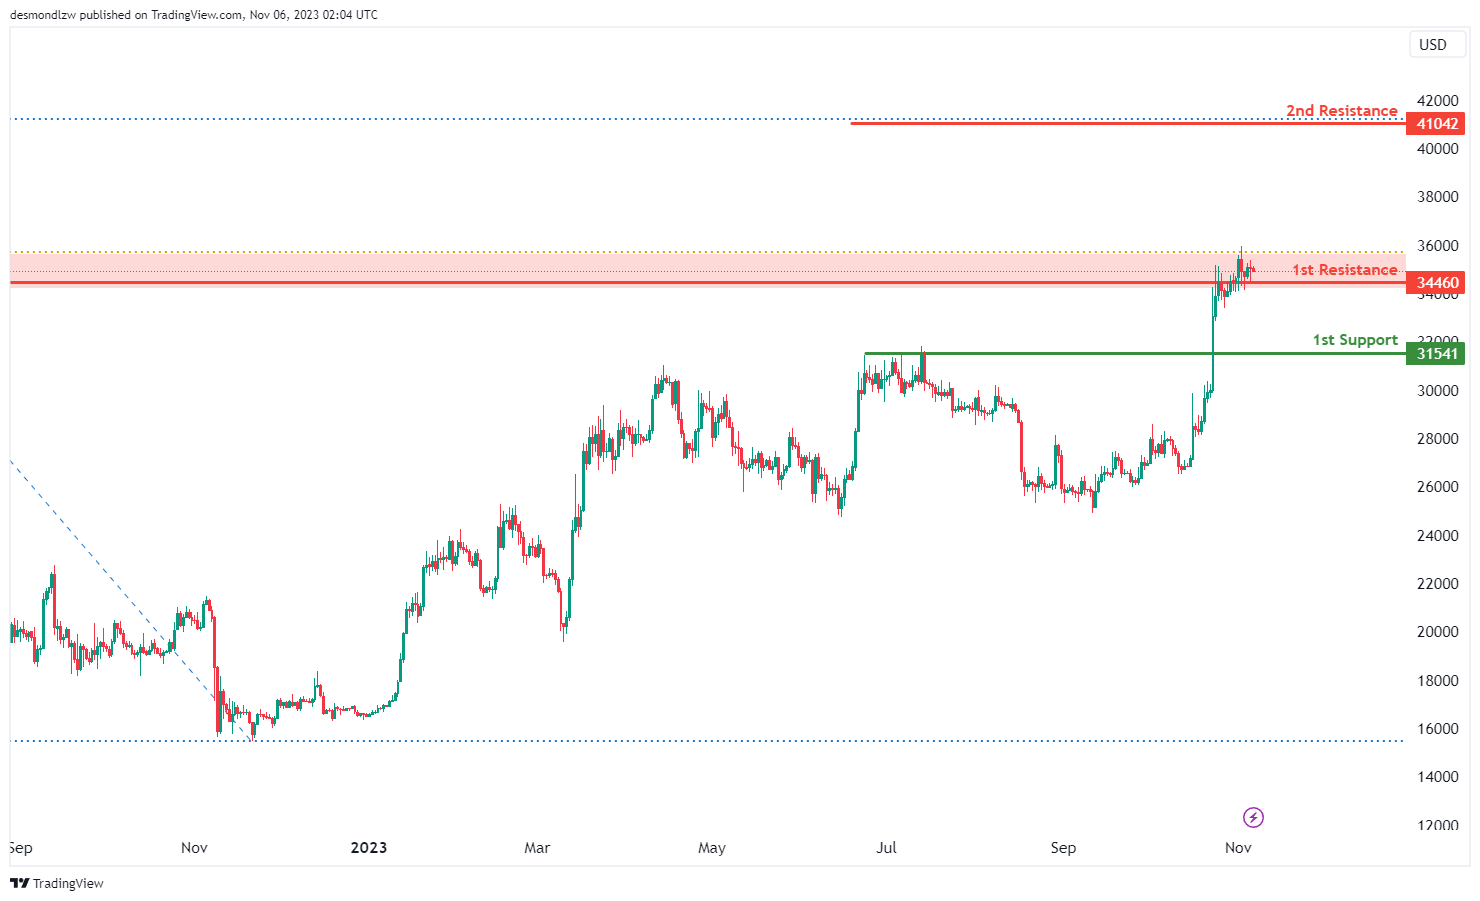
The BTC/USD chart currently suggests a bullish momentum, indicating a potential scenario for a bullish break through the first resistance at 34460, potentially rising towards the second resistance.
The first support at 31541 is considered a pullback support, signifying a level where the price might find support during its upward movement or retracement.
On the resistance side, the first resistance at 34460 is recognized as pullback resistance and aligns with the 61.80% Fibonacci Retracement level. This level indicates a significant hurdle that the price may need to break through for its further upward movement.
Additionally, the second resistance at 41042 is associated with the 78.60% Fibonacci Retracement, indicating a potentially stronger level that could act as a substantial barrier to the price’s upward movement within the bullish trend.
ETH/USD:
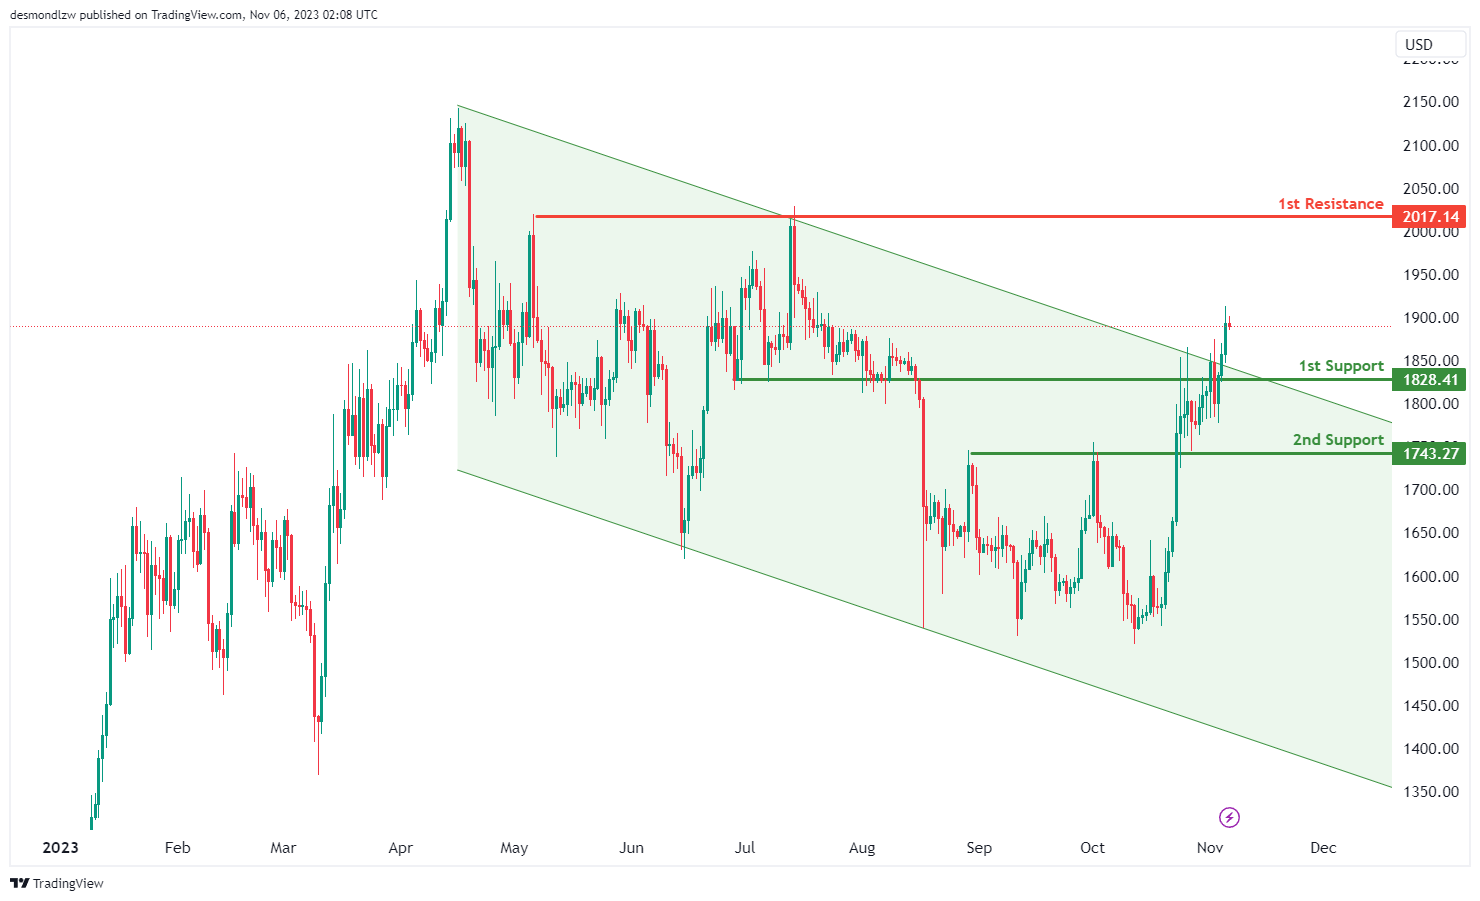
The ETH/USD chart currently exhibits a bullish momentum, driven by the breakthrough above a descending resistance line, which has triggered the potential for a bullish move.
There’s a potential for a bullish continuation towards the first resistance at 2017.14.
The first support at 1828.41 is identified as a pullback support, indicating a level where the price might find support during any potential retracement or decline in its upward movement.
The second support at 1743.27 is recognized as an overlap support, providing an additional level that might offer support during the bullish trend.
On the resistance side, the first resistance at 2017.14 is characterized as multi-swing high resistance, signifying a level that could potentially act as a significant barrier to the price’s upward movement within the current bullish scenario.
WTI/USD:
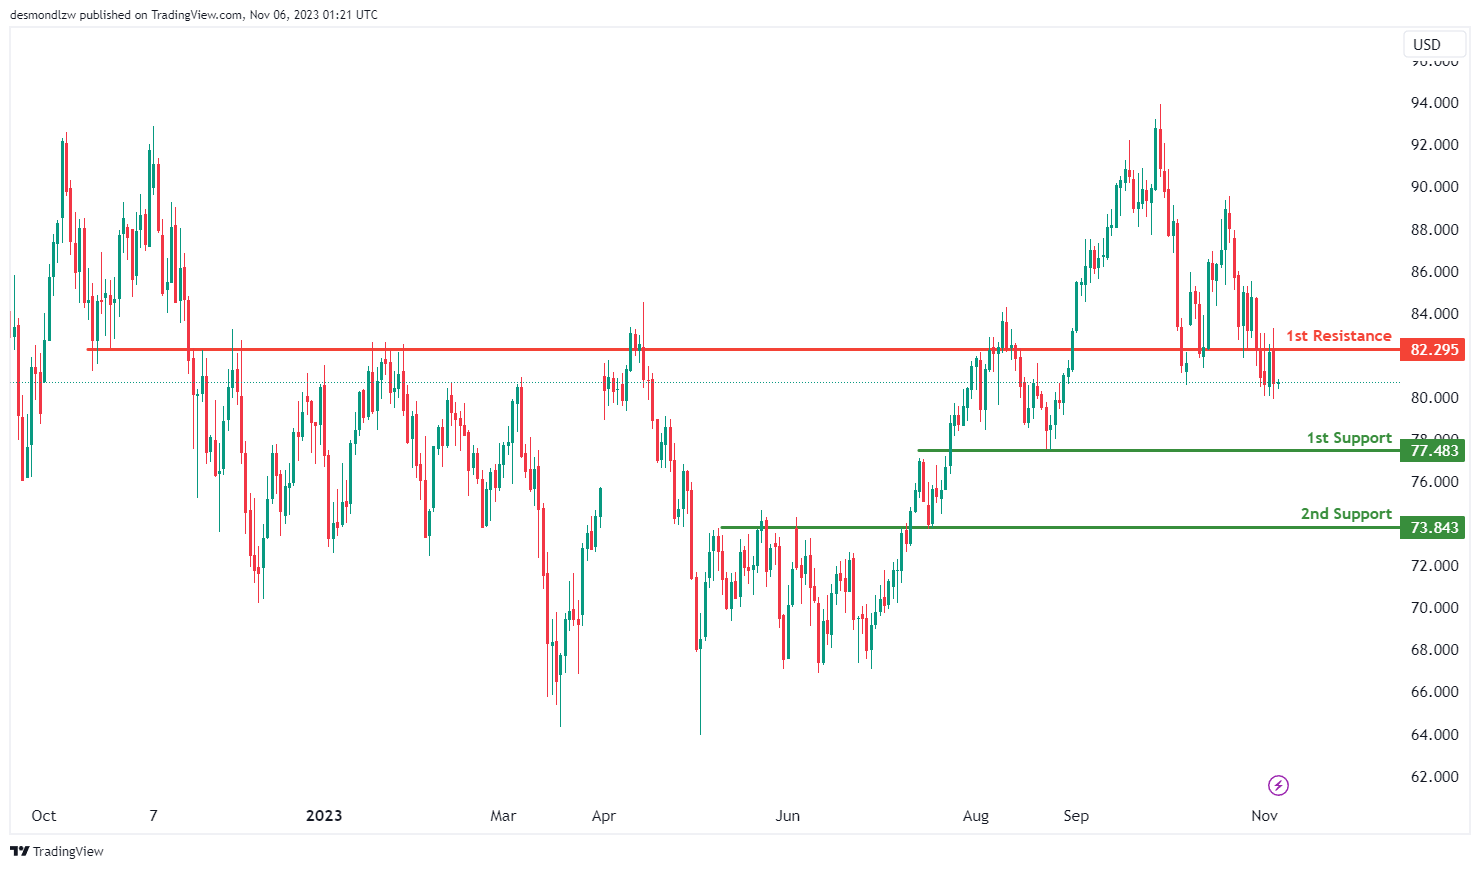
The WTI chart currently exhibits an overall bearish momentum. However, there is a potential for price to make a bullish continuation towards the 1st resistance before resuming the downturn.
The 1st resistance level at 82.29 is noted as an overlap resistance.
To the downside, the 1st support level at 77.48 is identified as an overlap support. Additionally, the 2nd support level at 73.84 is also marked as an overlap support, reinforcing a potential support zone.
XAU/USD (GOLD):
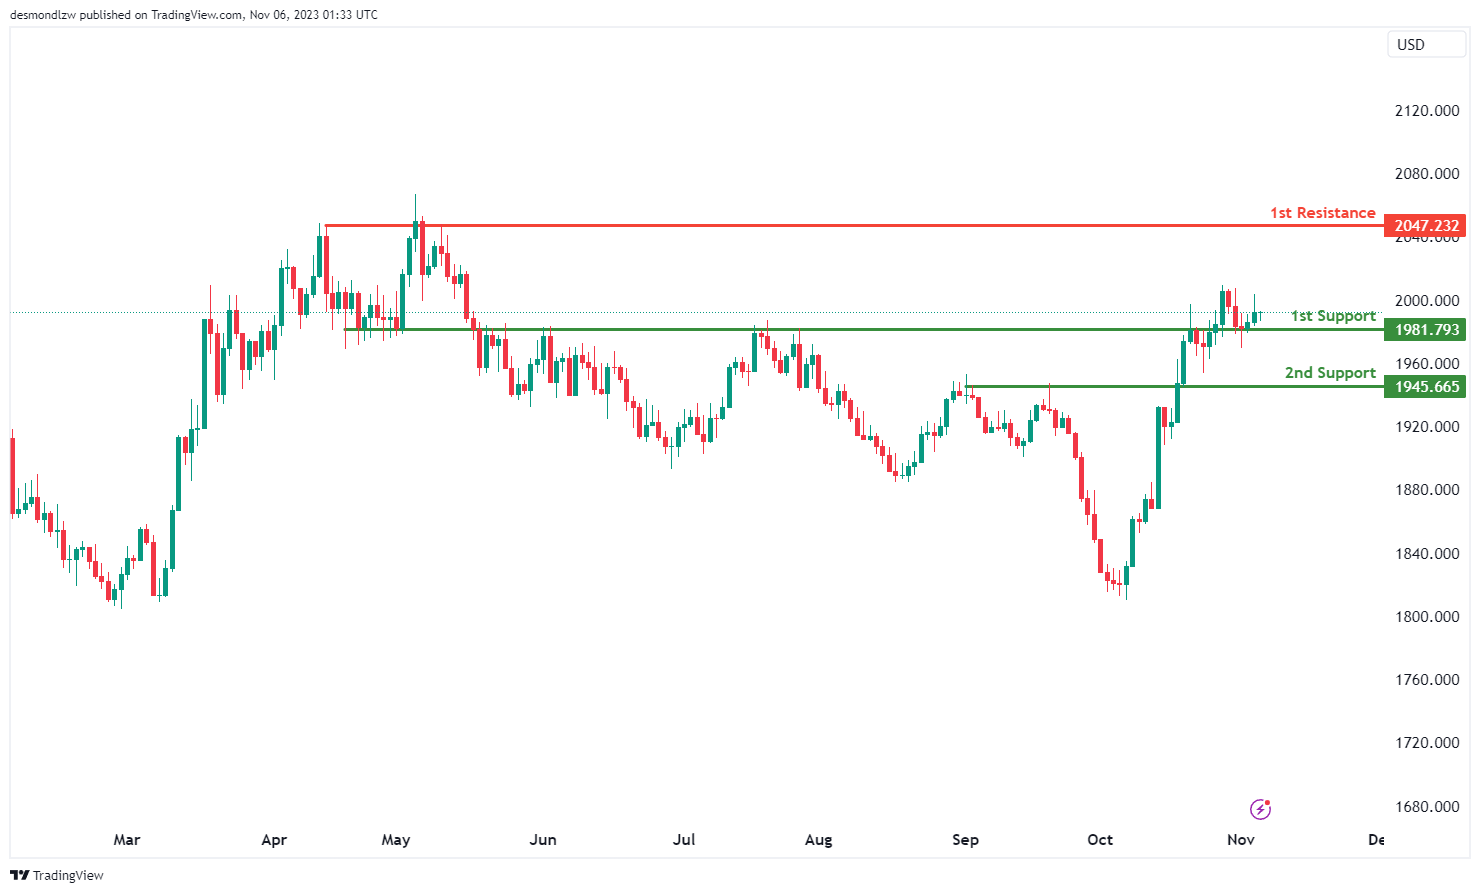
The XAU/USD chart currently has a bullish overall momentum, suggesting the potential for a bullish continuation towards the 1st resistance.
The 1st support at 1981.79 is identified as an overlap support, indicating it could be a significant level where the price might find some buying interest.
The 2nd support at 1945.66 is considered a pullback support, further reinforcing its potential as a support level.
On the resistance side, the 1st resistance at 2047.23 is categorized as a multi-swing high resistance, suggesting it could act as a level where the price may face selling pressure.
BoJ Governor Ueda affirms commitment to easing amid uncertain inflation-wage dynamics
BoJ Governor Kazuo Ueda reaffirmed today the central bank's commitment to its accommodative stance.
"We're seeing more positive signs than before in corporate wage and price-setting behavior," Ueda stated, acknowledging the nascent signs of a healthier inflation-wage cycle. However, he also underscored the prevailing uncertainties, admitting, "there's still uncertainty on whether the positive cycle will strengthen, as we predict."
With an eye on supporting economic activity, Ueda emphasized the central bank's resolve, "We will patiently maintain monetary easing," indicating no immediate shift from BoJ's long-standing dovish position.
Last week's decision to relax the 1% cap on 10-year JGB yield, allowing greater movement in long-term borrowing costs, was a nod to flexibility in BoJ's approach. Today, Ueda elaborated, "We will conduct nimble market operations when interest rates rise, depending on the level and speed of moves of long-term rates."
Ueda also sought to temper market expectations regarding the potential for sharp rises in long-term yields. "Even if long-term rates come under upward pressure, don't expect the 10-year JGB yield to sharply exceed 1%," he stated.
The Governor's comments reflect a deep consideration of the "real" interest rate, which factors in inflation expectations. He explained, "Long-term rates may rise somewhat but what's important is to look at the real interest rate that takes into account inflation expectations."
He reassured markets, "Even if long-term rates rise, real interest rates will move in negative territory so monetary conditions will be sufficiently accommodative."
Japan’s PMI services finalized at 51.6, growth is on the wane
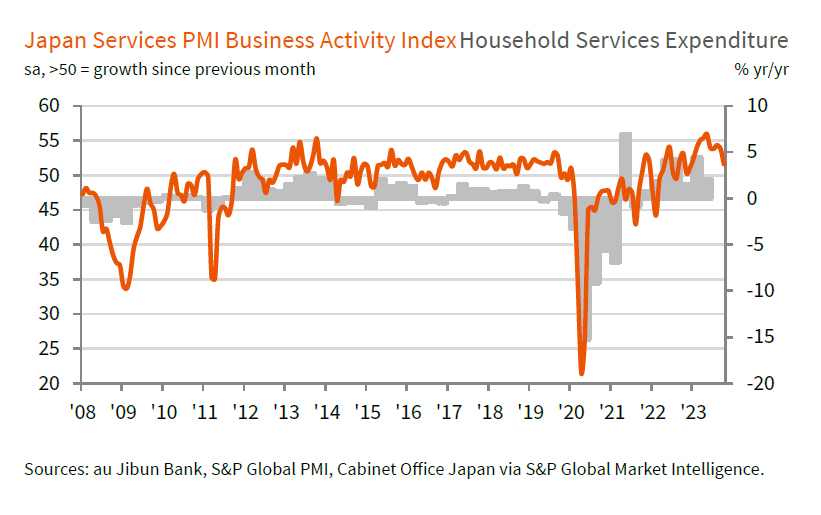
Japan's PMI Services was finalized at 51.6 in October, down from previous month's 53.8. PMI Composite figure similarly declined to 50.5 from September's 52.1.
Andrew Harker of S&P Global Market Intelligence highlighted the subdued performance: "While the PMI data continue to make positive reading for the Japanese service sector, the recent trends suggest that growth is on the wane."
He elaborates that the slowdown is notably marked by the softest increases in activity and new orders witnessed since the year's inception, which could herald a persistent deceleration as we edge closer to the year's end.
This softening expansion has raised concerns regarding the service sector's capacity to buoy the broader economy, particularly as manufacturing continues to lag. Harker notes the stagnation of new orders in October, halting an eight-month stretch of growth and presenting a cautionary backdrop for the upcoming months.
ECB’s Lagarde determined to bring inflation down to 2%
In an interview with Kathimerini, ECB President Christine Lagarde enunciated the bank's determined path: "We are determined to bring inflation down to 2%. According to our projections, we will get there in 2025."
This determination comes against a backdrop of soaring prices affecting economies worldwide, with ECB focusing not just on the broader inflationary metric but also on its constituent parts. "When we measure inflation, we pay attention to the headline rate,"
Delving into the specifics, Lagarde acknowledged the significant volatility in food prices, a primary concern for policy-makers and consumers alike. She highlighted a future clouded by environmental uncertainty: "Is the price of food going to be higher in the future? That's a possibility if you look at the impact of climate change."
Lagarde also touched on the societal impact of inflation, particularly the strain on the vulnerable populations. "Let me say that our mandate is to ensure price stability, and this is the best contribution we can make to social peace and to society, to the most vulnerable of its members in particular."
A Decisive Turn for US Labour Market
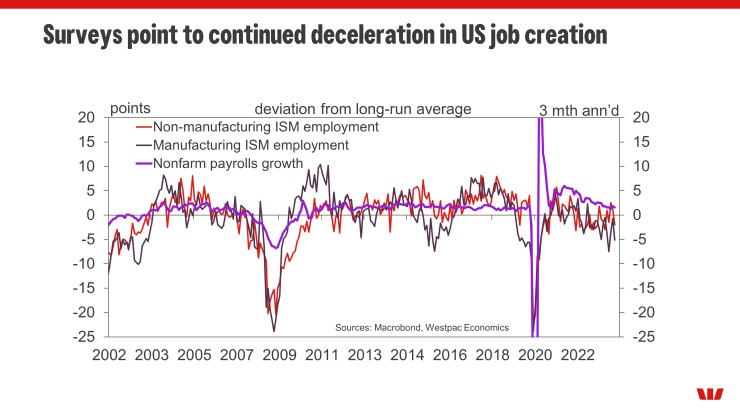
The US employment outcomes of the past six months point to balance between demand and supply. For the outlook, downside risks are growing.
The abrupt upturn in nonfarm payrolls employment witnessed in September and Q3’s (very) strong GDP print led the market to question whether the US economy was re-accelerating, warranting additional tightening by the FOMC. Just a month on however, a benign view for inflation has emerged. Indeed, there is now evidence of downside risks forming for both employment and consumption.
October’s 150k payroll gain was half September’s increase and also below August’s 165k. More to the point, it leaves the 3-month average at 204k, a long way short of the 342k average of the same period a year ago, and 667k a year before that (2021). 204k is still twice the 100k pace FOMC members have tabled as consistent with balance between labour demand and supply. But current population growth provides enough supply for 130k new jobs a month. And, if the trend rise in participation is also accounted for, supply has been sufficient over the past year for around 250k new jobs per month. Note as well that, during the past 12 months, total hours worked have declined 0.9%. As such, the creation of 105k new jobs has been required each month to offset hours lost by existing workers.
The household survey in contrast points to slack already building, the number of employed having risen just 32k per month May to October, including an average decline of 13k the past three months. This lack of employment growth – while the labour force has grown by around 170k per month – is behind the unemployment rate’s 0.5ppt rise since April, and the U6 measure of underemployment’s 0.6ppt gain. At 3.9%, the unemployment rate is now above the year-end forecast of FOMC members at the time of their September meeting and just 0.2ppts below the peak rate the Committee expects through 2024 and 2025. Available detail from the business surveys points to a further deterioration in the current pace of employment, making a continuation of the six month uptrend in unemployment and underemployment likely.
The consequences for wage growth of the resetting of demand and supply have already been significant, average hourly earnings growth decelerating from a recent peak of 5.9%yr in mid-2022 to 4.1%yr currently. With the current rate only marginally above core PCE inflation of 3.7%yr at September, the current nominal wage pulse points to a slow healing of real wages from their pandemic lows.
Overall, the US labour is still in robust structural health, yet it is evident that the heat has come out and downside risks for employment and household incomes are forming. To be clear, this is not an assessment based on October’s data alone, but rather the outcomes of the past six months, with the full effect of tight financial and credit conditions still to be felt.
We remain of the view that the FOMC will soon have to shift to a much more balanced view of the outlook and begin making real-time assessments of the appropriate degree of policy restrictiveness. Through 2024, with growth below-trend, this will certainly lead to a lower level of interest rates than today. As has been the case on the way up however, how the term premium and other elements of financial conditions evolve will dictate the precise scale and timing of adjustments to the fed funds rate by the FOMC.