Sample Category Title
GBP/USD: Risk Appetite Lifts the Pair to Seven-Week High
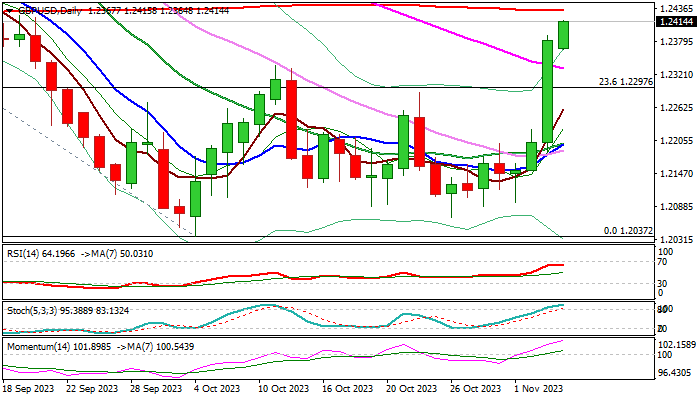
GBPUSD bulls held grip at the start of the week and cracked psychological 1.2400 barrier, in attempts to extend Friday’s nearly 1.5% advance.
Fresh risk appetite gave strong boost to sterling, in addition to BOE’s hawkish stance despite keeping rates on hold last week and warning signals from various sectors of the US economy and dovish steer from the central bank in response.
Last week’s advance and close above the ceiling of a multi-week consolidation range generated a signal of formation of a higher base (1.2040/70 zone) and possible stronger recovery.
Bulls eye pivotal barriers at 1.2434/58 (200DMA / Fibo 38.2% of 1.3140/1.2037 downtrend) violation of which to generate stronger reversal signal and open way for extension towards daily cloud top (1.2516) and 100DMA (1.2541).
Bullish daily studies contribute to positive near-term outlook, though overbought conditions warn.
Bullish bias to remain intact while dips stay above broken daily cloud base (1.2347).
Res: 1.2434; 1.2458; 1.2541; 1.2588.
Sup: 1.2347; 1.2337; 1.2297; 1.2242.
Eurozone PMI services finalized at 47.8, stagflation concerns mount
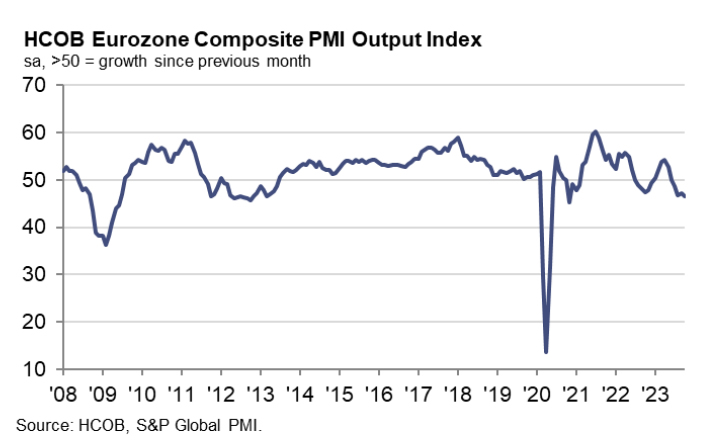
Eurozone PMI Services slumped to 47.8 (final reading) from September's 48.7. PMI Composite index, which tracks both manufacturing and services, descended to a 35-month low of 46.5 from 47.2. The rate at which new business is falling has reached levels not seen since 2012, with the exception of the pandemic period.
This downturn is evident across key Eurozone economies, with member states reporting troubling metrics. Spain hit a 2-month low at the brink of stagnation with PMI Composite of 50.0, while Ireland descended to an 11-month low at 49.7. Italy and Germany both reported figures suggesting continuing contraction in service sector activity, with PMIs at 47.0 and 45.9 respectively. France, although at a 2-month high, still sits in a contractionary phase at 44.6.
Cyrus de la Rubia of HCOB offers a stark analysis: "The Eurozone service sector appears to be struggling at the onset of Q4, continuing a three-month trend of decline. A steep decrease in new business intake is a worrying harbinger for future activity. Although there is a slight uptick in future expectations, they still linger well below the historical average."
The economic situation seems paradoxical, with prices rising without the typical accompanying demand, pointing to a condition of "stagflation". De la Rubia questions how long this "odd stagflation zone" will persist, a query that also plagues ECB. With PMI data suggesting no quick exit from these conditions, it appears ECB is not in a position to lower interest rates just yet, as it balances the dual threats of sluggish growth and persistent inflation.
Could Gold Return Above 2,000?
- Gold extends last week’s sideways move below 2,000
- Bullish structure in progress above 1,980
Gold shifted to a sideways pattern after its impressive rally from a seven-month low of 1,800 run out of steam slightly above the 2,000 mark.
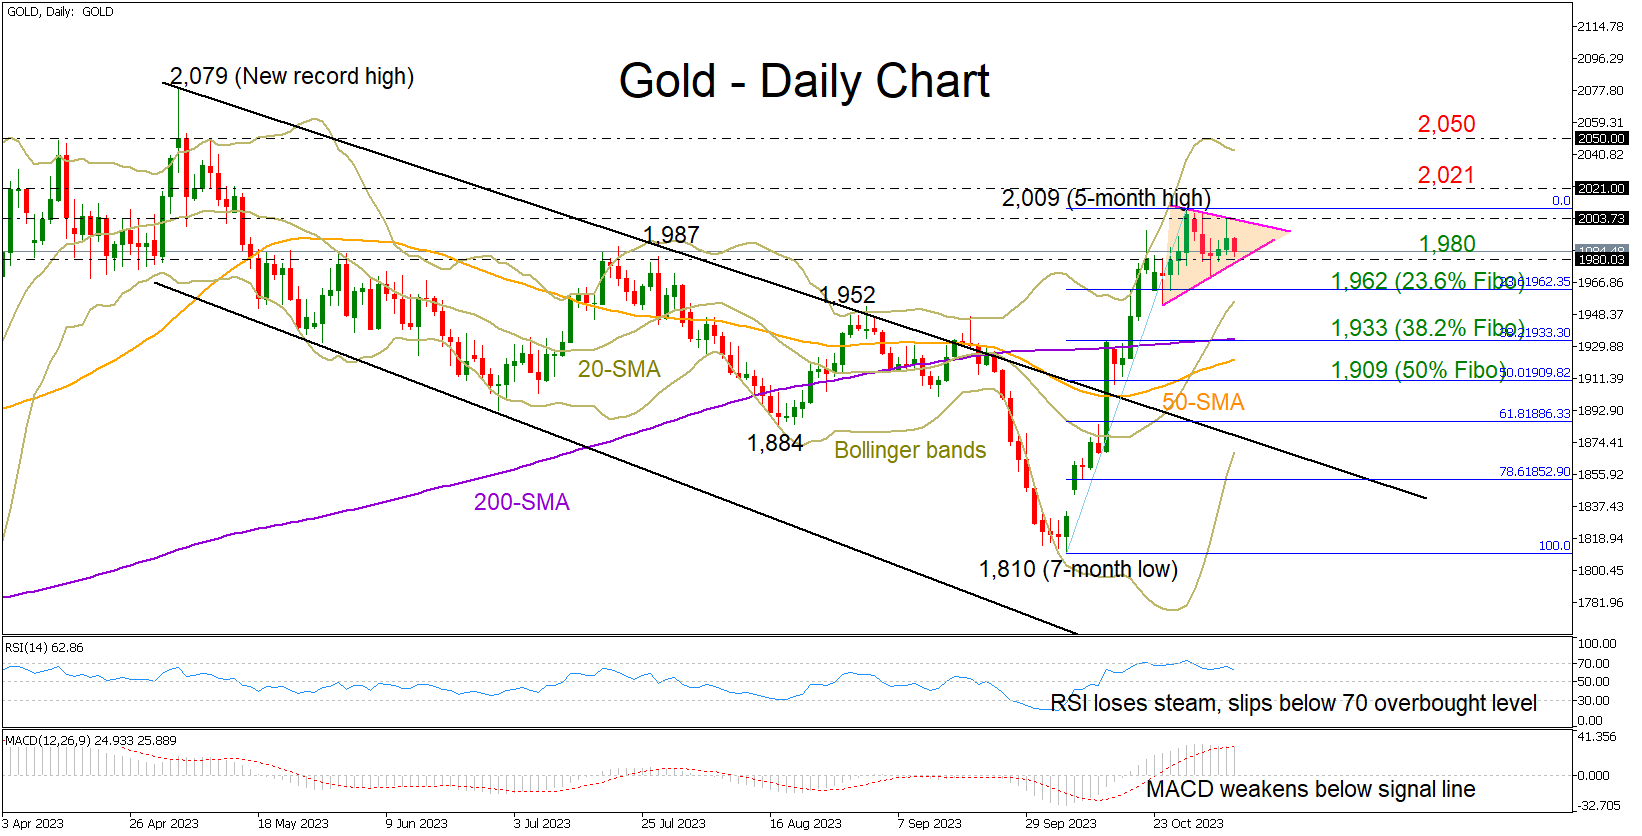
The consolidation phase seems to be developing within a bullish pennant formation, feeding hopes that the bulls have more fuel in the tank. In other encouraging signals, the 20-day simple moving average (SMA) has drifted above the longer-term SMAs, while the price itself has yet to meet the upper Bollinger band.
On the other hand, the RSI has topped in the overbought zone and is set for its next downward move, while the MACD has slipped below its red signal line, both pointing to negative sessions ahead.
Given the mixed technical signals, traders will look for a break above the triangle and the 2,003 level before they shift their attention to the 2,021 barrier. This overlaps with the 78.6% Fibonacci retracement of the previous downleg and could be a prerequisite for gaining momentum towards the key 2,050 resistance. Above the latter, the spotlight will turn to the record high of 2,079, a break of which could test the 2,100 psychological mark or stretch up to 2,150.
On the downside, sellers might show up below the triangle and the 1,980 level. In this case, the 23.6% Fibonacci retracement of the latest upleg could provide a footing along with the 20-day SMA at 1,962. A continuation lower could then examine the 38.2% Fibonacci of 1,933 and the 200-day SMA, while a steeper decline could stabilize near the 50% Fibonacci of 1,909.
All in all, gold is in a neutral condition, waiting either a close above 2,000 or below 1,980 to get new guidance.
NZDJPY Making Strong Comeback From Blue Box
In this technical blog, we will look at the past performance of the 4-hour Elliott Wave Charts of NZDJPY. In which, the rally from 24 March 2023 low unfolded as an impulse sequence and showed a higher high sequence. Therefore, we knew that the structure in NZDJPY is incomplete to the upside & should extend higher. So, we advised members not to sell the pair & buy the dips in 3, 7, or 11 swings at the blue box areas. We will explain the structure & forecast below:
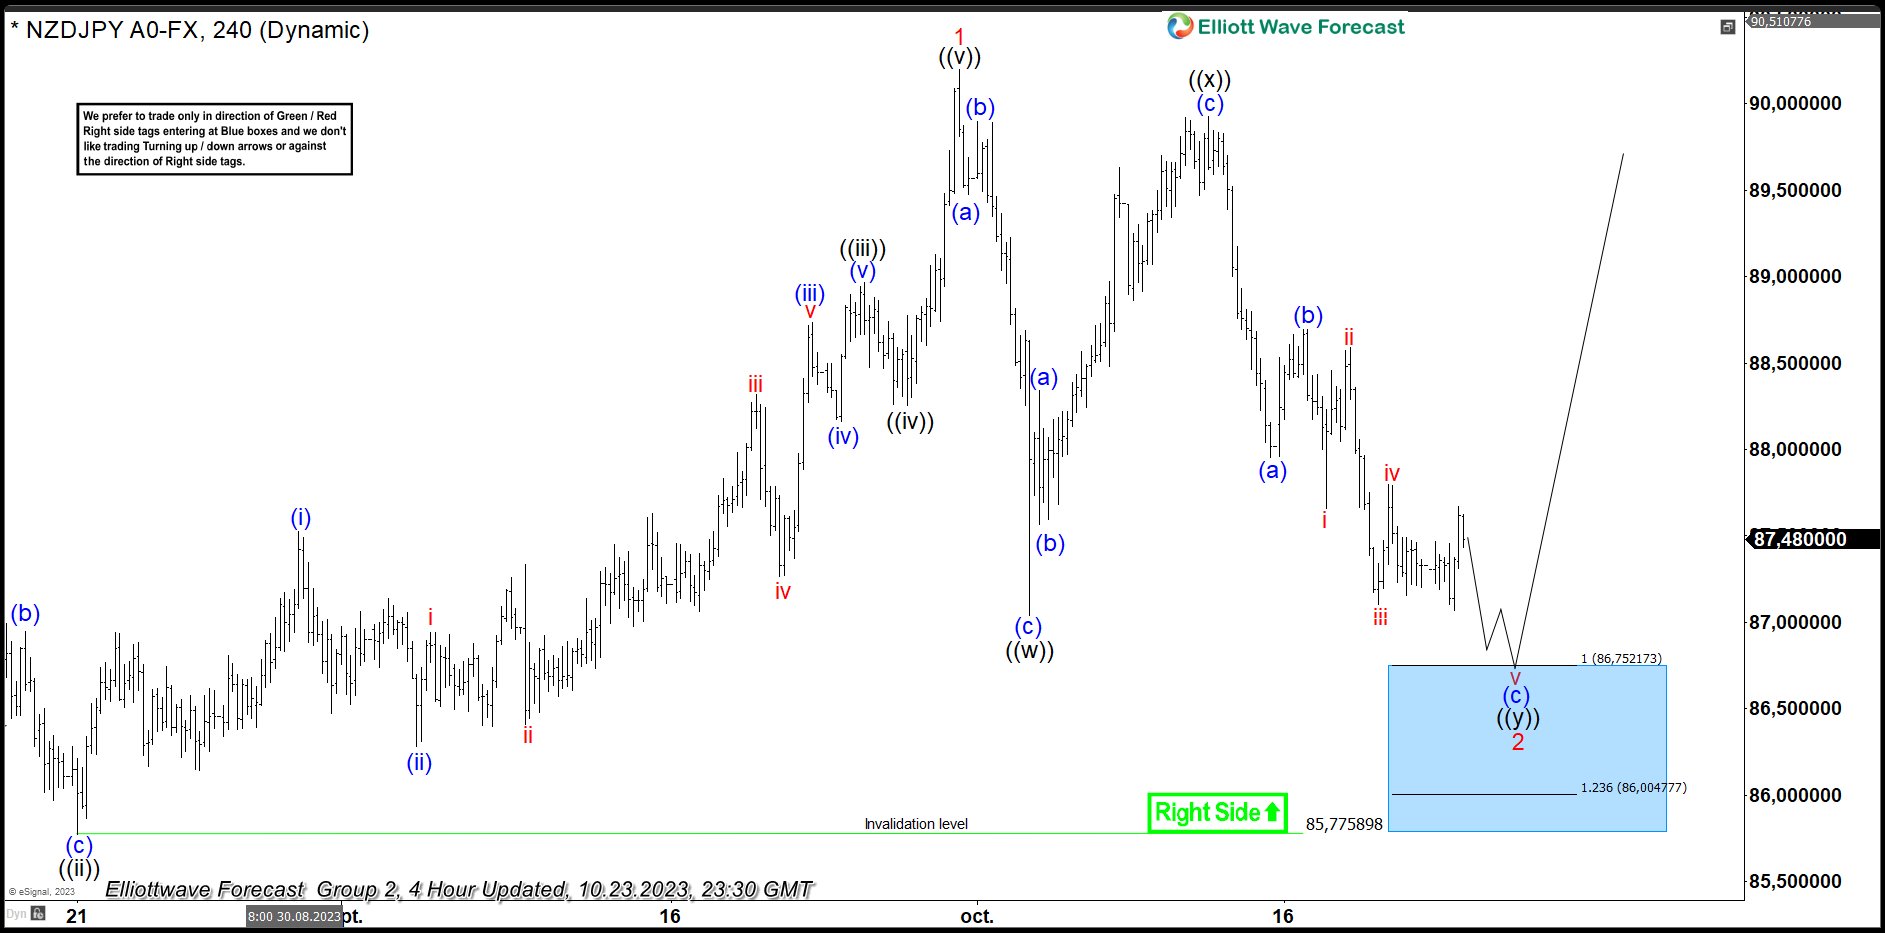
NZDJPY 4-Hour Elliott Wave Chart From 10.23.2023
Here’s the 4-hour Elliott wave Chart from the 10/23/2023 update. In which, the rally to 90.20 high ended wave 1 & made a pullback in wave 2. The internals of that pullback unfolded as Elliott wave double three correction where wave ((w)) ended in 3 swings at 87.04 low. Then a bounce to 89.92 high-ended wave ((x)) & started the next leg lower in wave ((y)) towards 86.75- 86 blue box area. From there, buyers were expected to appear looking for new highs ideally or for a 3-wave bounce minimum.
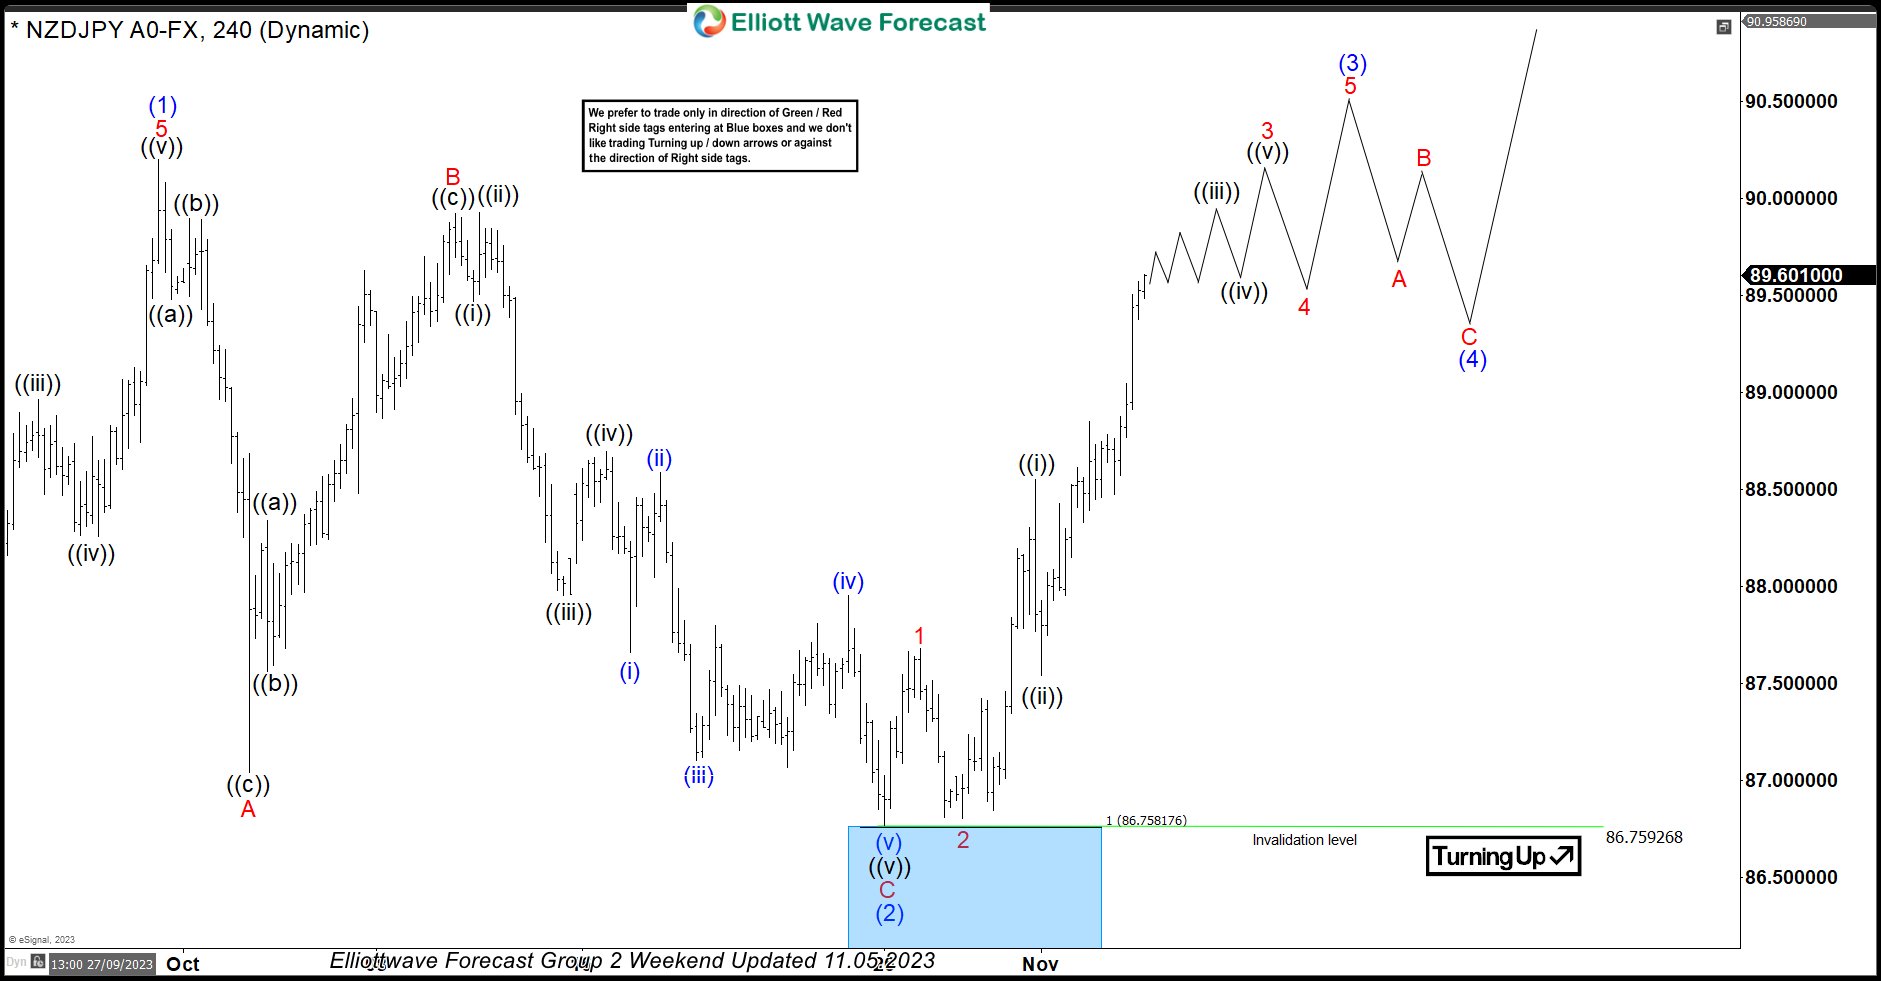
NZDJPY Latest 4-Hour Elliott Wave Chart From 11.05.2023
This is the latest 4-hour Elliott wave Chart from the 11/05/2023 update. In which the pair is showing a strong reaction higher taking place, right after ending the correction within the blue box area. Allowed members to create a risk-free position shortly after taking the long position at the blue box area. However, a break above 90.20 high is still needed to confirm the next extension higher & avoid further correction lower. It’s important to note that with further data we have adjusted the degree of the pullback & changed the correction to a flat correction.
EUR/USD: Euro Keeps Firm Tone and Looks for Extension of Friday’s 1% Advance
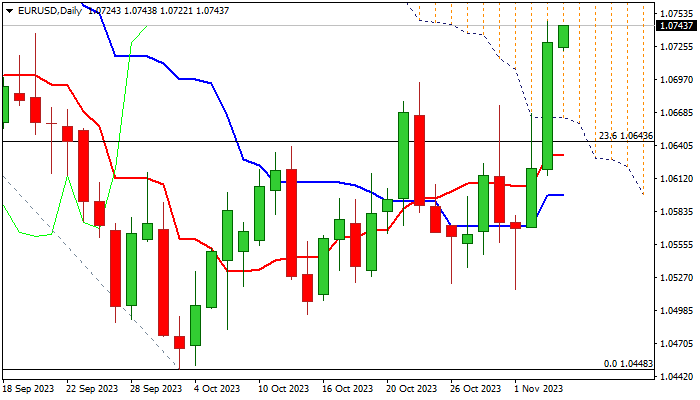
EURUSD is consolidating Friday’s 1.03% advance (the biggest daily rally since July 12) but keeping firm bullish tone for further advance.
Soft US jobs data and less hawkish Fed deflated the US dollar, lifting the Euro to the highest levels since mid-September.
Weekly close above psychological 1.07 barrier generated initial bullish signal, as Friday’s large bullish daily candle also underpins the action for attack at next pivotal resistance at 1.0764 (Fibo 38.2% of 1.1275/1.0448), break of which to expose targets at 1.0799/1.0804 (top of thick falling daily Ichimoku cloud / converged 100/200DMA’s) and 1.0862 (Fibo 50% retracement).
Daily MA’s (10/20/55) are in bullish configuration and positive momentum is strong, though overbought conditions warn that bulls may face increased headwinds.
Broken 1.07 level reverted to support which should ideally contain dips and guard lower pivot at 1.0653 (55DMA).
Res: 1.0764; 10799; 1.0804; 1.0862.
Sup: 1.0722; 1.0700; 1.0674; 1.0653.
Several Key Technical Levels Under Severe Strain
Markets
Friday’s US payrolls and ISM missed expectations and reinforced last week’s correction. The US economy in October ‘only’ added 150k jobs vs 180k expected (101k downward revision for August & September). There was some negative impact of the UAW strike. Wage growth was modest (0.2% M/M, 4.1% Y/Y rom 4.3%) and the consumer survey weak with a higher unemployment rate (3.9% from 3.8%) and a lower participation rate (62.7%). The services ISM missed the bar, easing from 53.4 to 51.8 (53 expected), but details were mixed (solid orders, soft employment, stubbornly high prices). However, the market context didn’t allow for nuances. Data indeed give the Fed good reason to feel comfortable with its non‐committal ‘wait‐and‐see’ approach. Markets are going a step further, concluding the Fed is almost certainly done and focusing on the timing of a first rate cut. Contrary to earlier last week, the short end of the US yield curve outperformed. The US 2‐y yield tumbled 15.1 bps. The 30‐y only ceded 3.4 bps. A June rate cut is now fully discounted. Dovish Fed Bostic, in a Bloomberg interview, rubberstamped reigning sentiment as he expects inflation to return to target in the next 8 to 10 months. He didn’t want to speak out on any specific timing of rate cuts, but repeated they will take place before hitting the target. EMU/German yields joined the decline in the US, but with a bull flattening (2‐y ‐4.8 bps, 30‐y ‐8.5 bps). ECB’s Lagarde kept a more balanced approach. She confirmed expectations for inflation to slow and return to 2% in 2025, but indicated that the central bank won’t give in to political pressure that higher yields might slow growth too much. Equity markets clearly saw softer data and potential Fed rate cuts as some kind of goldilocks scenario. US indices added up to 1.38% (Nasdaq). The dollar was hit by the risk‐on. DXY tumbled from the 106 area to close near 105.05. EUR/USD (close 1.073) finished above the 1.0694 end October top, improving the technical picture.
Asian equities join the risk rally on WS this morning (Nikkei +2.4%). Later today (and further out this week) the eco calendar is rather thin. Plenty of ECB and Fed speeches are a wildcard (e.g. Lagarde and Powell on Thursday). After last week’s bond/equity rally and USD correction, markets might look for a new short‐term equilibrium. Several key technical levels are under severe strain. For the US 10‐y yield we look out whether the 4.5% area holds. The German 10‐y yield dropped below the 2.68% neckline, with the 2.56/60% area a next reference. For EUR/USD, 1.0764 (38% retracement July top/Oct low) is a key resistance. For bonds as well as for the USD correction, maybe the easy part of the move might be behind us.
News and views
The South Korean Financial Services Commission announced a ban on short selling until June 2024. The rule applies to companies’ shares trading in the Kospi 200 and Kosdaq 150 indices. The FCS chairman warned that illegal short‐ selling undermines fair price formation and hurts market confidence. Therefore, the regulator will actively improve rules and systems. Several global banks which account for most of the short‐selling activity will also face an inquiry. The investigation comes ahead of general election in April against a background of retail investor protests, but hampers efforts to get an upgrade from emerging to developed market in global stock indices. The Kospi and Kosdaq indices rally by 4.5% and 7.1% respectively this morning. A stronger Korean won takes over from a weak US dollar in pulling USD/KRW lower this morning. The pair fell from levels above 1350 at the beginning of last week to below 1300 currently, the strongest KRW‐rate since early August.
Saudi Arabia and Russia announced in separate official statements that they will stick to additional productions cuts by 1mn and 300k barrels a day respectively until the end of the year. Both will review production volumes next month and consider extending the cut, deepening the cut, or increasing production. The renewed commitment comes amid global growth concerns and as tensions in the Middle‐East become more stressful every day. Brent crude prices hold above $85/b this morning, but are near the October ($83.5/b) and August ($82/b) lows which form some kind of neckline of a technical head‐and‐shoulders formation..
GBP/JPY Daily Outlook
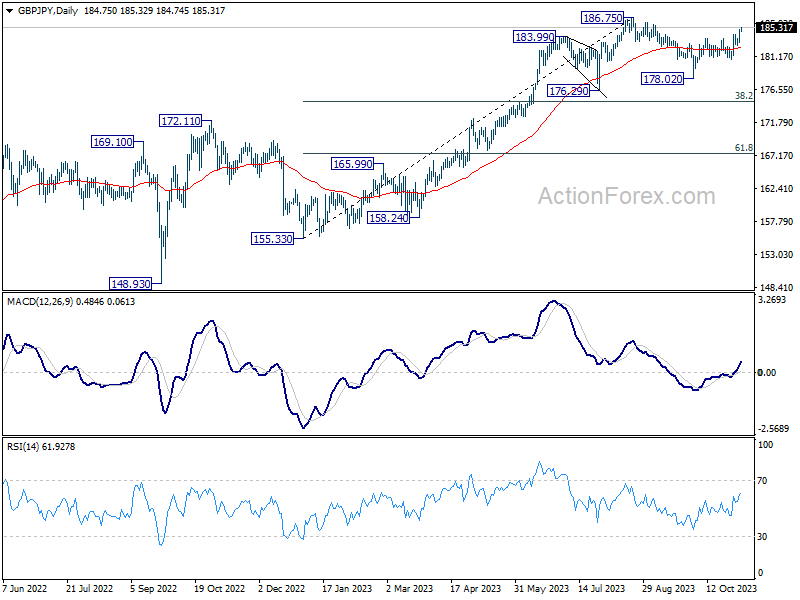
Daily Pivots: (S1) 183.75; (P) 184.39; (R1) 185.54; More...
Intraday bias in GBP/JPY remains on the upside, as rise from 178.02 is in progress. Further rally should be seen to retest 186.75 resistance. Decisive break there will resume larger up trend. On the downside, break of 182.71 support is needed to indicate short term topping. Otherwise, further rally will remain in favor in case of retreat.
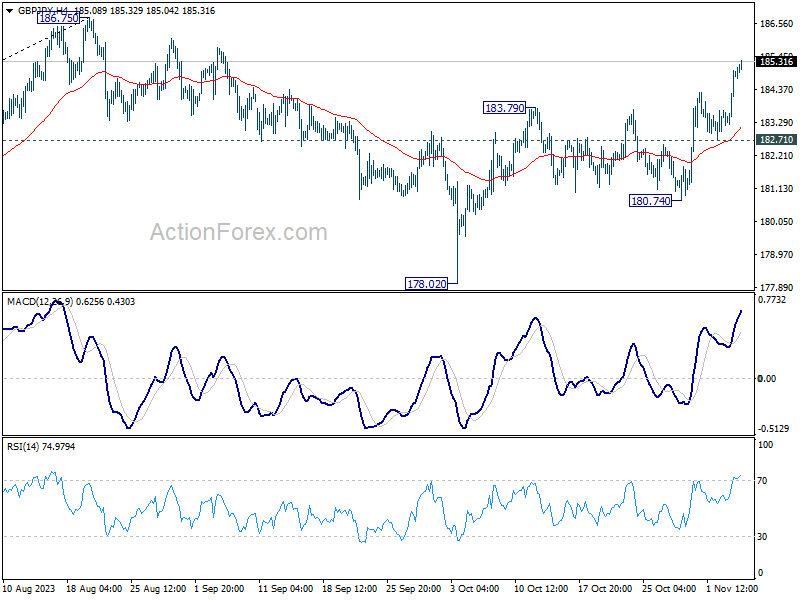
In the bigger picture, as long as 176.29 support holds, larger up trend from 123.94 (202 low) should still be in progress. Break of 186.75 will target 195.86 (2015 high). Nevertheless, firm break of 176.29 will confirm medium term topping, and bring lengthier and deeper consolidations.
EUR/JPY Daily Outlook
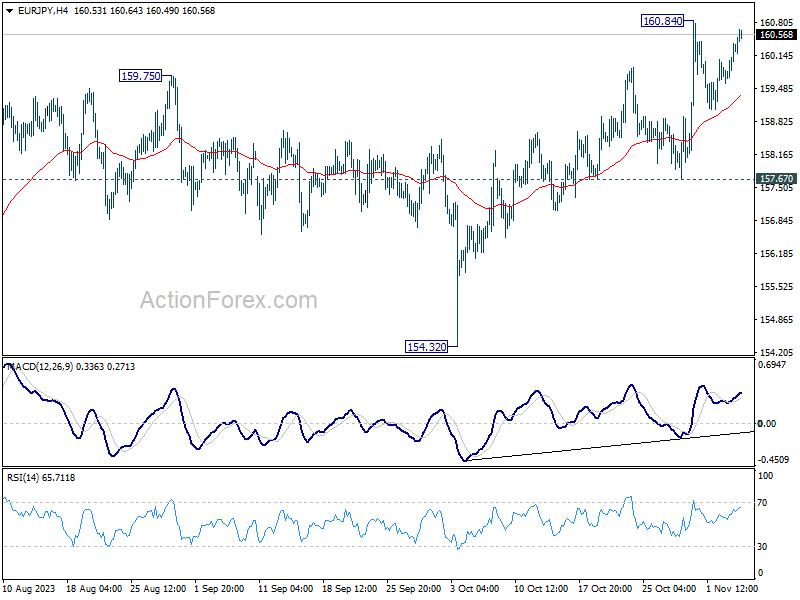
Daily Pivots: (S1) 159.79; (P) 160.10; (R1) 160.59; More....
Intraday bias in EUR/JPY remains neutral and consolidation from 160.84 could extend further. While another dip cannot be ruled out, outlook will stay bullish as long as 157.67 support holds. Break of 160.84 will resume larger up trend to 163.06 projection level next.
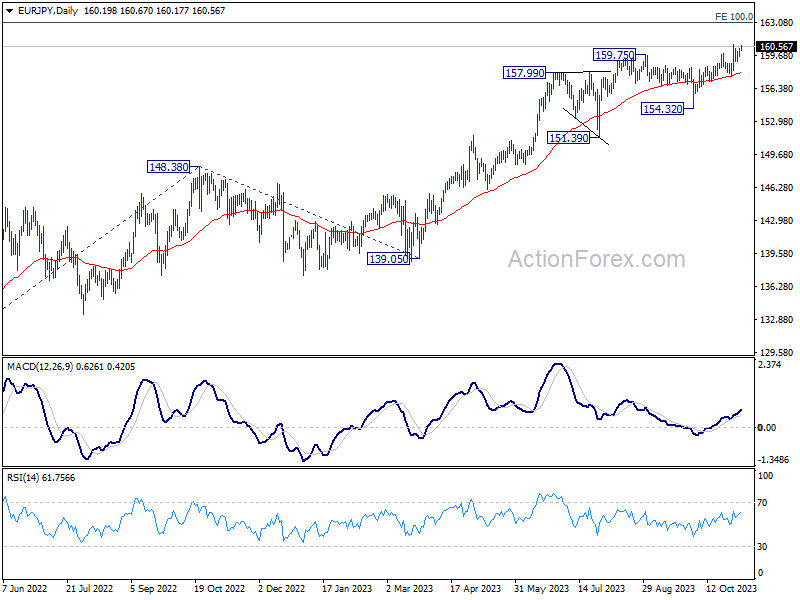
In the bigger picture, rise from 114.42 (2020 low) is in progress. Next target is 100% projection of 124.37 to 148.38 from 139.05 at 163.06. On the downside, break of 154.32 support is needed to be the first sign of medium term topping. Otherwise, outlook will remain bullish even in case of deep pullback.
EUR/GBP Daily Outlook
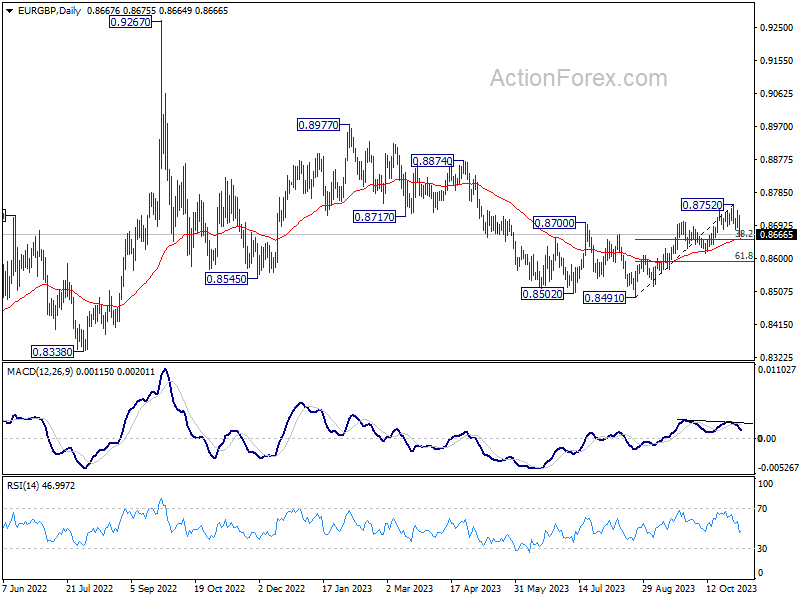
Daily Pivots: (S1) 0.8647; (P) 0.8685; (R1) 0.8705; More....
Price actions from 0.8752 are seen as correcting whole rally from 0.8491. Intraday bias stays mildly on the downside for 38.2% retracement of 0.8491 to 0.8752 at 0.8652 and below. But downside should be contained by 0.8614 support to bring rebound.
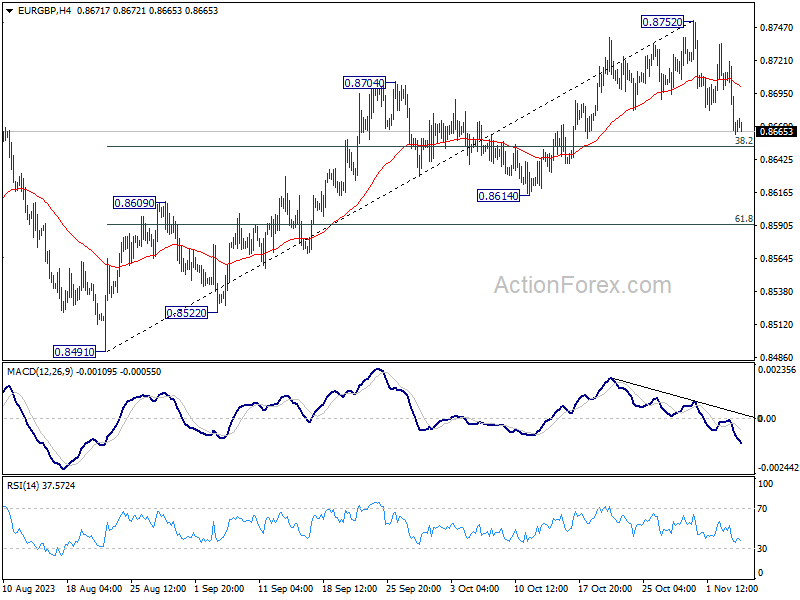
In the bigger picture, current development suggests that whole down trend from 0.9267 (2022 high) has completed with three down to to 0.8491. Rise from 0.8491 is seen as another leg inside that pattern from 0.9499 (2020 high). Further rally should be seen to 0.8977 resistance and above. This will remain the favored case as long as 0.8614 support holds.
EUR/AUD Daily Outlook
Daily Pivots: (S1) 1.6450; (P) 1.6492; (R1) 1.6518; More...
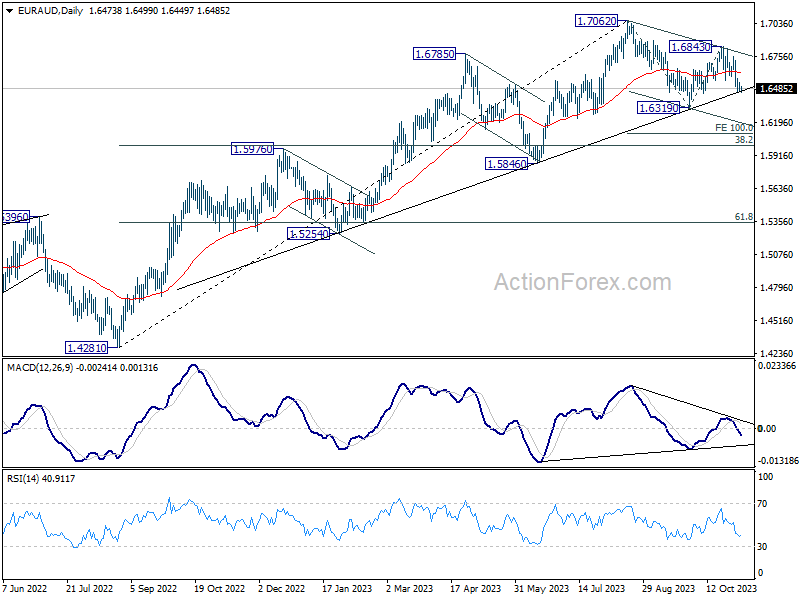
Intraday bias in EUR/AUD remains on the downside for retesting 1.6319 support first. Sustained break there will resume the fall from 1.7062, and target 100% projection of 1.7062 to 1.6319 from 1.6843 at 1.6100. On the upside, above 1.6588 minor resistance will turn intraday bias neutral first.
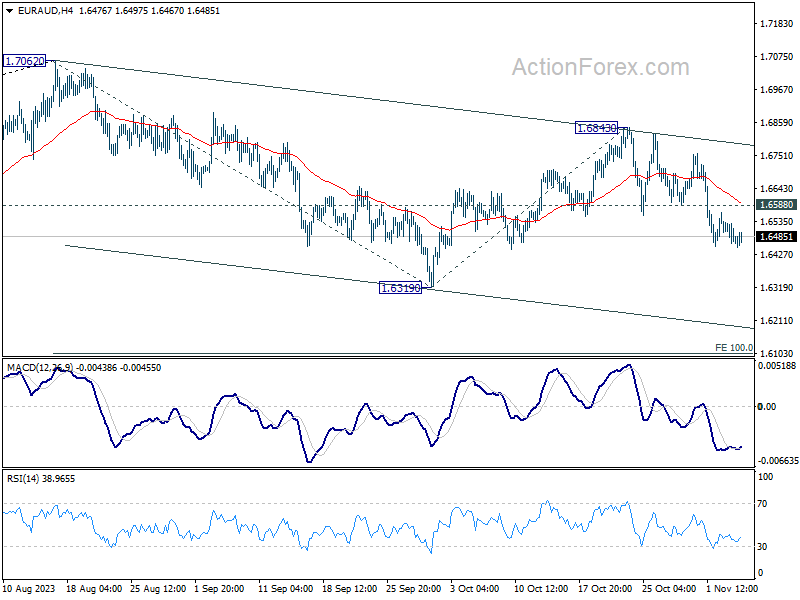
In the bigger picture, current development suggests that 1.7062 is already a medium term top. Fall from there is seen as a correction to the up trend from 1.4281 (2022 low). While deeper decline might be seen, strong support should emerge from 38.2% retracement of 1.4281 to 1.7062 at 1.6000 to contain downside. However, sustained break of 1.6000 will raise the chance of bearish tend reversal.