Sample Category Title
Forex and Cryptocurrencies Forecast
EUR/USD: A Bad Week for the Dollar
Throughout the week, the Dollar Index DXY, along with EUR/USD, appeared to be riding the waves, moving up and down. At the beginning of the week, preliminary data for Europe was released. In terms of annual growth, the GDP of the Eurozone in the third quarter was only 0.1%, which fell short of both the forecast of 0.2% and the previous figure of 0.5%. In addition, inflation took a downward turn – in October, the Consumer Price Index (CPI) stood at 2.9% (year-on-year), missing the forecast of 3.1% and the previous month's 4.3%.
The European Central Bank meeting took place on October 26, during which the members of the Governing Council unsurprisingly left the interest rate unchanged at 4.50%. Now, market participants were eagerly anticipating the decision of the Federal Open Market Committee (FOMC) of the Federal Reserve, scheduled for Wednesday, November 1. On the eve of the FOMC meeting, the dollar, regarded as a safe-haven asset, received support due to increased geopolitical tensions in the Middle East. Additionally, strong macroeconomic data from the United States favoured the American currency. The country's GDP in the third quarter surged by 4.9%, significantly surpassing the previous figure of 2.1%. Another surprise came from the ADP private sector employment data: the change in the number of employed individuals in the private sector reached 113K, compared to 89K the previous month.
Market participants had a sense that in such a situation, the Federal Reserve (FOMC) might well continue tightening monetary policy, especially since inflation is still far from the target level of 2.0%. Against this backdrop, the yield on 10-year Treasury bonds once again approached the 5.0% level, and the Dollar Index (DXY) rose to 107.00.
However, November 1 brought complete disappointment to the dollar bulls. For the second consecutive month, the FOMC left the key interest rate unchanged at 5.50%. What's worse is that if after the September meeting, the market believed that the cost of borrowing would rise to 5.75% by the end of this year, the probability of such an increase has now plummeted to 14%. The Dollar also received no support from the rhetoric of Federal Reserve Chairman Jerome Powell during the press conference following the current meeting.
The situation could have been rectified by the data from the U.S. Bureau of Labor Statistics (BLS), traditionally published on the first Friday of the month, which was on November 3. However, the number of non-farm payroll (NFP) employees in the country only increased by 150K in October. This figure turned out to be lower than both the market's expectations of 180K and the revised September growth, which was adjusted from 336K to 297K. The unemployment rate rose during the same period from 3.8% to 3.9%. The annual inflation, measured by the change in the average hourly wage, decreased from 4.3% to 4.1%. As a result of this disappointing data for Dollar bulls, the Dollar Index (DXY) plummeted to 105.09, while EUR/USD reached a six-week high at 1.0718.
Towards the end of the workweek, the publication of the ISM Services PMI index revealed that business activity in the U.S. services sector was growing at a slower pace in October. The PMI declined to 51.8 from 53.6 in September. This value was below the market's expectation of 53.0. More detailed data showed that the index of service prices (the inflation component) decreased slightly from 58.9 to 58.6, and the employment index dropped from 53.4 to 50.2. As a result, the Dollar continued its descent, and the final note of the week for the currency pair was heard at the level of 1.0730.
According to strategists at the Canadian Scotiabank, in the short term, EUR/USD could rise to 1.0750. In general, expert opinions regarding the near future of the currency pair are divided as follows: 45% voted for a stronger Dollar, while 60% sided with the Euro. As for technical analysis, 35% of the D1 oscillators are pointing south, while 65% are pointing north, although a third of them signal overbought conditions for the pair. Among trend indicators, priorities are clearer: 85% are looking north, with only 15% looking south. The nearest support for the pair is located around 1.0675-1.0700, followed by 1.0600-1.0620, 1.0500-1.0530, 1.0450, 1.0375, 1.0200-1.0255, 1.0130, and 1.0000. Bulls will encounter resistance around 1.0745-1.0770, then 1.0800, 1.0865, 1.0945-1.0975, and 1.1090-1.1110.
Unlike the past five days, the economic calendar for the upcoming week anticipates significantly fewer important events. On Wednesday, November 8, data on inflation (CPI) in Germany and retail sales in the Eurozone will be released. Additionally, on this day, Federal Reserve Chairman Jerome Powell is scheduled to give a speech. He can also be heard again on Thursday, November 9. As is customary, Thursday will also bring data on the number of initial jobless claims in the United States.
GBP/USD: A Good Week for the Pound
Looking at the results of central bank meetings in many countries, there is a sense that the global trend of tightening monetary policy has come to an end. Both the ECB and the Fed left interest rates unchanged. The Bank of England (BoE) also did the same on November 2 at its meeting, leaving the key rate unchanged for the second consecutive time at 5.25%. According to the regulator, such a decision should support the recovery of the economy and employment levels in the United Kingdom. The short-term inflation forecast was revised upwards. However, the central bank leaders noted that inflation in the third quarter had decreased to 6.7%, which was better than expected in August, and its target level of 2.0% is likely to be reached by the end of 2025.
Despite the BoE keeping the rate unchanged, the market perceived this decision as hawkish because three out of nine members of the bank's leadership voted for an increase. Furthermore, the Governor of the Bank of England, Andrew Bailey, emphasized during a press conference that considering a rate cut would be premature. He stated, "Monetary policy is likely to remain restrictive for an extended period." Investors are aware that central banks use such forward guidance as a tool to influence the market, so it is unlikely that the regulator will switch to a soft monetary policy anytime soon. Of course, there are no guarantees that the BoE will stick to its promises if inflation does not move towards the target level. However, at the moment, the market believes Andrew Bailey, which has supported the British currency.
The pound received its strongest bullish impulse after the release of US labor market data on November 3. At that moment, GBP/USD surged upwards, continued its ascent, and closed the week at 1.2380. According to Scotiabank economists, the short-term trading model for the British currency looks promising. They note an increase in demand for the pound amid its weakening since mid-July and do not rule out a rise of GBP/USD to the 1.2450 level. As for the median forecast for the near future, 35% of analysts voted for the pair's rise, 50% believe that the pair will resume its movement towards the 1.2000 target, and the remaining 15% remain neutral. On the D1 timeframe, 75% of trend indicators point to a pair's rise and are coloured green, while the remaining 25% are red. Oscillators show the same readings: 75% point upwards (a quarter of them are in the overbought zone), and 25% voted for a decline. In case the pair moves south, it will encounter support levels and zones at 1.2330, 1.2210, 1.2145, 1.2040-1.2085, 1.1960, and 1.1800-1.1840, 1.1720, 1.1595-1.1625, 1.1450-1.1475. In the event of an upward movement, the pair will face resistance at levels 1.2390-1.2425, 1.2450-1.2520, 1.2575, 1.2690-1.2710, 1.2785-1.2820, 1.2940, and 1.3140.
The speech by the Governor of the Bank of England, Andrew Bailey, scheduled for November 8, and the release of preliminary GDP data for the country for Q3 on November 10 can be highlighted in the events of the upcoming week related to the United Kingdom's economy.
USD/JPY: A Middling Week for the Yen
If the ECB, the Federal Reserve, and the Bank of England have left interest rates unchanged, what could be expected from their Japanese counterparts? Of course, the Bank of Japan (BoJ) made the decision to maintain the parameters of its monetary policy during its meeting on Tuesday, October 31. They have been in this position for a very long time. The regulator not only retained the interest rate at a negative level of -0.1% but also kept the yield on 10-year government bonds (JGB) unchanged. Some market participants had hoped that after the inflation growth data, BoJ would raise their yield ceiling from 1% to at least 1.25%. (It's worth noting that the yield on similar US securities is close to 5.0%). However, instead, the Bank of Japan continued to ignore obvious signs of increasing inflationary pressure. Although in the Tokyo region, the CPI rose from 2.8% to 3.3% (YoY) in October. Additionally, despite assurances from high-ranking officials about the priority of industrial production growth, this indicator declined from -4.4% to -4.6% in annual terms.
All of this pushed USD/JPY to a high of 151.71. It would have likely remained there if not for the results of the Federal Reserve's meeting and US labor market data. As a result, it started the week at 149.63 and finished at 149.34. Considering the pair's high volatility, the outcome can be considered neutral.
Economists from the largest banking group in the Netherlands, ING, believe that the pair will end the year not far from 150.00. Regarding its near-term prospects, 65% of analysts expect the yen to strengthen, 35% take a neutral position, and there were no votes for it to rise above 151.00 at the time of writing this review. Technical analysis indicators appear quite mixed this time. On the D1 timeframe, 50% of trend indicators are in green, and the same percentage is in red. Among oscillators, one-third voted for the pair's rise, one-third for its fall, and one-third remained neutral-gray. The nearest support level is located in the range of 148.45-148.80, then 146.85-147.30, 145.90-146.10, 145.30, 144.45, 143.75-144.05, and 142.20. The closest resistance is 150.00-150.15, followed by 150.40-150.80, 151.90 (October 2022 high), and 152.80-153.15.
There is no significant economic data regarding the state of the Japanese economy scheduled for release in the coming week.
CRYPTOCURRENCIES: Important Insights into the Past and Future
First, a few words about the past month. Firstly, on Tuesday, October 31, bitcoin celebrated its birthday. It was on this day in 2008 that someone using the pseudonym Satoshi Nakamoto published (or it was published) a document titled "Bitcoin: A Peer-to-Peer Electronic Cash System." At the same time, it's worth noting that bitcoin itself emerged as a cryptocurrency on the market only on January 3, 2009. On that day, a block was mined, in which the date and a brief excerpt from an article in The Times were written: "The Times 03/Jan/2009 Chancellor on brink of second bailout for banks." On January 12, 2009, Nakamoto made the first transaction on the network, sending cryptocurrency to developer Hal Finney. In the same year, bitcoin was listed on the New Liberty Standart exchange. On it, you could buy 1309 BTC for just $1 (which is nearly $55 million today).
The second significant event was not the last day of October but the entire month. We are talking about the "Uptober effect" (a term formed from the English words "up" and "October"). According to observations by CoinGecko experts, in eight of the last ten years, the cryptocurrency market has shown growth in October compared to the previous month. On average, the "Uptober effect" led to a 14% increase in the total capitalization of digital assets, ranging from 7.3% in 2022 to 42.9% in 2021. The exceptions were 2014 and 2018 when the market fell by 12.7% and 8.3% in one month, respectively.
This year, starting at $27,000 on October 1, bitcoin tested the $35,000 level on October 24, showing an increase of approximately 30%. The final note of October placed the flagship cryptocurrency at $34,545. Several altcoins like Solana (SOL) and Chainlink (LINK) also demonstrated significant rallies. All these cryptocurrencies, paired with USD, are available for trading on the NordFX broker.
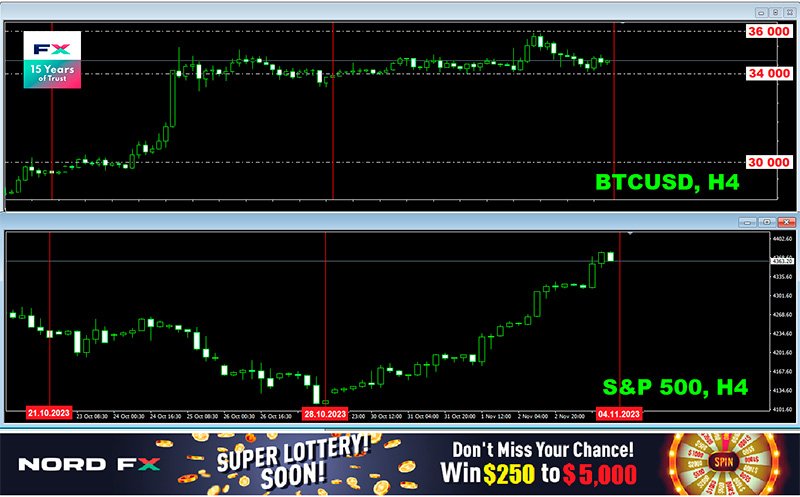
We have already mentioned that lately bitcoin has lost its inverse and direct correlation and has "decoupled" from both the US dollar and major risk assets. This was the case in the past week as well. Digital gold rose along with the US dollar's ascent and didn't react to the rise of stock indices like the S&P500. As a result, BTC/USD showed modest growth over the course of seven days.
According to Michael Van De Poppe, the founder of the venture company Eight and CEO of MN Trading, bitcoin has officially entered a bull market phase. The expert believes that the asset is ready for a rally to $50,000, followed by a correction, and then a new all-time high (ATH). Van De Poppe noted that bitcoin might face resistance at $38,000 but is likely to continue its rise and reach $45,000-50,000 in January 2024. However, the specialist also points out that a drop below $33,000 is still possible, and he sees it as an excellent opportunity to open long positions. The creators of the information resource Look Into Bitcoin also believe that after surpassing the $34,000 price level, the early phase of a bull market has begun. The next targets are $41,900 and $65,050.
What events in the near and not-so-distant future could have a significant impact on the crypto market? Let's list the most important ones, noting that many of them are happening or will happen in the United States.
First, of course, is the monetary policy of the Federal Reserve (FRS). The "golden times" for digital gold were during the peak of the COVID-19 pandemic when the regulator literally flooded the market with streams of cheap money to support the economy, some of which went to risky assets like cryptocurrencies. Starting at $6,500 in March 2020, a year later in April 2021, BTC/USD reached a high of $64,800, showing a 900% increase. Then, the American regulator shifted towards tightening its policy and raising interest rates, and by 2022, the pair was trading around $16,000. Now, crypto investors are waiting for the Federal Reserve to pivot towards easing again and hope that this will happen in the next year.
The US government regulatory bodies have lately been exerting significant negative pressure on the crypto industry. Perhaps something will change with the arrival of a new president in the White House in 2024. At least some of the candidates for this position promise support for the industry. For now, all the attention is focused on the SEC (Securities and Exchange Commission). The head of the SEC, Gary Gensler, has repeatedly stated that he is willing to recognize only bitcoin as a commodity, and in his opinion, all altcoins should be regulated under securities laws. Under this pressure, Ethereum, for example, significantly lagged behind bitcoin in terms of price dynamics. This year, at the time of writing this review, ETH has gained about 52%, while BTC has grown by twice as much, around 102%.
Legal battles between the SEC and representatives of the crypto industry are also drawing attention. Recently, Reuters and Bloomberg reported that the Commission will not appeal a court decision in favor of Grayscale Investments. There is also information that the SEC is ending its legal process against Ripple and its executives. However, the cold war with major crypto exchange Binance and its leadership continues. As a result, Binance's share in the spot market has already fallen from 55% to 34% this year. If the US Department of Justice joins forces with more severe charges on the SEC's side, it could deal a significant blow to the crypto market.
The appearance of spot BTC-ETFs also depends on the SEC. According to JPMorgan bank experts, a positive decision by the SEC on registering the first such funds can be expected "within months." "The timing of approval [...] remains uncertain, but it is likely to happen [...] before January 10, 2024 - the final deadline for the applications of ARK Invest and 21 Co. This is the earliest of the various final deadlines that the SEC must respond to," note JPMorgan experts. At the same time, experts also emphasize that the Commission, by supporting fair competition, may approve all applications at once.
The anticipation of the imminent launch of spot BTC-ETFs in the US is fuelling institutional interest in cryptocurrency. According to some estimates, this interest is around $15 trillion, which could eventually lead to BTC/USD rising to $200,000. Skybridge Capital's strategists even mention a larger figure of $250,000. However, due to obstacles from the SEC, according to Ernst & Young analysts, institutional interest is mainly deferred.
Peter Schiff, the CEO of Euro Pacific Capital and a prominent gold bug, holds the opposite view. According to him, the final approval of spot bitcoin ETFs will mark the end of the bull run for the leading cryptocurrency. Currently, bitcoin is trading around $35,000 because speculators are driving up the price, betting on a positive regulator decision. When the decision is made, there will be no more room for such speculation, which could mark the peak of the rally if bitcoin doesn't crash before that. In Schiff's opinion, cryptocurrency traders may start selling their coins and taking profits even before the SEC makes any decision.
Something that doesn't depend on the regulator is the halving. Recall that in April 2024, the block reward will be halved, reducing from 6,250 BTC to 3,125 BTC, which is expected to lead to reduced issuance. According to some experts, this is a powerful deflationary factor that creates supply shortages and contributes to the rise in the value of bitcoin. Since the coin supply is limited, co-founder of Morgan Creek Digital, Anthony Pompliano, not only expresses optimism about a bull run for bitcoin but also calls it the "most disciplined central bank in the world." According to an optimistic forecast from Ark Invest, BTC could rise to $1.5 million by 2030.
However, the CEO of MN Trading, Van De Poppe, predicts that before bitcoin starts setting new highs, there will first be consolidation and sideways movement for an extended period after the April halving. Even more pessimism is added by a trader and analyst with the pseudonym Rekt Capital, who expects a sharp drop in BTC/USD by March 2024. After the halving, this specialist also anticipates consolidation, but in a very low range of $24,000-30,000, and only after that, in his opinion, the pair will enter a parabolic growth phase towards six-figure levels.
At the time of writing this review, on Friday, November 3, BTC/USD is trading at $34,590. The total market capitalization of the crypto market is $1.29 trillion ($1.25 trillion a week ago). The Crypto Fear & Greed Index remains in the Greed zone, though it has dropped from 72 to 65 points.
To conclude this review, in our irregular crypto life hacks section, we have an interesting tip. Where can you use the heat generated from cryptocurrency mining? The answer is in a sauna. A sauna in Brooklyn, New York, has started using the heat generated by mining equipment as a source of water heating. Saunas are becoming increasingly popular among Americans, and this twist benefits miners as it provides an additional argument in discussions about the public utility or significance of such entrepreneurial activities. And this is in New York, near the 40th parallel. Just imagine how useful this life hack could be in northern countries like Norway!
Dollar Dives on Risk Appetite Revival and Sliding Yields
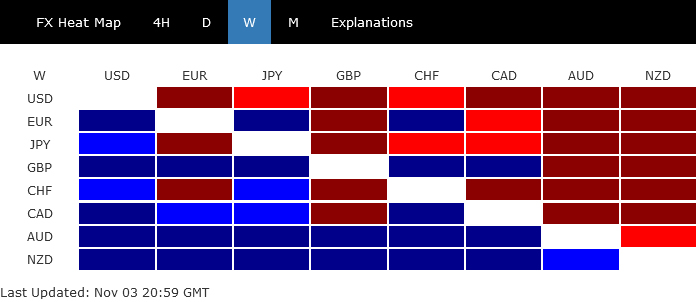
In a week marked by a significant shift in investor sentiment, Dollar found itself at the bottom of the currency heap. A rapid shift to a risk-on attitude was catalyzed by sharp decline in benchmark Treasury yields, fueling an aggressive uptick in stock prices. The surge in equity investments was further amplified when the latest non-farm payroll data bolstered the belief that Fed might have reached the peak of its tightening cycle. Market participants are now keenly watching the extent of the stock market's rally and the depth of the decline in 10-year yield, which will likely be pivotal factors for Dollar's short-term direction.
Japanese Yen trailed closely behind Dollar in terms of weak performance, suffering from the dual forces of robust risk appetite and BoJ's (BoJ) decision to maintain its yield curve control with just tweak, contrary to some investors' expectations for a significant policy adjustment. Swiss Franc also succumbed to the uplifted risk mood, ranking as the third weakest.
Conversely, New Zealand and Australian Dollars emerged as frontrunners in the currency race, propelled by the narrowing yield gap and escalating risk tolerance. British Pound also capitalized on the upbeat market mood, though to a slightly lesser degree. Meanwhile, Euro and Canadian Dollar displayed a mixed finish.
Optimism abounds as markets cheer dipping yields and goldilocks job data
The mood in financial markets was decidedly bullish last week, with investors piling into stocks, propelling major US indexes to their most robust rally in a year. This surge in risk appetite followed spurred by a substantial decline in Treasury yields from their recent highs. Increased expectation that Fed interest have peaked was further reinforced by weaker than expected job data.
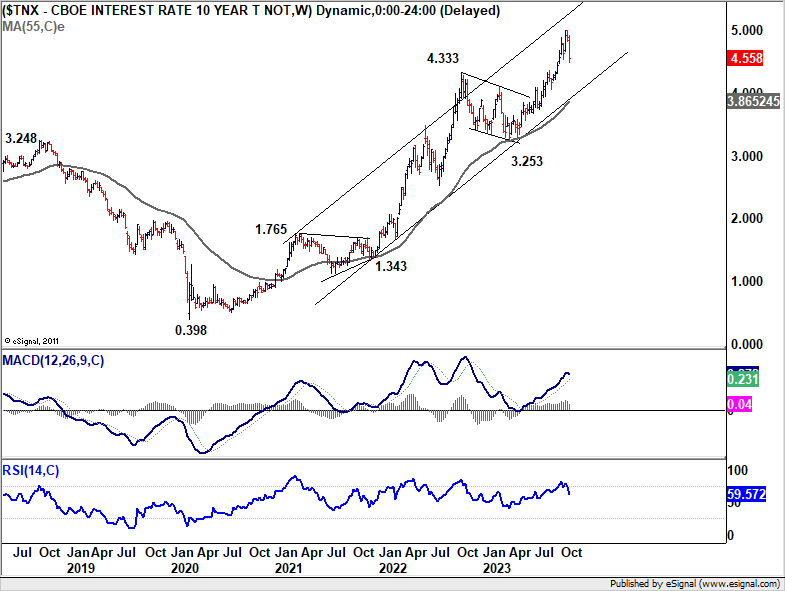
DOW concluded the week with a substantial gain of 5.07%, marking its best performance since October of 2022. S&P 500 and NASDAQ followed suit, jumping 5.85% and 6.61%, respectively, charting their best weeks since November 2022. 10-year Treasury yield nosedived to a low of 4.484% before ending the week slightly higher at 4.558%. This decline in yields was stark, considering the flirtation with 5% level just a week prior. Simultaneously, Dollar Index retreated steeply to a six-week trough, buffeted by a combination of shifting Fed expectations, burgeoning risk-on sentiment, and descending yields.
The spark for the market's bullish turn was first ignited by the Treasury Department's announcement of smaller-than-anticipated increases in the issuance of longer-dated Treasury securities. When the Fed maintained its interest rate unchanged at 5.25-5.50% for the second month in a row and Chair Jerome Powell refrained from signaling any additional hawkish intent, it only bolstered the prevailing risk-on mood.
Moreover, the latest non-farm payroll report delivered a surprise to the markets with its underwhelming job growth numbers, a slight uptick in the unemployment rate, and wage growth that lagged expectations. These indicators are seen as signs that Fed's rigorous efforts to temper the economy and curb inflation are bearing fruit, reducing the need for further rate hikes.
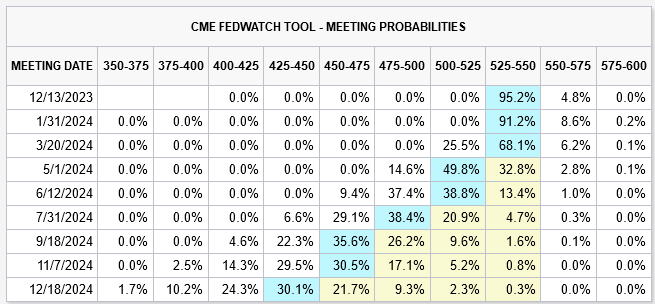
In the aftermath, Fed funds futures are now indicating a mere 4.8% likelihood of a 25 basis point hike at the December meeting. Market conversations are progressively turning towards the prospects of a rate cut, with futures markets pricing in a 64% chance of a cut by May next year, and an 86% probability by June.
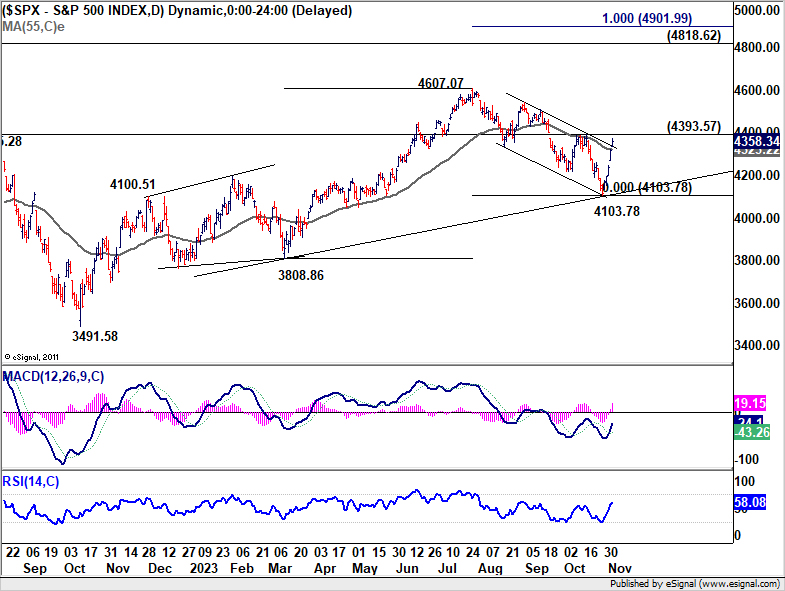
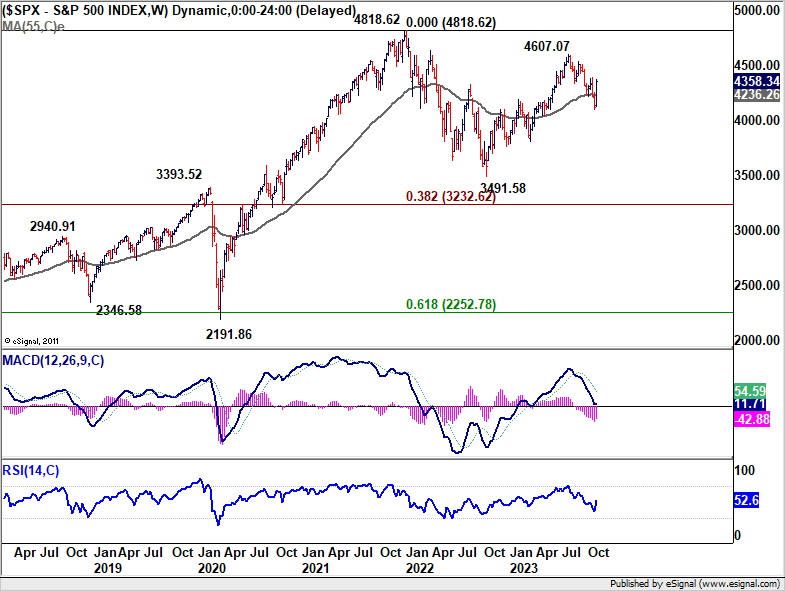
S&P 500 index sidestepped the much-feared "October Crash", with last week's strong rally suggesting that correction from 4607.07 has possibly concluded 4103.78. Immediate focus is now on 4393.57 resistance. Decisive break there will strengthen near term bullishness, to push S&P 500 through 4607.07 resistance to resume the whole up trend from 3491.58 (2022 low).
Even if this year-end "Santa Claus rally" realizes, it's uncertain whether bullish momentum is strong enough to push S&P 500 through 4818.62 (2022 high). We'll leave the assessment for a later stage until there's clearer evidence of the index's ability to maintain its upward course.
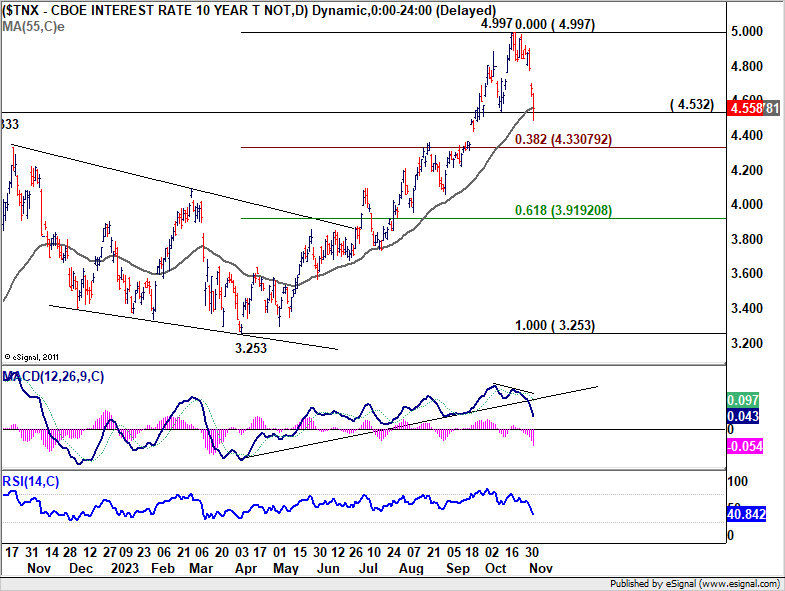
10-year yield's break of 4.532 support last week suggests that rise from 3.253 has completed at 4.997, failing to conquer 5% level. It's now turned into a period of consolidation, with deeper decline in favor. Nevertheless, strong support could emerge around 4.330/333 (38.2% retracement of 3.253 to 4.997 at 4.330). Should TNX find solid ground and rebound from these levels, the current pattern could be interpreted as a mere sideways consolidation, setting the stage for another attempt at challenging the 5% mark in the future. However, sustained break of 4.330 will argue that TNX is already in a larger scale correction, with target on 55 W EMA (now at 3.865) in the medium term.
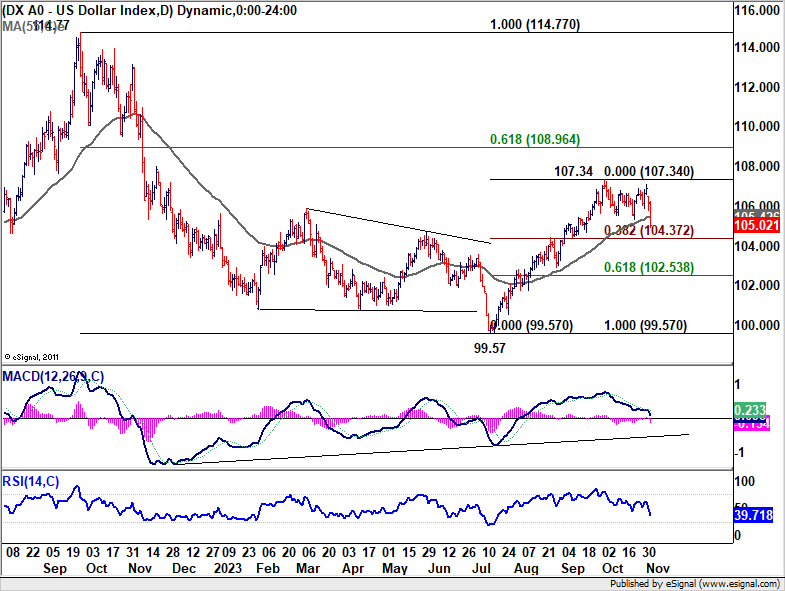
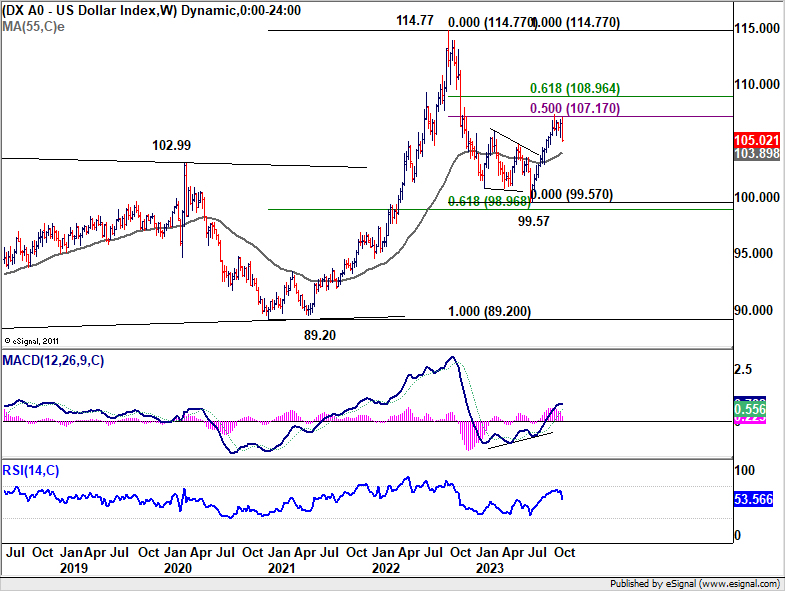
While Dollar Index's decline was deep, price actions from 107.34 could still be seen as a correction to the rise from 99.57 only. As long as 38.2.% retracement of 99.57 to 107.34 at 104.37 holds, rise from 99.57 should still resume through 107.34 at a later stage. However, firm break of 104.37 will raise the chance of bearish reversal, or as a correction, drag DXY through 55 W EMA (now at 103.89) to 61.8% retracement at 102.53.
BoJ's tepid policy tweaks fail to support Yen, NZD/JPY soars
Last week's highly anticipated BoJ policy meeting concluded with results that fell short of market expectations. Despite widespread speculation of a significant shift in its yield curve control policy, the central bank limited its actions to a minor adjustment in its language, effectively softening the previously rigid cap on the 10-year bond yield. This move was seen as a bid to permit a moderate rise in long-term borrowing costs, diverging slightly from the strict ceiling imposed just a quarter ago.
Governor Kazuo Ueda held firm on BoJ's longstanding dovish stance, committing to "patiently" maintain its stimulative monetary approach. The underwhelming response from BoJ disappointed investors who had bet on a more substantial policy shift, and as a result, Yen experienced renewed selling pressure. This decline was further exacerbated by the prevailing risk-on mood in global markets.
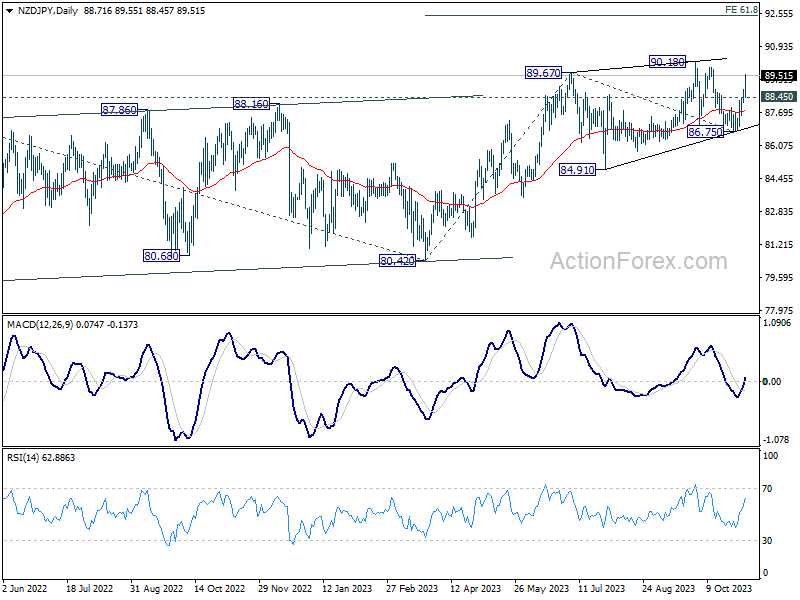
NZD/JPY was among the top movers in the week, up 2.95%. Current development argues that rise from 80.42 is ready to resume. Further rise is expected as long as 88.45 support holds, to retest 90.18 first. Firm break of 90.18 will confirm this bullish case, and target 61.8% projection of 80.42 to 89.67 from 86.75 at 92.46 next.
GBP/CHF rallies on risk-on sentiment, overcoming BoE
Sterling has managed to hold its ground amidst a dynamic week in the financial markets, drawing strength from a global risk-on mood which has somewhat cushioned the blow from BoE's latest policy decision. The MPC concluded with a split 6-3 vote to maintain Bank Rate at its current level of 5.25%. BoE provided a projection path for the Bank Rate, suggesting it would hover around the 5.25% mark until the third quarter of 2024 before anticipating a gradual decline to 4.25% by the end of 2026. The overall announcement aligned with growing consensus that interest rate in the UK have peaked.
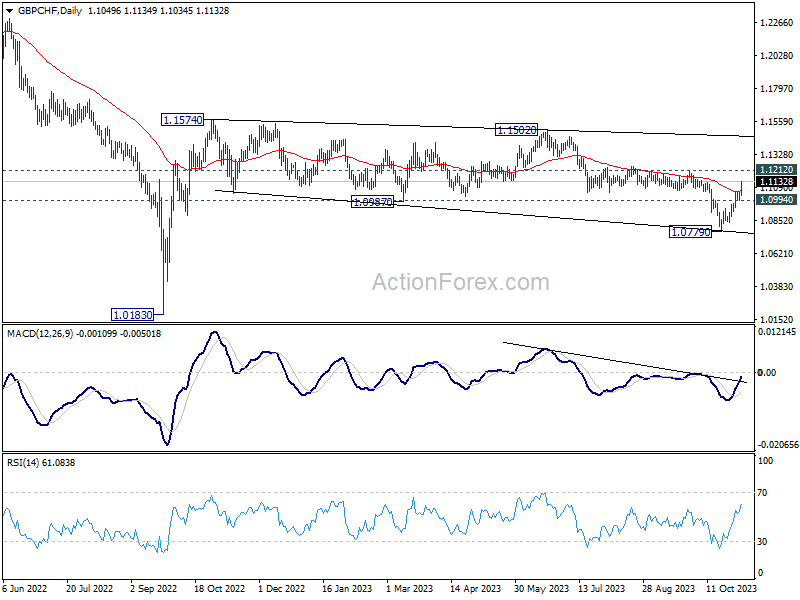
GBP/CHF's strong break of 55 D EMA (now at 1.1065) suggests that fall from 1.1502 has completed at 1.0779. Further rise is expected as long as 1.0994 support holds. Firm break of 1.1212 will bolster the case that whole corrective pattern from 1.1574 has finished too. Stronger rally should then be seen to 1.1502/1574 resistance zone next.
EUR/USD Weekly Outlook
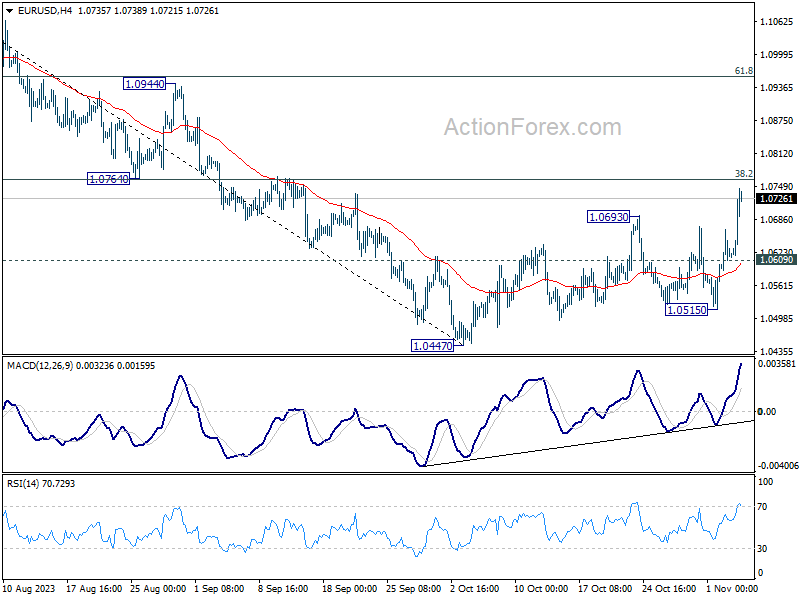
EUR/USD's rebound from 1.0447 resumed last week and the break of 55 D EMA argues that fall from 1.1274 has completed. Initial bias stays on the upside this week for 1.0764 cluster resistance (38.2% retracement of 1.1274 to 1.0447 at 1.0763). Decisive break there will pave the way to 61.8% retracement at 1.0958 next. On the downside, below 1.0609 minor support will turn intraday bias neutral first.
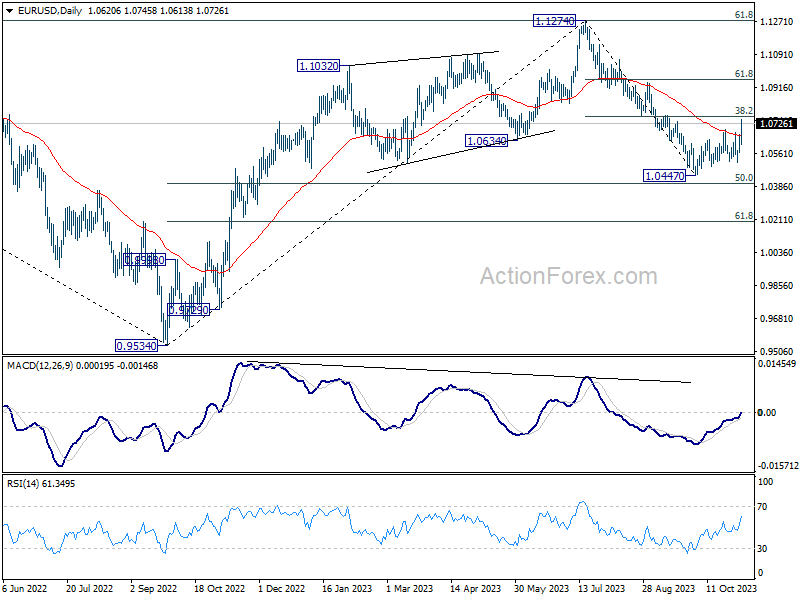
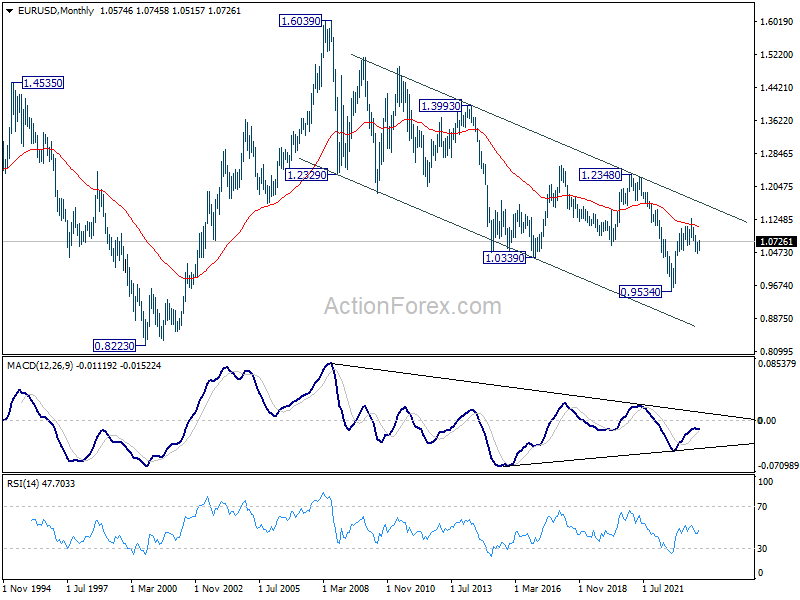
In the bigger picture, price actions from 1.1274 are viewed as a corrective pattern to rise from 0.9534 (2022 low). Rise from 1.0447 is tentatively seen as the second leg. Hence while further rally could be seen, upside should be limited by 1.1274 to bring the third leg of the pattern.
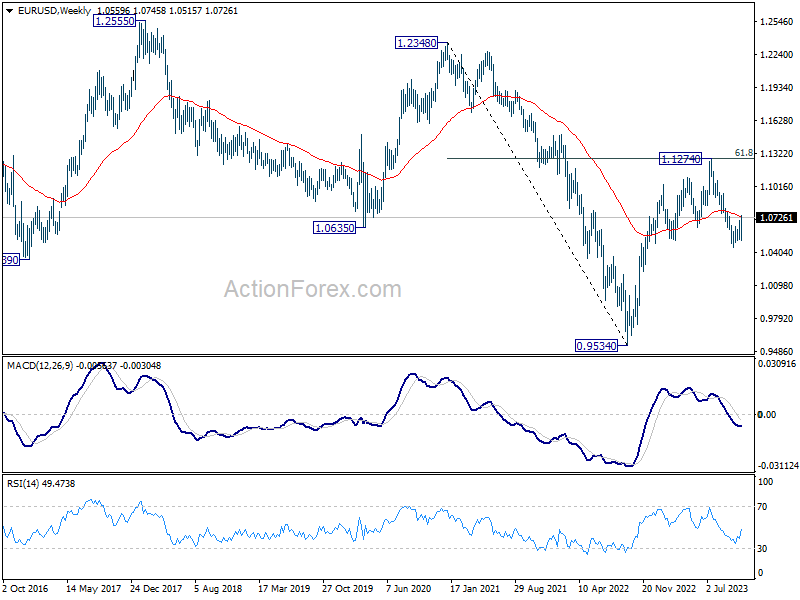
In the long term picture, sustained trading above 55 M EMA (now at 1.1087) is needed to be the first sign of bullish trend reversal. Decisive break of 1.2348 structural resistance is needed to confirm. Otherwise, outlook will be neutral at best.
EUR/USD Weekly Outlook
EUR/USD's rebound from 1.0447 resumed last week and the break of 55 D EMA argues that fall from 1.1274 has completed. Initial bias stays on the upside this week for 1.0764 cluster resistance (38.2% retracement of 1.1274 to 1.0447 at 1.0763). Decisive break there will pave the way to 61.8% retracement at 1.0958 next. On the downside, below 1.0609 minor support will turn intraday bias neutral first.
In the bigger picture, price actions from 1.1274 are viewed as a corrective pattern to rise from 0.9534 (2022 low). Rise from 1.0447 is tentatively seen as the second leg. Hence while further rally could be seen, upside should be limited by 1.1274 to bring the third leg of the pattern.
In the long term picture, sustained trading above 55 M EMA (now at 1.1087) is needed to be the first sign of bullish trend reversal. Decisive break of 1.2348 structural resistance is needed to confirm. Otherwise, outlook will be neutral at best.
USD/JPY Weekly Outlook
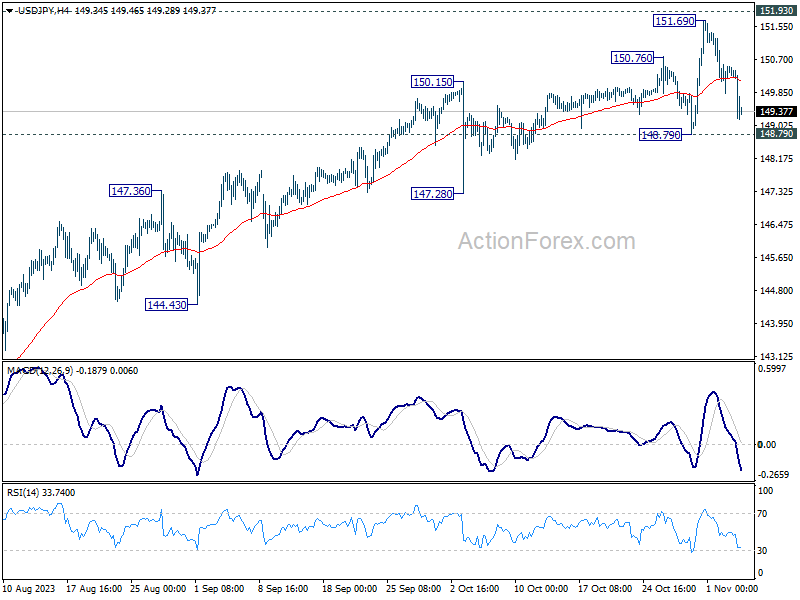
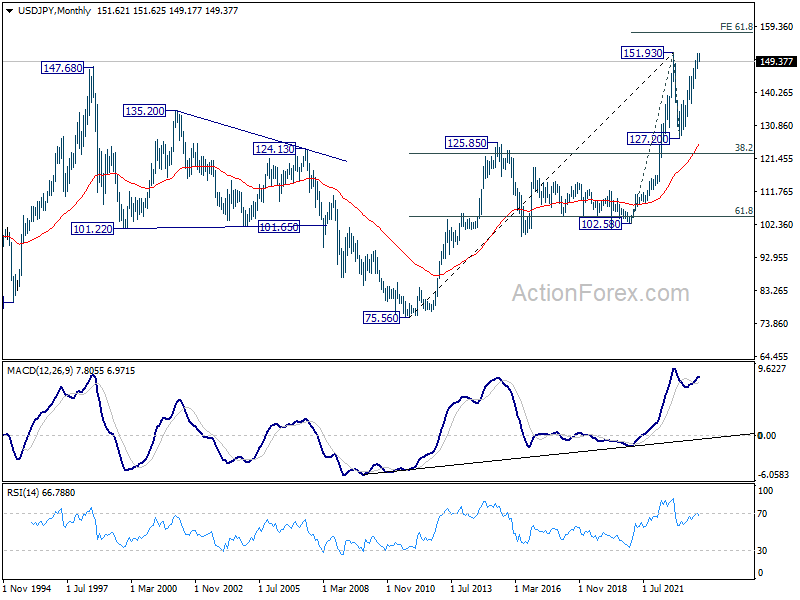
USD/JPY retreated steeply after edging higher to 151.69 last week. But downside is contained above 148.79 support so far. Initial bias remains neutral this week first. Price actions from 151.69 could still be seen as a consolidation pattern only. However, firm break of 148.79 will indicate rejection by 151.93 key resistance, and bring deeper fall through 147.28 support.
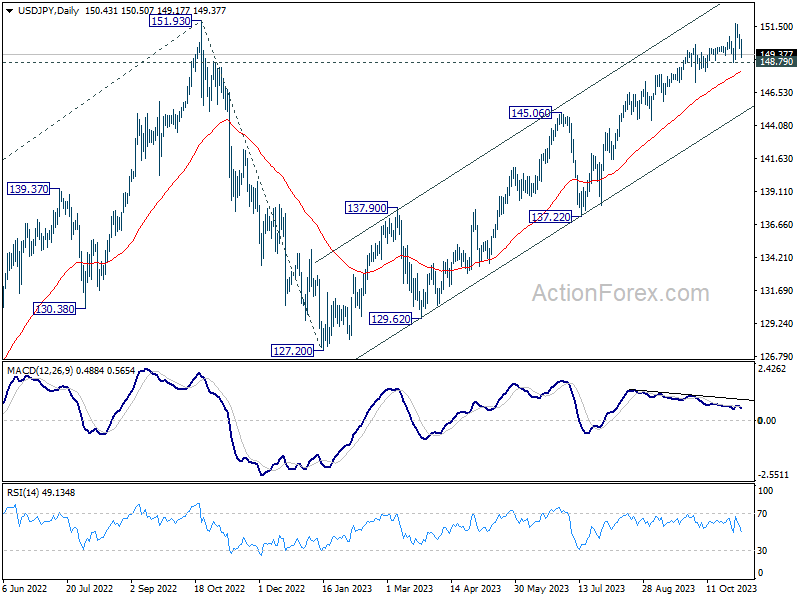
In the bigger picture, immediate focus is now on 151.93 resistance (2022 high). Rejection by 151.93, followed by sustained break of 145.06 resistance turned support will argue that rise from 127.20 has completed, and turn outlook bearish for 137.22 support and below. However, sustained break of 151.93 will confirm resumption of long term up trend. Next target will be 61.8% projection of 102.58 to 151.93 from 127.20 at 157.69.
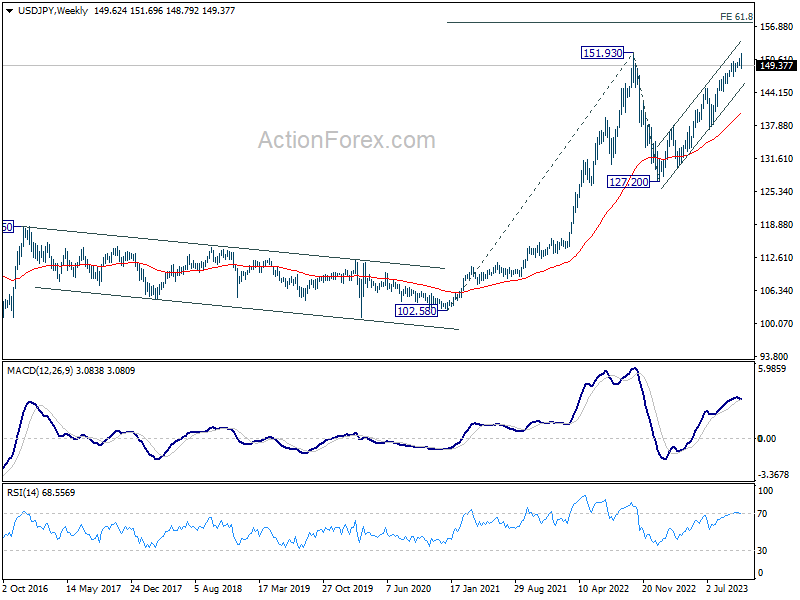
In the long term picture, price action from 151.93 is seen as developing into a corrective pattern to up trend from 75.56 (2011 low). Another falling leg could be seen, but in that case, downside should be contained by 38.2% retracement of 75.56 to 151.93 at 122.75. On resumption, next target would be 61.8% projection of 102.58 to 151.93 from 127.20 at 157.69.
GBP/USD Weekly Outlook
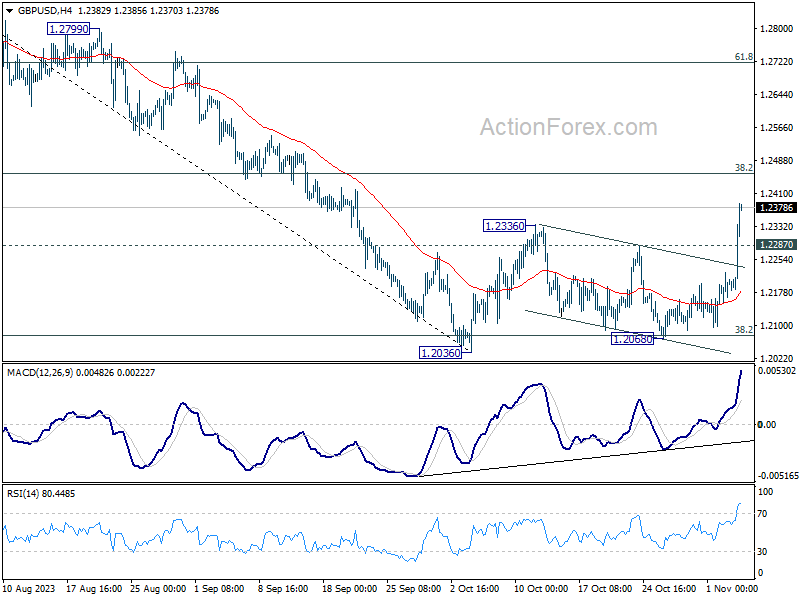
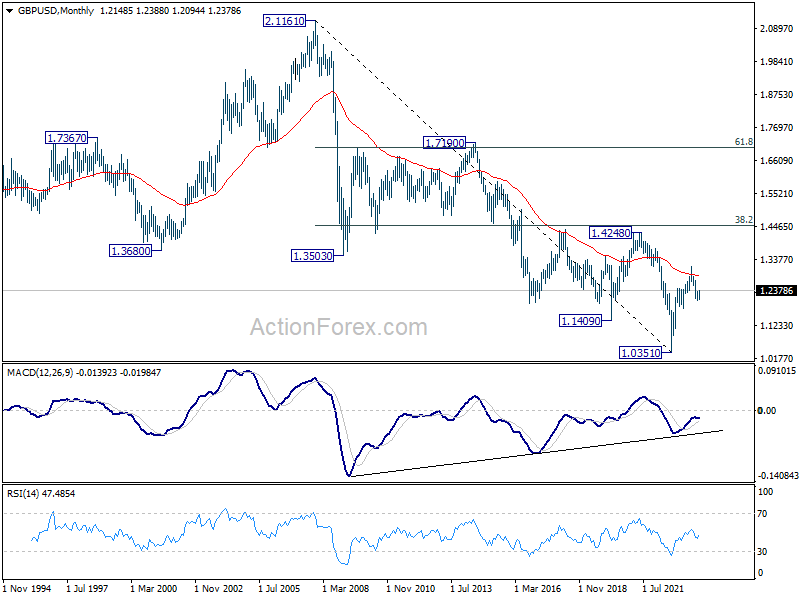
GBP/USD's strong rally and break of 1.2236 resistance confirms resumption of whole rebound from 1.2036. Initial bias stays on the upside this week for 38.2% retracement of 1.3141 to 1.2036 at 1.2458. Sustained break there will pave the way to 61.8% retracement at 1.2783. On the downside, below 1.2287 minor support will turn intraday bias neutral first.
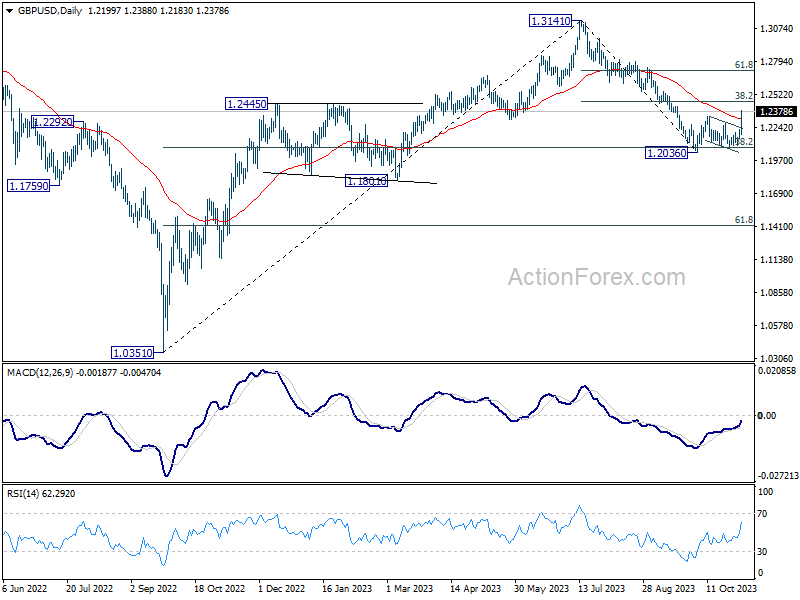
In the bigger picture, the strong rebound from 38.2% retracement of 1.0351 to 1.3141 at 1.2075 argues that price action from 1.3141 are merely a correction to rise from 1.0351 (2022 low). Current rally from 1.2036 is tentatively seen as the second leg of the pattern. Hence, while further rally is in favor, upside should be limited by 1.3141 to start the third leg.
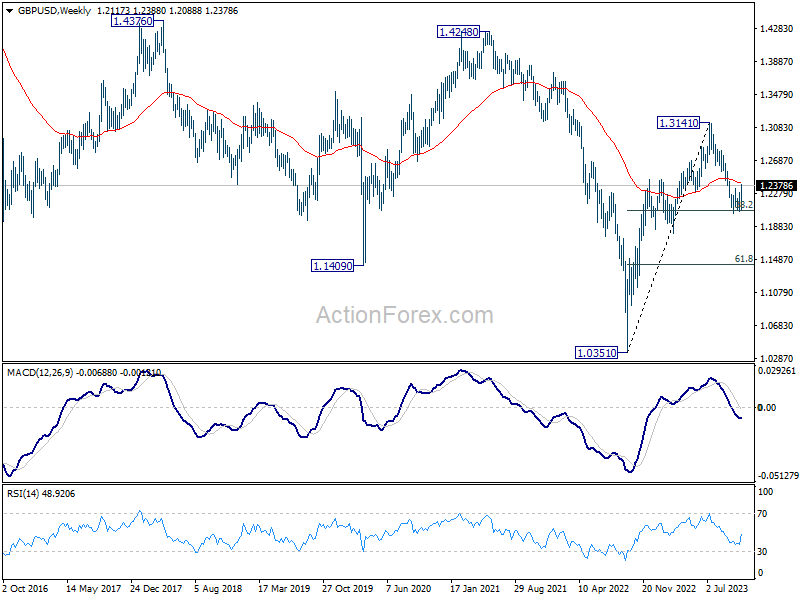
In the long term picture, sustained trading above 55 M EMA (now at 1.2832) is needed to be the first sign of bullish trend reversal. Decisive break of 1.4248 structural resistance is needed to confirm. Otherwise, outlook will be neutral at best.
USD/CHF Weekly Outlook
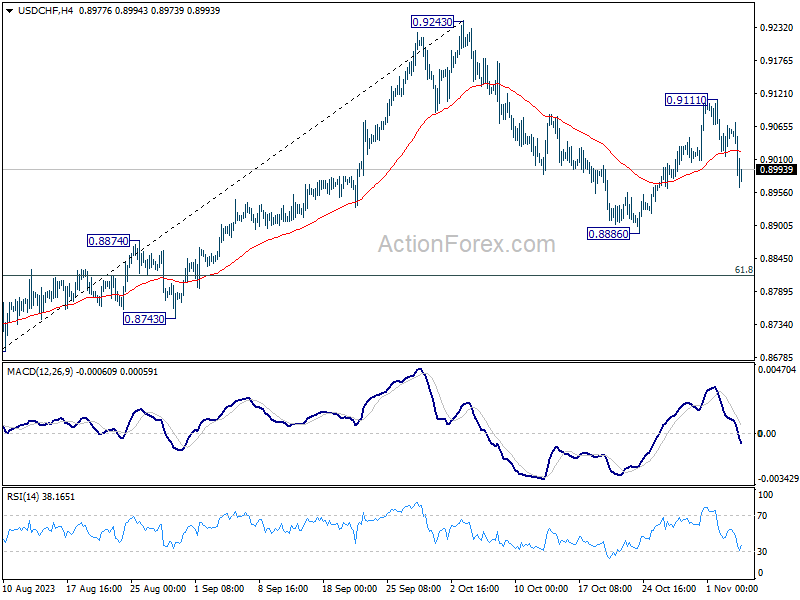
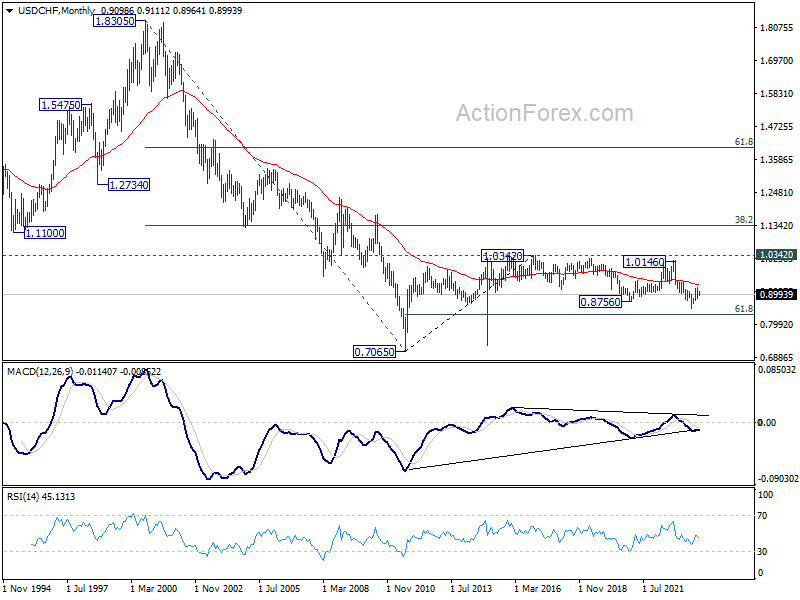
USD/CHF rose further to 0.9111 last week but subsequent retreat argues that rebound from 0.8886 has completed. Initial bias remains mildly on the downside this week for 0.8886 support first. Break there will resume whole decline from 0.9243 to 0.8815 fibonacci support. For now, risk will be on the downside as long as 0.9111 resistance holds, in case of recovery.
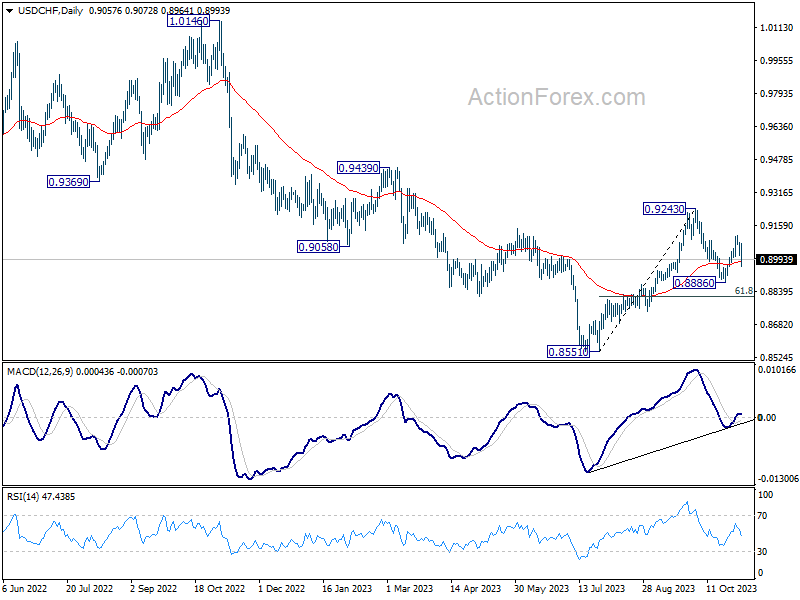
In the bigger picture, outlook is mixed up by the deeper than expected pull back from 0.9243. Yet there was no follow through selling after hitting 0.8886. On the upside, break of 0.9243 resistance will revive the case of medium term bottoming at 0.8851, and turn outlook bullish. However, sustained break of 61.8% retracement of 0.8551 to 0.9243 at 0.8815 will argue that larger decline from 1.0146 is ready to resume through 0.8551 low.
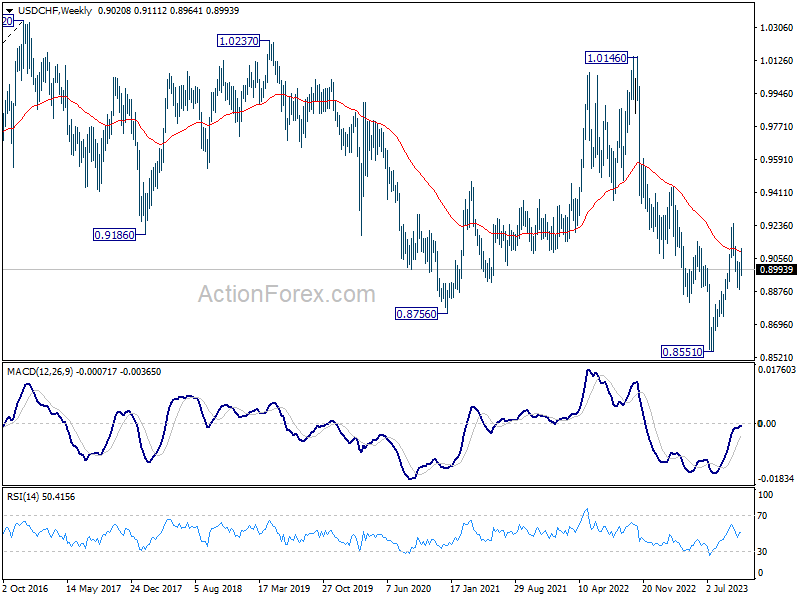
In the long term picture, there is no clear sign that down trend from 1.8305 (2000 high) has completed. With 38.2% retracement of 1.8305 to 0.7065 at 1.1359 intact, outlook is neutral at best.
AUD/USD Weekly Report
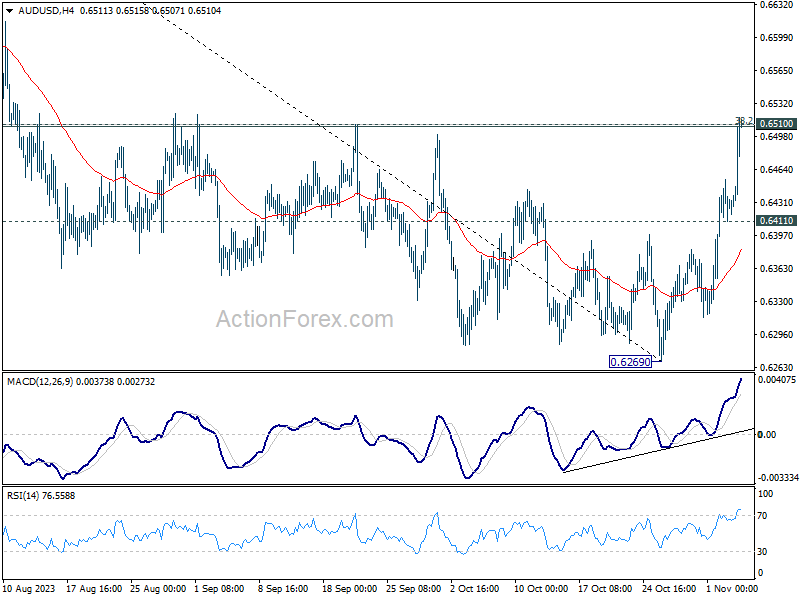
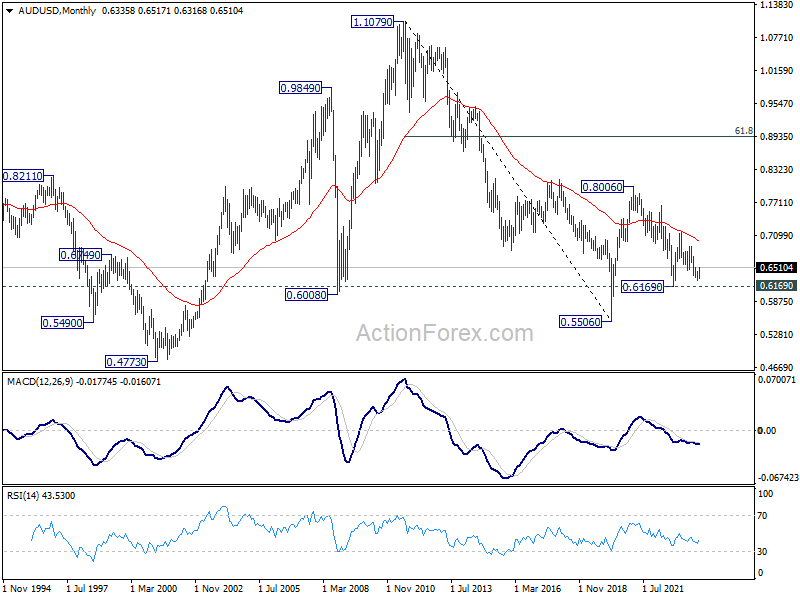
AUD/USD's strong rally last week confirmed short term bottoming at 0.6269. Initial bias stays on the upside this week with focus on 0.6510 cluster resistance (38.2% retracement of 0.6894 to 0.6269 at 0.6508). Sustained break of 0.6510 will argue that whole decline from 0.7156 might be completed with three waves down to 0.6269. Stronger rally should then be seen to medium term trend line resistance (now at 0.6708). Meanwhile, rejection by 0.6510 will retain near term bearishness.
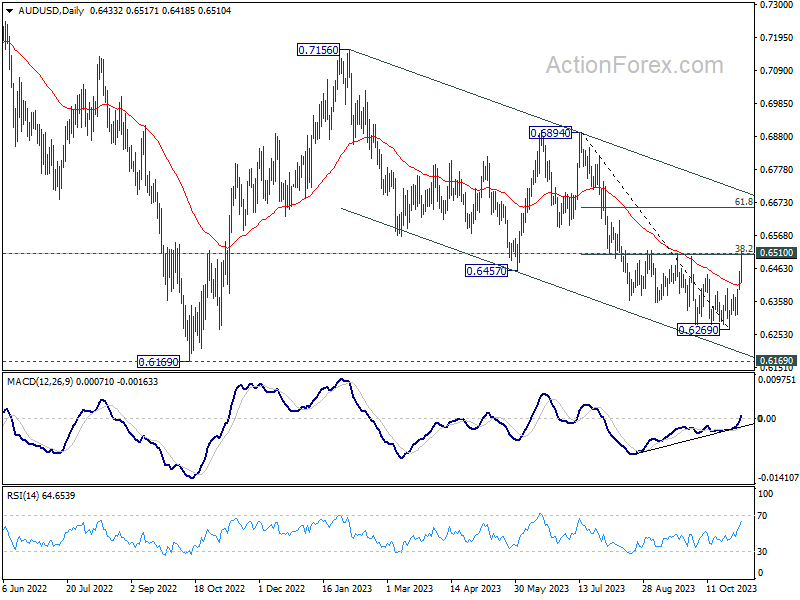
In the bigger picture, there is no confirmation that down trend from 0.8006 (2021 high) has completed. While current rebound from 0.6269 might extend higher, it could be the third leg of a corrective pattern from 0.6169 (2022 low) only. For now, medium term bearishness will remain as long as 0.6894 resistance holds.
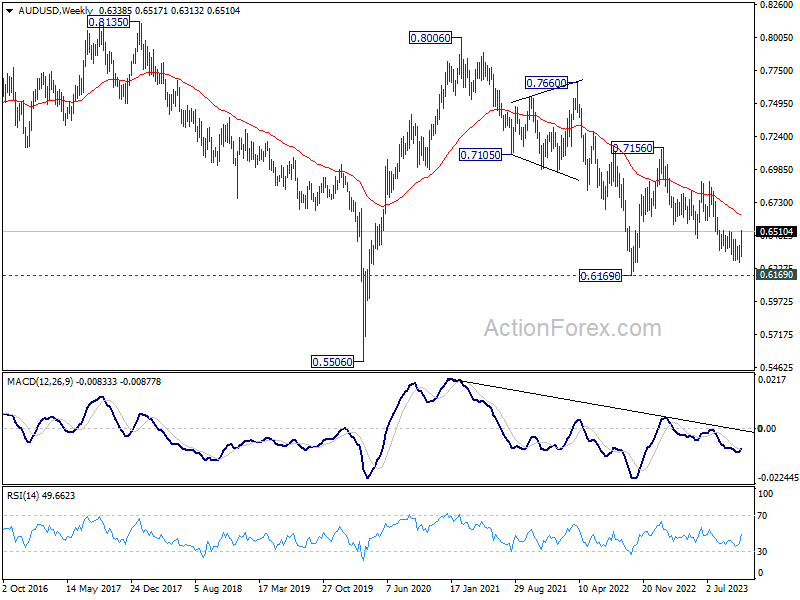
In the long term picture, while fall from 0.8006 might extend lower, the structure argues that it's merely a correction to rise from 0.5506 (2020 low). In case of downside extension, strong support should emerge above 0.5506 to bring reversal. But still, momentum of the next move will be monitored to adjust the assessment.
USD/CAD Weekly Outlook
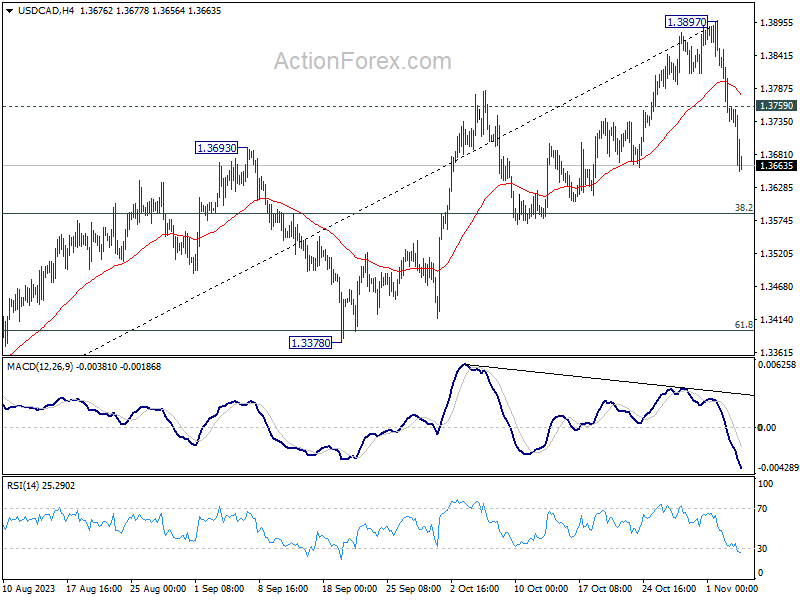
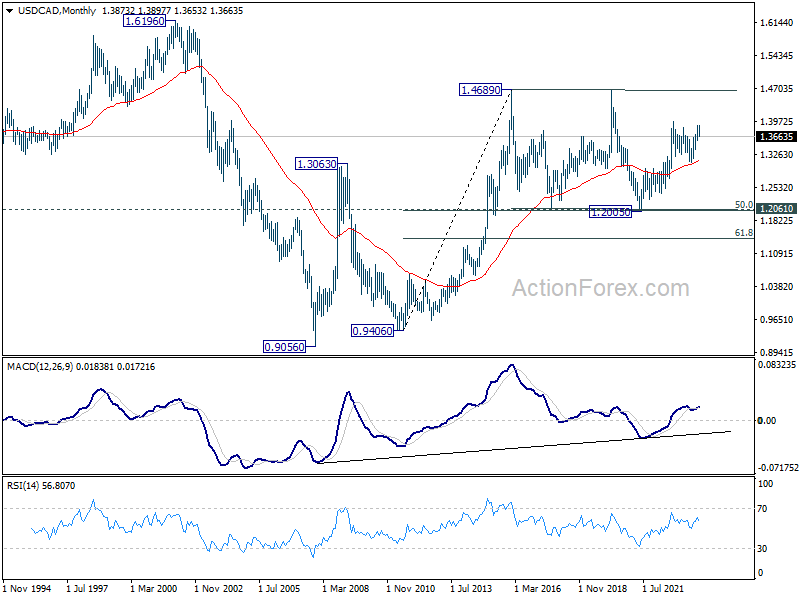
USD/CAD"s deeper decline from 1.3897 last week indicates short term topping. Initial bias remains on the downside this week for 38.2% retracement of 1.3091 to 1.3897 at 1.3589. Strong support should be seen there to bring rebound. On the upside, above 1.3759 minor resistance will bring retest of 1.3897. However, sustained break of 1.3589 will bring deeper fall to 61.8% retracement at 1.3399.
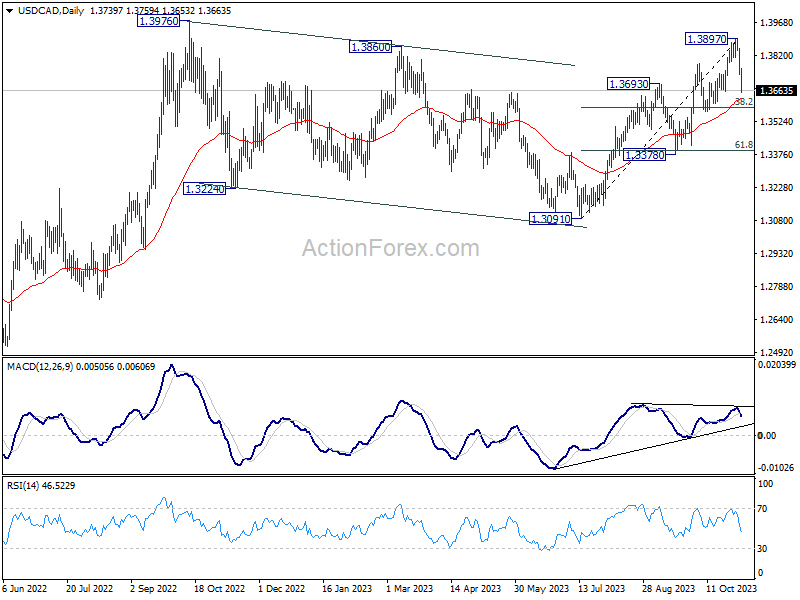
In the bigger picture, corrective pattern from 1.3976 (2022 high) should have completed with three waves down to 1.3091. Decisive break of 1.3976 high will confirm resumption of up trend from 1.2005 (2021 low). This will now remain the favored case as long as 1.3378 support holds. However, firm break of 1.3378 will argue that the pattern from 1.3976 is indeed still extending.
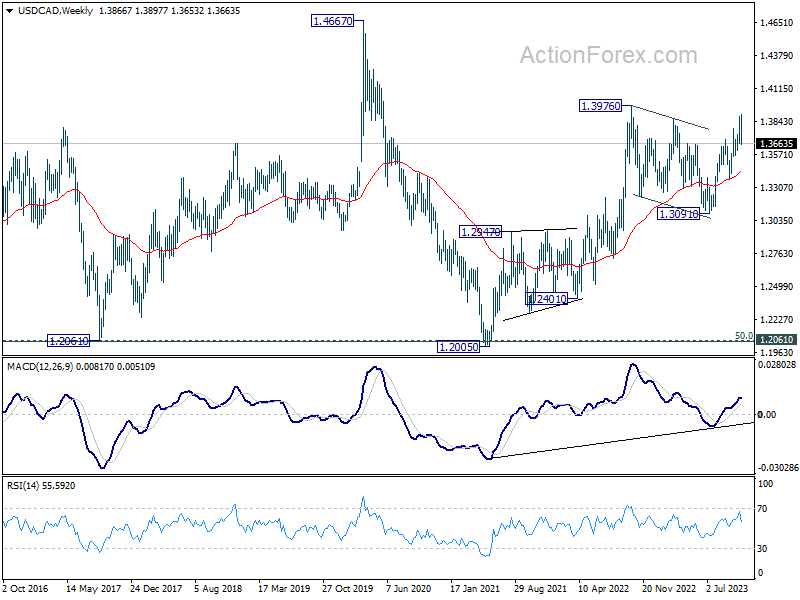
In the longer term picture, price actions from 1.4689 (2016 high) are seen as a consolidation pattern only, which might have completed at 1.2005. That is, up trend from 0.9506 (2007 low) is expected to resume at a later stage. This will remain the favored case as 55 M EMA (now at 1.3100) holds.
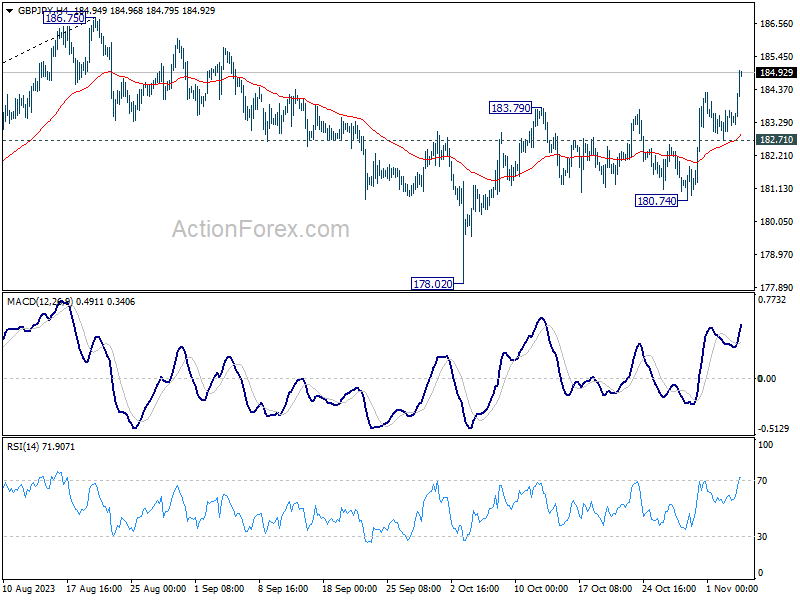
GBP/JPY Weekly Outlook
GBP/JPY's rise from 178.02 resumed by breaking through 183.79 last week. Initial bias is on the upside this week for retesting 186.75 high. Decisive break there will resume larger up trend. On the downside, break of 182.71 support is needed to indicate short term topping. Otherwise, further rally will remain in favor in case of retreat.
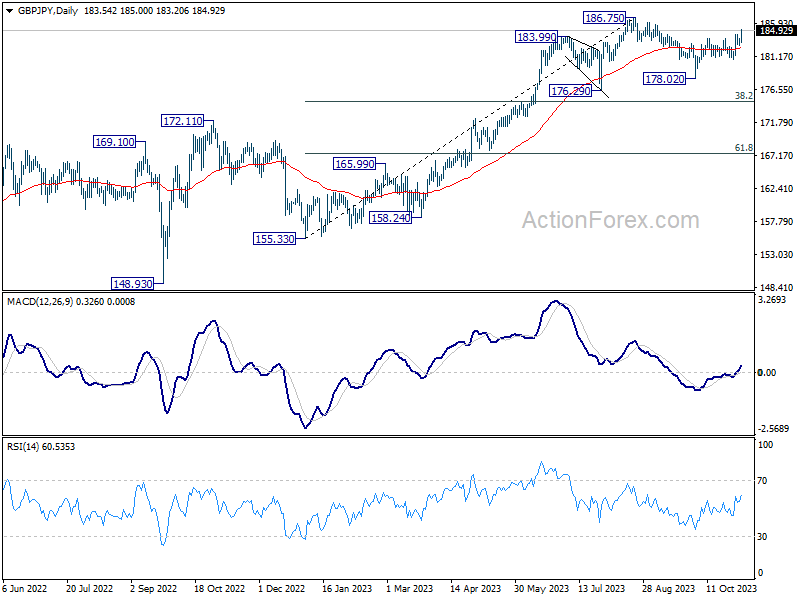
In the bigger picture, as long as 176.29 support holds, larger up trend from 123.94 (202 low) should still be in progress. Break of 186.75 will target 195.86 (2015 high). Nevertheless, firm break of 176.29 will confirm medium term topping, and bring lengthier and deeper consolidations.
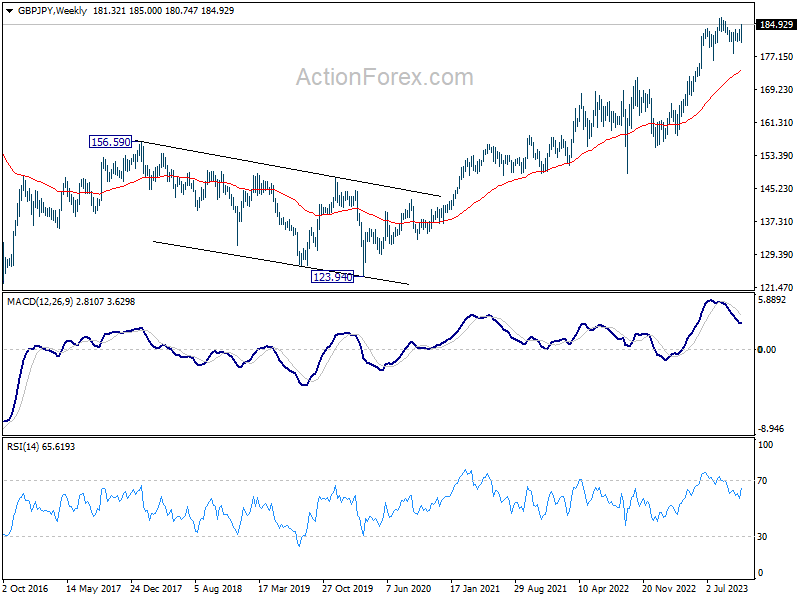
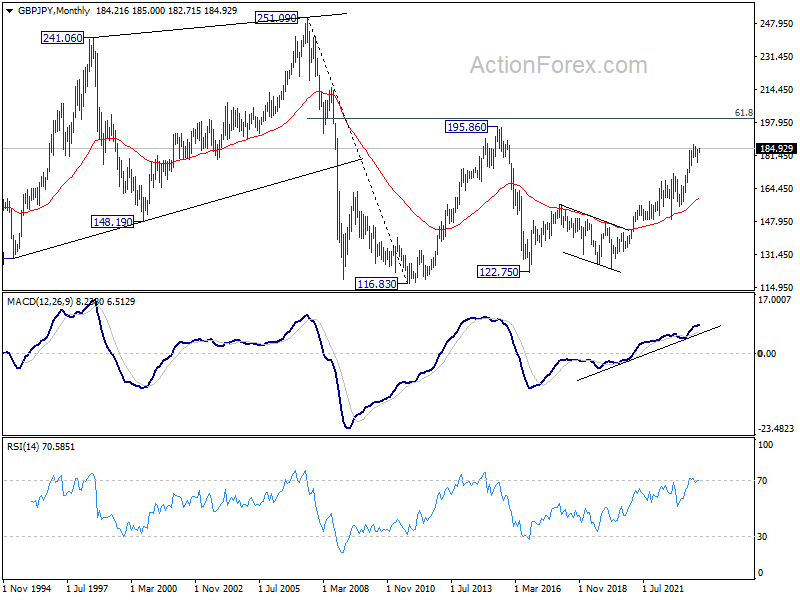
In the longer term picture, rise from 122.75 (2016 low) in still in progress but started losing upside momentum as seen in W MACD. Further rise will remain in favor, though, as long as 176.29 support holds, to retest 195.86 (2015 high).
EUR/JPY Weekly Outlook
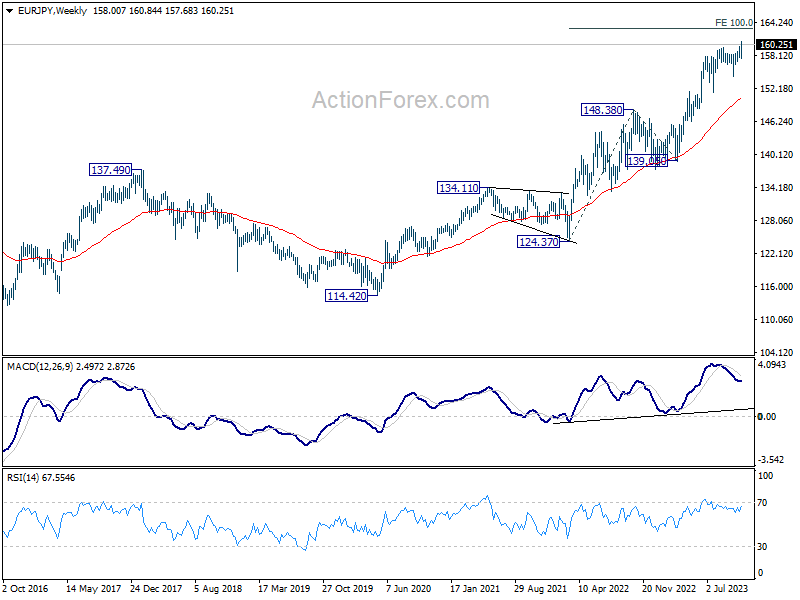
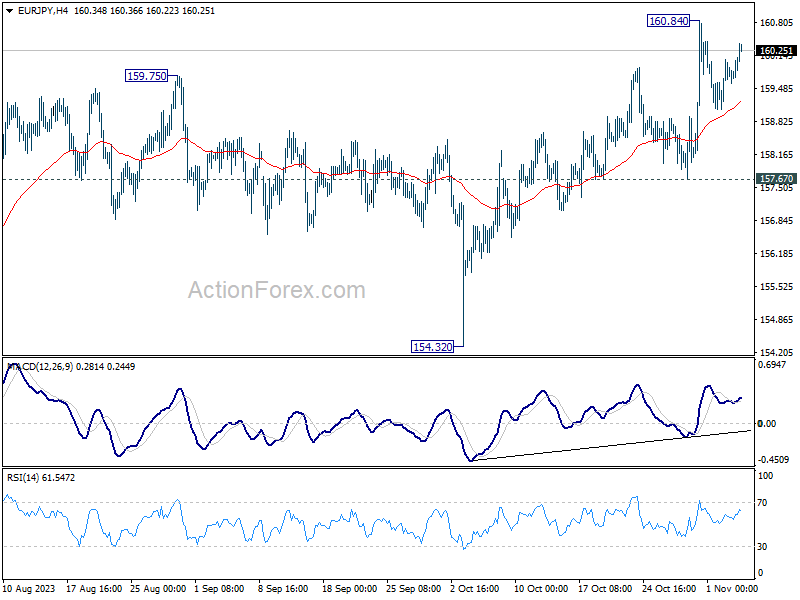
EUR/JPY's up trend resumed last week and hit 160.84 before turning into consolidation. Initial bias stays neutral this week as more sideway trading could be seen. But outlook will stay bullish as long as 157.67 support holds. Break of 160.84 will resume larger up trend to 163.06 projection level next.
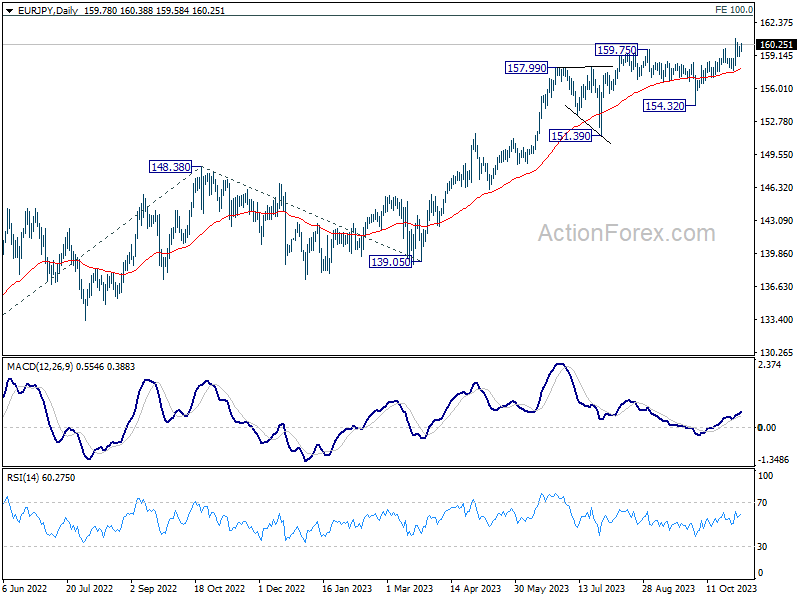
In the bigger picture, rise from 114.42 (2020 low) is in progress. Next target is 100% projection of 124.37 to 148.38 from 139.05 at 163.06. On the downside, break of 154.32 support is needed to be the first sign of medium term topping. Otherwise, outlook will remain bullish even in case of deep pullback.
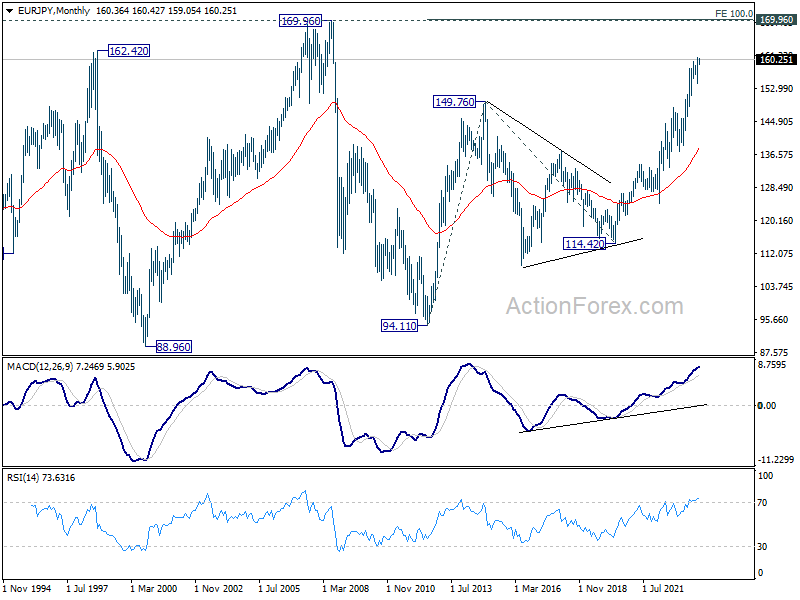
In the long term picture, rise from 109.03 (2016 low) is seen as the third leg of the whole up trend from 94.11 (2012 low). Next target is 100% projection of 94.11 to 149.76 from 114.42 at 170.07 which is close to 169.96 (2008 high).