Sample Category Title
EUR/GBP Daily Outlook
Daily Pivots: (S1) 0.8647; (P) 0.8685; (R1) 0.8705; More....
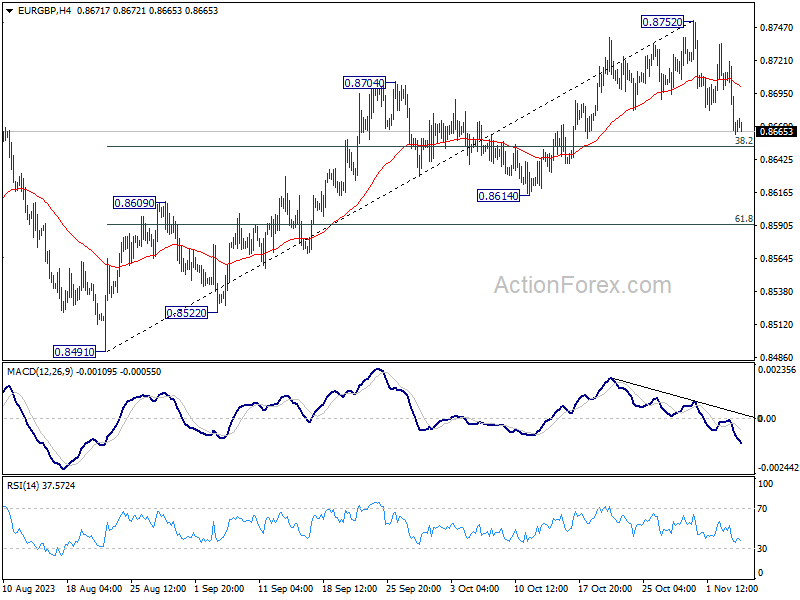
Price actions from 0.8752 are seen as correcting whole rally from 0.8491. Intraday bias stays mildly on the downside for 38.2% retracement of 0.8491 to 0.8752 at 0.8652 and below. But downside should be contained by 0.8614 support to bring rebound.
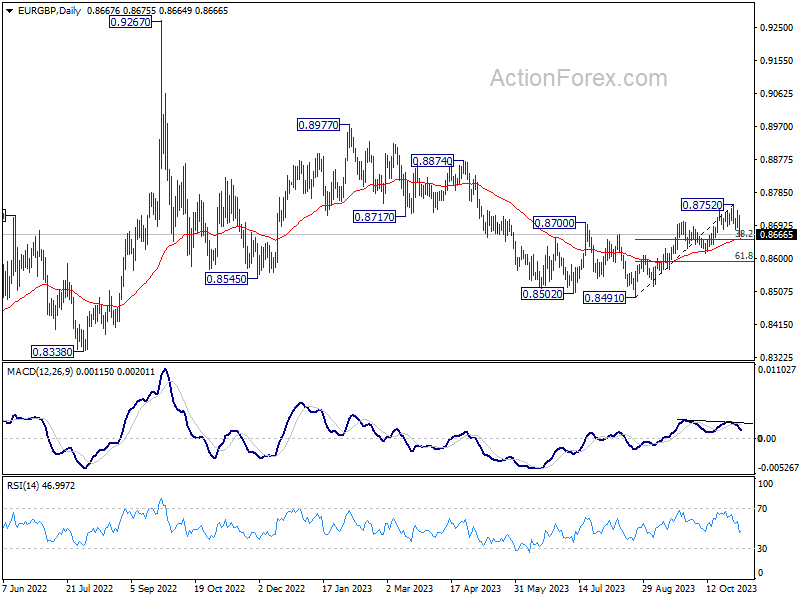
In the bigger picture, current development suggests that whole down trend from 0.9267 (2022 high) has completed with three down to to 0.8491. Rise from 0.8491 is seen as another leg inside that pattern from 0.9499 (2020 high). Further rally should be seen to 0.8977 resistance and above. This will remain the favored case as long as 0.8614 support holds.
EUR/AUD Daily Outlook
Daily Pivots: (S1) 1.6450; (P) 1.6492; (R1) 1.6518; More...
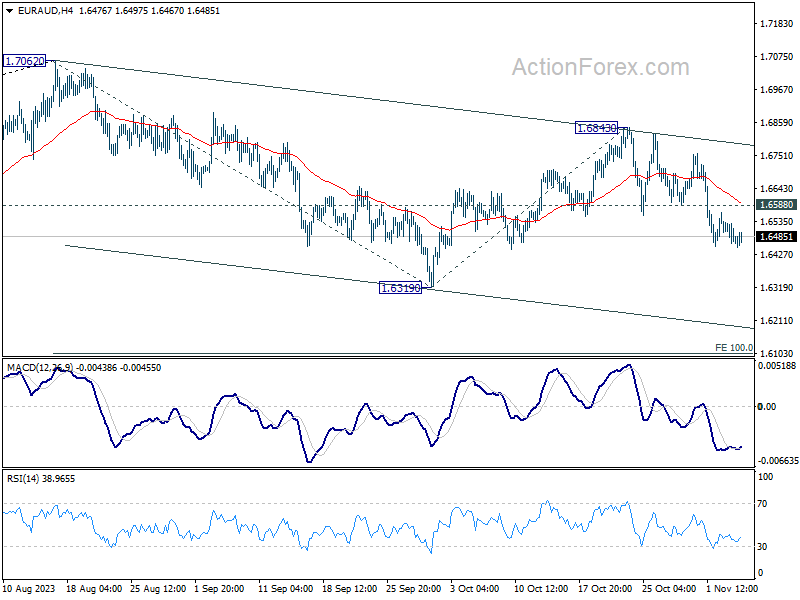
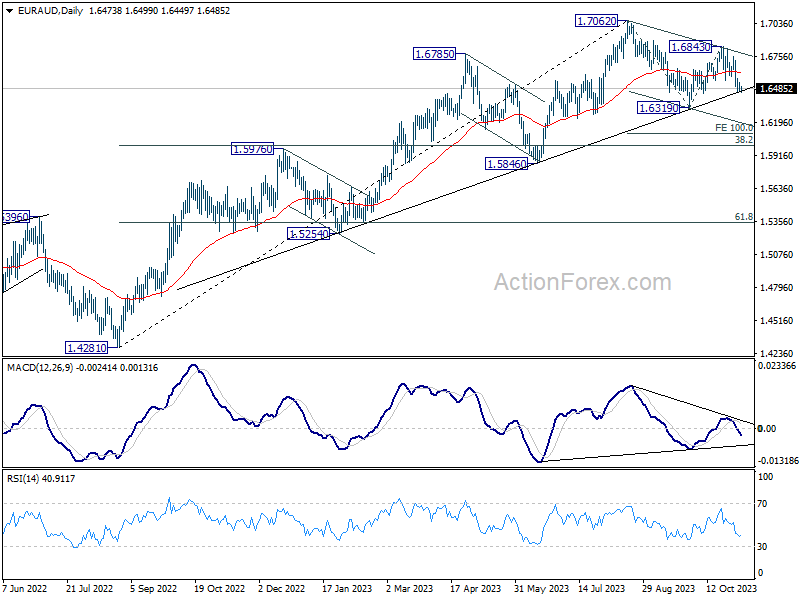
Intraday bias in EUR/AUD remains on the downside for retesting 1.6319 support first. Sustained break there will resume the fall from 1.7062, and target 100% projection of 1.7062 to 1.6319 from 1.6843 at 1.6100. On the upside, above 1.6588 minor resistance will turn intraday bias neutral first.
In the bigger picture, current development suggests that 1.7062 is already a medium term top. Fall from there is seen as a correction to the up trend from 1.4281 (2022 low). While deeper decline might be seen, strong support should emerge from 38.2% retracement of 1.4281 to 1.7062 at 1.6000 to contain downside. However, sustained break of 1.6000 will raise the chance of bearish tend reversal.
EUR/CHF Daily Outlook
Daily Pivots: (S1) 0.9627; (P) 0.9638; (R1) 0.9661; More...
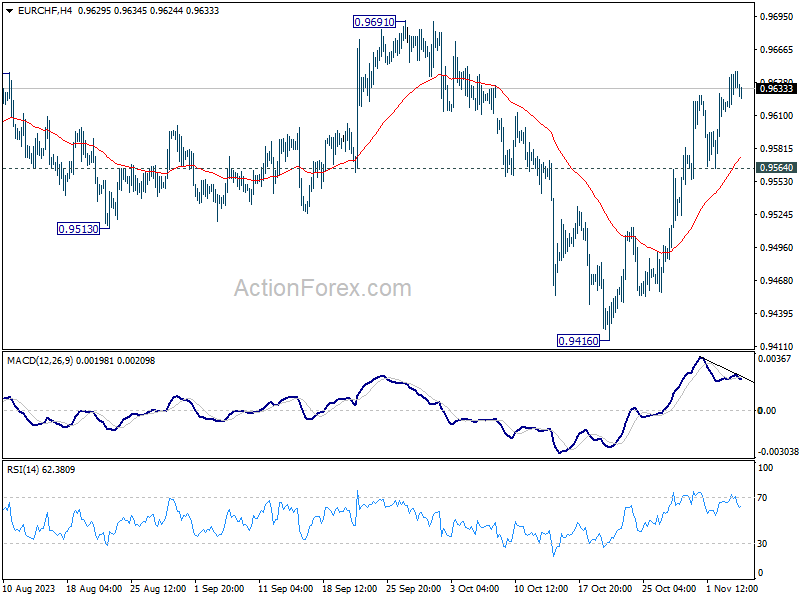
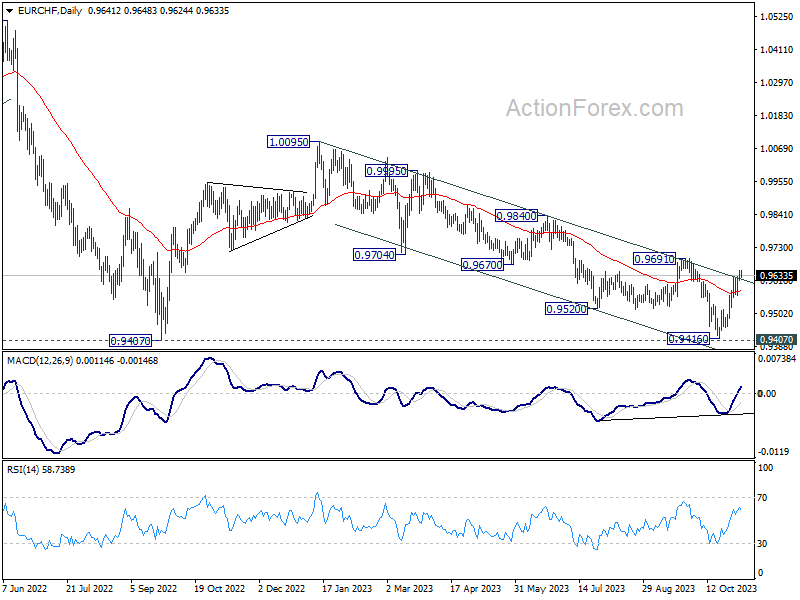
Further rally is expected in EUR/CHF as long as 0.9564 minor support holds. Current rebound from 0.9416 should target 0.9691 resistance first. Firm break there will argue that whole decline from 1.0095 has completed at 0.9416, just ahead of 0.9407 support (2022 low). Further rally would be seen to 0.9840 resistance.
In the bigger picture, as long as 1.0095 resistance holds, price actions from 0.9407 are viewed as a three-wave consolidation pattern first. Current rise from 0.9416 might be the third leg. That is, larger down trend from 1.2004 (2018 high) might still resume through 0.9407 at a later stage. However, decisive break of 1.0095 will argue that the long term down trend is reversing.
Aussie Bottoming With An Ending Diagonal
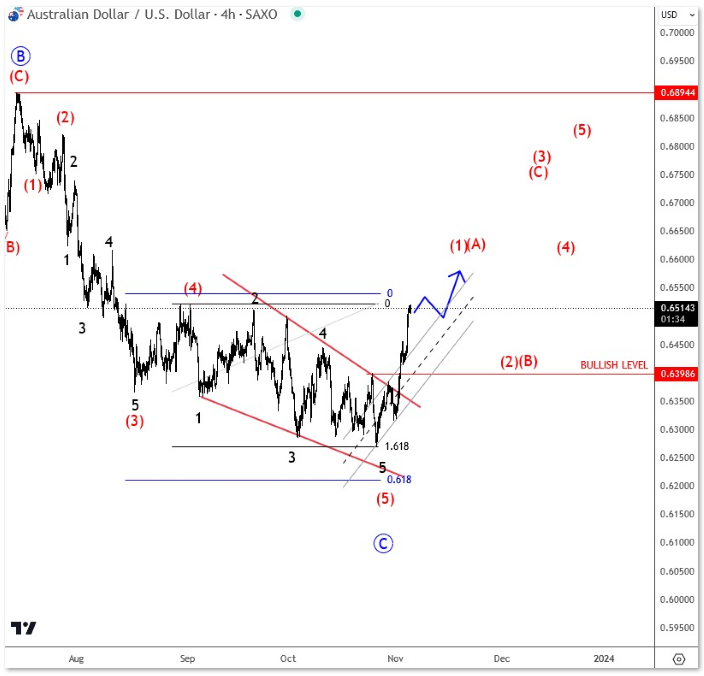
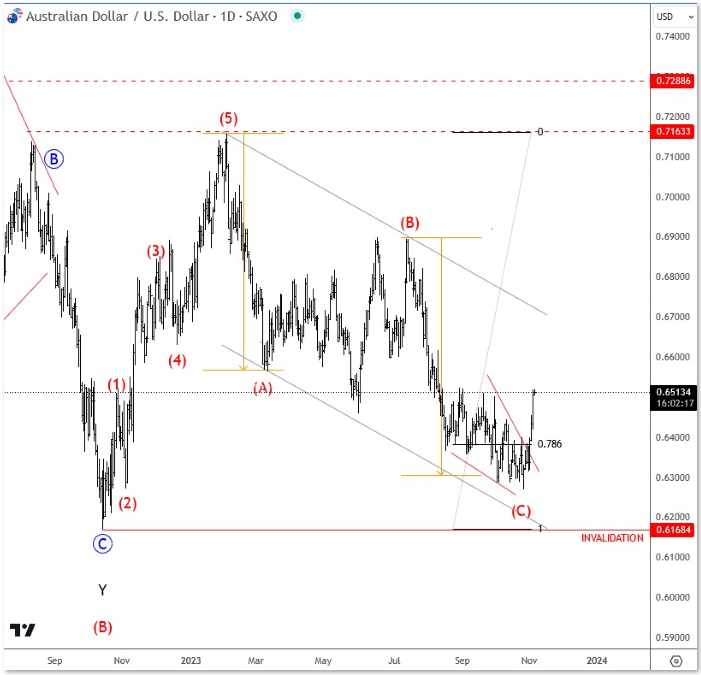
Aussie is bearish since start of the year, with a higher degree A-B-C decline that can be coming into some important support at the 78.6% Fib level shown on daily chart. In fact, notice that drop from summer highs can be already counted in five waves, a bearish trend that can be finished after recent turn-up, above the upper line of an ending diagonal. We also see a sharp rise to 0.6550 area as expected, which can be an impulse, so be aware of further strength after any near-term setback. There are also some hawkish expectations from the RBA this week, which can cause more gains for the pair, especially now when stocks are also in risk-on mode.
Oil Remains Outside of the Global Risk Rally
The excellent combo of lower-than-expected US NFP, weaker-than-expected wages growth and the unemployment rate at an almost two-year high sent another wave of optimism to the financial markets on Friday that the Federal Reserve (Fed) is done hiking the interest rates. Plus, a combined 100’000 downside revision to August and September numbers came as an indication that the job creation in the late summer wasn’t as strong as it was previously revealed. All the key metrics now suggest that the US jobs market is cooling, and that the Fed’s aggressive tightening campaign is finally giving the expected, loosening result. That should help keep inflation on track for further easing to the Fed’s 2% policy goal. And with a little bit of chance, without pushing the US economy into recession.
As such, the Fed is now expected to start cutting rates by June and cut by 100bp before next year ends. Combined with an early optimism that the US Treasury will borrow less than previously thought this quarter, the US bond market is on fire. The US 2-year yield fell to 4.85% last Friday, the 10-year yield shortly fell below 4.50%, and the 30-year bond dipped below 4.70%.
All this is great, but if the bond markets decide to go faster than the music, the US financial conditions would be relaxed too fast too soon, and the latter would bring the Fed back to a hawkish stance. Therefore, the rally in US bonds market should gently slow down into this week.
Risk rally
The US equities roared after three months of struggle. The S&P500 jumped almost 6% last week and recorded its best week since the beginning of the year. The VIX index plunged below the 15 mark and the US dollar slid the most since July and sank below its 50-DMA, triggering a beautiful rally in major pairs. The EURUSD flirted with 1.0750 even though the European economies are stagnating, and inflation fell to a 2-year low – giving the European Central Bank (ECB) doves plenty of reason to remain confident about the end of the hiking cycle in the Eurozone. Cable rallied to 1.2390, even though the Bank of England (BoE) projections, released a day before the US jobs data, weren’t painting a sunny picture for the British economy. The USDJPY fell below the 150 mark, as the US jobs data came to the rescue of the desperate Japanese yen, which got severely hit by yet another dovish policy announcement from the Bank of Japan (BoJ) two weeks ago, and the AUDUSD jumped to its 100-DMA and could extend rally if, as expected, the Reserve Bank of Australia (RBA) delivers a 25-bp hike tomorrow for the first time in 5 months, and say that the rates will remain high for a year to bring inflation to target, which may not happen easily given the ongoing strength of the economy and ultra-low unemployment.
What’s up with Oil?
In summary, bonds are up, yields are down, equities are up, the US dollar is down, and the major currencies are up as a result of a broad-based rally in the US bonds market. But interestingly, there is one kid in that party room that’s less cheery than the others and that’s crude oil. Normally, you would’ve expected the dovish Fed expectations, the lower dollar, and a global risk rally to boost sentiment in oil. Yet crude oil remained under pressure on Friday and tested the $80pb to the downside. Rising tensions in Gaza, the news that Israel encircled Gaza city and the headlines that Saudi and Russia will stick to their planned oil cuts despite the Middle East tensions haven’t done much to bring the oil bulls back to the market this Monday.
Yet, Saudi and Russia reiterated this weekend that they will keep their production curbs in place until the end of the year. Saudi will continue to pump 1-mio barrels less per day and Moscow will export 300’000 barrels less per day. The IEA still believes that a broader conflict in the Middle East could bring Saudi to revise its production plans, but economists at Bloomberg now say that Saudi may need oil prices to rise to $100pb to fund expensive projects including the futuristic city of Neom and finance the purchase of high-profile footballers and golfers. If that means that the world must suffer a deeper energy crisis, high inflation and poverty, be it! But even though the Saudis will put all their weight to keep oil prices above the $80pbnand rising (and saying that they will extend production curbs into next year should be enough to get the bears to their knees), the morose economic outlook and weak manufacturing data across the globe will likely limit gains before we get close to that well-wished $100pb level.
Risk Sentiment Recovers Ahead of a Quiet Data Week
Market movers today
Today will be a quiet day on the data front with no market movers except some tier-2 data points from the Sentix investor confidence indicator in the euro area and service PMIs in Italy and Spain.
The entire week is also thin on data releases with no market movers in the euro area and only tier-2 data in the US. Focus will be on Fed commentaries after last week's meeting and the University of Michigan survey on Friday. From China, we receive CPI figures on Thursday while Tuesday brings wage data from Japan. On Friday, UK GDP figures are due. The Reserve Bank of Australia meeting on Tuesday will be interesting as markets are pricing a 55% probability of a hike.
The 60 second overview
US: The October Jobs Report fell short of expectations, as non-farm payrolls grew by only 150k (consensus +180k, September revised down to 297k). While the UAW's strike might have affected the figures negatively (with manufacturing employment dropping by 35k), overall the report illustrated cooling labour markets. The household survey showed a 346k decline in the number of employed workers, which lifted the unemployment rate to 3.9% (from 3.8%). With slack slowly building into the labour market, average hourly earnings growth remained modest at only 0.2% m/m SA. The Fed's Barkin, Kashkari and Bostic all welcomed signs of better balanced labour markets after the release, and UST yields edged lower on the day. We still foresee further downside potential in long-end yields towards 2024 and expect US economic momentum to fade going forward, read our reflections on last week's events and long-term view from Research US - Bond yields headed lower towards 2024, 3 November.
Israel-Hamas war: International pressure for finding a ceasefire solution in the war between Israel and Hamas appears to be rising as civilian casualties mount. US Secretary of State Blinken visited the West Bank on Sunday to discuss with Palestinian Authority President Abbas as well as foreign ministers from Qatar, Saudi Arabia, Egypt, Jordan and UAE, and will meet with Turkey's foreign minister later today (see Reuters). US and Israeli defence ministers discussed the issue yesterday, and US Vice President Harris will lead a call discussing humanitarian aid to Gaza today. That said, a near-term solution appears elusive, as Netanyahu continued to emphasize that 'there will be no ceasefire without the return of the hostages'. There were also strikes at both sides of the border against southern Lebanon over the weekend, as tensions between Israel and Hezbollah continue to build. That said, Hezbollah leader Nasrallah did not announce the terrorist organization fully joining the war in his speech on Friday.
Equities: Equities rallied again on Friday as cooling job data soothed inflation- and yields fear. S&P 500 jumped another 0.9% and small cap Russell 2000 a full 2.7%. This takes the latter a full 8% higher for the week and S&P 500 +6%. This is the strongest US weekly gain in a year. Europe and Nordics a tad weaker though, up 3% for the week, so expect catch-up during the day. Outperformers were the same as during the week. Real estate up 9% for the week, banks +7% (and especially regional banks +12%), and consumer discretionary +7%. Financing candidates were found in defensive sectors, such as energy or consumer staples.
FI: 10Y US Treasury yields bounced back a bit after the initial rally on the back of the US labour market data and closed at 4.58% after having dipped below 4.5% on Friday. However, as the Federal Reserve is done hiking for now, 5% seems to be the top for 10Y Treasury yields and we should expect that the steepening of the yield curve should continue, but more from the short-end rather than the bearish steepening we have seen so far. Hence, the significant rise in the term premium on the 10Y US treasury yield we have seen so far should also decline.
FX: Bad news was good news for market sentiment on Friday and bad news for the USD. The weak jobs report sent EUR/USD above 1.07 and USD/JPY below 150. It also weighed on EUR/SEK and EUR/DKK, while EUR/NOK was largely unaffected.
Credit: Credit markets had yet another day of solid performance with iTraxx Xover tightening 6bp and Main almost 2bp, thus bringing both indices to their tightest since mid-September.
AUD/USD Daily Report
Daily Pivots: (S1) 0.6449; (P) 0.6484; (R1) 0.6547; More...
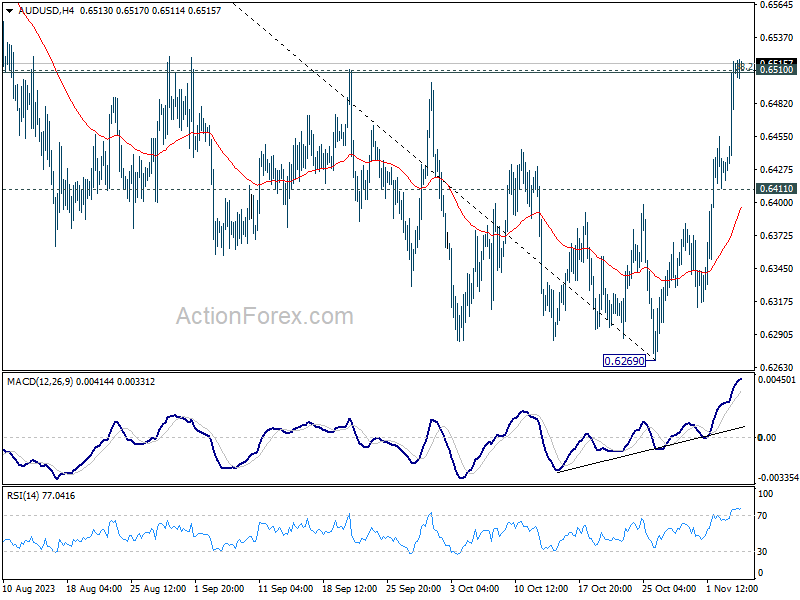
Intraday bias in AUD/USD remains on the upside for the moment. Sustained break of 0.6510 cluster resistance (38.2% retracement of 0.6894 to 0.6269 at 0.6508) will argue that whole decline from 0.7156 might be completed with three waves down to 0.6269. Stronger rally should then be seen to medium term trend line resistance (now at 0.6708). Meanwhile, rejection by 0.6510 will retain near term bearishness.
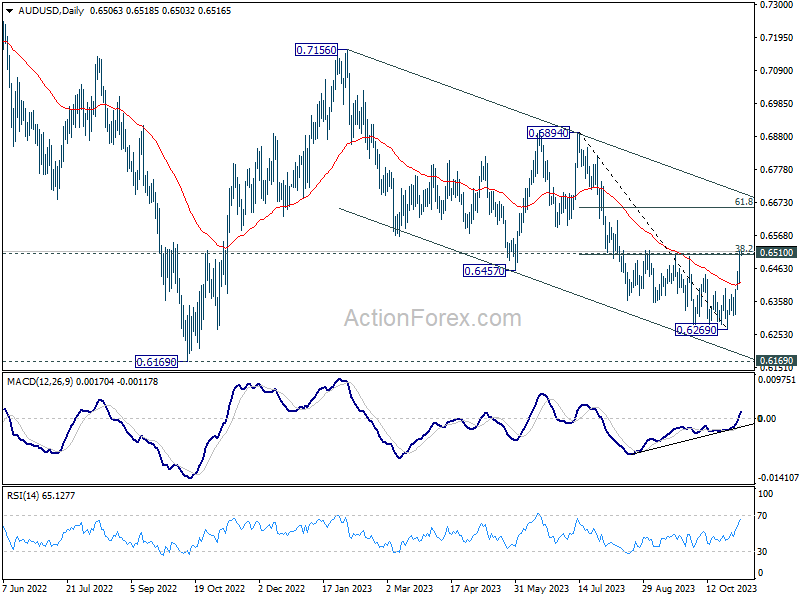
In the bigger picture, there is no confirmation that down trend from 0.8006 (2021 high) has completed. While current rebound from 0.6269 might extend higher, it could be the third leg of a corrective pattern from 0.6169 (2022 low) only. For now, medium term bearishness will remain as long as 0.6894 resistance holds.
USD/CAD Daily Outlook
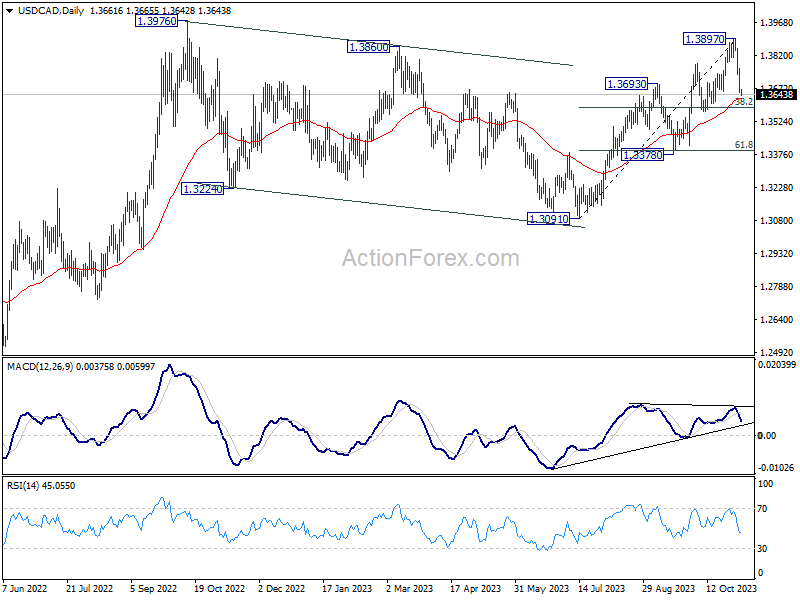
Daily Pivots: (S1) 1.3620; (P) 1.3690; (R1) 1.3728; More...
Intraday bias in USD/CAD remains on the downside for 8.2% retracement of 1.3091 to 1.3897 at 1.3589. Strong support should be seen there to bring rebound. On the upside, above 1.3759 minor resistance will bring retest of 1.3897. However, sustained break of 1.3589 will bring deeper fall to 61.8% retracement at 1.3399 instead.
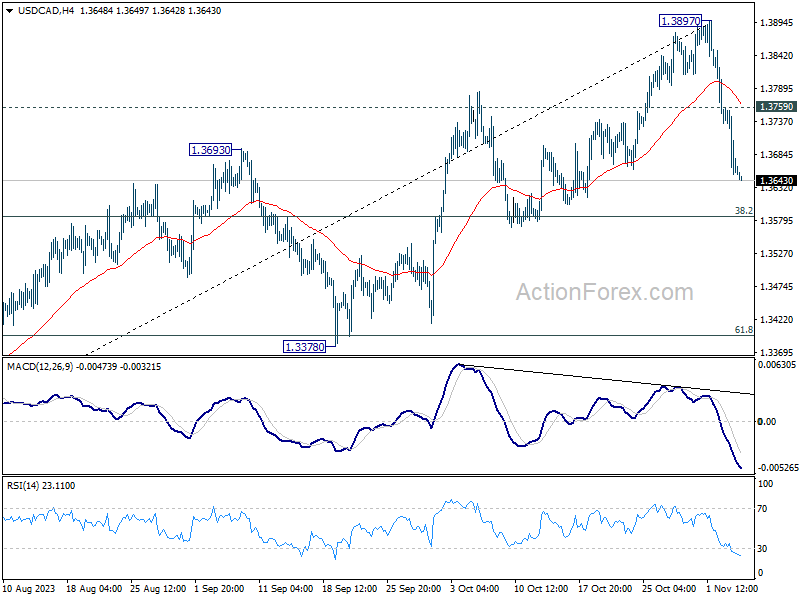
In the bigger picture, corrective pattern from 1.3976 (2022 high) should have completed with three waves down to 1.3091. Decisive break of 1.3976 high will confirm resumption of up trend from 1.2005 (2021 low). This will now remain the favored case as long as 1.3378 support holds. However, firm break of 1.3378 will argue that the pattern from 1.3976 is indeed still extending.
USD/JPY Daily Outlook
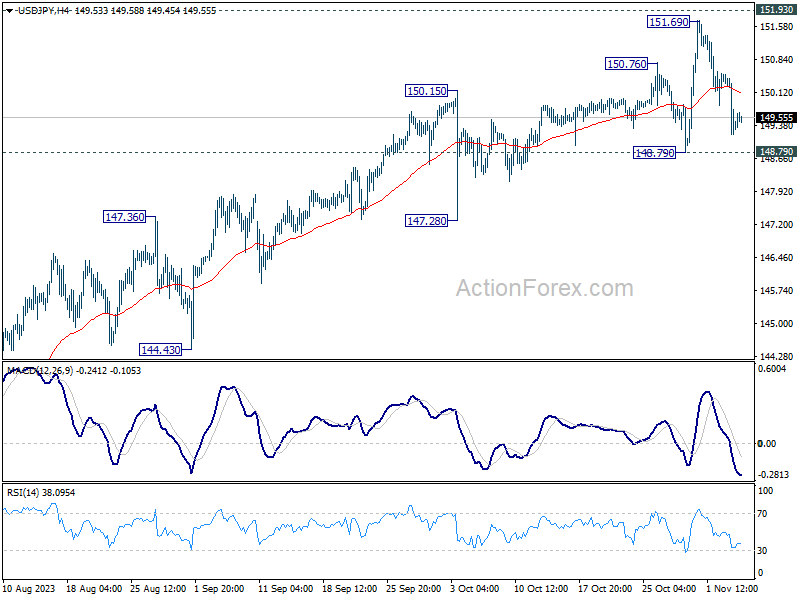
Daily Pivots: (S1) 149.89; (P) 150.43; (R1) 151.02; More...
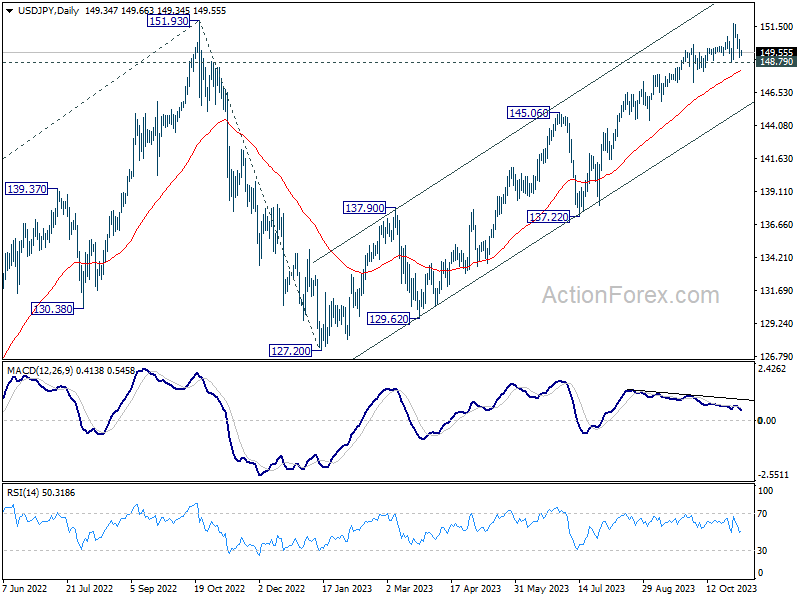
Intraday bias in USD/JPY remains neutral for the moment. Price actions from 151.69 could still be seen as a consolidation pattern only. However, firm break of 148.79 will indicate rejection by 151.93 key resistance, and bring deeper fall through 147.28 support.
In the bigger picture, immediate focus is now on 151.93 resistance (2022 high). Rejection by 151.93, followed by sustained break of 145.06 resistance turned support will argue that rise from 127.20 has completed, and turn outlook bearish for 137.22 support and below. However, sustained break of 151.93 will confirm resumption of long term up trend. Next target will be 61.8% projection of 102.58 to 151.93 from 127.20 at 157.69.
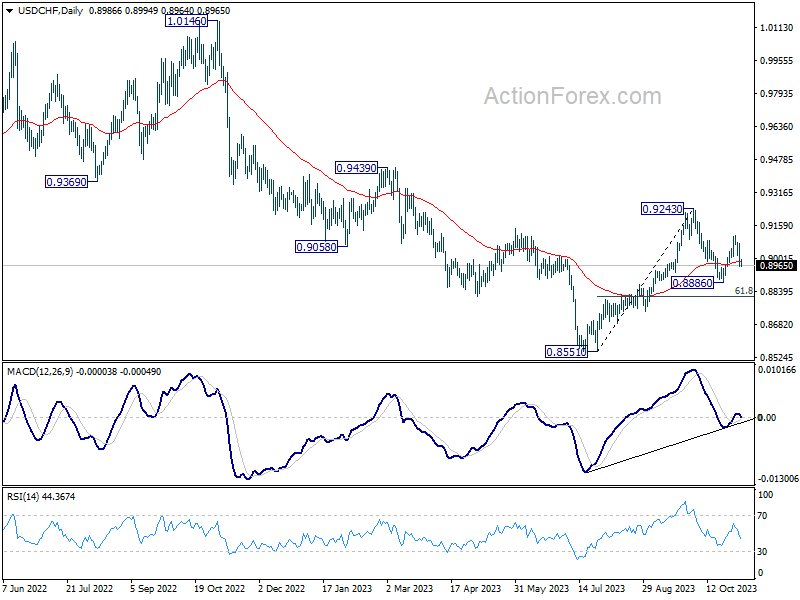
USD/CHF Daily Outlook
Daily Pivots: (S1) 0.8949; (P) 0.9011; (R1) 0.9057; More....
Intraday bias in USD/CHF remains on the downside for 0.8886 support first. Break there will resume whole decline from 0.9243 to 0.8815 fibonacci support. For now, risk will be on the downside as long as 0.9111 resistance holds, in case of recovery.
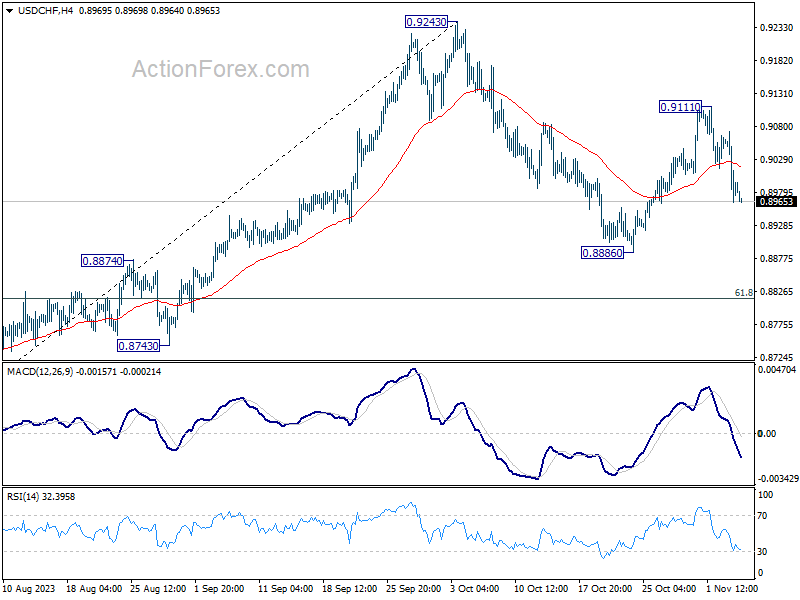
In the bigger picture, outlook is mixed up by the deeper than expected pull back from 0.9243. Yet there was no follow through selling after hitting 0.8886. On the upside, break of 0.9243 resistance will revive the case of medium term bottoming at 0.8851, and turn outlook bullish. However, sustained break of 61.8% retracement of 0.8551 to 0.9243 at 0.8815 will argue that larger decline from 1.0146 is ready to resume through 0.8551 low.