Sample Category Title
Bitcoin Cools After Rally Signals End of Crypto Winter
Market picture
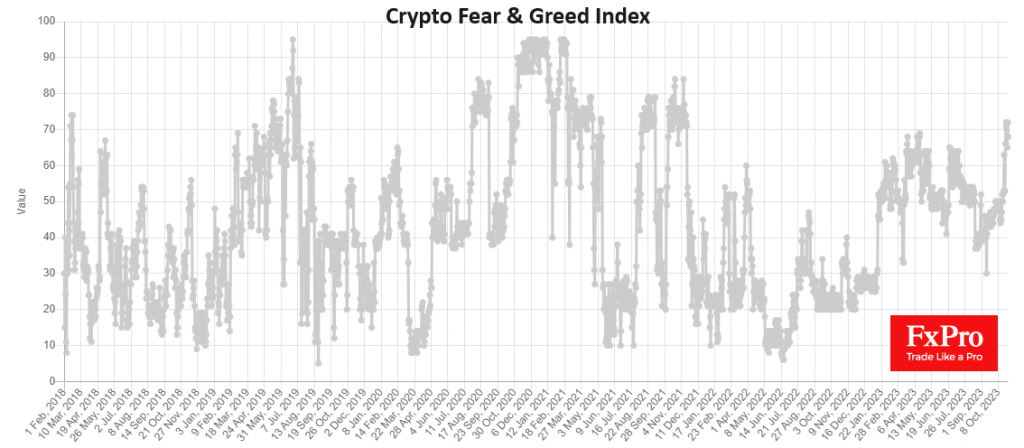
The crypto market continues to settle at the levels it broke through at the beginning of last week. At the start of the day on Monday, the crypto market capitalisation was 7.7% higher than seven days ago, largely thanks to Bitcoin. Greed is dominating the crypto market, according to the Crypto Fear and Greed Index, which spent the second half of last week above 70 – its highest since November 2021. However, prices remain well below the levels at that time.
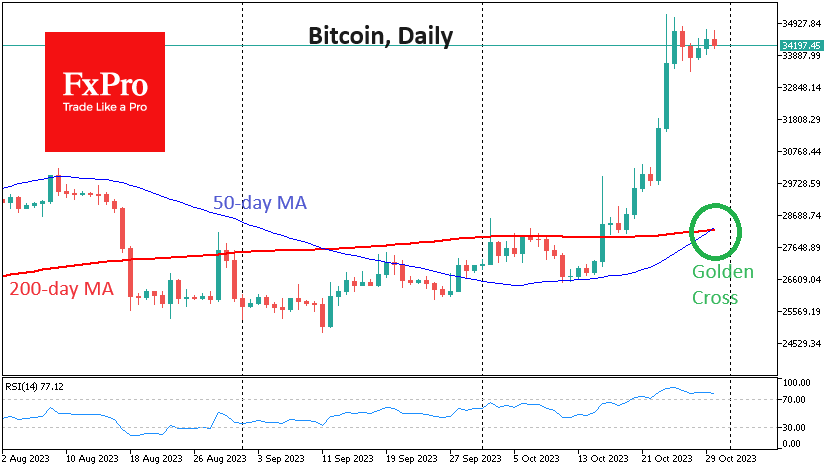
Bitcoin is up over 11% in seven days but has mostly traded between $34.8-35.8K since Tuesday, after hitting highs in May last year. Technically, last week was a bullish signal as Bitcoin managed to move further into the 200-week moving average, which looks like a promising comeback after crypto winter.
A “golden cross” has formed on the daily timeframes, which could further boost bullish confidence by creating a short-term flow of buyers following these popular signals.
According to CCData, total assets under management (AUM) for digital asset-based investment products rose 6.74% to $31.7 billion in October, with bitcoin fund AUM increasing 11.1% to $23.2 billion. Instruments based on the former cryptocurrency hold 73.3% of the market, up from 70.5% a month earlier.
News background
Spain announced its intention to double the speed of implementing the cryptocurrency regulation MiCA law to finish it by the end of 2025.
The Ethereum development team postponed the release of the Dencun security update until next year. This was due to disagreements that arose between the designers of the consensus-level and execution-level clients.
According to Bloomberg, the fortune of Changpeng Zhao, Binance’s head, fell by 82% to $17.3 billion from a peak of $96.6 billion in January 2022.
Reports of phishing emails have surfaced online among users of Trezor hardware cryptocurrency wallets. Users have speculated about data leaks from the wallet maker or UK-based delivery company Evri.
Offchain Labs, the company behind the L2 protocol Arbitrum, has opened access to the Orbit software stack to create layer three blockchains on the main network.
Price of Oil in Tense Anticipation
Monday's opening came without any surprises. Despite the news that the Israeli army is moving to a new phase of the operation in Gaza, the price of Brent oil did not change much, trading started around the middle of the Friday candle.
The chart shows that the price of Brent oil has fluctuated between USD 86.60 and USD 89.10 since October 24th. At the same time, the MACD indicator shrank near the zero line, which is typical for flat markets. However, it can hardly be said that bidders are calm.
On the one hand, they are closely monitoring news from the Middle East, where escalation could provoke supply disruptions and sharply increase the price of oil. On Sunday, US national security adviser Jake Sullivan said the US sees an increased risk of the conflict spreading to other parts of the Middle East region.
On the other hand, the Federal Reserve is expected to make a decision on interest rates this week. The event is scheduled for Wednesday evening, and it can greatly change the current balance of supply and demand.
The basis of the plan for the week can be the expectation of an impulse with the price leaving the specified range (similar to the inside bar strategy), which can develop into a new significant trend.
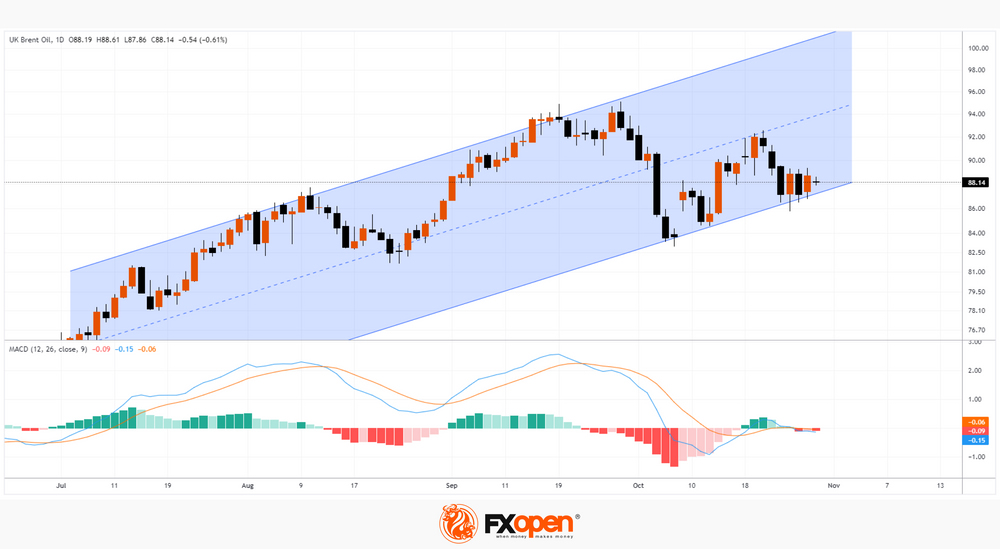
In this case, if the price goes out of the range:
→ in the upward direction will mean an attack by the bulls on the psychological level of USD 90;
→ in a downward direction will mean an attempt to break through an important ascending channel (shown in blue);
→ since the level of emotional stress is high, it can be assumed that the market is especially vulnerable to false movements.
This article represents the opinion of the Companies operating under the FXOpen brand only. It is not to be construed as an offer, solicitation, or recommendation with respect to products and services provided by the Companies operating under the FXOpen brand, nor is it to be considered financial advice.
GBP/USD Remains At Risk While EUR/GBP Turns Green
GBP/USD started a fresh decline from the 1.2285 resistance zone. EUR/GBP is rising and might climb above the 0.8720 resistance.
Important Takeaways for GBP/USD and EUR/GBP Analysis Today
- The British Pound is showing bearish signs below the 1.2200 support.
- There is a key contracting triangle forming with resistance near 1.2155 on the hourly chart of GBP/USD at FXOpen.
- EUR/GBP is gaining pace and trading above the 0.8700 zone.
- There is a major contracting triangle forming with resistance near 0.8720 on the hourly chart at FXOpen.
GBP/USD Technical Analysis
On the hourly chart of GBP/USD at FXOpen, the pair attempted a fresh increase above 1.2200, as discussed in the previous analysis. However, the British Pound failed above 1.2285 and started a fresh decline against the US Dollar.
There was a clear move below 1.2200 and the 50-hour simple moving average. The bears pushed the pair 1.2155. Finally, there was a spike below the 1.2110 support zone. A low was formed near 1.2069 and the pair is now consolidating losses.
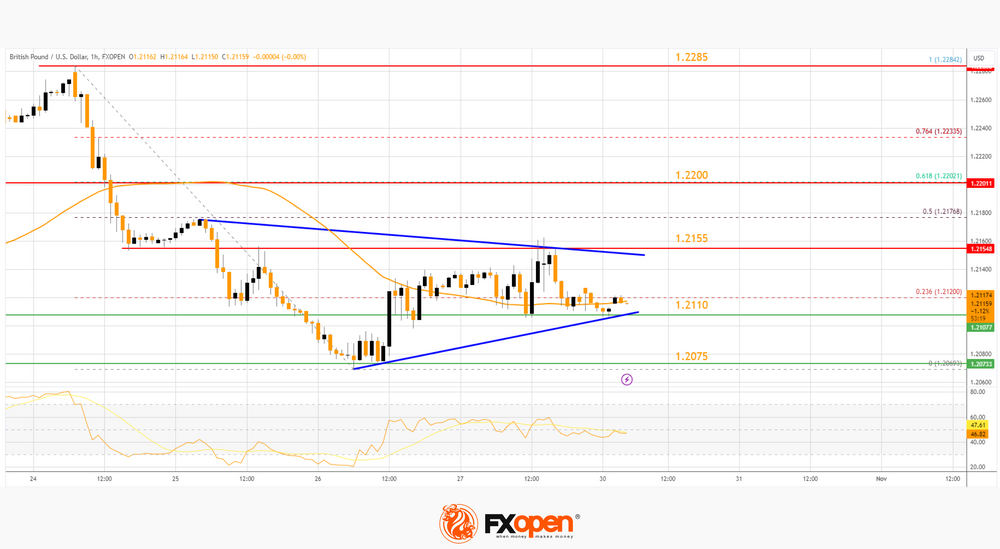
There was a minor move above the 50-hour simple moving average and the 23.6% Fib retracement level of the downward move from the 1.2284 swing high to the 1.2069 low.
On the upside, the GBP/USD chart indicates that the pair is facing resistance near a key contracting triangle at 1.2155. The next major resistance is near the 61.8% Fib retracement level of the downward move from the 1.2284 swing high to the 1.2069 low at 1.2200.
A close above the 1.2200 resistance zone could open the doors for a move toward 1.2285. Any more gains might send GBP/USD toward 1.2350.
On the downside, there is a key support forming near 1.2110. If there is a downside break below the 1.2110 support, the pair could accelerate lower. The next major support is near the 1.2075 zone, below which the pair could test 1.2020. Any more losses could lead the pair toward the 1.2000 support.
EUR/GBP Technical Analysis
On the hourly chart of EUR/GBP at FXOpen, the pair started a decent increase from the 0.8680 zone. The Euro traded above the 0.8700 pivot level to enter a positive zone against the British Pound.
The pair settled above the 50-hour simple moving average and the 50% Fib retracement level of the downward move from the 0.8734 swing high to the 0.8691 low. The EUR/GBP chart suggests that the pair is facing resistance near the 0.8720 zone.
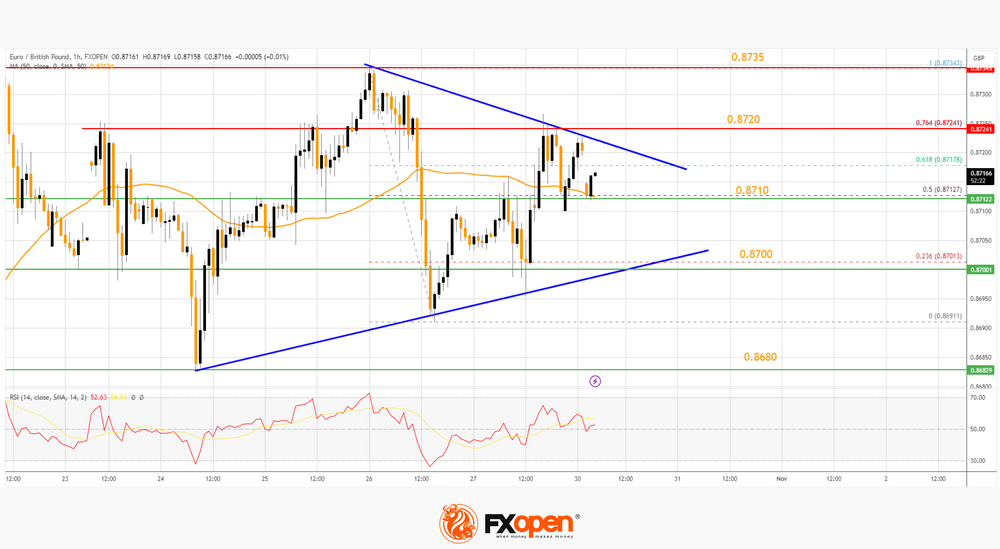
There is also a major contracting triangle forming with resistance near 0.8720. It is close to the 76.4% Fib retracement level of the downward move from the 0.8734 swing high to the 0.8691 low.
A close above the 0.8720 level might accelerate gains. In the stated case, the bulls may perhaps aim for a test of 0.8750. Any more gains might send the pair toward the 0.8785 level. If not, there might be a downside correction.
Immediate support sits near the 50-hour simple moving average at 0.8710. The next major support is at 0.8700. A downside break below the 0.8700 support might call for more downsides.
In the stated case, the pair could drop toward the 0.8680 support level. Any more losses might call for an extended drop toward the 0.8650 pivot zone.
Trade global forex with the Innovative Broker of 2022*. Choose from 50+ forex markets 24/5. Open your FXOpen account now or learn more about trading forex with FXOpen.
* FXOpen International, Innovative Broker of 2022, according to the IAFT
This article represents the opinion of the Companies operating under the FXOpen brand only. It is not to be construed as an offer, solicitation, or recommendation with respect to products and services provided by the Companies operating under the FXOpen brand, nor is it to be considered financial advice.
Silver (XAGUSD) Found Buyers After Elliott Wave Double Three Pattern
Hello fellow traders. In this technical article we’re going to take a look at the Elliott Wave charts charts of Silver (XAGUSD) published in members area of the website. As our members know Silver has recently made pull back that has unfolded as Elliott Wave Double Three Pattern. It made clear 7 swings from the May 4th peak and completed correction right at the Equal Legs zone ( Blue Box Area) . In further text we’re going to explain the Elliott Wave pattern and forecast
Before we take a look at the real market example, let’s explain Elliott Wave Double Three pattern.
Elliott Wave Double Three Pattern
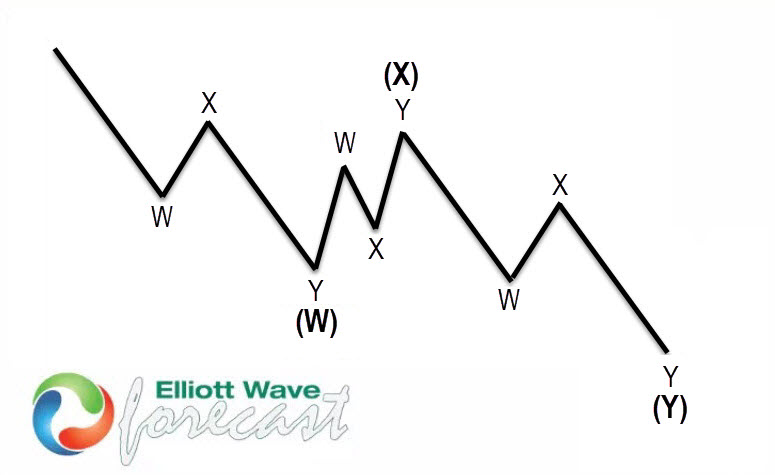
Double three is the common pattern in the market , also known as 7 swing structure. It’s a reliable pattern which is giving us good trading entries with clearly defined invalidation levels.
The picture below presents what Elliott Wave Double Three pattern looks like. It has (W),(X),(Y) labeling and 3,3,3 inner structure, which means all of these 3 legs are corrective sequences. Each (W) and (Y) are made of 3 swings , they’re having A,B,C structure in lower degree, or alternatively they can have W,X,Y labeling.
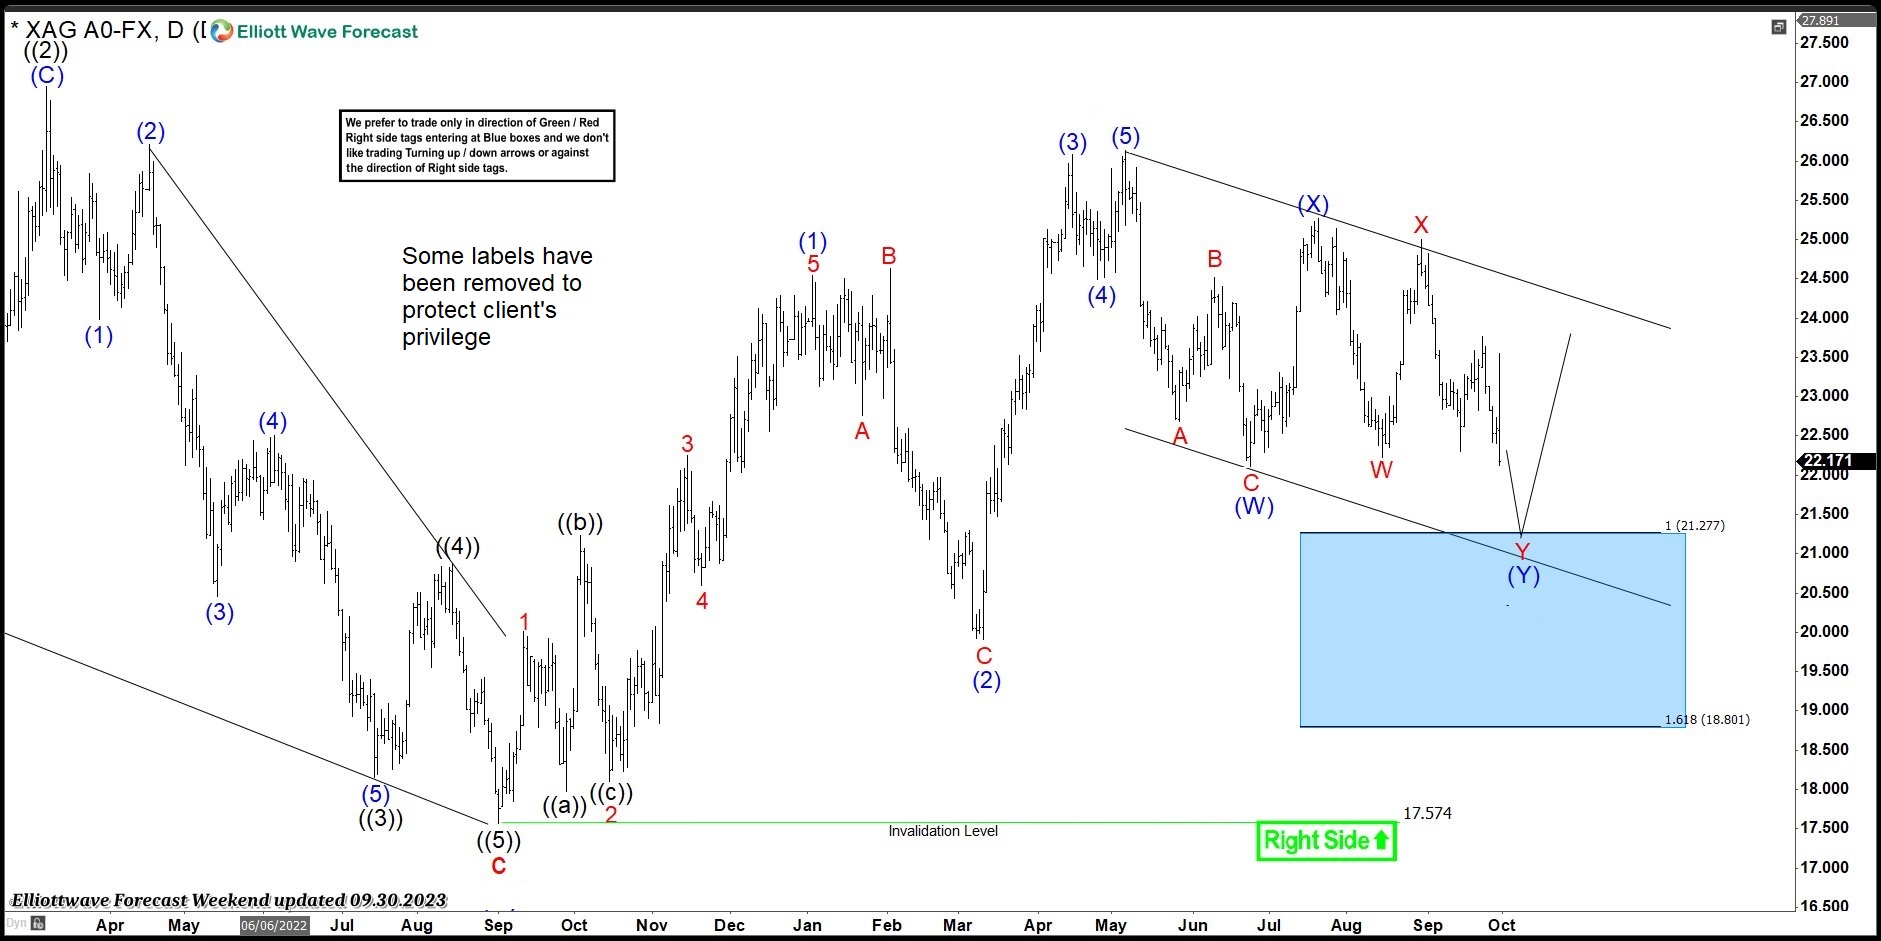
Silver XAGUSD Elliott Wave Daily Chart 09.30.2023
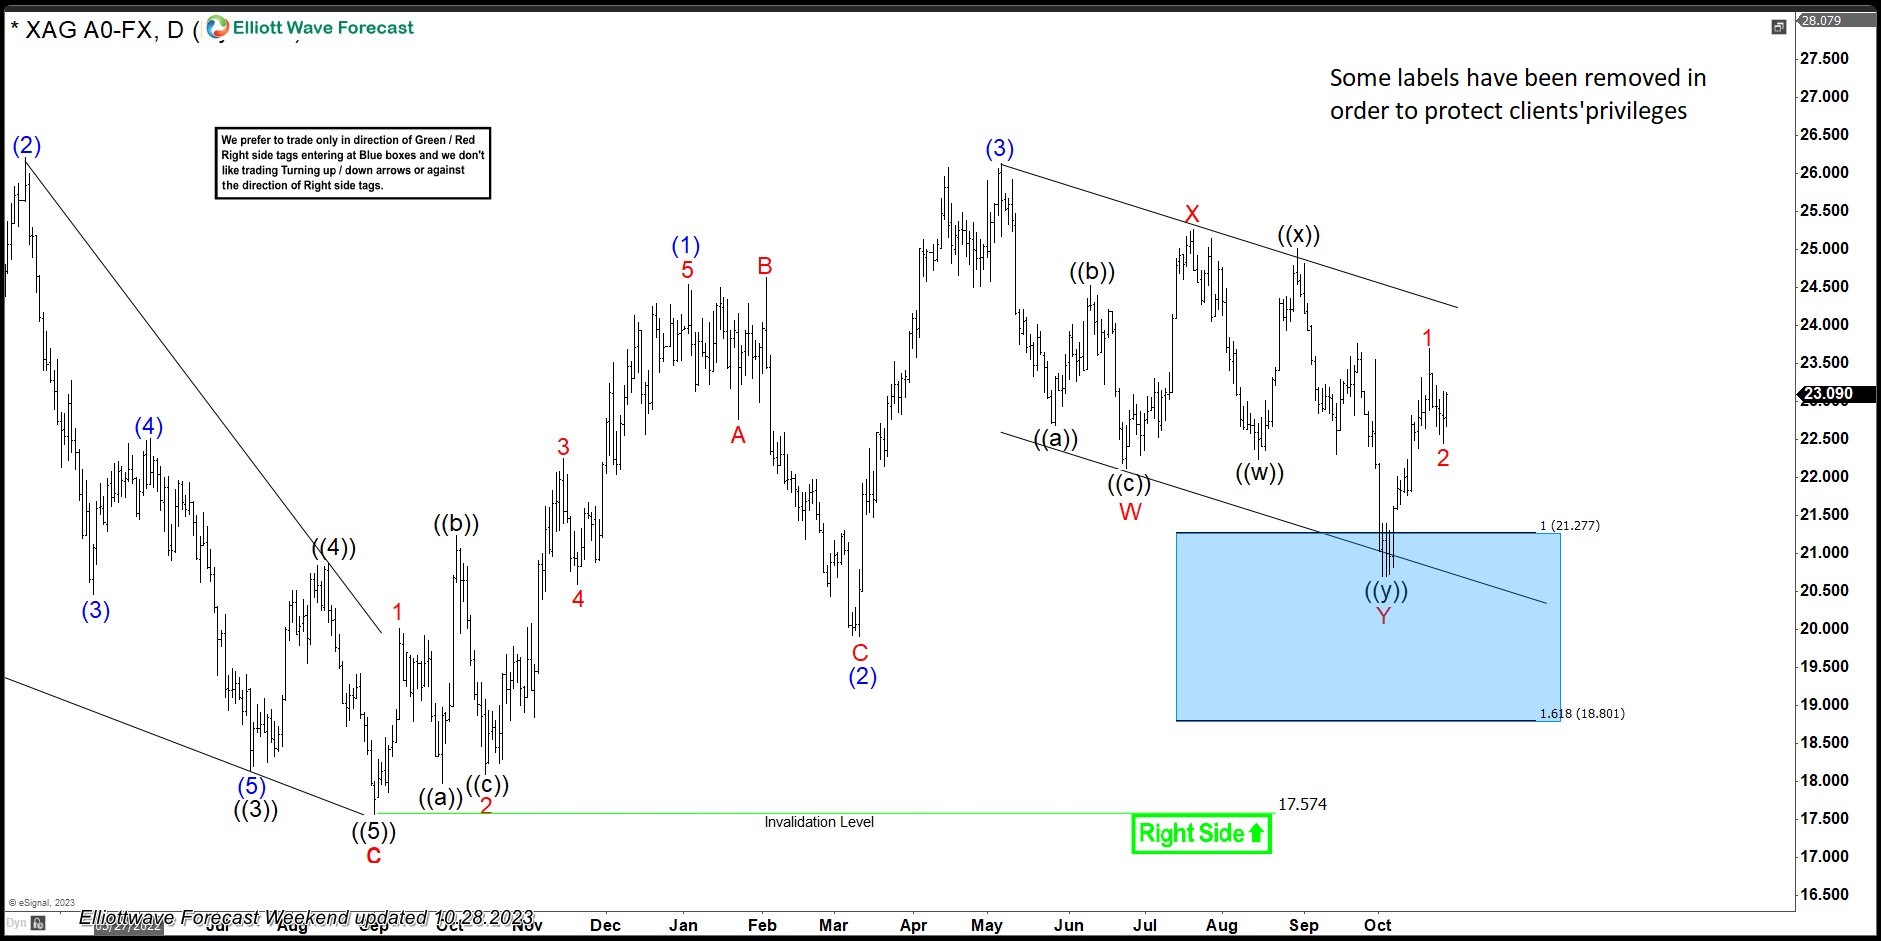
Silver is doing correction that is unfolding as a 7 swings pattern. Pull back has (W)(X)(Y) blue labeling. First leg (W) is having Zig Zag Structure – 3 waves ABC red, while (Y) leg is WXY Double Three Pattern. The structure is still incomplete at the moment. We expect to see another leg down toward extreme area: 21.27-18.8 blue box ( buying zone). Once Silver reaches proposed extreme zone, we expect the commodity to make a rally toward new highs or in 3 waves bounce alternatively. We don’t like selling and preferring the long side from the Blue Box Area. Once the price reaches 50 fibs against the (X) blue high, we will make long positions risk free (put SL at BE) and take the partial profits.
Silver XAGUSD Elliott Wave Daily Chart 10.28.2023
Silver found buyers at the Blue Box Area as expected. The commodity made nice rally from the Buying Zone and made 5 waves up from the 20.66 low. Bounce already reached 50 fibs against the (X) blue connector which confirms cycle from the peak is done for sure. Consequently, any long positions from the equal legs area should be risk free by now. As far as the price stays above 20.66 low, we can see further strength in the commodity.
Swiss KOF ticked down to 95.8, stable but underwhelming
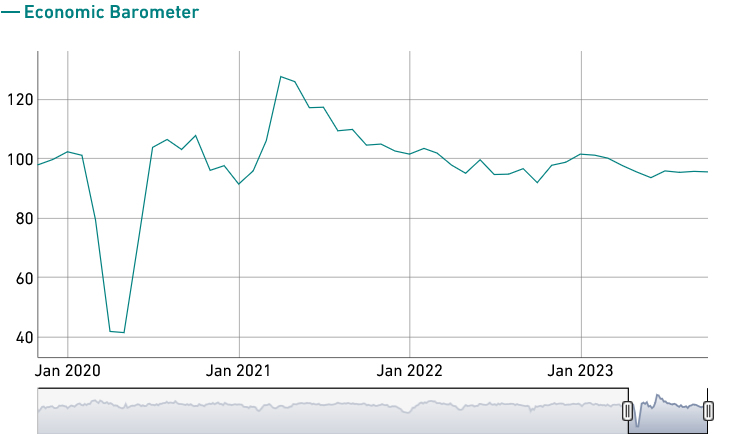
Swiss KOF Economic Barometer demonstrated a minor dip, decreasing by -0.1 to settle at 95.8 in September. This figure modestly surpassed the expected mark of 95.6, indicating a slightly more favorable scenario than anticipated.
However, this marginal decrease also reflects that Barometer is continuing its trend of hovering just below the long-term average. The KOF (Swiss Economic Institute) elaborated on this trend, noting that "together with the small movements of the Barometer since the summer, this indicates a weak but stable development of the Swiss economy towards the end of this year."
KOF pointed out that "the slight decline is primarily attributable to bundles of indicators from the manufacturing sector and to indicators concerning foreign demand."
It's not all subdued tones. KOF also highlighted some positive aspects, stating, "Indicators from the finance and insurance sector and the hospitality sector are sending positive signals."
US Treasury Quarterly Refunding Statement This Week’s Biggest Wildcard
Markets
There’s a huge week in front of us in terms of central bank meetings, eco data, geopolitics and supply. Starting off with central banks, the Bank of Japan (Tuesday), Fed (Wednesday) and Bank of England (Thursday) convene. Last week’s temporary break of USD/JPY above the 150 mark suggests that the BoJ meets at gunpoint. Rumours in the run-up to the meeting about upward revisions to inflation forecasts (>=2% for fiscal year 2023 & 2024) and about further loosening its Yield Curve Control policy further underline expectations that a next step in the policy normalization should/will be taken. If not, the Japanese yen risks sliding at a pace no FX intervention can call an immediate end to. The Japanese 10-y bond yield this morning touched 0.9% for the first time in over a decade, coming narrowly close to the current maximum (100 bps) deviation around the 0% yield target. The US Federal Reserve will skip on hiking its policy rate for a second meeting straight. US economic data since the September Fed meeting scream for the final (flagged) hike because of way better-than-expected growth data, but Fed-governors joined forces to downplay such action as the yield increase at the long end of the curve (tightening of financial conditions) substitutes for such move. We believe that Fed chair Powell will keep the option open for December (currently 20% market implied probability) or risk a further increase in inflation expectations which since that same Fed talk rose to match the (March) YTD high at 2.5%. The US 2-yr yield is at risk of losing the 5% mark in case of a dovish skip (not our preferred scenario). The Bank of England is expected to deliver a dovish hold with its new Monetary Policy Report likely to paint a very bleak economic outlook (high recession risk; rising unemployment). The central bank has a tendency to err on the soft, growth-supporting, side. Given that UK inflation dynamics are still worse off than in EMU or US, this combination risks backfiring via GBP-weakness. Last week, EUR/GBP took out first resistance around 0.87. We see more upward potential towards 0.90 by year-end. The eco calendar starts light today with only EC confidence data, but rapidly heats up: EMU CPI inflation, Q3 GDP and US consumer confidence (tomorrow), US ADP employment, JOLTS job openings and manufacturing ISM on Wednesday, US weekly jobless claims and Q3 unit labor costs on Thursday and payrolls and services ISM on Friday. Amid this complex of central bankers, figures and the intensifying Israeli-Hamas conflict, the US Treasury on Wednesday releases its quarterly refunding statement. It serves as this week’s biggest wildcard. At the previous announcement in August, the Treasury stepped up its issuance for the first time in more than two years (to $103bn refunding). A new step-up is anticipated this time around with additional focus on the means the Treasury wants to use (more bills or more long term funding).
News and views
First managing director of the IMF, Gita Gopinath, in an op-ed for the Financial Times called upon governments to restrain their fiscal spending. They acted as “insurers of first resort” in response to Covid and the energy crisis but this added a heavy burden on already high levels of debt. Many challenges lie ahead including large ageing-related spending needs for advanced economies and sizeable public investment for developing countries. Combined with a rise in defense spending, the resurgence of industrial policies with expensive price tags (ie deglobalization and subsidization) and climate-related investment, she estimates additional spending over current levels could surpass 7-8% by 2030. “With record-high debt levels, higher for longer interest rates, and growth prospects at their weakest in two decades, restraint is required.” Standing at the center of global finance, Gopinath singled out the US to put its fiscal house in order but others should heed the IMF’s advice as well. In what we dub as “The fiscal reset”, Gopinath said governments can no longer be insurer of first resort for all shocks. Depleted fiscal buffers must be rebuilt and enlarged. Any future response to shocks should be better targeted and temporary. Second: revenues need to keep up with spending. A minimum corporate tax is advisable while tax loopholes must be closed. Carbon pricing must also be on the table as both a catalysator and funding measure for the climate transition. Lastly, Gopinath said fiscal frameworks need strengthening. Many countries have regulation in place but deviations from them are the rule rather than the exception. Debt containment requires credible plans that are better aligned with annual budgets and anchored on spending targets.
Mixed Q3 Results, Middle East Tensions Weigh on Appetite
The US economy grew 4.9% in Q3, the durable goods orders rose nearly 5% in September, the Federal Reserve’s (Fed) favourite inflation gauge, the PCE index, came in higher than expected, as personal spending jumped 0.7% during the same month. The only thing that did not increase was personal income. US Treasury Janet Yellen thinks that the latest growth number is not sustainable, and but that the strong data – and not the worsening fiscal outlook is the reason which pushes the US yields higher. Happily, though, last week saw the selloff in long-term US sovereign bonds slow down. The US 10-year yield peaked at 5% and fell below this psychological level, the US 2-year yield is testing the 5% level to the downside. The Fed is expected to maintain the interest rates unchanged when it meets this week, after the European Central Bank (ECB) decided not to hike its rates last week. Expectation for the December Fed meeting remains a no change as well. Appetite for the US dollar remains limited despite the strong economic data, while safe haven inflows toward gold gain momentum, as Israel intensified its ground attack in Gaza, pushing the price of an ounce above the $2000 per ounce level on Friday. The yellow metal has recently stepped into the overbought market territory, yet further escalation of tensions in the Middle East should keep appetite strong. The next natural target for gold stands near the $2080 level, the all-time-high.
In the energy space, oil prices fell last week, and US crude is exchanged below the $85pb level this morning. Israel bombed targets in neighboring countries and send troops and tanks into Northern Gaza, but it avoids a massive ground invasion, for now, and the expectation for a long battle keep appetite in energy investments limited. This being said, the visibility is low, and there is risk of sudden jumps on supply disruption remains high. Oil prices are expected to fluctuate between the $80/90 range. Below $80pb, the limited supply should keep demand intact, above $90pb, the expectation for waning global demand should keep the price pressure contained.
In equities, the lack of investor appetite, mixed results from Big Tech companies, and disappointing results from the Big Oil companies further weighed on the S&P500 last week. The index fell in 4 out of 5 sessions and retreated more than 2.50% during the course of last week. We are now well below the 200-DMA and below the major 38.2% Fibonacci retracement, which stands near the 4180 level, and which indicates that the S&P500 has stepped into the medium-term bearish consolidation zone. And even though the RSI indicator warns of oversold market conditions, which could temporarily slow down the equity selloff, the way is now open for a deeper fall toward the 4050 level, especially if the earnings don’t fully satisfy investors.
On the political front, the odds of US government shut down is lower with a new House Speaker in the US, but the US government is still given around 20-30% probability to stop functioning last month. That could keep appetite in the US dollar limited.
Besides the Fed, the Bank of Japan (BoJ) and the Bank of England (BoE) will announce their latest policy decisions this week and they are both expected to keep rates unchanged, but the recent jump in Tokyo inflation keeps investors very, very much uncomfortably regarding the BoJ’s insistence about its ultra-loose and inappropriate policy. A rise in the USDJPY above the 150 level seems little likely with direct intervention expected from Japanese authorities to cool down any further selloff.
Central Bank Week
Market movers today
We kick the week off with German and Spanish October inflation data ahead of the euro area figures tomorrow.
In Germany, we also get the first estimate of Q3 GDP growth, where we will likely see a larger decline than the -0.1% we expect in the euro area tomorrow.
In Sweden the GDP indicator for September is being released, which will allow for a first estimate of the third quarter outcome. We are looking for a 0.3% growth in QoQ terms, but would like to remind everyone that the indicator tends to be of a very volatile nature. Later in the day governor Thedeén is talking about the "economic situation and current monetary policy" in New York at CET 18:00.
Early Tuesday, the Bank of Japan concludes a two-day policy meeting. We expect another tweak of the yield curve control this year and to us this meeting looks like the most likely one. If the BoJ decides to move tomorrow there are many ways to go. Raising the rate cap to say 1.50% could be one way. If so, they will make sure to stress that the intention is better market functioning and not a tightening move, even if both are true.
Overnight, we also get official Chinese PMIs.
Through the remainder of the week, we have many key data releases with euro inflation figures tomorrow, a bunch of important US data including the October jobs report and the FOMC meeting. We expect the Fed to remain on hold and jobs growth to cool to +180k, yet still continue illustrating solid labour market conditions.
The 60 second overview
War between Israel and Hamas. After Israeli army raid into Gaza last week, Israel has widened its ground offensive in the Gaza region by sending troops and tanks into the northern territory of Gaza. Israel's Prime Minister Netanyahu declared it "the second stage of war" and has urged Palestinians living in the north to evacuate to the south. According to officials, the second stage is expected to last "months". With civilian causalities rising, so has international concern, which has led US president Biden to emphasise the need to "immediately and significantly increase the flow of humanitarian assistance"
Central bank week. On Wednesday, we expect the Fed to remain on hold in line with consensus and market expectations, and look for no further hikes at a later stage either. On Thursday, we expect Norges Bank to keep the policy rate unchanged at 4.25% and to stress a data-dependent approach relative to a potential December hike. Later in the day, we expect the Bank of England to keep the Bank Rate unchanged at 5.25% on 2 November, which is in line with current market pricing. Overall, we expect the MPC to stick to its previous guidance emphasising the "higher for longer" approach.
Equities: Yields continued to set the tone for equities last week. Yields are also the reason for harsh earnings report reactions, not least in the FANMAG names. Equities were lower for the week and yields sensitive US underperformed (S&P 500 -2% lower, Stoxx 600 -0.8% lower and Nordics mixed). It was not a complete risk-off period though: Cyclicals have generally outperformed defensives over the week while growth- and quality stocks have been beaten. The small cap-sell off even stalled too. Communication, energy and health care were among the weaker sectors while materials, real estate and utilities recovered. Same dynamics followed on Friday with equities -0.5% lower. Sector performance turned around though as big tech was helped by Amazon earnings. VIX rose to 22. Asian markets are mostly lower this morning but US futures indicate an opening higher.
FI: European bond yields continued the rally on Friday with 10Y Bund declining some 2bp, the curves steepened and the 10Y Italian-German yield spread tightened modestly. In the US the curve also steepened from the short end, and this has continued in Asian trading this morning, where US Treasury yields have risen 2-4bp. This week we will get both inflation data from Europe as well as labour market data from the US. Today, Spanish and German inflation data is released.
FX: EUR/USD in wait-and-see-mode in anticipation of the Fed whilst USD/JPY is back below 150. Both EUR/SEK and EUR/NOK seems to be consolidating just shy of 11.80 waiting for the next trigger either up or down. Consolidation seems to be the theme for EUR/GBP, with the Sterling awaiting Thursday's BoE meeting.
Credit: The credit markets ended the week on a cautiously positive footing due to the slight decline in longer term rates. Itraxx main tightened 0.1bp to 89.3bp while Xover tightened 0.9bp to 469.8bp. The overall cautious markets with still weak liquidity comes on the back of a mixed Q3 earnings season so far. With close to half of the companies in the EuroStoxx 600 index having reported, some 53.6% have beaten consensus on earnings, which is down around 3ppt compared to last year.
GBP/JPY Daily Outlook
Daily Pivots: (S1) 180.80; (P) 181.66; (R1) 182.27; More...
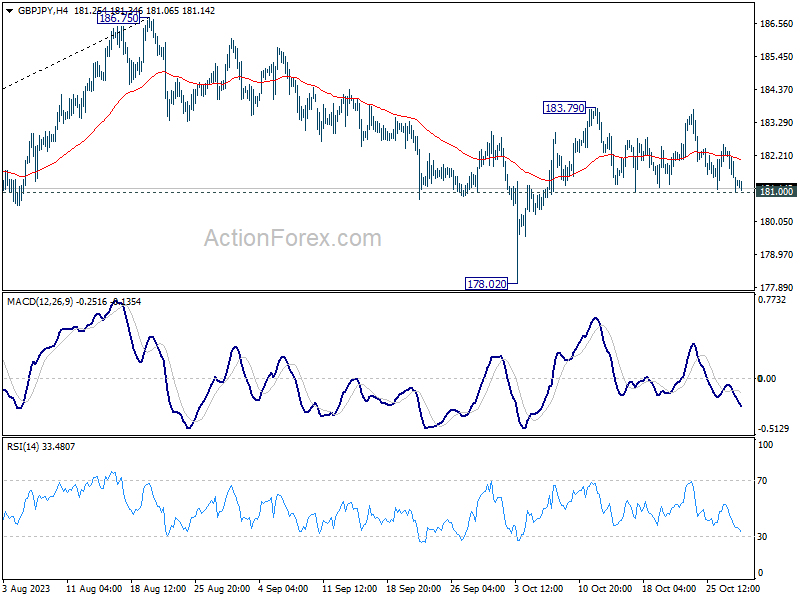
Intraday bias in GBP/JPY remains neutral and further rise will remain mildly in favor as long as 181.00 support holds. Above 183.79 will resume the rise from 178.02 to retest 186.75 high. However, break of 181.00 will turn bias back to the downside for 178.02 instead.
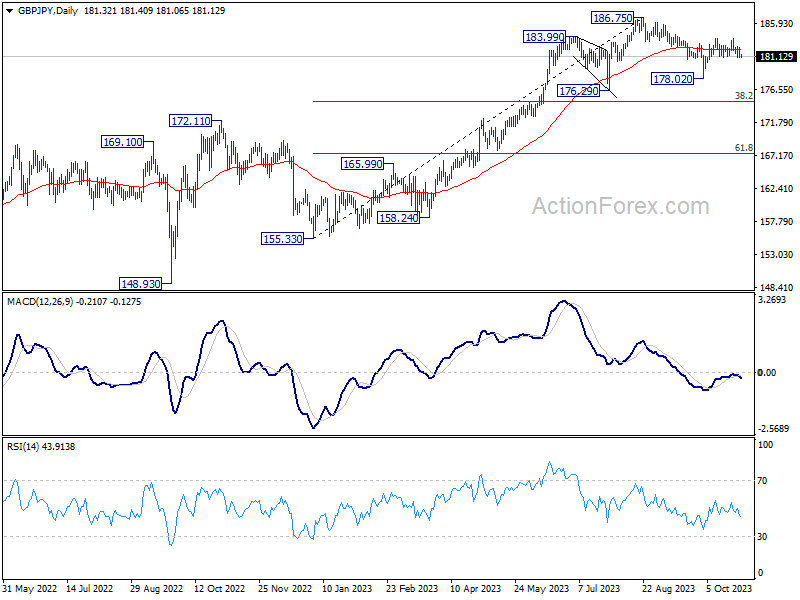
In the bigger picture, fall from 186.75 is seen as a corrective move only. As long as 176.29 support holds, larger up trend from 123.94 (202 low) should still be in progress. Break of 186.75 will target 195.86 (2015 high). Nevertheless, firm break of 176.29 will confirm medium term topping, and bring lengthier and deeper consolidations.
EUR/JPY Daily Outlook
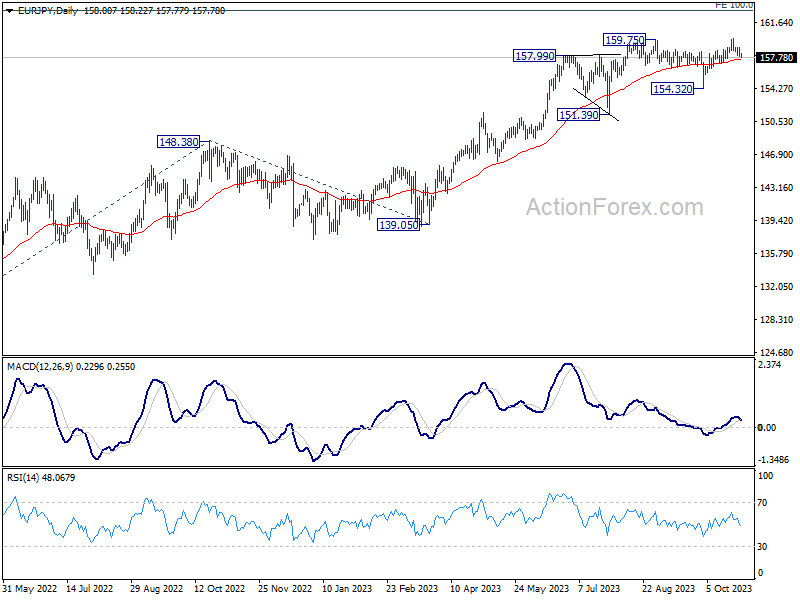
Daily Pivots: (S1) 157.71; (P) 158.30; (R1) 158.71; More....
Intraday bias in EUR/JPY stays neutral at this point. Further rise is in favor as long as 157.67 support holds. Above 159.90 will resume larger up trend to 163.06 projection level. However, firm break of 157.67 will turn bias back to the downside 154.32 support instead.
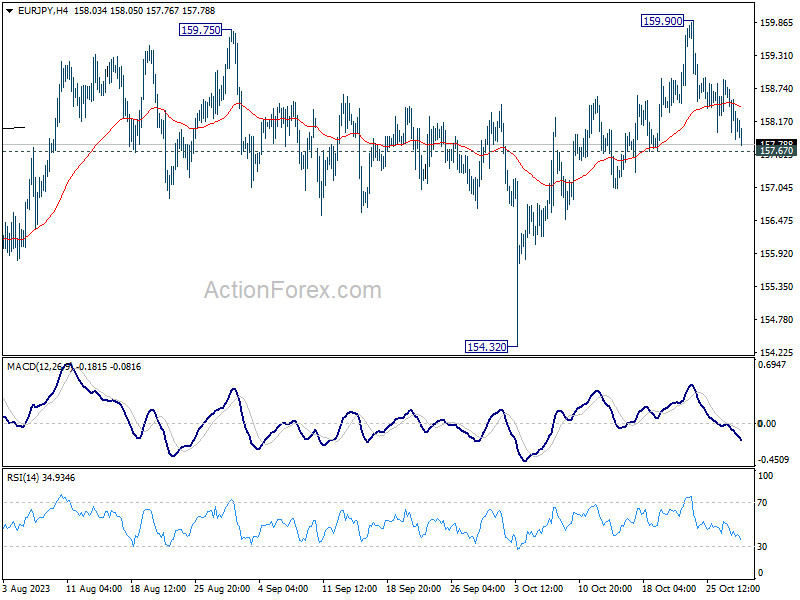
In the bigger picture, rise from 114.42 (2020 low) is in progress. Next target is 100% projection of 124.37 to 148.38 from 139.05 at 163.06. On the downside, break of 154.32 support is needed to be the first sign of medium term topping. Otherwise, outlook will remain bullish even in case of deep pullback.