

Sample Category Title
Technical Outlook and Review
DXY:
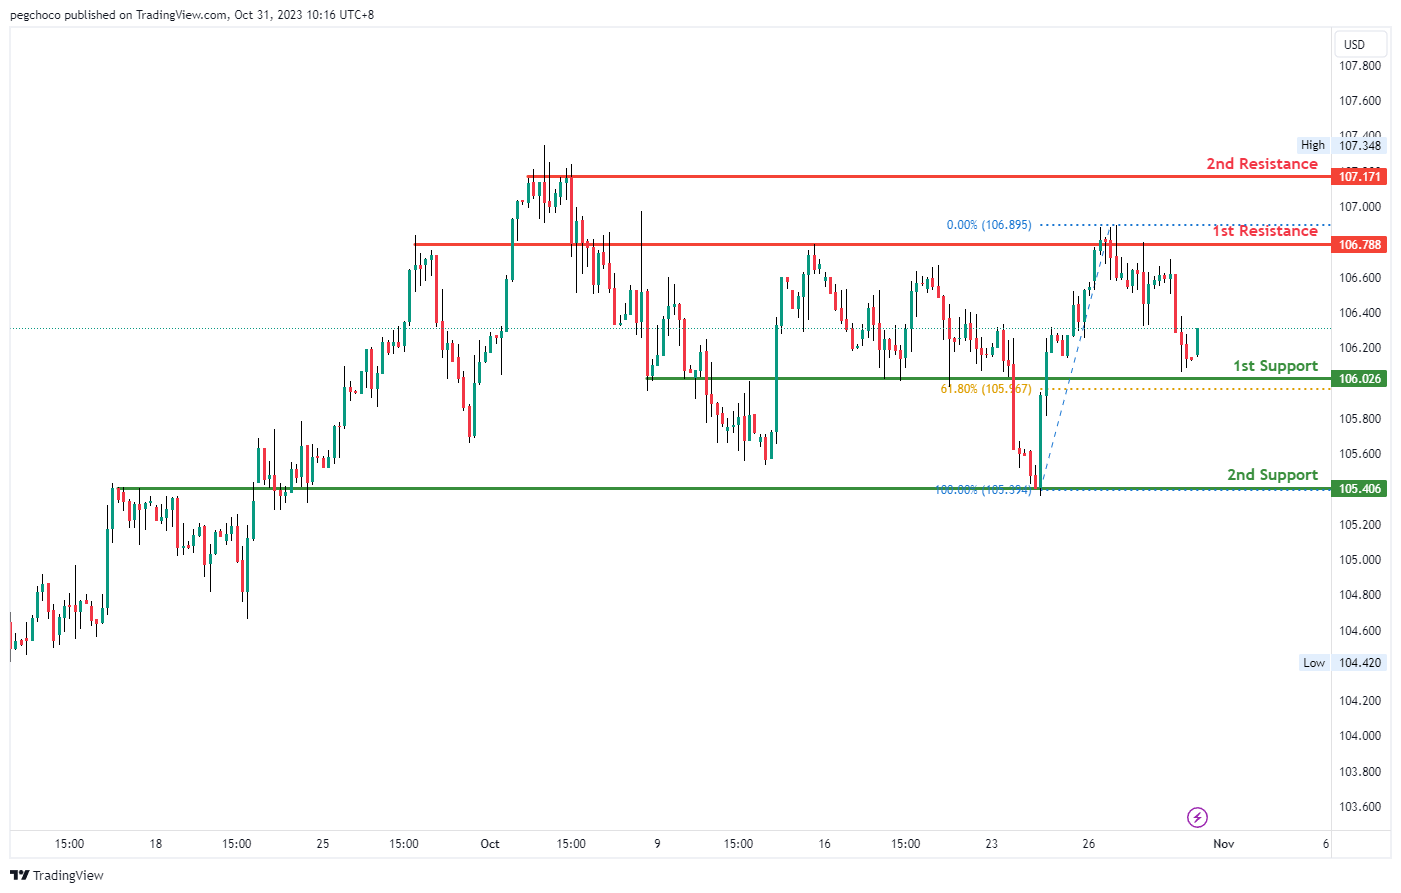
The DXY chart currently indicates a bullish momentum, suggesting the potential for a bullish continuation towards the 1st resistance.
The 1st support at 106.02 is considered significant as it aligns with an overlap support and coincides with the 61.80% Fibonacci Retracement level, indicating its potential to act as a strong support level. Additionally, the 2nd support at 105.40 is identified as another overlap support, reinforcing the potential support zone.
On the resistance side, the 1st resistance at 106.78 is characterized as an overlap resistance, making it a potential barrier to further upward price movements. The 2nd resistance at 107.17 is noted as a multi-swing high resistance, further adding to its significance as a potential area of resistance.
EUR/USD:
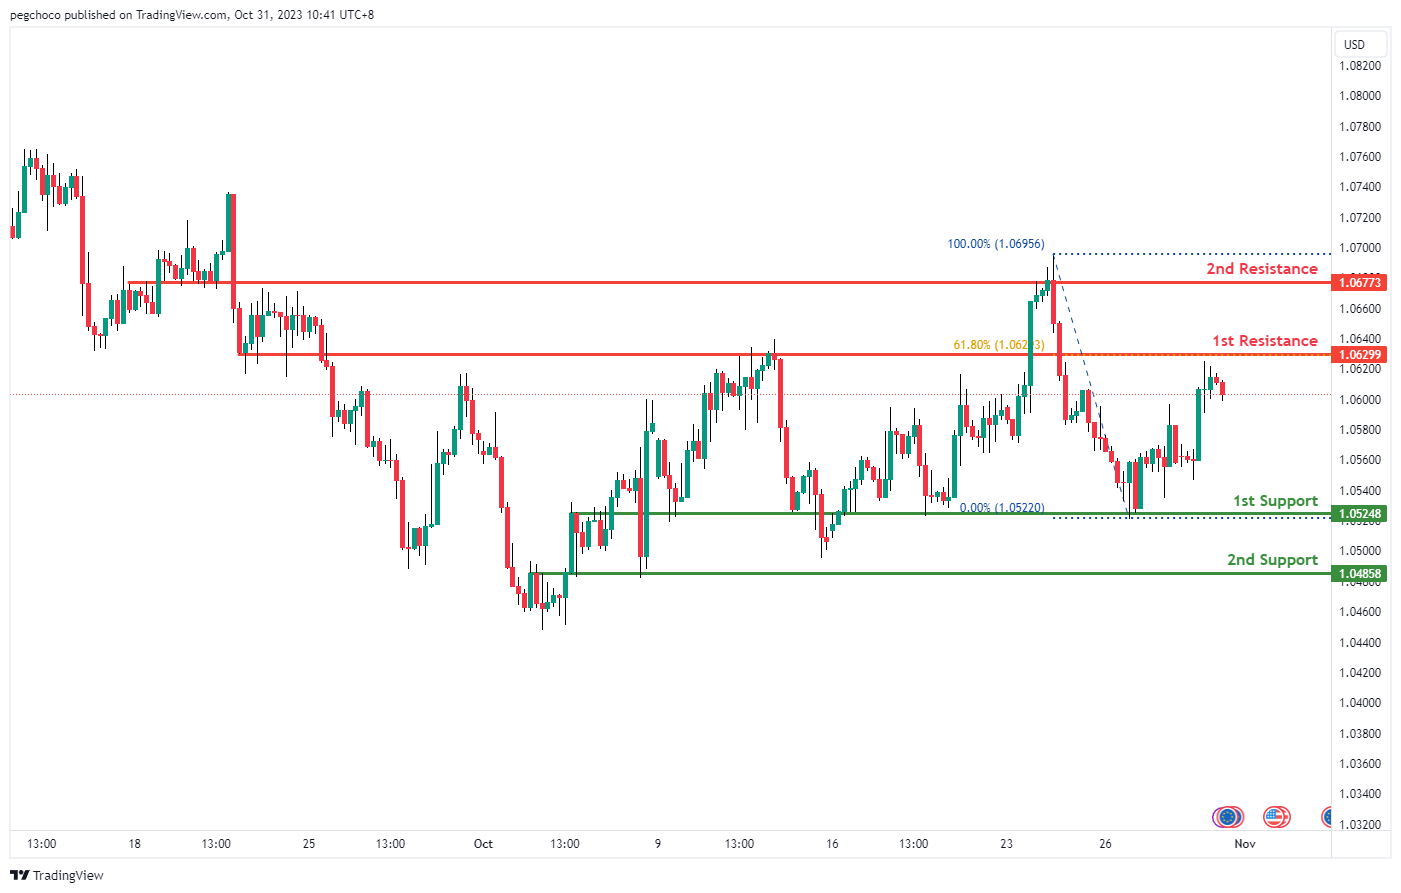
The EUR/USD chart currently demonstrates a bearish momentum, suggesting the potential for a bearish continuation towards the 1st support.
The 1st support at 1.0524 is considered significant as it aligns with an overlap support, indicating its potential to act as a strong support level. Additionally, the 2nd support at 1.0485 is identified as another overlap support, reinforcing the potential support zone.
On the resistance side, the 1st resistance at 1.0629 is characterized as an overlap resistance and coincides with the 61.8% Fibonacci Retracement level, making it a strong potential barrier to any notable upward price movement. The 2nd resistance at 1.0677 is also noted as an overlap resistance, adding to its significance as a potential area where selling pressure may emerge.
EUR/JPY:
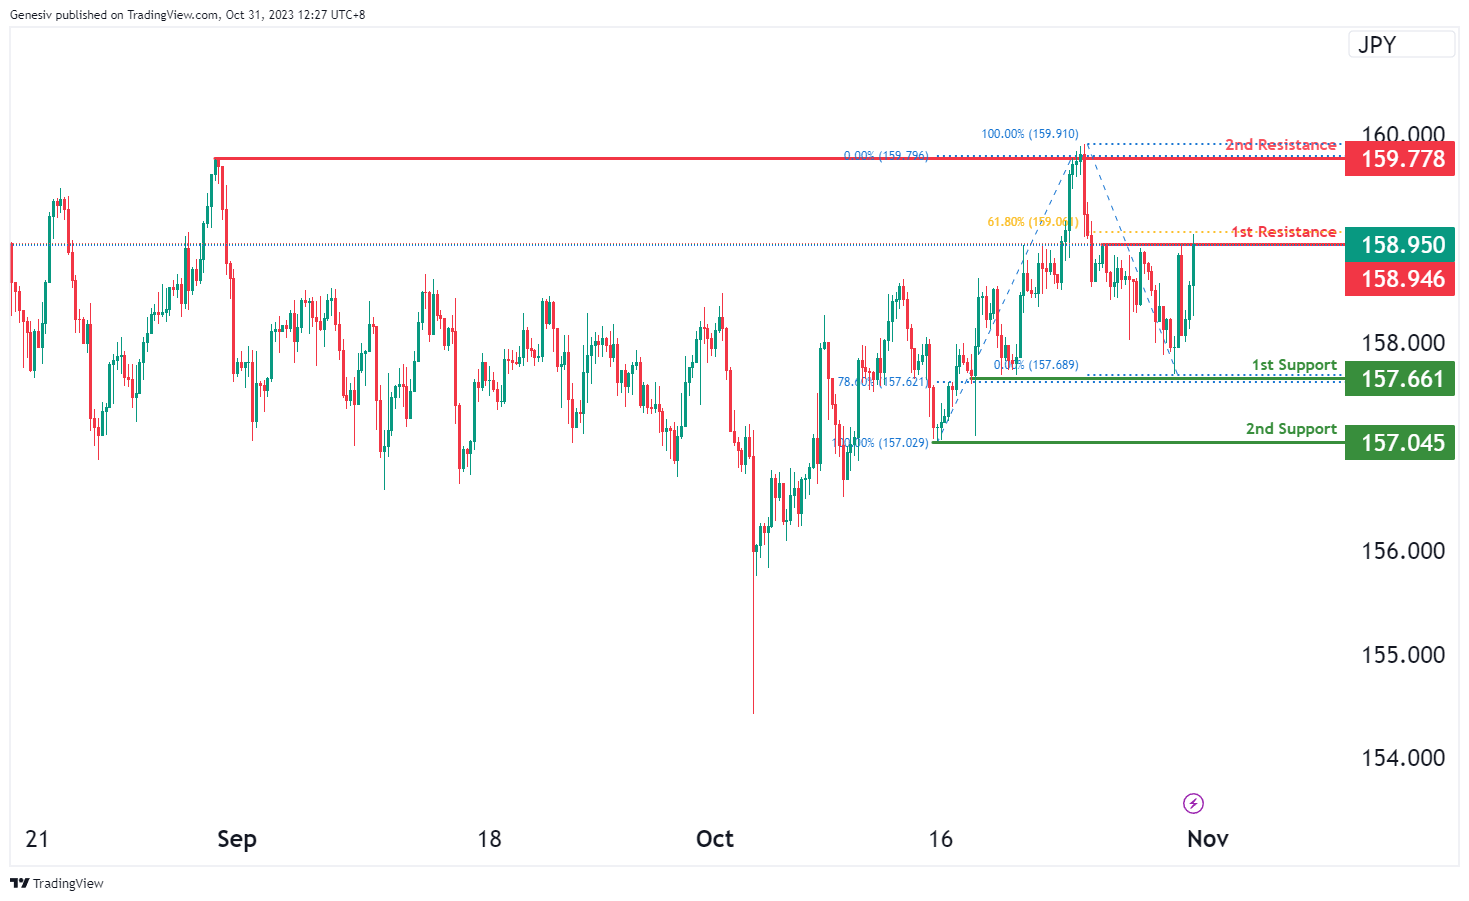
For EUR/JPY, the current chart reflects a bearish overall momentum, indicating the potential for a bearish reaction off the first resistance at 158.94, possibly leading to a drop towards the first support at 157.66.
The first support at 157.66 is considered a robust level due to its multi-swing low support characteristics and the presence of the 78.60% Fibonacci Retracement, establishing a notable level of potential support.
The second support at 157.04 is also significant, featuring swing low support, potentially providing an additional layer of support.
On the resistance side, the first resistance at 158.94 is marked by its multi-swing high resistance characteristics and is associated with the 61.80% Fibonacci Retracement, indicating a significant level of resistance. The second resistance at 159.77 is noteworthy for its multi-swing high resistance attributes, presenting another important level of resistance.
EUR/GBP:
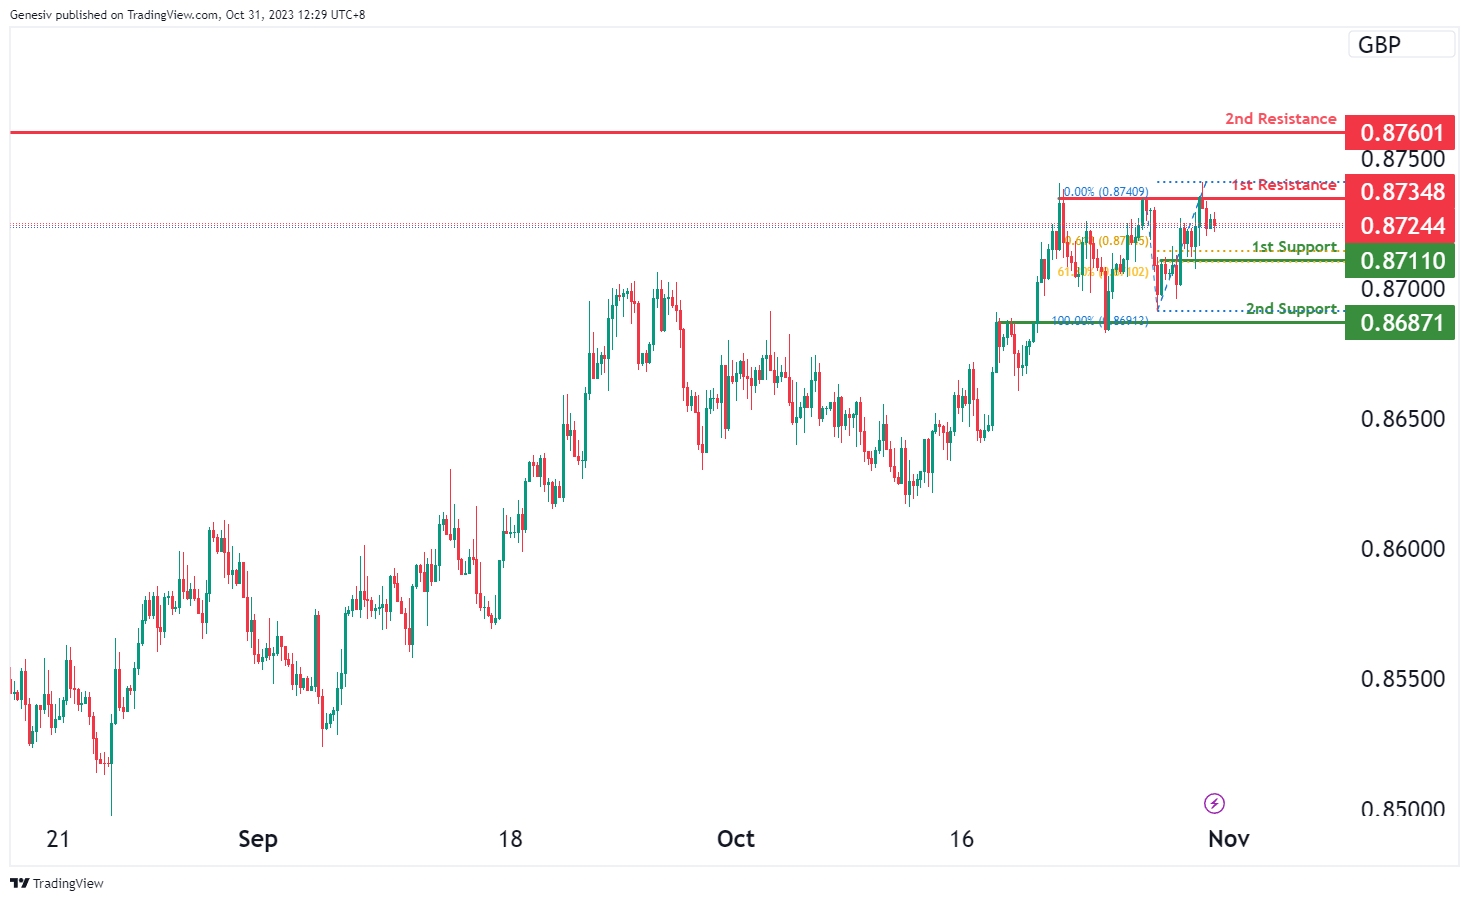
For EUR/GBP, the chart indicates a bearish overall momentum, suggesting a potential bearish continuation towards the first support at 0.8711.
The first support at 0.8711 is deemed strong due to its overlap support characteristics and the presence of the 61.80% Fibonacci Retracement, combined with the 61.80% Fibonacci Projection, indicating Fibonacci confluence. This convergence reinforces its significance as a level of potential support.
The second support at 0.8687 is also an overlap support, providing an additional layer of potential support for the price.
On the resistance side, the first resistance at 0.8734 is marked by multi-swing high resistance characteristics, representing a notable level of resistance.
The second resistance at 0.8760 is noteworthy for its overlap resistance attributes, presenting another important level of resistance for price movements.
GBP/USD:
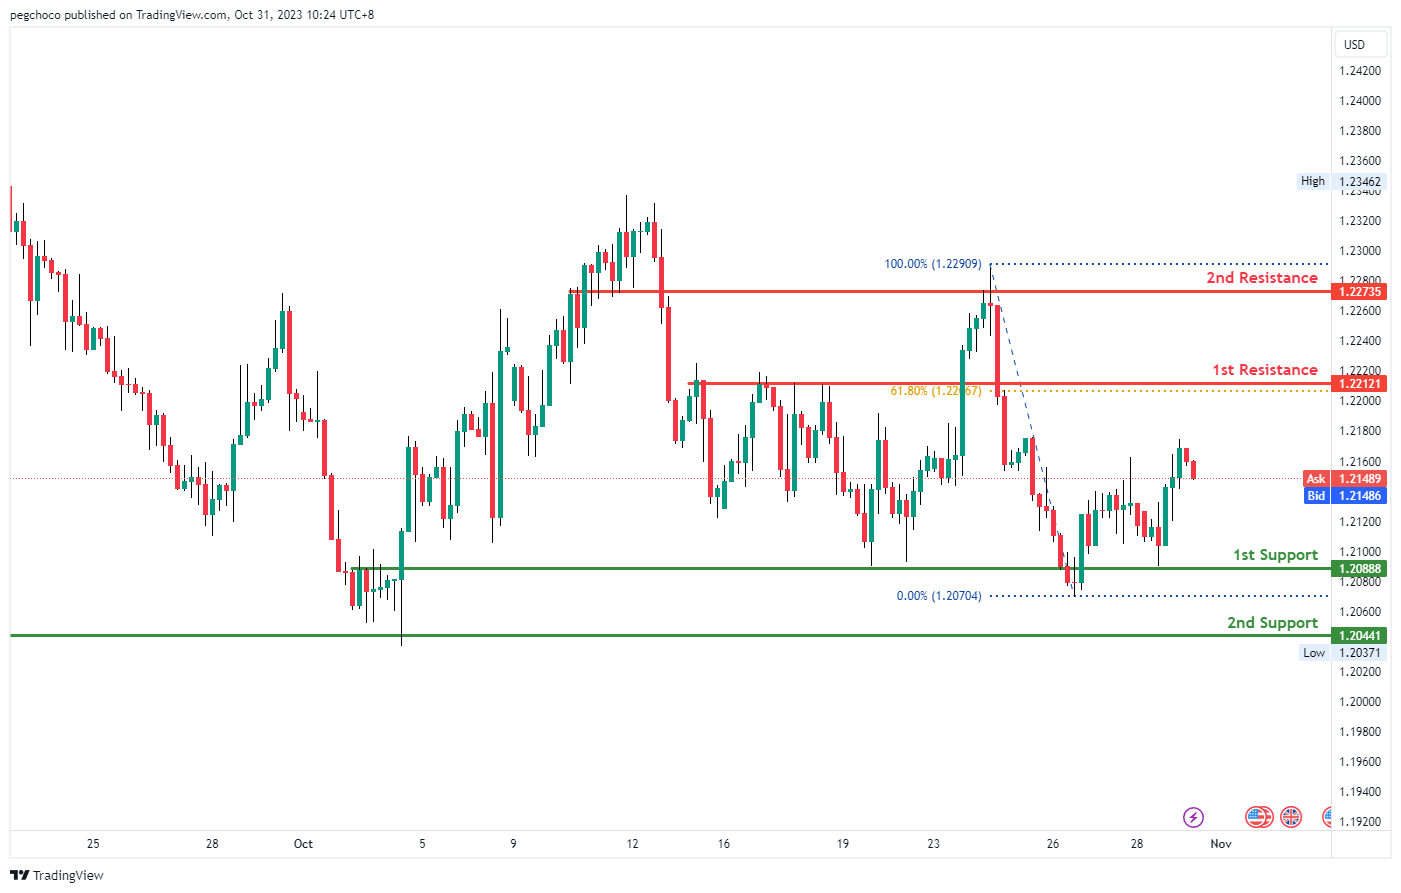
The GBP/USD chart currently exhibits a bullish momentum, indicating the potential for a bullish continuation towards the 1st resistance level at 1.2212.
The 1st support at 1.2088 is considered significant as it aligns with an overlap support, indicating its potential to act as a strong support level. Additionally, the 2nd support at 1.2044 is also identified as an overlap support, reinforcing the potential support zone.
On the resistance side, the 1st resistance at 1.2212 is characterized as a pullback resistance and coincides with the 61.80% Fibonacci Retracement level, making it a strong potential barrier to upward price movement. The 2nd resistance at 1.2273 is also noted as an overlap resistance, adding to its significance as a potential area where selling pressure may emerge. Given the overall bullish momentum, there’s a likelihood of price continuing its upward trajectory towards these resistance levels.
GBP/JPY:
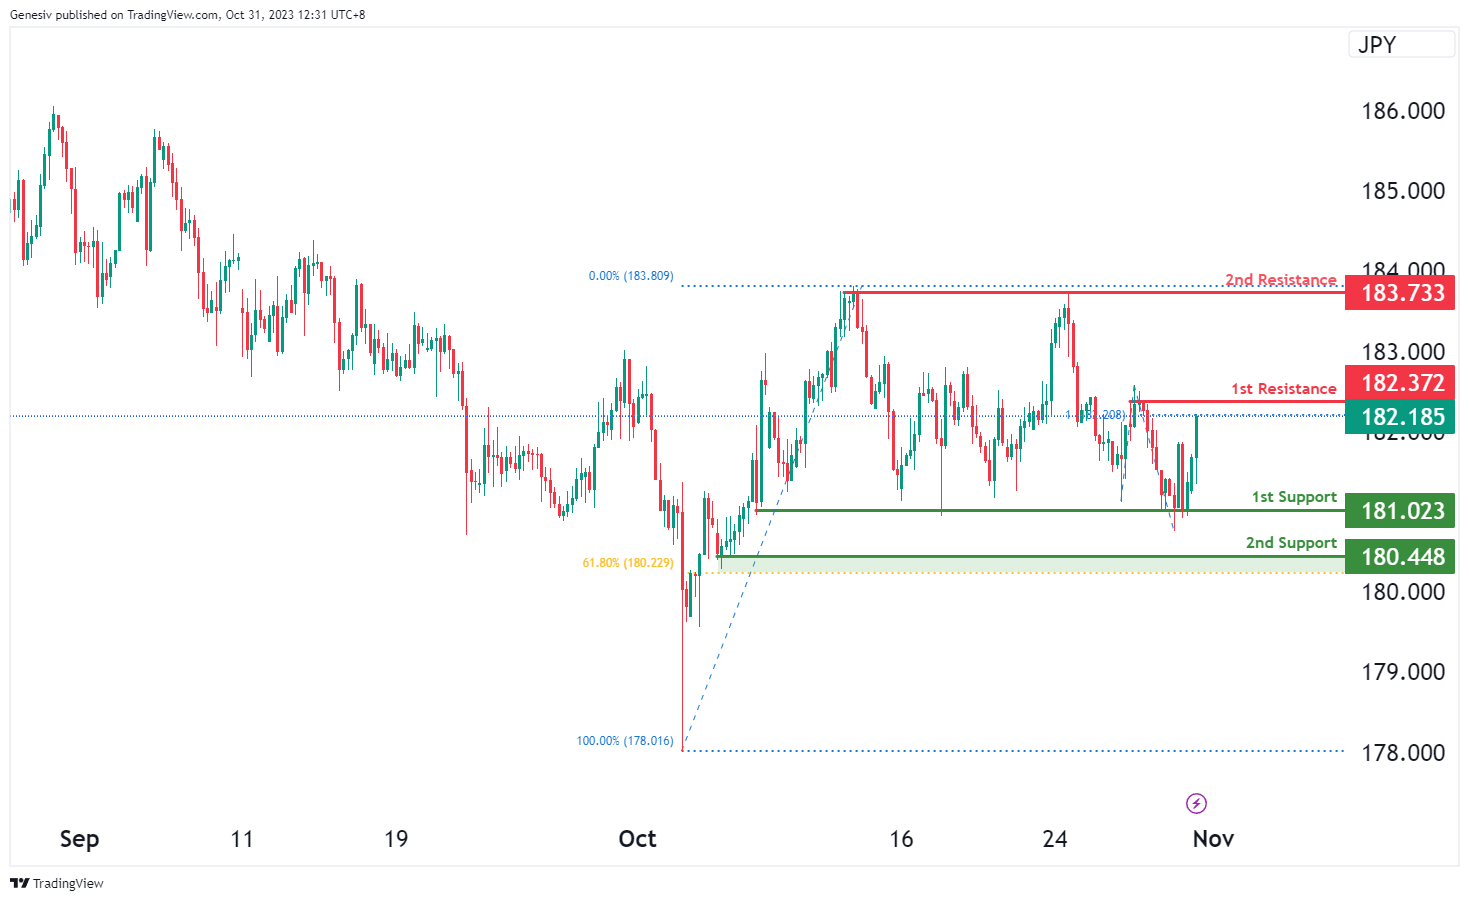
For GBP/JPY, the chart reflects a bearish overall momentum, indicating the potential for a rise towards the first resistance at 182.37 in the short term before reversing off it and dropping towards the first support at 181.02.
The first support at 181.02 is considered a significant level due to its multi-swing low support characteristics, potentially offering strong support for the price.
The second support at 180.44 is also notable as it represents swing low support and is associated with the 61.80% Fibonacci Retracement, adding further strength to its support level.
On the resistance side, the first resistance at 182.37 is marked by swing high resistance and is linked with the 61.80% Fibonacci Retracement, indicating a notable level of resistance.
The second resistance at 186.47 represents swing high resistance and is associated with the 100% Fibonacci Projection, indicating another critical level of resistance in the chart.
USD/CHF:
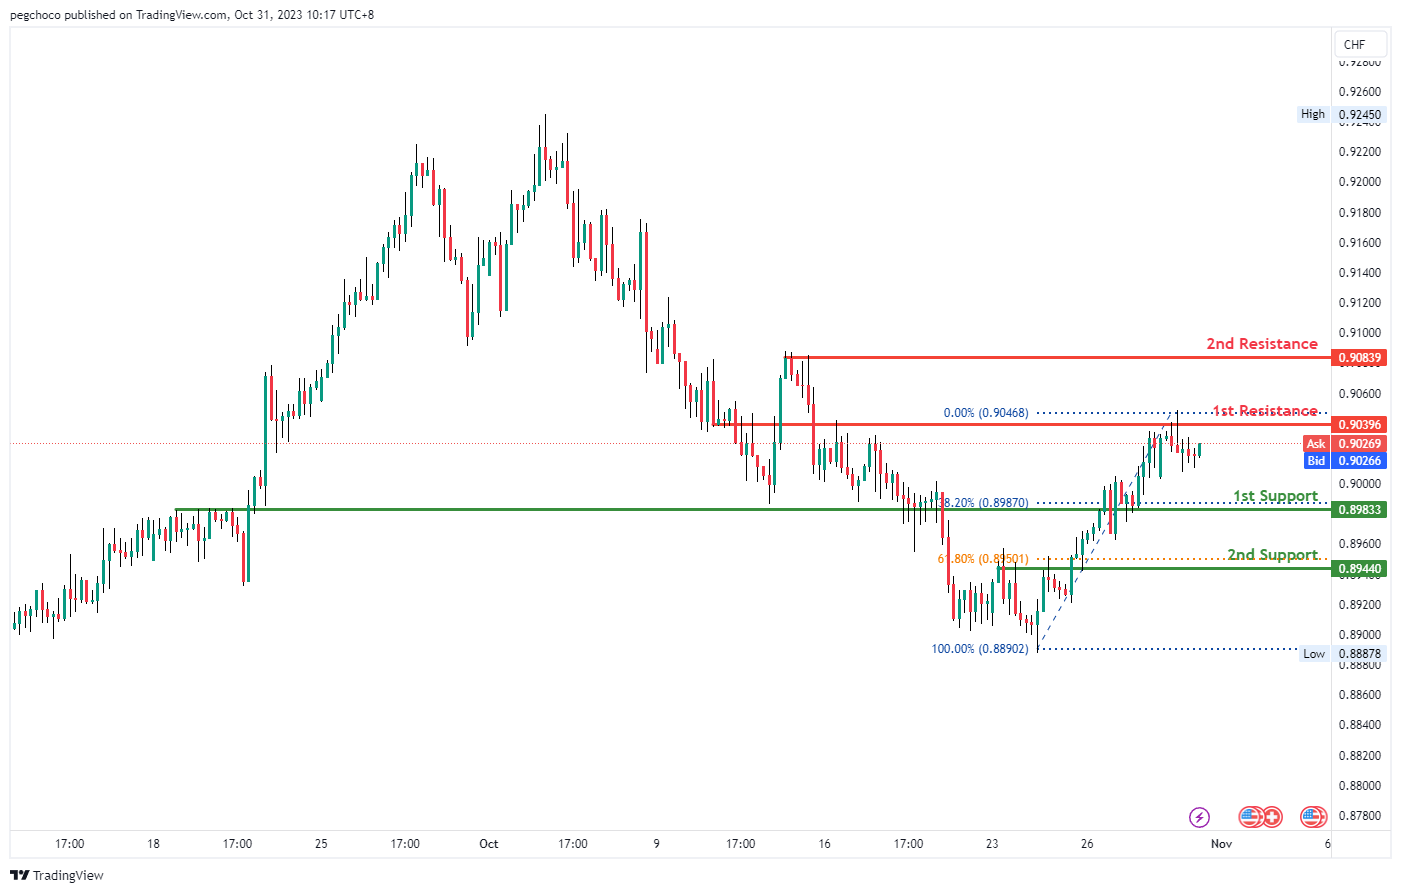
The USD/CHF chart currently shows a bearish momentum, suggesting the potential for a bearish reaction off the 1st resistance level at 0.9039, followed by a drop towards the 1st support level at 0.8983.
The 1st support at 0.8983 is considered significant as it aligns with a pullback support and coincides with the 38.20% Fibonacci Retracement level, indicating its potential to act as a strong support level. Additionally, the 2nd support at 0.8944 is identified as an overlap support and aligns with the 61.80% Fibonacci Retracement, further reinforcing the potential support zone.
On the resistance side, the 1st resistance at 0.9039 is characterized as an overlap resistance, making it a strong potential barrier to upward price movement. The 2nd resistance at 0.9083 is also noted as a multi-swing high resistance, adding to its significance as a potential level where selling pressure may emerge. Given the overall bearish momentum, there’s a likelihood of price reacting to these resistance levels and heading towards the support levels mentioned.
USD/JPY:
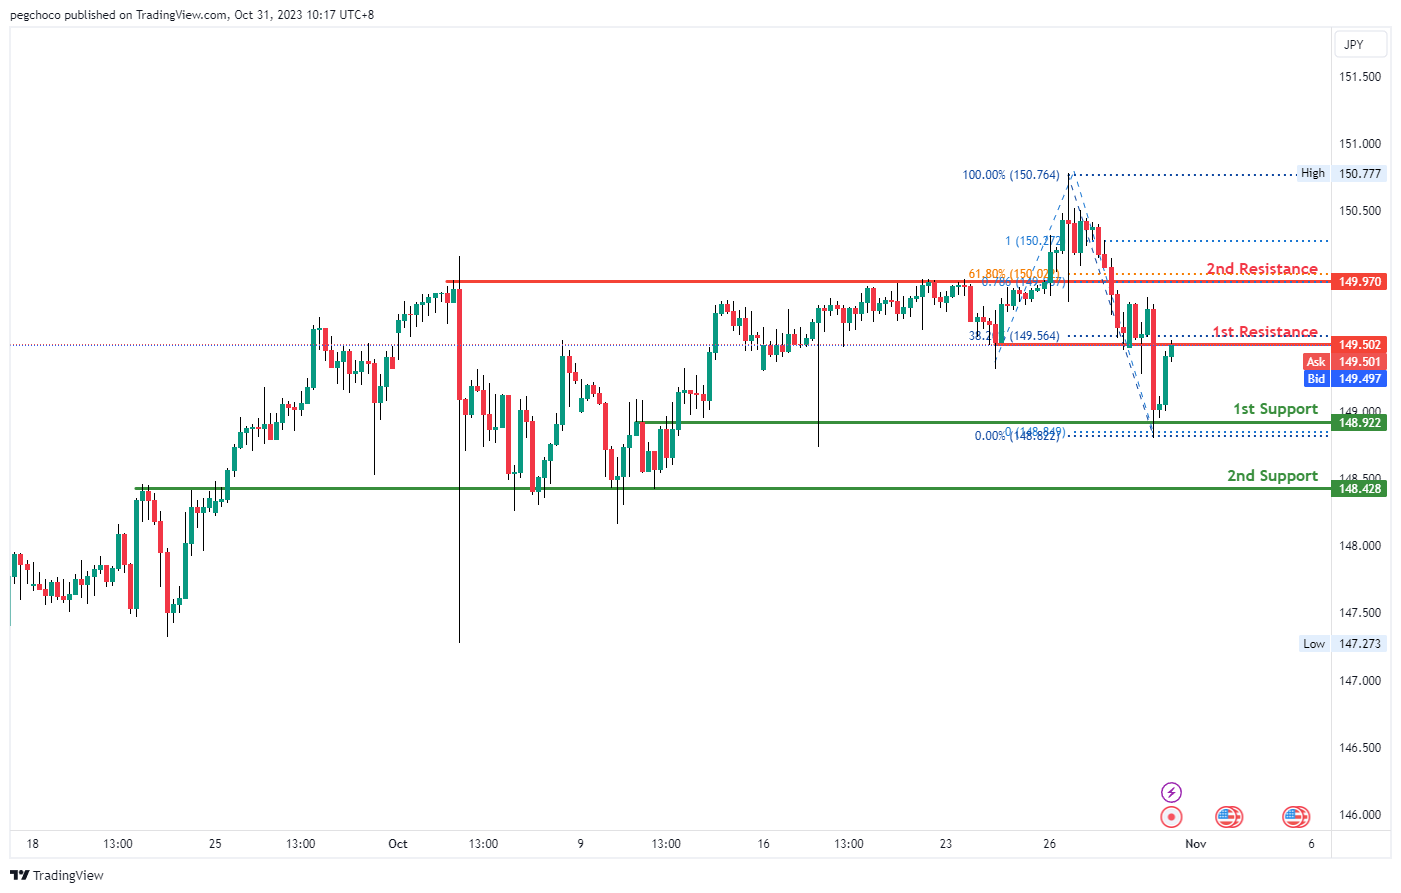
The USD/JPY chart currently exhibits a bearish momentum, suggesting the potential for a bearish reaction off the 1st resistance level at 149.50, followed by a drop towards the 1st support level at 148.92.
The 1st support at 148.92 is considered significant as it aligns with an overlap support, indicating its potential to act as a strong support level. Additionally, the 2nd support at 148.42 is also identified as an overlap support, reinforcing the potential support zone.
On the resistance side, the 1st resistance at 149.50 is characterized as an overlap resistance and coincides with the 38.20% Fibonacci Retracement level, making it a strong potential barrier to upward price movement. The 2nd resistance at 149.97 is noteworthy as it aligns with an overlap resistance, the 78.60% Fibonacci Projection, and the 61.80% Fibonacci Retracement, indicating a significant level of Fibonacci confluence
USD/CAD:
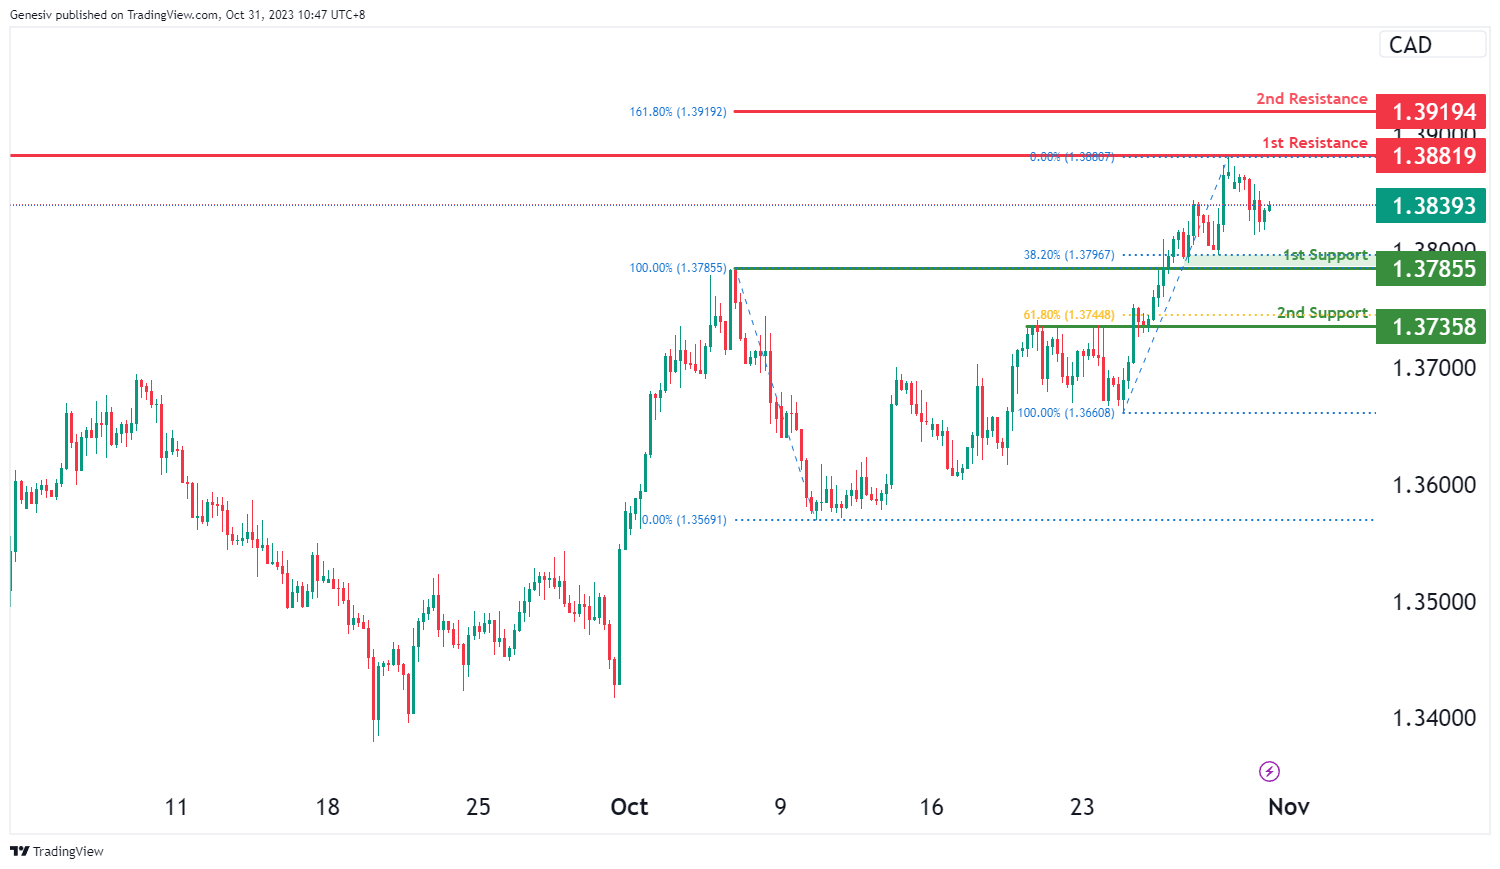
The USD/CAD chart currently demonstrates an overall bullish momentum. There is a potential scenario for price to make a bullish continuation towards the 1st resistance.
The 1st resistance level at 1.3882 is identified as a pullback resistance. Beyond that, the 2nd resistance level at 1.3919 is marked as a resistance that aligns with the 161.80% Fibonacci extension level, further reinforcing the potential for resistance in that region.
To the downside, the 1st support level at 1.3786 is identified as an overlap support that aligns with the 38.20% Fibonacci retracement level. Further below, the 2nd support level at 1.3736 is also noted as an overlap support that aligns with the 61.80% Fibonacci retracement level, indicating a potential area of price support.
AUD/USD:
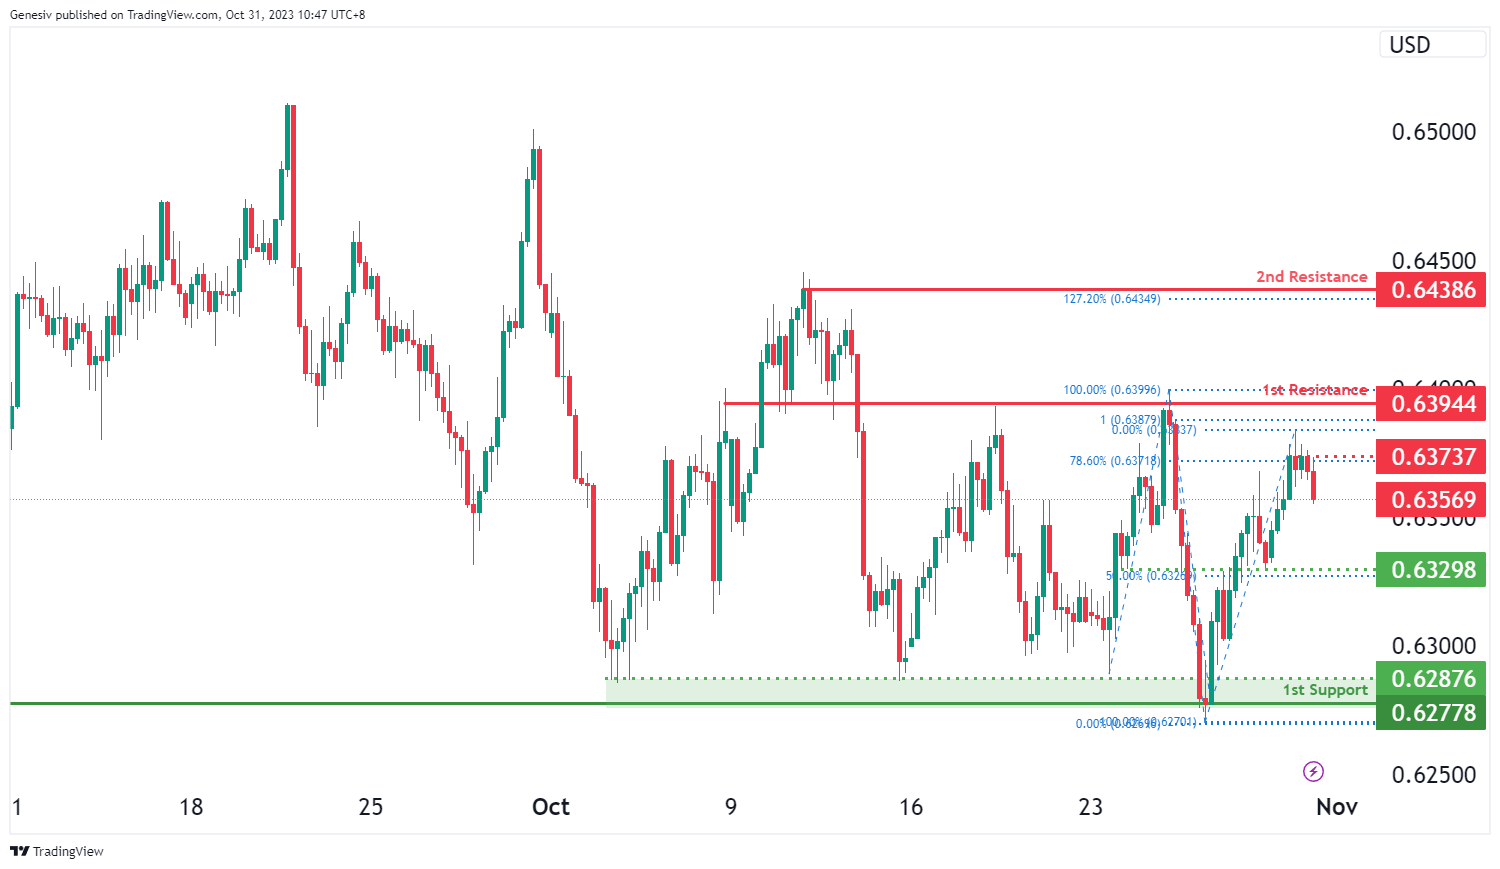
The AUD/USD chart currently exhibits an overall bearish momentum. There is a potential scenario for price to break below the intermediate support and make a bearish continuation towards the 1st support.
The intermediate support level at 0.6329 is identified as an overlap support that aligns with the 50.00% Fibonacci retracement level. The 1st support level at 0.6278 is marked as a multi-swing-low support, indicating its potential as a strong level of price support.
On the resistance side, the intermediate resistance level at 0.6374 is identified as an pullback resistance that aligns with the 78.60% Fibonacci retracement level while the 1st resistance level at 0.6394 is noted as an overlap resistance that aligns close to the 100.00% Fibonacci projection level. Higher up, the 2nd resistance level at 0.6439 is identified as a swing-high resistance that aligns with the 127.20% Fibonacci extension level.
NZD/USD
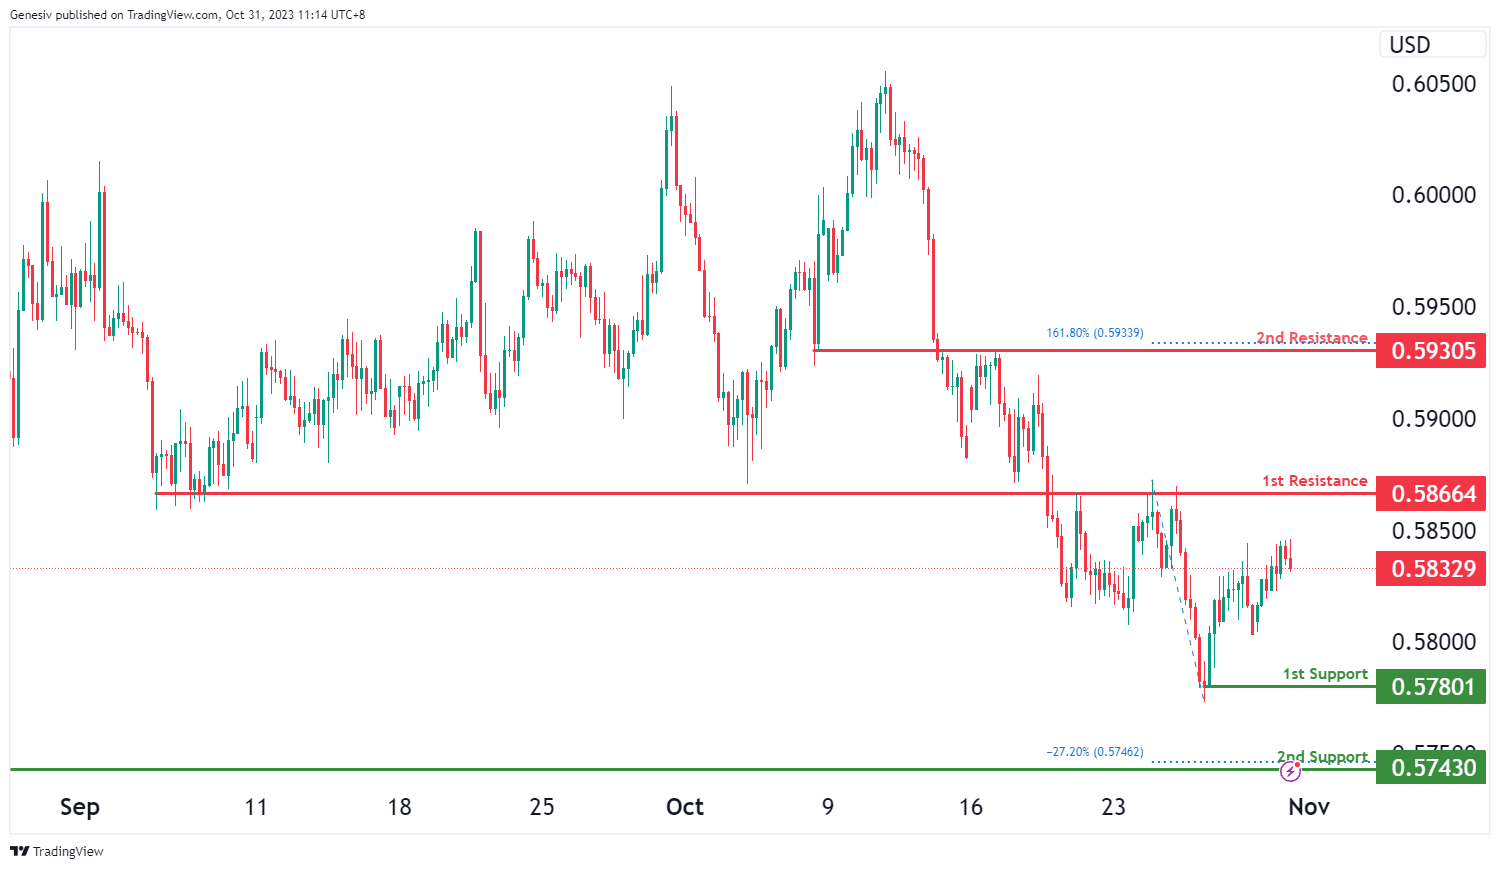
The NZD/USD chart currently demonstrates an overall bearish momentum, suggesting a potential for a bearish continuation towards the 1st support. Price is also trading under the bearish Ichimoku cloud, which acts as an additional bearish factor.
The 1st support level at 0.5780 is identified as a pullback support. Additionally, the 2nd support level at 0.5743 is marked as a swing-low support that aligns with the -27.20% Fibonacci expansion level, which further reinforces the potential for a strong support zone.
On the resistance side, the 1st resistance level at 0.5866 is identified as an overlap resistance. Beyond this, the 2nd resistance level at 0.5931 is also noted as an overlap resistance that aligns with the 161.80% Fibonacci extension level, acting as a potential barrier to upward price movements.
DJ30:
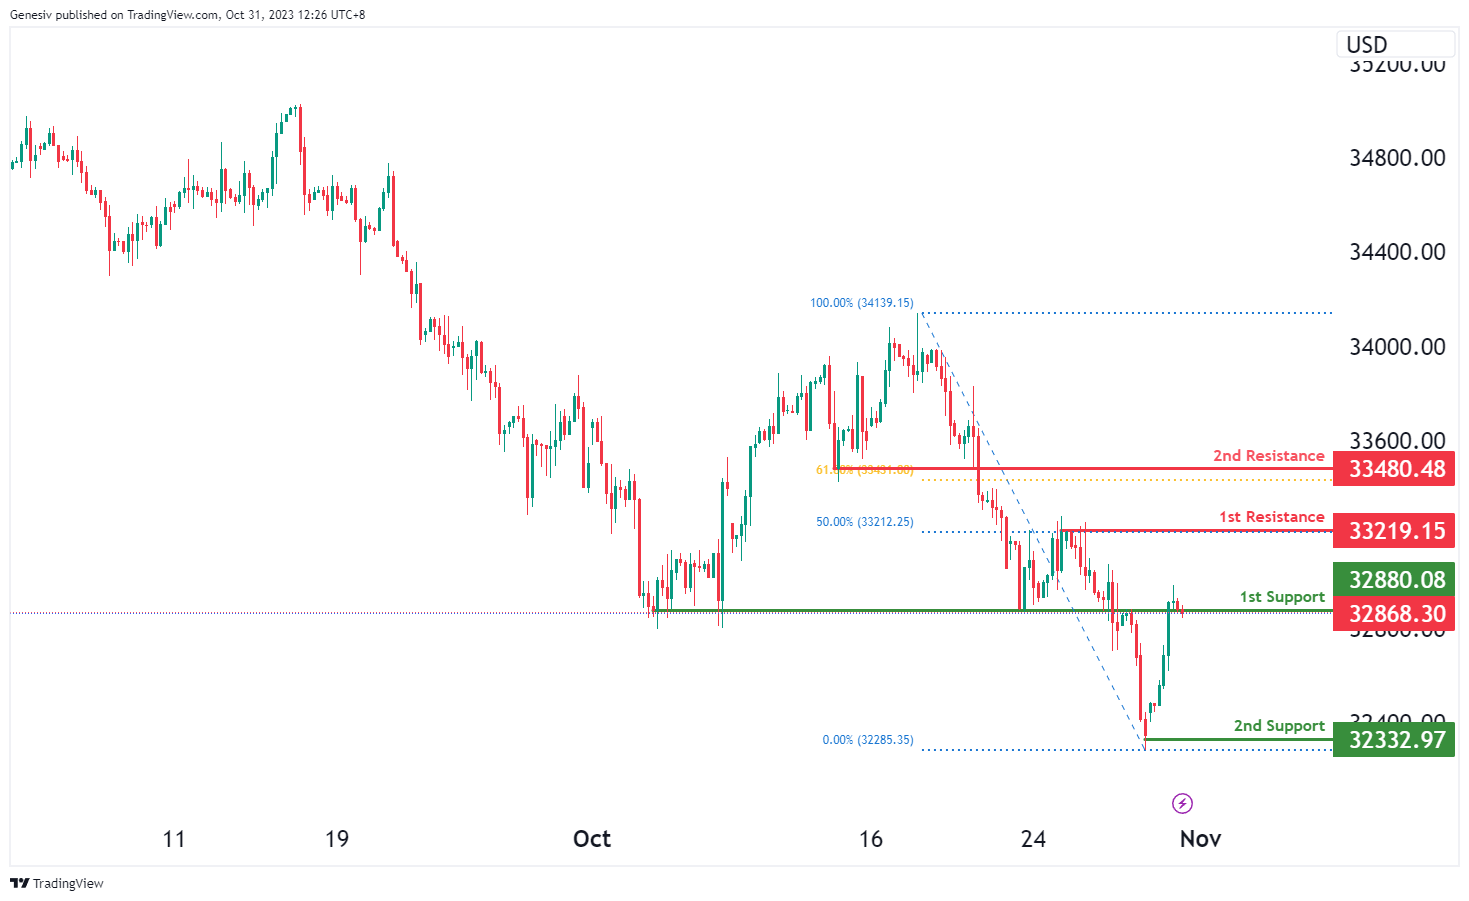
For DJ30, the chart currently indicates a bearish overall momentum, suggesting that the price could potentially witness a bearish break off the first support at 32874.86 and drop towards the second support at 32332.97.
The first support at 32874.86 is considered a strong level due to its overlap support characteristics, providing a notable potential support level.
The second support at 32332.97 is also significant as it features swing low support, marking another level of support for potential price movements.
On the resistance side, the first resistance at 33219.15 is marked by its multi-swing high resistance characteristics and is associated with the 50% Fibonacci Retracement, indicating a significant level of resistance. The second resistance at 33480.48 is noteworthy for its pullback resistance and is linked with the 61.80% Fibonacci Retracement, representing another important level of resistance.
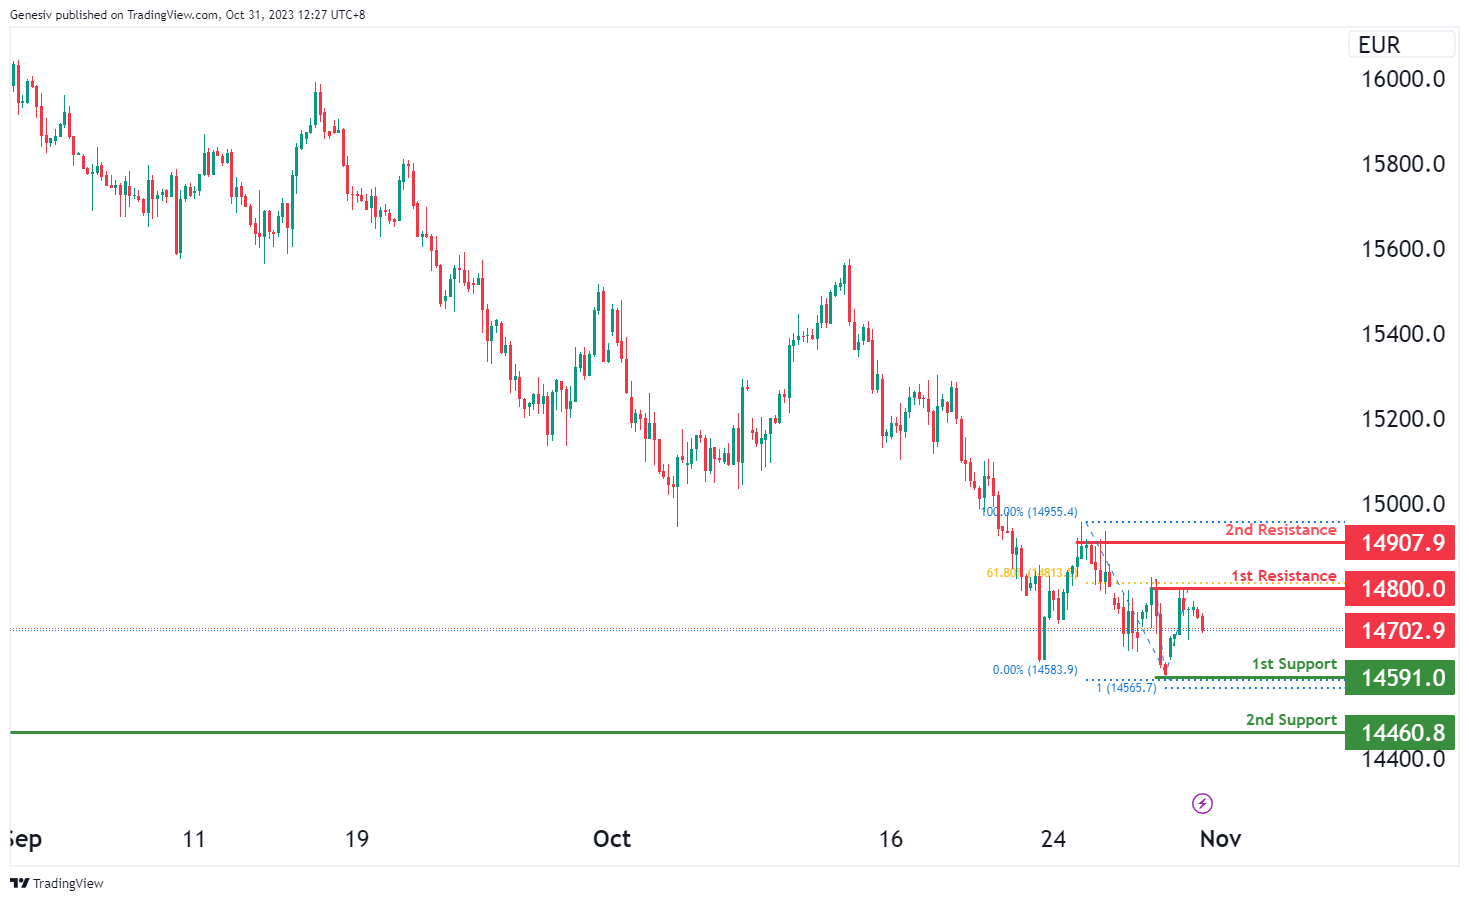
GER40:
For GER40, the chart currently indicates a bearish overall momentum, suggesting that the price could potentially continue in a bearish direction towards the first support at 14591.00.
The first support at 14591.00 is considered a strong level due to its swing low support characteristics and the presence of the 100% Fibonacci Projection, making it a notable potential support level.
The second support at 14460.80 is also significant as it features swing low support, providing another level of potential support for the price.
On the resistance side, the first resistance at 14800.00 is marked by multi-swing high resistance characteristics and is associated with the 61.80% Fibonacci Retracement, indicating a substantial level of resistance. The second resistance at 14907.90 is noteworthy for its multi-swing high resistance, presenting another important level of resistance.
US500
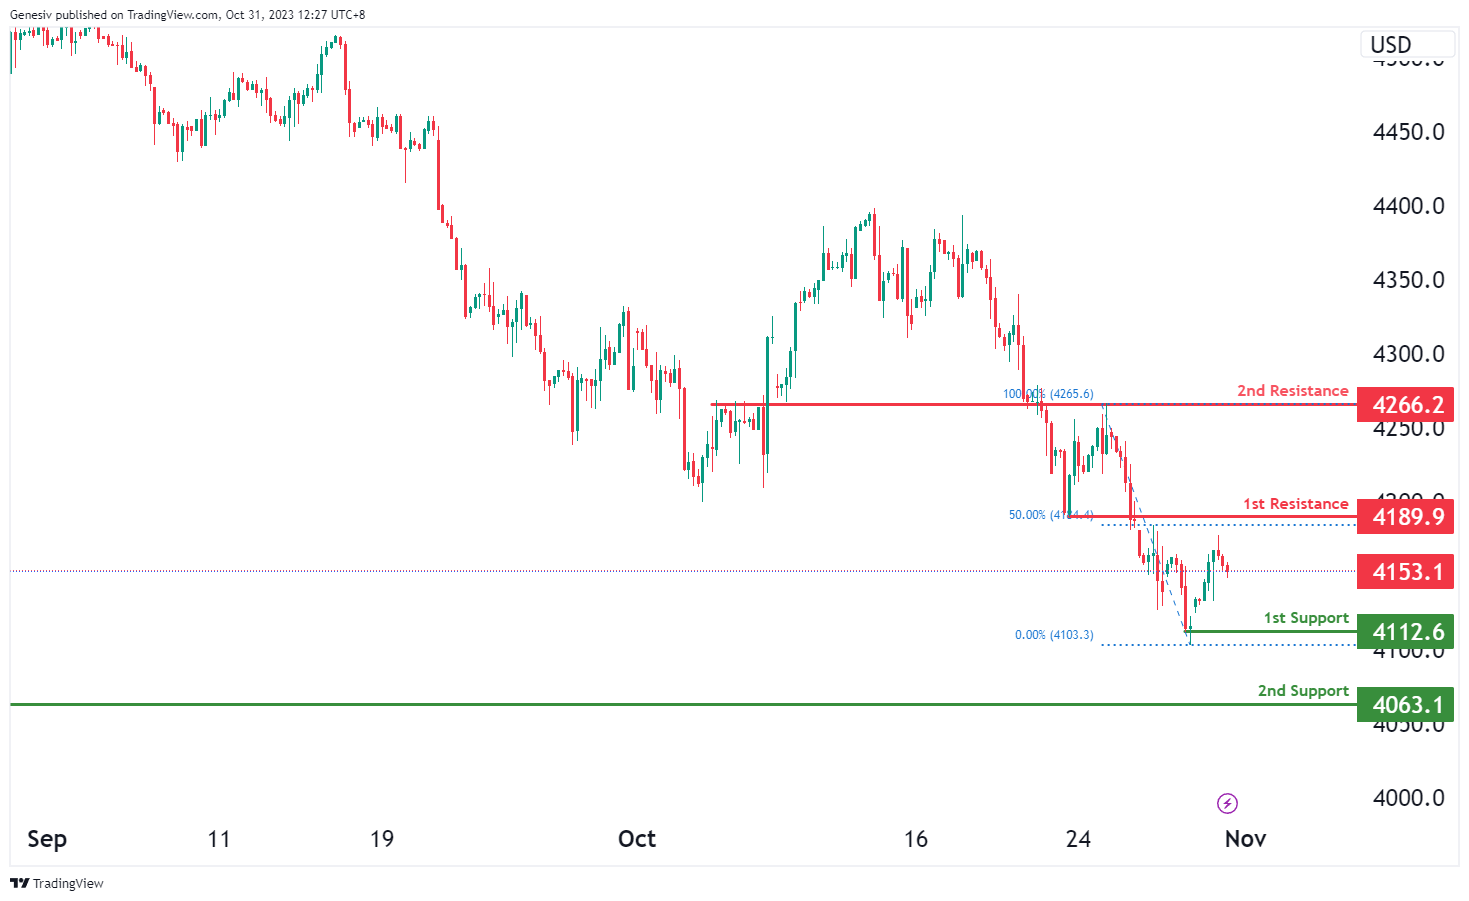
For US500, the chart currently displays a bearish overall momentum, suggesting a potential bearish continuation towards the first support at 4112.6.
The first support at 4112.6 is considered strong due to its swing low support characteristics, marking a significant level of potential support for the price.
The second support at 4063.1 is also notable, as it features overlap support, presenting an additional layer of potential support.
On the resistance side, the first resistance at 4189.9 is marked by pullback resistance, associated with the 50% Fibonacci Retracement, indicating a notable level of resistance. The second resistance at 4266.2 is significant due to its overlap resistance characteristics, presenting another important level of resistance.
BTC/USD:
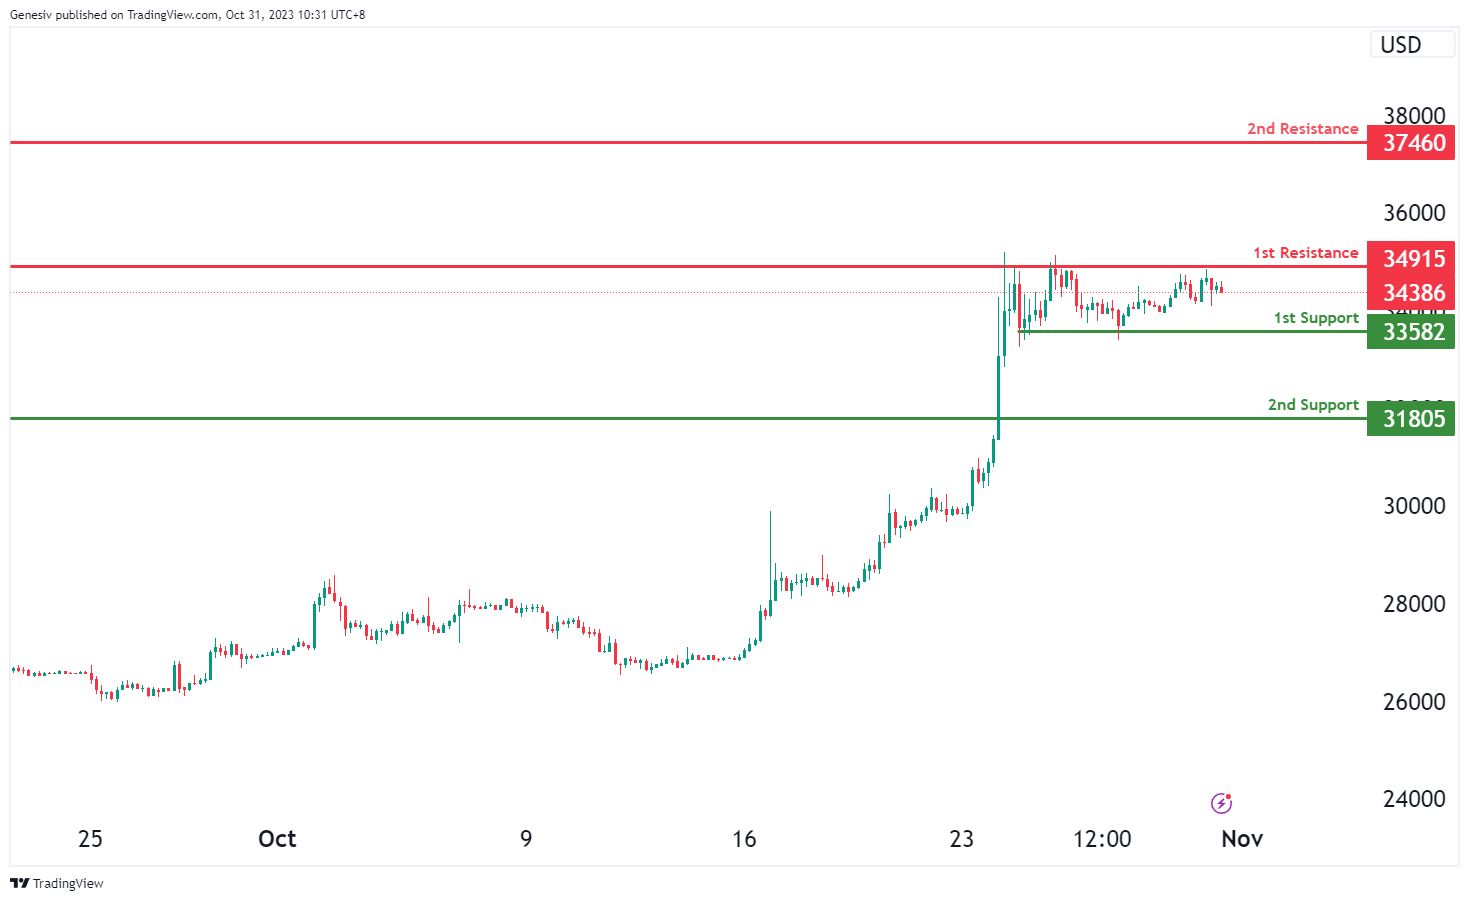
For BTC/USD, the chart currently suggests a neutral overall momentum, implying that the price could potentially fluctuate between the first resistance at 34915 and the first support at 33582.
The first support at 33582 is considered strong due to its multi-swing low support characteristics, offering a notable level of potential support.
The second support at 31805 is also significant as it provides pullback support, potentially adding another layer of support.
On the resistance side, the first resistance at 34915 is marked by its overlap resistance characteristics, indicating a substantial level of resistance. The second resistance at 37460 is noteworthy for its pullback resistance attributes, serving as another important level of resistance.
ETH/USD:
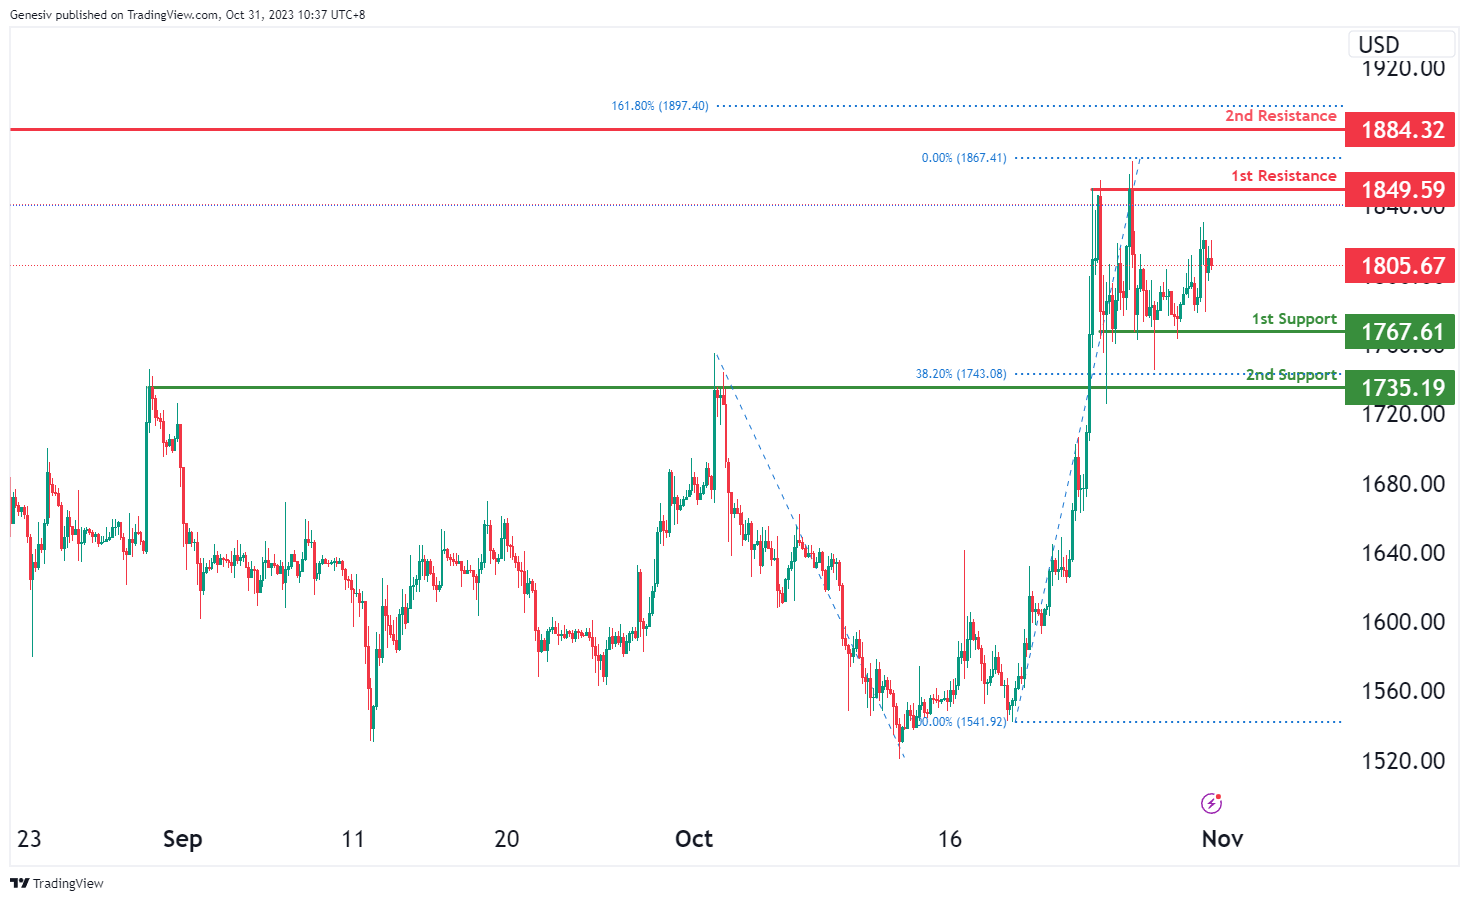
For ETH/USD, the chart currently indicates a neutral overall momentum, suggesting that the price could potentially fluctuate between the first resistance at 1849.59 and the first support at 1767.61.
The first support at 1767.61 is considered strong due to its multi-swing low support characteristics, presenting a significant potential support level.
The second support at 1735.19 is also notable as it offers pullback support and is associated with the 38.20% Fibonacci Retracement, adding further support characteristics.
On the resistance side, the first resistance at 1849.59 is marked by its multi-swing high resistance characteristics, suggesting a substantial level of resistance. The second resistance at 1884.32 is noteworthy for its multi-swing high resistance and is linked with the 161.80% Fibonacci Extension, representing another important level of resistance.
WTI/USD:
The WTI chart currently exhibits an overall bearish momentum, indicating the potential for price to make a bearish continuation towards the 1st support.
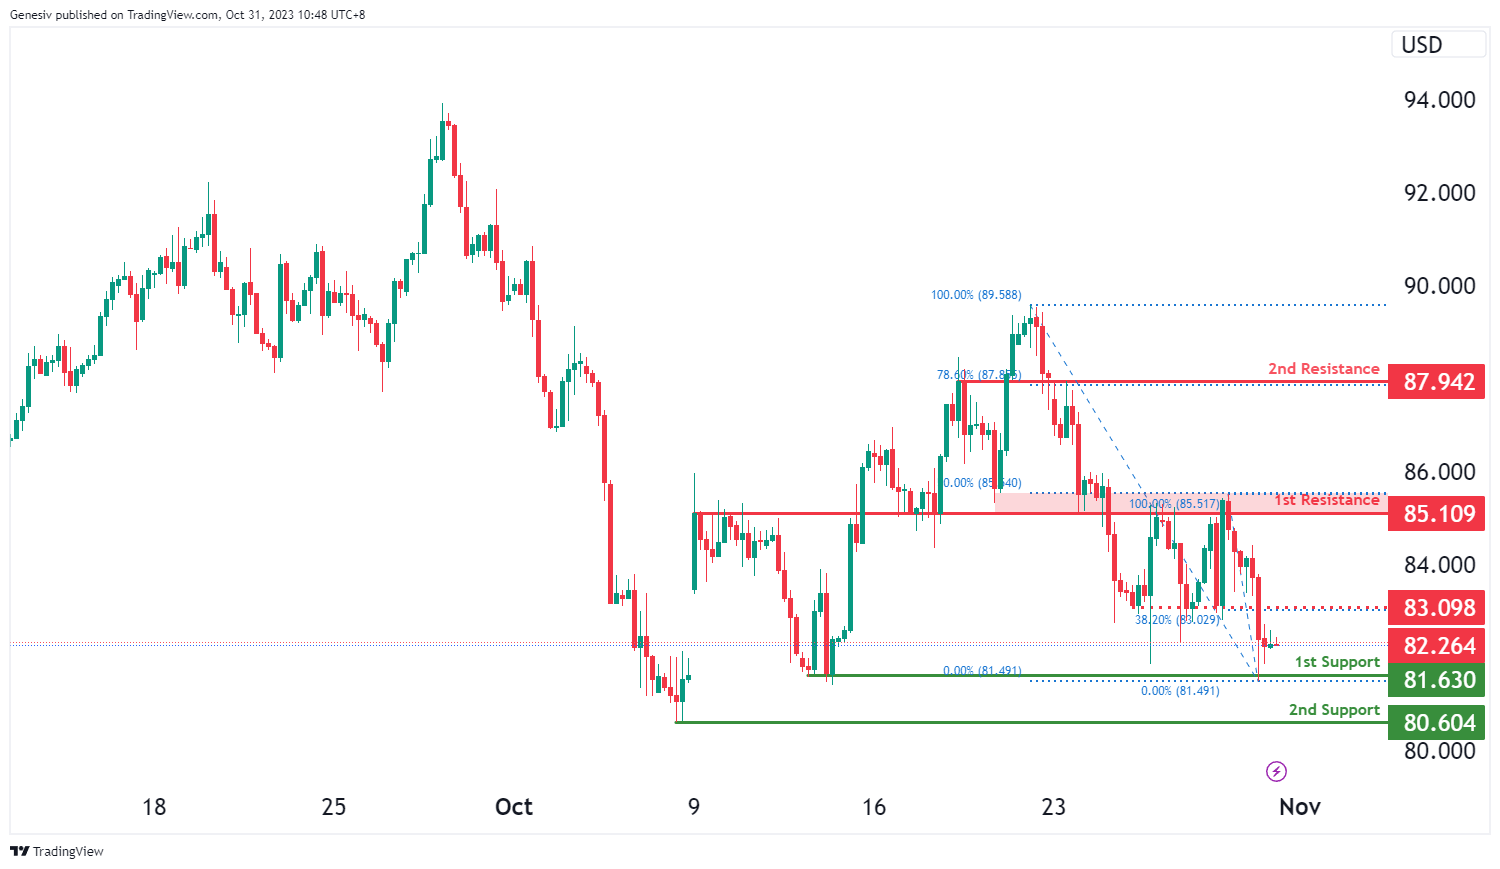
The 1st support level at 81.63 is identified as a pullback support. Additionally, the 2nd support level at 80.60 is marked as a swing-low support, reinforcing a potential support zone.
On the resistance side, the intermediate resistance level at 83.09 is identified as a pullback resistance that aligns with the 38.20% Fibonacci retracement level while the 1st resistance level at 85.11 is noted as an overlap resistance that aligns close to the 50.00% Fibonacci retracement level. Higher up, the 2nd resistance level at 87.94 is marked as a pullback resistance that aligns with the 78.60% Fibonacci retracement level, making it a strong potential barrier to upward price movement.
XAU/USD (GOLD):
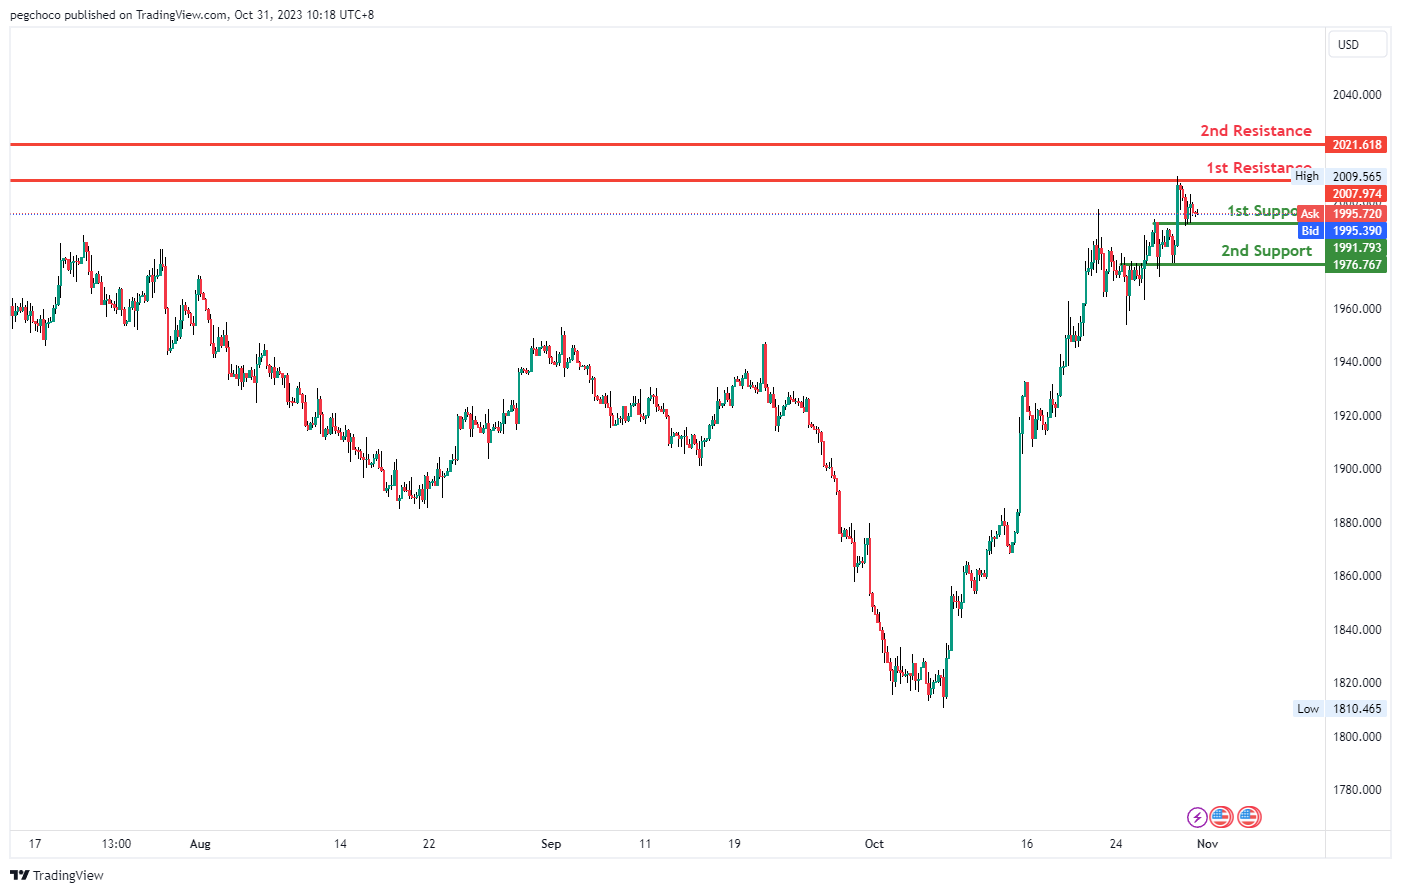
The XAU/USD (Gold/US Dollar) chart currently displays bullish momentum, suggesting the potential for a bullish bounce off the 1st support level at 1991.79 and a subsequent move towards the 1st resistance level at 2009.97.
The 1st support at 1991.79 is considered significant as it aligns with an overlap support, indicating its potential to act as a strong support level. Similarly, the 2nd support level at 1976.76 is also identified as an overlap support, reinforcing the potential support zone.
On the resistance side, the 1st resistance at 2009.97 is characterized as an overlap resistance, implying that it could serve as a substantial barrier to any notable upward price movement in the bullish direction. Additionally, the 2nd resistance at 2021.61 is also noted as an overlap resistance, further reinforcing the significance of this potential area where price may face resistance.
USD/JPY Daily Outlook
Daily Pivots: (S1) 148.63; (P) 149.24; (R1) 149.67; More...
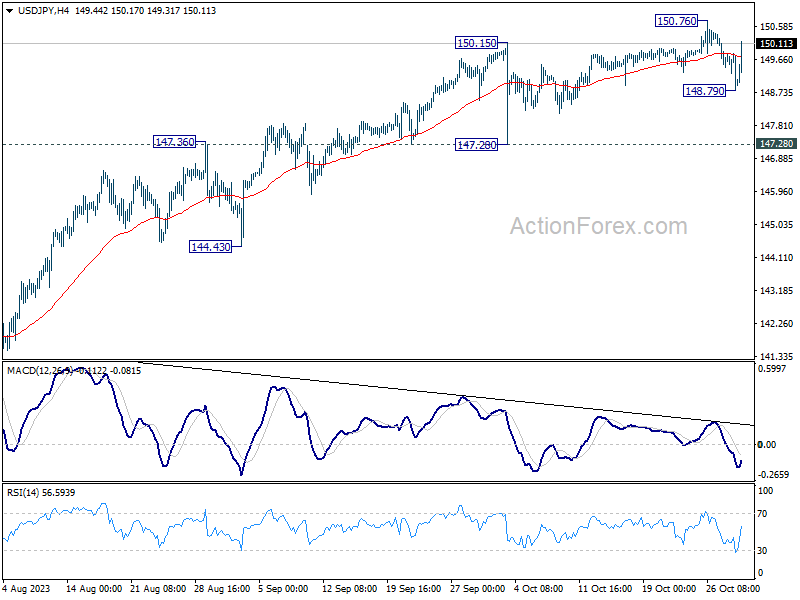
USD/JPY rebounded strongly despite dipping to 148.79. Intraday bias remains neutral at this point. On the upside, break of 150.76 will resume larger rise from 127.20 to 151.93 high. On the downside, below 148.79 will bring deeper pull back. But still, overall outlook will stay bullish as long as 147.28 support holds.
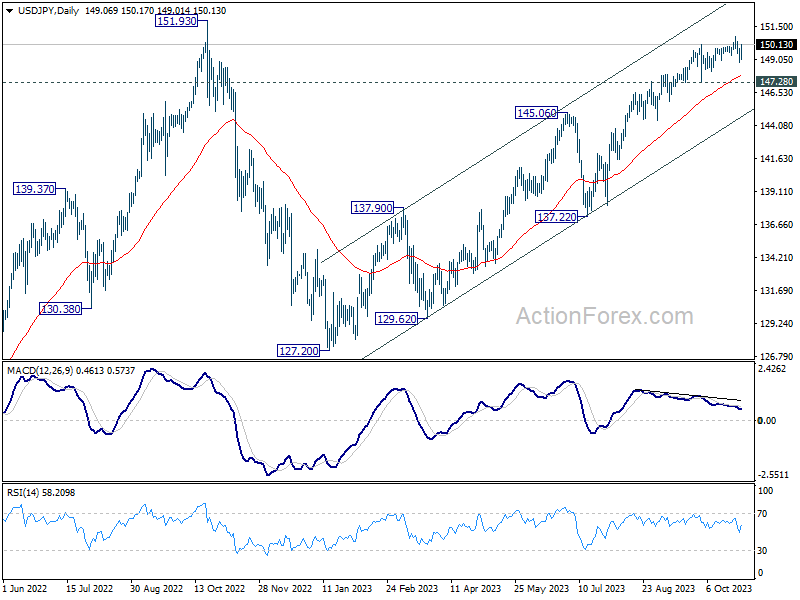
In the bigger picture, while rise from 127.20 is strong, it could still be seen as the second leg of the corrective pattern from 151.93 (2022 high). Rejection by 151.93, followed by sustained break of 145.06 resistance turned support will be the first sign that the third leg of the pattern has started. However, sustained break of 151.93 will confirm resumption of long term up trend.
BoJ’s Language Shift Puts Yen on Defensive; Eurozone and Canadian Data Next
Japanese Yen experienced a sharp decline following BoJ's's (BoJ) subtle adjustment in its language regarding the yield cap. This move has failed to meet market expectations, pushing Yen back below 150 mark against Dollar. Given this backdrop, there's potential for Yen's decline to extend past last week's low, reflecting the broader market sentiment.
Amidst this, Australian and New Zealand Dollar also faced weakness, influenced by disappointing PMI data from China and the consequent impact on Hong Kong stock markets.
Conversely, Dollar has been exhibiting a resurgence, securing its spot as the strongest performing currency of the day so far, closely followed by Swiss Franc and Canadian Dollar. The Euro and Sterling present a mixed picture in the current trading environment.
However, this renewed vigor in Dollar might face some constraints for now. Market participants are likely to adopt a more cautious stance, reserving their major bets for the upcoming FOMC announcement tomorrow. That said, forthcoming releases today such as Eurozone's CPI and GDP data, coupled with Canada's GDP figures, hold the potential to induce significant market fluctuations.
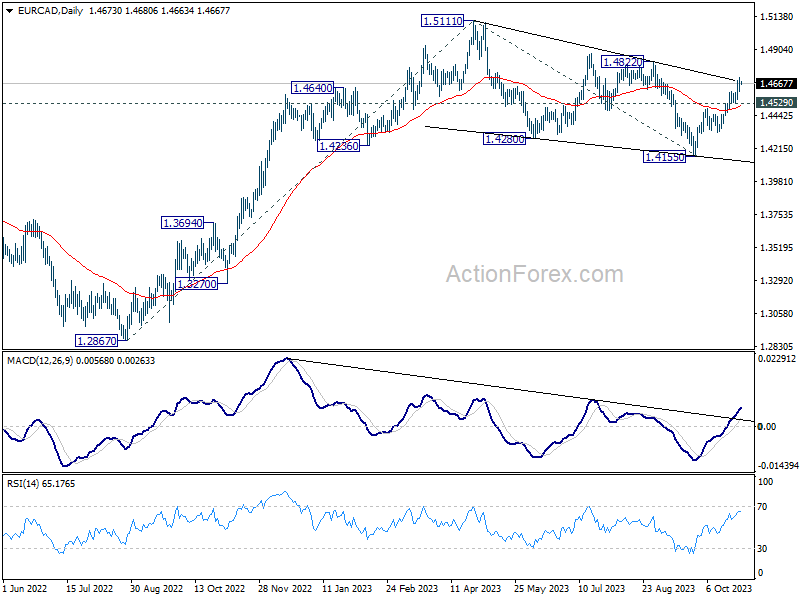
Technically, bullish outlook in EUR/CAD remains unchanged. Further rise is expected to 1.4822 resistance. Decisive break there should confirm that whole corrective fall from 1.5111 has completed with three waves down to 1.4155. Further rally should then be seen through 1.5111 to resume the larger rise from 1.2867. However, break of 1.4529 support will dampen this bullish view and mix up the outlook.
In Asia, at the time of writing, Nikkei is up 0.28%. Hong Kong HSI is down -1.77%. China Shanghai SSE is down -0.38%. Singapore Strait Times is down -0.02%. Japan 10-year JGB yield is up 0.0508 at 0.948. Overnight, DOW rose 1.58%. S&P 500 rose 1.20%. NASDAQ rose 1.16%. 10-year yield rose 0.030 to 4.875.
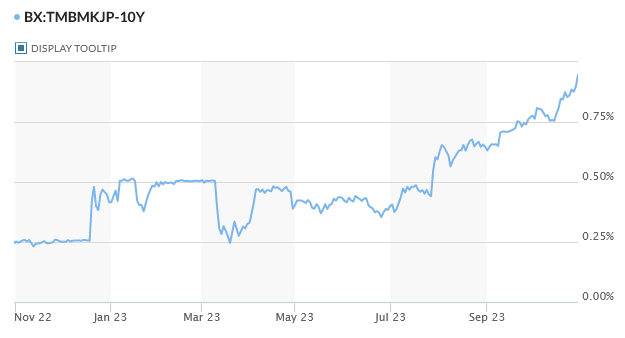
Yen feels the heat as BoJ's yield cap redefinition underwhelms
Japanese Yen is facing renewed pressure following BoJ's policy announcement, where expectations for significant changes were left largely unmet. Instead, the central bank introduced a minor tweak in the language concerning its yield cap, resulting in underwhelming market reactions. USD/JPY is back above 150 mark, after dipping to 148.79 overnight.
Under the Yield Curve Control framework, BoJ has maintained the short-term policy interest rate at -0.10%, while 10-year JGB yield target remains at around 0%. These decisions were reached unanimously. However, the central bank subtly altered its wording regarding the 10-year JGB yield cap, now referring to the 1.0% level as a "reference in its market operations." This move is perceived as transforming the cap into a flexible upper boundary rather than a strict limit.
Adding to this, BoJ stated, "Given extremely high uncertainties over the economy and markets, it's appropriate to increase flexibility in the conduct of yield curve control." This sentiment was not universally shared, as Nakamura Toyoaki expressed dissent, suggesting that increasing flexibility should be contingent upon confirming a rise to firms' earning power.
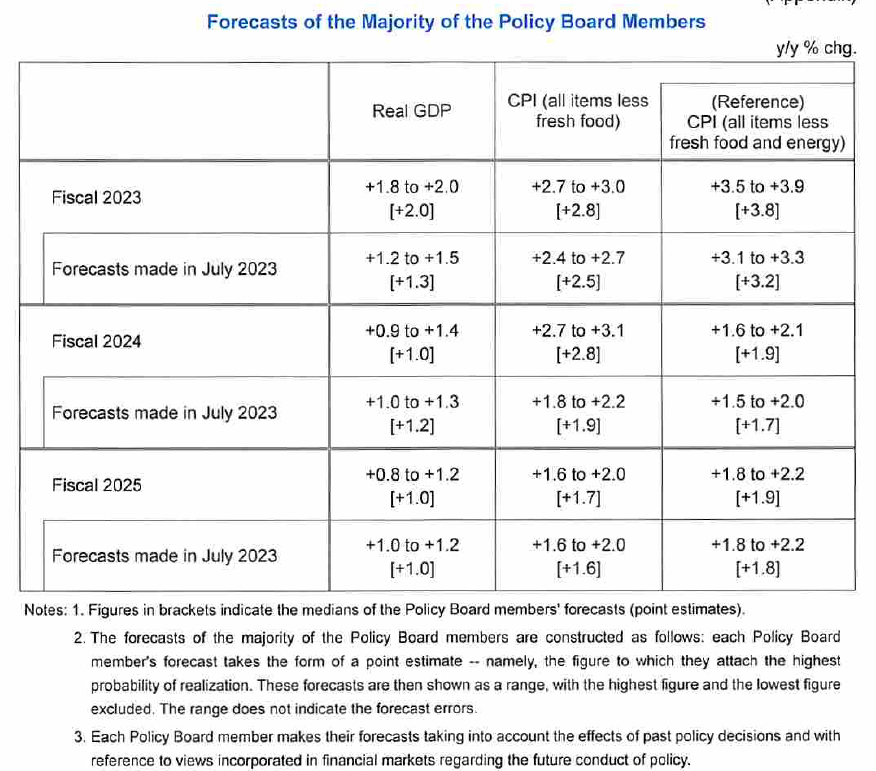
In a significant update, BoJ's new economic projections reveal upgraded core inflation forecasts across the board, with a noteworthy jump from 1.9% to 2.8% for fiscal 2024.
Here's a summary of the updated forecasts:
Core CPI Forecasts (July):
- Fiscal 2023: 2.8% (up from 2.5%)
- Fiscal 2024: 2.8% (up from 1.9%)
- Fiscal 2025: 1.7% (up slightly from 1.6%)
Core-Core CPI Forecasts:
- Fiscal 2023: 3.8% (up from 3.2%)
- Fiscal 2024: 1.9% (up from 1.7%)
- Fiscal 2025: 1.9% (up from 1.8%)
GDP Forecasts:
- Fiscal 2023: 2.0% (up from 1.3%)
- Fiscal 2024: 1.0% (down from 1.2%)
- Fiscal 2025: 1.0% (unchanged)
Japan's industrial output lags behind expectations; retail sales see mixed results
Japan's industrial production in September posted subdued growth, clocking in at only 0.2% mom, significantly below the anticipated rise of 2.5% mom. When compared year-on-year , the figures revealed a drop of -4.6% yoy. Furthermore, the output for the third quarter (July-September) saw a decline, registering at -1.3% compared to the preceding quarter. In terms of a seasonally adjusted index, the production at factories and mines was at 103.3, benchmarked against 2020 base of 100.
Feedback from manufacturers, as sourced by the Ministry of Economy, Trade and Industry, paints a mixed picture for the upcoming months. They project an increase in the seasonally adjusted output by 3.9% for October, followed by a decline of -2.8% in November.
Retail statistics for September also indicated a mix of growth and contraction. On a yearly basis, retail sales rose by 5.8% yoy, narrowly missing forecasted 5.9% yoy. However, assessing the data month-on-month reveals a slight decline of -0.1% mom in retail sales.
On the job front, there's a glimmer of positive news. Unemployment rate experienced a marginal dip, moving from 2.7% to 2.6%, aligning with market expectations. The jobs-to-applicant ratio for September remained steady at 1.29, signifying that there were 129 job opportunities available for every 100 job seekers.
China's official PMI indicates manufacturing back in contraction and non-Manufacturing slows
China's economic pulse seems to have lost its rhythm, as indicated by the latest PMI figures for October. The official PMI Manufacturing dropped from 50.2 to 49.5, falling below the anticipated 50.4 mark. This downturn is not an isolated occurrence; the manufacturing sector has experienced contraction in six out of the ten months of 2023 so far.
In a similar vein, PMI Non-Manufacturing sector witnessed a decrease, moving from 51.7 to 50.6, which is also below the projected 51.8. Compounding these concerns is PMI Composite, which aggregates both manufacturing and non-manufacturing sectors. It fell from 52.0 to 50.7, registering its lowest reading since December 2022.
National Bureau of Statistics senior statistician Zhao Qinghe acknowledged these challenges in a statement. He noted, "China's economic activity fell to an extent, and the foundation for a continued recovery still needs to be further solidified."
NZ ANZ business confidence jumped to 23.4, inflation pressures remain
New Zealand's ANZ Business Confidence for October showcased a significant rise, moving from 1.5 to a robust 23.4. This upbeat sentiment was mirrored in the Own Activity outlook, which climbed from 10.9 to 23.1.
A broader analysis of the report's details reveals positive shifts across multiple components: Export intentions rose from -0.4 to 6.1, Investment intentions moved from a negative -4.1 to a positive 3.8, and Employment intentions took a jump from 1.2 to 5.6.
However, while these figures indicate growing optimism in business activities and prospects, inflation front remains a concern. Cost expectations reduced slightly from 78.6 to 76.0. Similarly, Pricing intentions saw a minor drop, moving from 47.1 to 46.3. Inflation expectations also experienced a negligible downtick, adjusting from 4.95% to 4.94%.
Reacting to these numbers, ANZ remarked, "Just as we thought that the rebound in activity indicators in the ANZ Business Outlook survey might be running out of steam, we've seen a marked jump across most."
The bank also cautioned against hasty conclusions based on the current data, especially considering the potential disruptions from the election, suggesting a wait-and-watch approach: "we'll see whether the newfound (relative) optimism persists over the next few months."
On the inflation front, ANZ noted that, "inflation pressures are gradually waning in the big picture." Despite this, the bank emphasized that significant progress in curbing inflation has been missing over recent months. The journey back to the inflation target remains substantial. "We continue to expect it'll take at least one more OCR hike to get us there."
BoC's Macklem Sounds Inflation Alarm Amid Global Tensions
BoC Governor Tiff Macklem provided a sobering insight into Canada's economic prospects during a parliamentary committee session overnight. Highlighting the central bank's decision to maintain policy rate at 5.00% last week, Macklem emphasized the decision was taken to allow monetary policy "time to do its job." However, he shared concerns that any reduction in inflation is "likely to be slow" and notably mentioned that "inflationary risks have increased."
Despite expectations for inflation to slowly revert to 2% target by 2025, the Governor expressed apprehension, stating, "we're worried that higher energy prices and persistence in underlying inflation are slowing progress."
Macklem highlighted escalating global challenges that could further complicate Canada's inflation trajectory. "Overall, inflationary risks have increased since July," he noted. The recent forecast from the BoC projects inflation on a "higher path than we expected last summer."
Additionally, Macklem pinpointed rising global tensions, specifically citing "the war in Israel and Gaza," as factors potentially driving energy prices up and disrupting supply chains, which could, in turn, amplify inflation pressures worldwide.
Outlook for Canada's economic growth also remains subdued, according to Macklem. "The economy has entered a period of weaker growth," he stated. GDP growth is anticipated to linger below 1% over the next several quarters before a potential upturn in late 2024, with an optimistic projection of a rise to 2.5% in 2025.
Looking ahead
Eurozone CPI and CPI flash are the main focuses in European session. France GDP and consumer spending, Germany import price and retail sales, Italy GDP, and Swiss retail sales will be featured too.
Later in the day, Canada GDP is the highlight. US will release house price index, Chicago PMI and consumer confidence.
USD/JPY Daily Outlook
Daily Pivots: (S1) 148.63; (P) 149.24; (R1) 149.67; More...
USD/JPY rebounded strongly despite dipping to 148.79. Intraday bias remains neutral at this point. On the upside, break of 150.76 will resume larger rise from 127.20 to 151.93 high. On the downside, below 148.79 will bring deeper pull back. But still, overall outlook will stay bullish as long as 147.28 support holds.
In the bigger picture, while rise from 127.20 is strong, it could still be seen as the second leg of the corrective pattern from 151.93 (2022 high). Rejection by 151.93, followed by sustained break of 145.06 resistance turned support will be the first sign that the third leg of the pattern has started. However, sustained break of 151.93 will confirm resumption of long term up trend.
Economic Indicators Update
| GMT | Ccy | Events | Actual | Forecast | Previous | Revised |
|---|---|---|---|---|---|---|
| 21:45 | NZD | Building Permits M/M Sep | -4.70% | -6.70% | -7.00% | |
| 23:30 | JPY | Unemployment Rate Sep | 2.60% | 2.60% | 2.70% | |
| 23:50 | JPY | Industrial Production M/M Sep P | 0.20% | 2.50% | -0.70% | |
| 23:50 | JPY | Retail Trade Y/Y Sep | 5.80% | 5.90% | 7.00% | |
| 00:00 | NZD | ANZ Business Confidence Oct | 23.4 | 1.5 | ||
| 00:30 | AUD | Private Sector Credit M/M Sep | 0.50% | 0.40% | ||
| 01:00 | CNY | NBS Manufacturing PMI Oct | 49.5 | 50.4 | 50.2 | |
| 01:00 | CNY | NBS Non-Manufacturing PMI Oct | 50.6 | 51.8 | 51.7 | |
| 03:28 | JPY | BoJ Interest Rate Decision | -0.10% | -0.10% | -0.10% | |
| 05:00 | JPY | Housing Starts Y/Y Sep | -6.80% | -6.20% | -9.40% | |
| 05:00 | JPY | Consumer Confidence Index Oct | 35.7 | 35.1 | 35.2 | |
| 06:30 | EUR | France Consumer Spending M/M Sep | 0.60% | -0.50% | ||
| 06:30 | EUR | France GDP Q/Q Q3 P | 0.10% | 0.50% | ||
| 07:00 | EUR | Germany Import Price Index M/M Sep | 0.40% | 0.40% | ||
| 07:00 | EUR | Germany Retail Sales M/M Sep | 0.50% | -1.20% | ||
| 07:30 | CHF | Real Retail Sales Y/Y Sep | -1.20% | -1.80% | ||
| 09:00 | EUR | Italy GDP Q/Q Q3 P | 0.10% | -0.40% | ||
| 10:00 | EUR | Eurozone GDP Q/Q Q3 P | 0.00% | 0.10% | ||
| 10:00 | EUR | Eurozone CPI Y/Y Oct P | 3.10% | 4.30% | ||
| 10:00 | EUR | Eurozone CPI Core Y/Y Oct P | 4.20% | 4.50% | ||
| 12:30 | CAD | GDP M/M Aug | 0.10% | 0.00% | ||
| 12:30 | USD | Employment Cost Index Q3 | 1.00% | 1.00% | ||
| 13:00 | USD | S&P/CS Composite-20 HPI Y/Y Aug | 0.30% | 0.10% | ||
| 13:00 | USD | Housing Price Index M/M Aug | 0.50% | 0.80% | ||
| 13:45 | USD | Chicago PMI Oct | 44.7 | 44.1 | ||
| 14:00 | USD | Consumer Confidence Oct | 100.4 | 103 |
Yen feels the heat as BoJ’s yield cap redefinition underwhelms
Japanese Yen is facing renewed pressure following BoJ's policy announcement, where expectations for significant changes were left largely unmet. Instead, the central bank introduced a minor tweak in the language concerning its yield cap, resulting in underwhelming market reactions. USD/JPY is back above 150 mark, after dipping to 148.79 overnight.
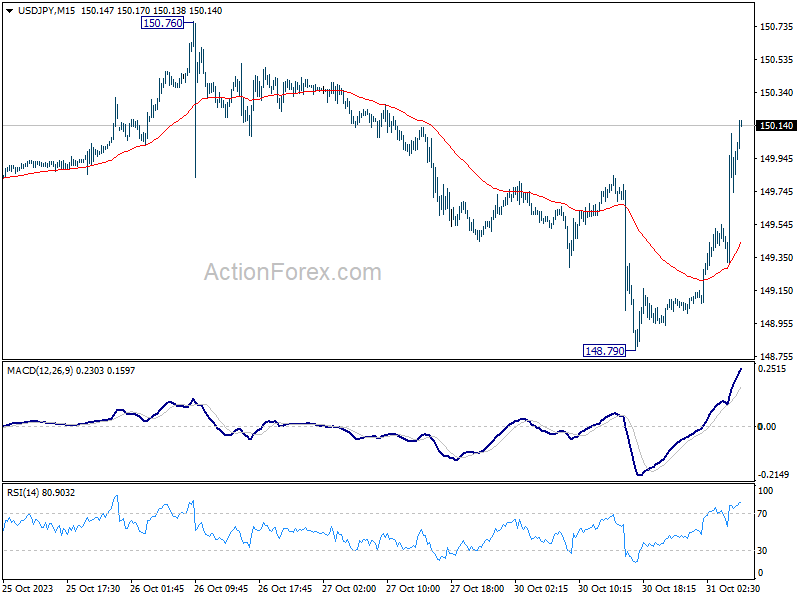
Under the Yield Curve Control framework, BoJ has maintained the short-term policy interest rate at -0.10%, while 10-year JGB yield target remains at around 0%. These decisions were reached unanimously. However, the central bank subtly altered its wording regarding the 10-year JGB yield cap, now referring to the 1.0% level as a "reference in its market operations." This move is perceived as transforming the cap into a flexible upper boundary rather than a strict limit.
Adding to this, BoJ stated, "Given extremely high uncertainties over the economy and markets, it's appropriate to increase flexibility in the conduct of yield curve control." This sentiment was not universally shared, as Nakamura Toyoaki expressed dissent, suggesting that increasing flexibility should be contingent upon confirming a rise to firms' earning power.
In a significant update, BoJ's new economic projections reveal upgraded core inflation forecasts across the board, with a noteworthy jump from 1.9% to 2.8% for fiscal 2024.
Here's a summary of the updated forecasts:
Core CPI Forecasts (July):
- Fiscal 2023: 2.8% (up from 2.5%)
- Fiscal 2024: 2.8% (up from 1.9%)
- Fiscal 2025: 1.7% (up slightly from 1.6%)
Core-Core CPI Forecasts:
- Fiscal 2023: 3.8% (up from 3.2%)
- Fiscal 2024: 1.9% (up from 1.7%)
- Fiscal 2025: 1.9% (up from 1.8%)
GDP Forecasts:
- Fiscal 2023: 2.0% (up from 1.3%)
- Fiscal 2024: 1.0% (down from 1.2%)
- Fiscal 2025: 1.0% (unchanged)
GBP/USD Recovery Could Face Hurdles, Oil Price Dips
Key Highlights
- GBP/USD is struggling to recover above the 1.2180 resistance zone.
- A major bearish trend line is forming with resistance near 1.2235 on the 4-hour chart.
- Gold price is struggling to gain pace above the $2,000 resistance.
- Oil prices are showing bearish signs and might decline below $83.50.
GBP/USD Technical Analysis
The British Pound started a fresh decline from the 1.2290 zone against the US Dollar. GBP/USD traded below the 1.2200 support to enter a bearish zone.
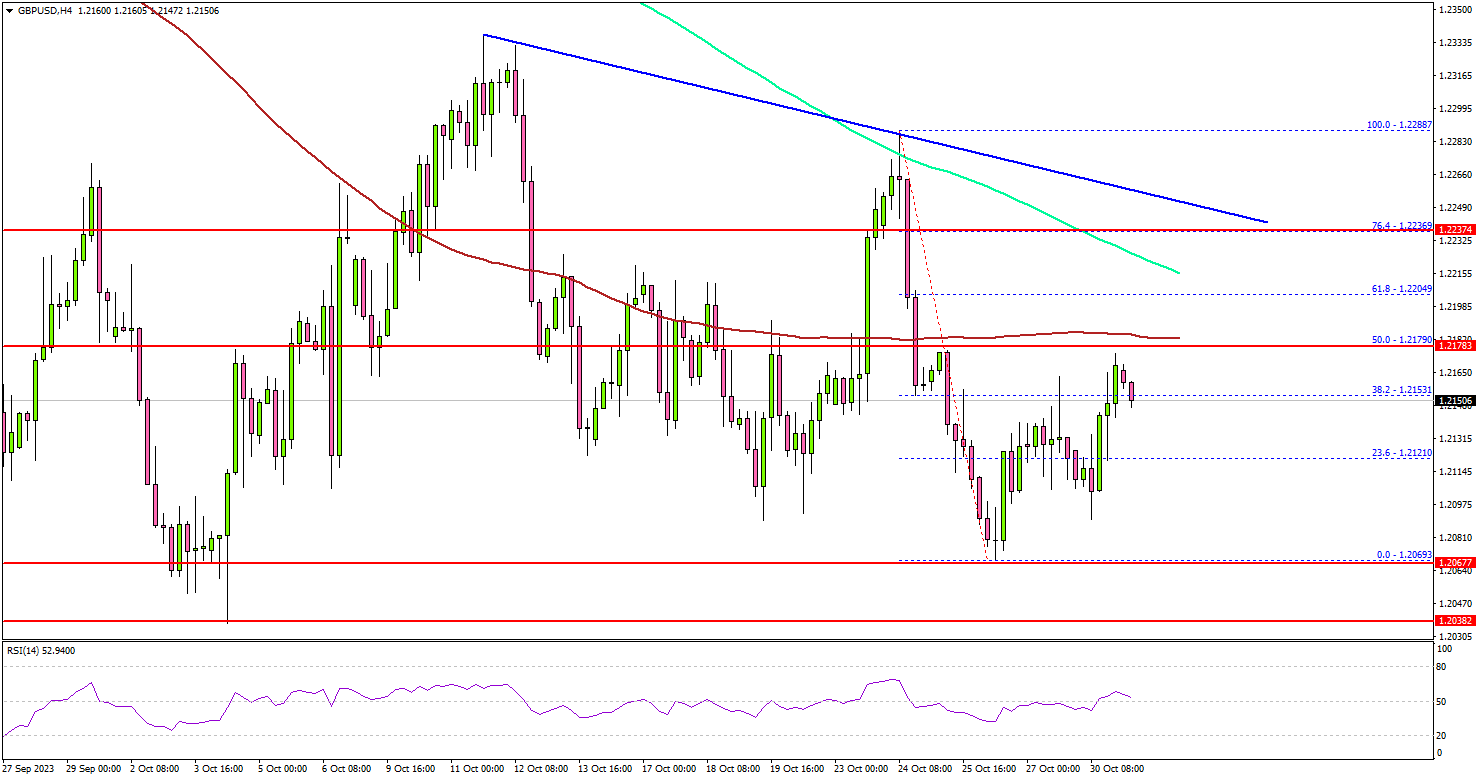
Looking at the 4-hour chart, the pair settled well below the 1.2200 level, the 100 simple moving average (red, 4 hours), and the 200 simple moving average (green, 4 hours).
Finally, the bulls appeared near the 1.2070 zone. A low was formed near 1.2069 before the pair started a consolidation phase. It corrected above the 23.6% Fib retracement level of the downward move from the 1.2288 swing high to the 1.2069 low.
On the upside, the pair might face strong resistance near the 1.2180 level. It is near the 50% Fib retracement level of the downward move from the 1.2288 swing high to the 1.2069 low and the 100 simple moving average (red, 4 hours).
The next key resistance is near 1.2235 and the trend line, above which the pair could rise toward the 1.2285 level. If there is a clear move above 1.2285, the pair could rise toward the 1.2350 resistance.
If there is a fresh decline, the pair might find bids near 1.2070. The next key support is seen near 1.2045, below which it could test 1.2000. Any more losses might send the pair toward the 1.1920 level.
Looking at oil, the bulls are still struggling and there seems to be a possibility of more losses below the $83.50 level.
Economic Releases
- Euro Zone Gross Domestic Product for Q3 2023 (Prelim) (QoQ) - Forecast 0%, versus 0.1% previous.
China’s official PMI indicates manufacturing back in contraction and non-Manufacturing slows
China's economic pulse seems to have lost its rhythm, as indicated by the latest PMI figures for October. The official PMI Manufacturing dropped from 50.2 to 49.5, falling below the anticipated 50.4 mark. This downturn is not an isolated occurrence; the manufacturing sector has experienced contraction in six out of the ten months of 2023 so far.
In a similar vein, PMI Non-Manufacturing sector witnessed a decrease, moving from 51.7 to 50.6, which is also below the projected 51.8. Compounding these concerns is PMI Composite, which aggregates both manufacturing and non-manufacturing sectors. It fell from 52.0 to 50.7, registering its lowest reading since December 2022.
National Bureau of Statistics senior statistician Zhao Qinghe acknowledged these challenges in a statement. He noted, "China's economic activity fell to an extent, and the foundation for a continued recovery still needs to be further solidified."
Japan’s industrial output lags behind expectations; retail sales see mixed results
Japan's industrial production in September posted subdued growth, clocking in at only 0.2% mom, significantly below the anticipated rise of 2.5% mom. When compared year-on-year , the figures revealed a drop of -4.6% yoy. Furthermore, the output for the third quarter (July-September) saw a decline, registering at -1.3% compared to the preceding quarter. In terms of a seasonally adjusted index, the production at factories and mines was at 103.3, benchmarked against 2020 base of 100.
Feedback from manufacturers, as sourced by the Ministry of Economy, Trade and Industry, paints a mixed picture for the upcoming months. They project an increase in the seasonally adjusted output by 3.9% for October, followed by a decline of -2.8% in November.
Retail statistics for September also indicated a mix of growth and contraction. On a yearly basis, retail sales rose by 5.8% yoy, narrowly missing forecasted 5.9% yoy. However, assessing the data month-on-month reveals a slight decline of -0.1% mom in retail sales.
On the job front, there's a glimmer of positive news. Unemployment rate experienced a marginal dip, moving from 2.7% to 2.6%, aligning with market expectations. The jobs-to-applicant ratio for September remained steady at 1.29, signifying that there were 129 job opportunities available for every 100 job seekers.
NZ ANZ business confidence jumped to 23.4, inflation pressures remain
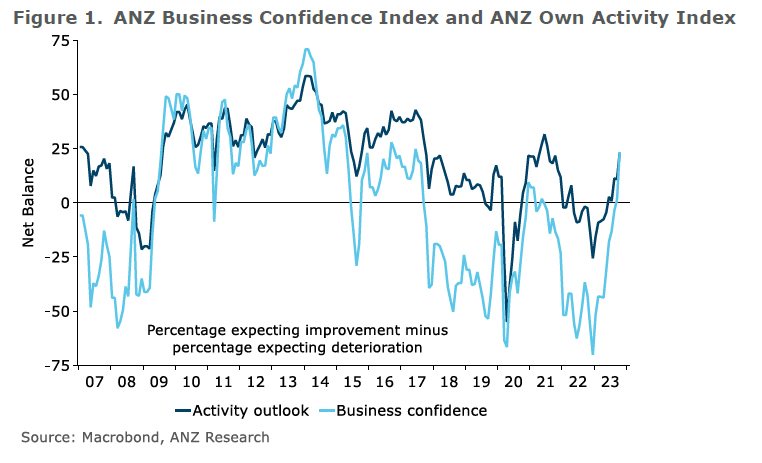
New Zealand's ANZ Business Confidence for October showcased a significant rise, moving from 1.5 to a robust 23.4. This upbeat sentiment was mirrored in the Own Activity outlook, which climbed from 10.9 to 23.1.
A broader analysis of the report's details reveals positive shifts across multiple components: Export intentions rose from -0.4 to 6.1, Investment intentions moved from a negative -4.1 to a positive 3.8, and Employment intentions took a jump from 1.2 to 5.6.
However, while these figures indicate growing optimism in business activities and prospects, inflation front remains a concern. Cost expectations reduced slightly from 78.6 to 76.0. Similarly, Pricing intentions saw a minor drop, moving from 47.1 to 46.3. Inflation expectations also experienced a negligible downtick, adjusting from 4.95% to 4.94%.
Reacting to these numbers, ANZ remarked, "Just as we thought that the rebound in activity indicators in the ANZ Business Outlook survey might be running out of steam, we've seen a marked jump across most."
The bank also cautioned against hasty conclusions based on the current data, especially considering the potential disruptions from the election, suggesting a wait-and-watch approach: "we'll see whether the newfound (relative) optimism persists over the next few months."
On the inflation front, ANZ noted that, "inflation pressures are gradually waning in the big picture." Despite this, the bank emphasized that significant progress in curbing inflation has been missing over recent months. The journey back to the inflation target remains substantial. "We continue to expect it'll take at least one more OCR hike to get us there."
BoC’s Macklem Sounds Inflation Alarm Amid Global Tensions
BoC Governor Tiff Macklem provided a sobering insight into Canada's economic prospects during a parliamentary committee session overnight. Highlighting the central bank's decision to maintain policy rate at 5.00% last week, Macklem emphasized the decision was taken to allow monetary policy "time to do its job." However, he shared concerns that any reduction in inflation is "likely to be slow" and notably mentioned that "inflationary risks have increased."
Despite expectations for inflation to slowly revert to 2% target by 2025, the Governor expressed apprehension, stating, "we're worried that higher energy prices and persistence in underlying inflation are slowing progress."
Macklem highlighted escalating global challenges that could further complicate Canada's inflation trajectory. "Overall, inflationary risks have increased since July," he noted. The recent forecast from the BoC projects inflation on a "higher path than we expected last summer."
Additionally, Macklem pinpointed rising global tensions, specifically citing "the war in Israel and Gaza," as factors potentially driving energy prices up and disrupting supply chains, which could, in turn, amplify inflation pressures worldwide.
Outlook for Canada's economic growth also remains subdued, according to Macklem. "The economy has entered a period of weaker growth," he stated. GDP growth is anticipated to linger below 1% over the next several quarters before a potential upturn in late 2024, with an optimistic projection of a rise to 2.5% in 2025.
Eurozone Growth Expected to Stagnate, Can the Euro Hold On?
- Eurozone economy likely stagnated or contracted in third quarter
- Euro has been under selling pressure and could remain heavy
- Growth and inflation data will be released at 10:00 GMT Tuesday
Flirting with recession
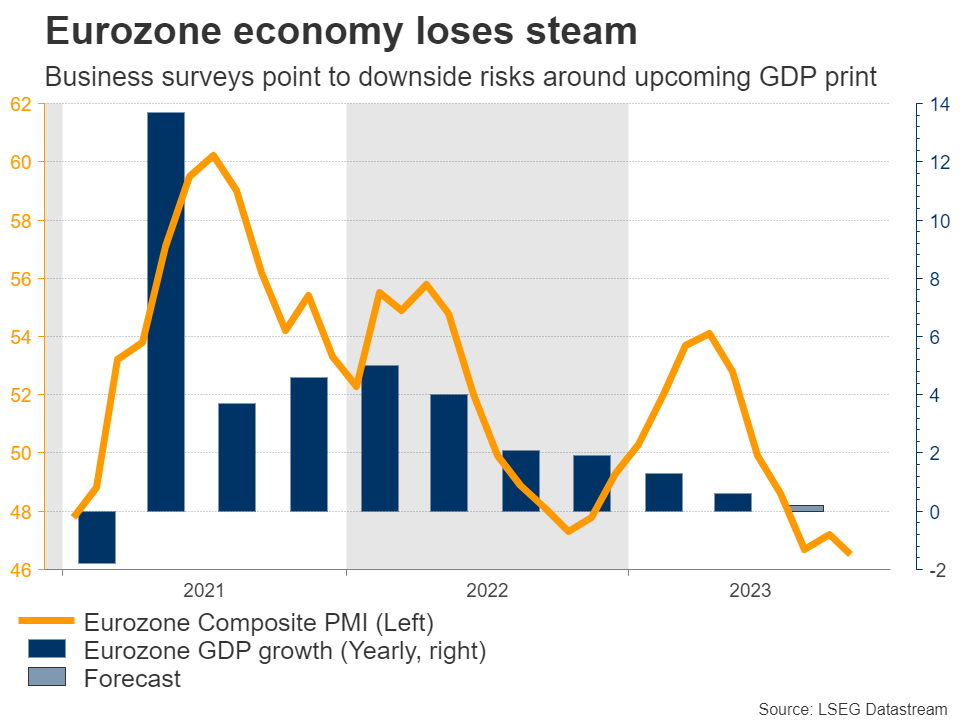
The Eurozone economy has struggled this year, as consumers have been squeezed by rising mortgage costs and elevated energy prices. Economic growth in the second quarter slowed to just 0.5% on a yearly basis, and business surveys warn that the situation will probably get worse, putting the risk of a mild recession on the radar.
Germany is responsible for much of this weakness. Haunted by the problems in global manufacturing and softer demand conditions among key trade partners such as China, the Eurozone’s largest economy has suffered serious damage and is on track to shrink 0.4% this year according to the German government’s own forecasts.
With recessionary clouds gathering, the European Central Bank has adopted a more cautious stance, signaling that interest rates have most likely reached their peak already, as inflation continues to cool off. In this sense, the question facing investors now is how soon interest rates will be cut, something that markets are pricing in for next summer.
GDP and inflation stats
Turning to the upcoming data releases, GDP growth in the Eurozone is projected to have stagnated in the third quarter, with forecasts pointing to 0% growth in quarterly terms. As for any potential surprises, the risks seem tilted to the downside.
Business surveys from S&P Global were consistent with a GDP contraction of 0.4% during the quarter, which suggests that there’s scope for a disappointment in this dataset relative to forecasts.
Similarly, inflation is anticipated to have fallen sharply in October, with the headline CPI rate expected to decline to 3.2% from 4.3% in the previous month. This was also reflected in business surveys, where firms reported the slowest increase in their selling prices since early 2021.
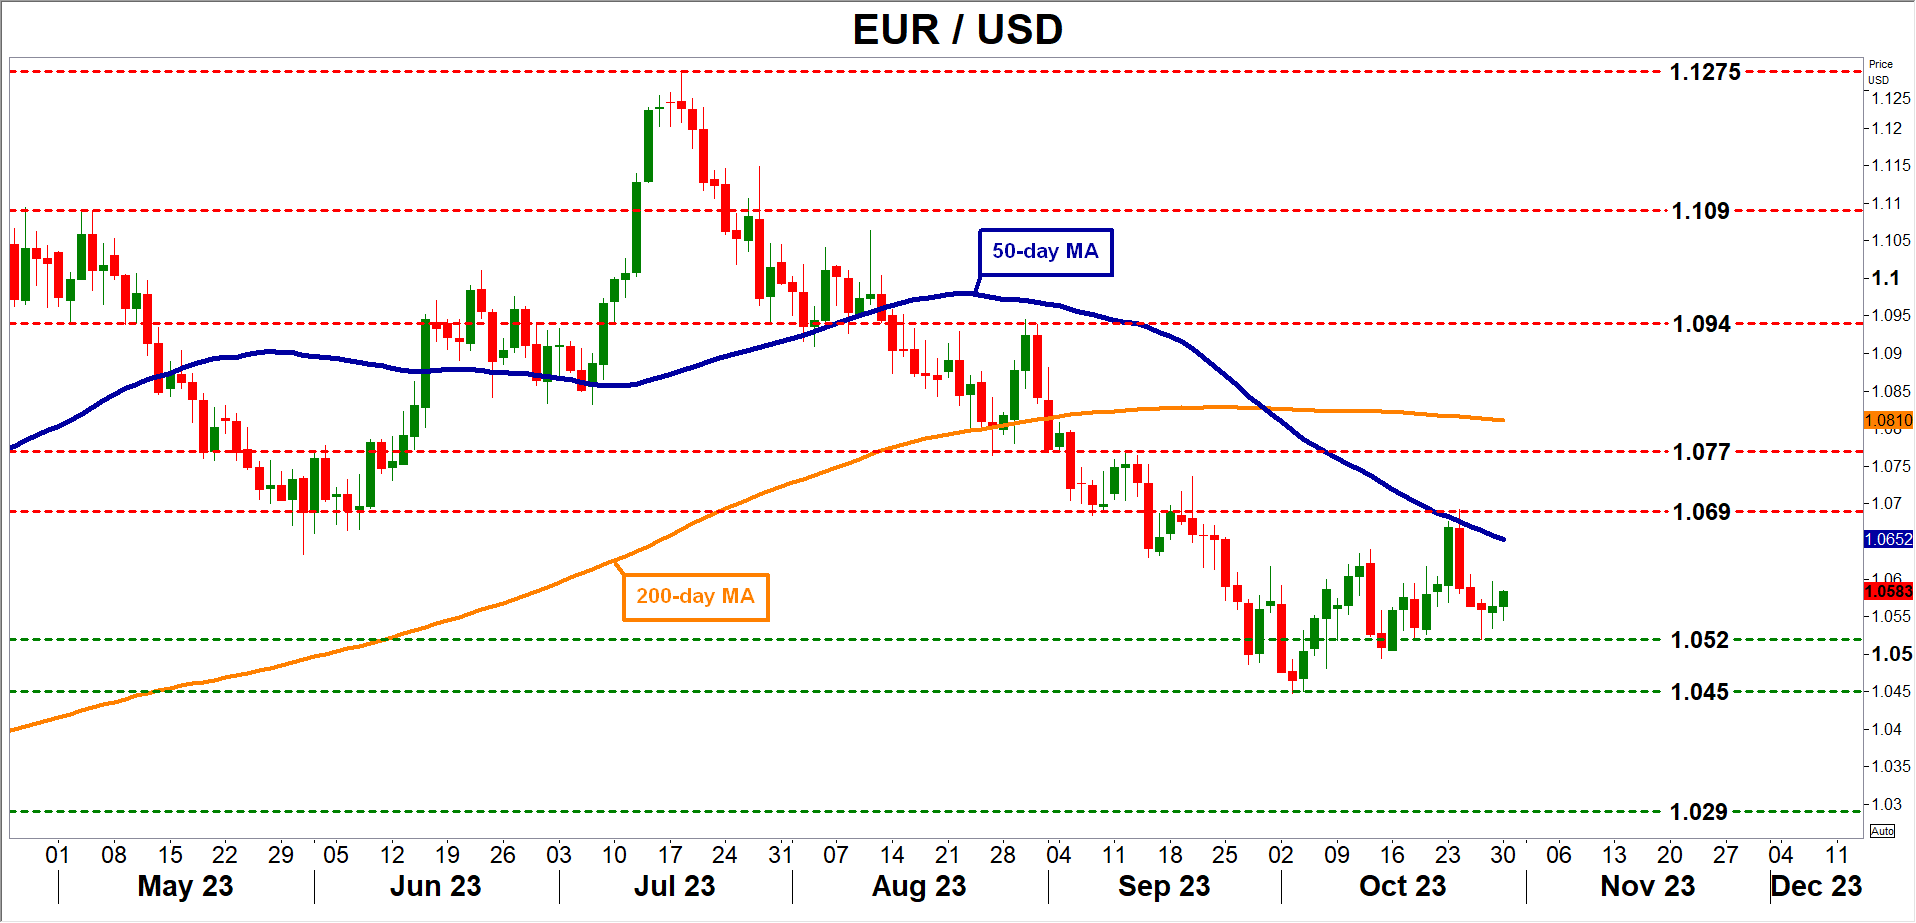
A potential disappointment in this dataset could fuel speculation that the ECB will cut rates even sooner than markets expect next year, and by extension inflict more damage on the wounded euro. Looking at the euro/dollar chart, the 1.0520 zone could act as an initial barrier to any downside moves. If sellers can pierce through, the focus would shift to the October low of 1.0450.
On the flipside, a surprisingly strong round of data releases could help the euro recover some ground. In this case, the recent local high near 1.0690 could come into play.
Euro outlook appears gloomy
In the big picture, there isn’t much to like about the euro at this stage. Germany’s export-driven business model has been decimated by high energy costs and sluggish growth in export markets like China, while sky-high borrowing rates continue to suppress consumer demand across Europe.
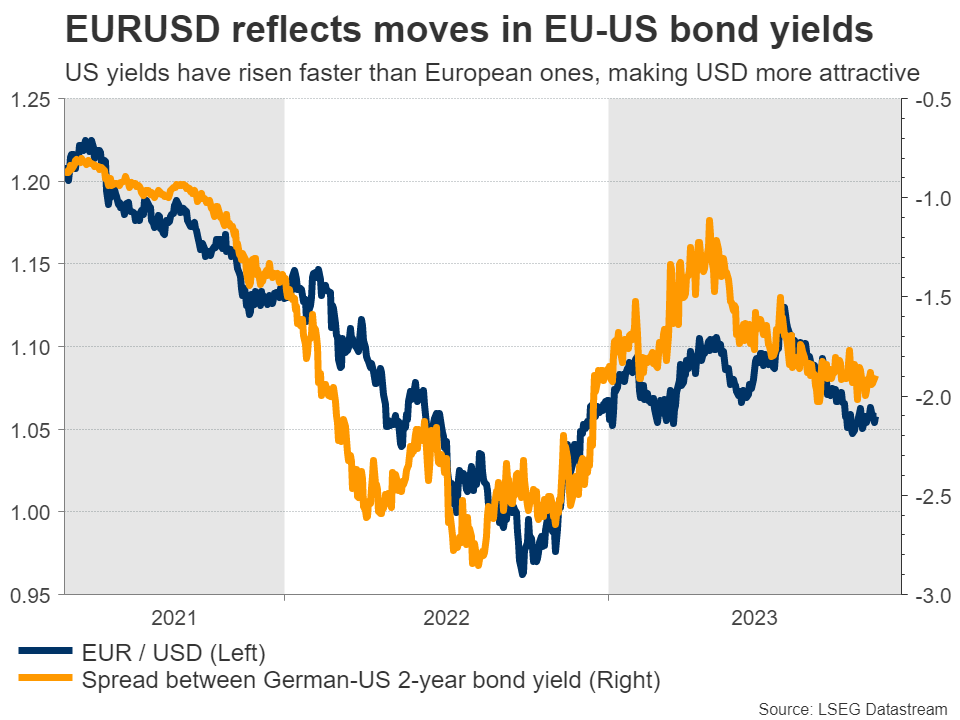
Worse of all, there’s no stimulus on the horizon to help safeguard economic growth. Most governments have reined in their pandemic-era spending measures and are hesitant to roll out new programs until inflation dies out. Therefore, the growth outlook is already dark and it probably needs to become even worse before European governments ride to the rescue.In contrast, the US economy is far more resilient. Economic activity even accelerated during the summer, with some help from powerful government spending. In other words, both interest rate and economic growth differentials currently favor the US over Europe, and as long as this is the case, the downtrend in euro/dollar might remain in force.