Sample Category Title
Eurozone CPI slows to 2.9% yoy, lowest since Jul 2021
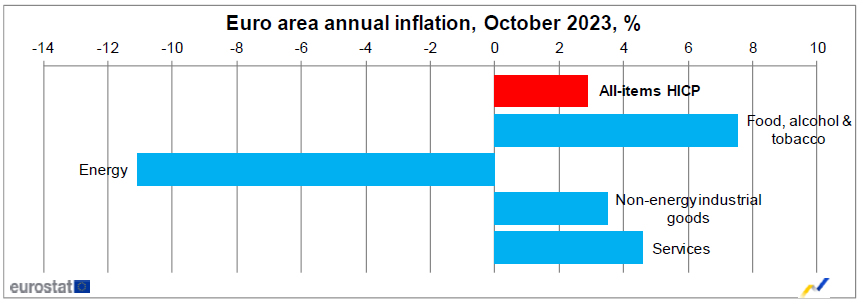
Eurozone CPI cooled off further in October, decelerating from 4.3% yoy to 2.9% yoy. This slowdown in inflation was more pronounced than market predictions, which had forecasted a rate of 3.1% yoy. Notably, this is the most muted inflation pace the region has experienced since July 2021.
Excluding volatile components in energy, food, alcohol, and tobacco, core CPI experienced a deceleration from 4.5% yoy to 4.2% yoy, hitting its lowest mark since July 2022, and meeting the predictions set by market experts.
Breaking down the main components of inflation, food, alcohol, and tobacco observed the most significant annual inflation rate for October, registering 7.5% compared to 8.8% in September. Services prices recorded a marginal decline, moving from 4.7% in September to 4.6% in October. Non-energy industrial goods also experienced a slowdown, with prices rising 3.5% in October compared to 4.1% in the preceding month.
However, the most dramatic shift was observed in the energy component. Prices in this segment plummeted to -11.1% in October from -4.6% in September, reflecting the volatile nature of global energy markets.
Eurozone GDP contracts -0.1% qoq in Q3, EU grows 0.1% qoq
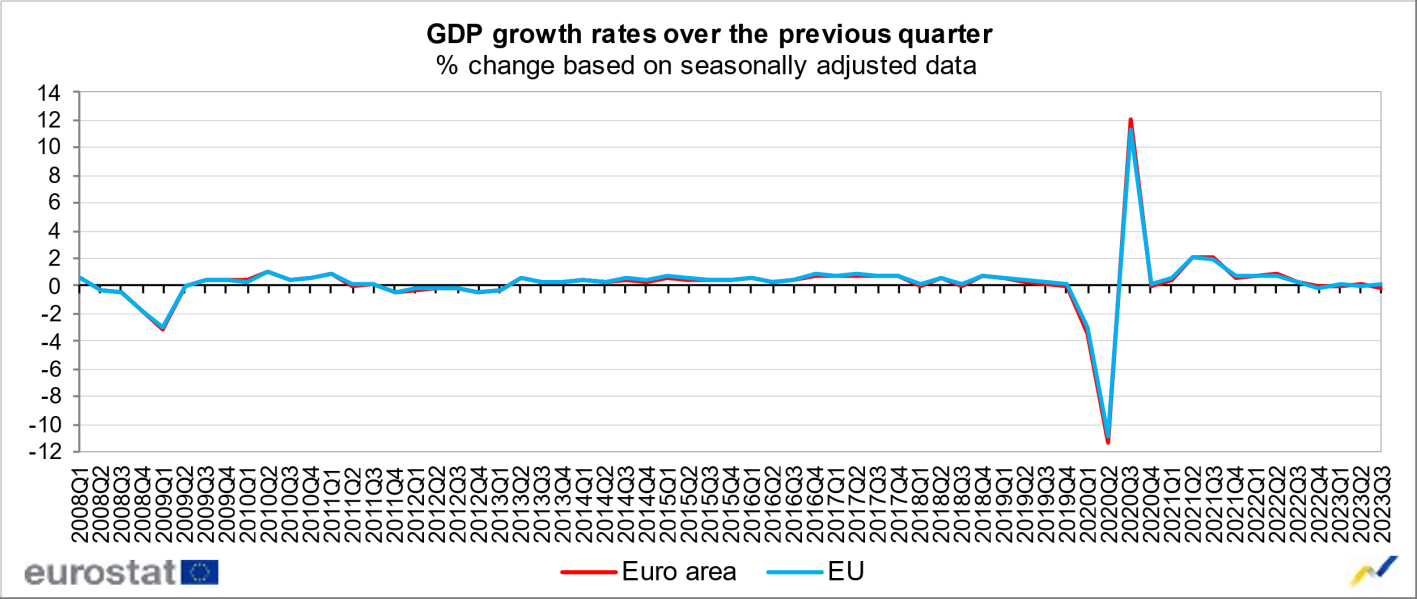
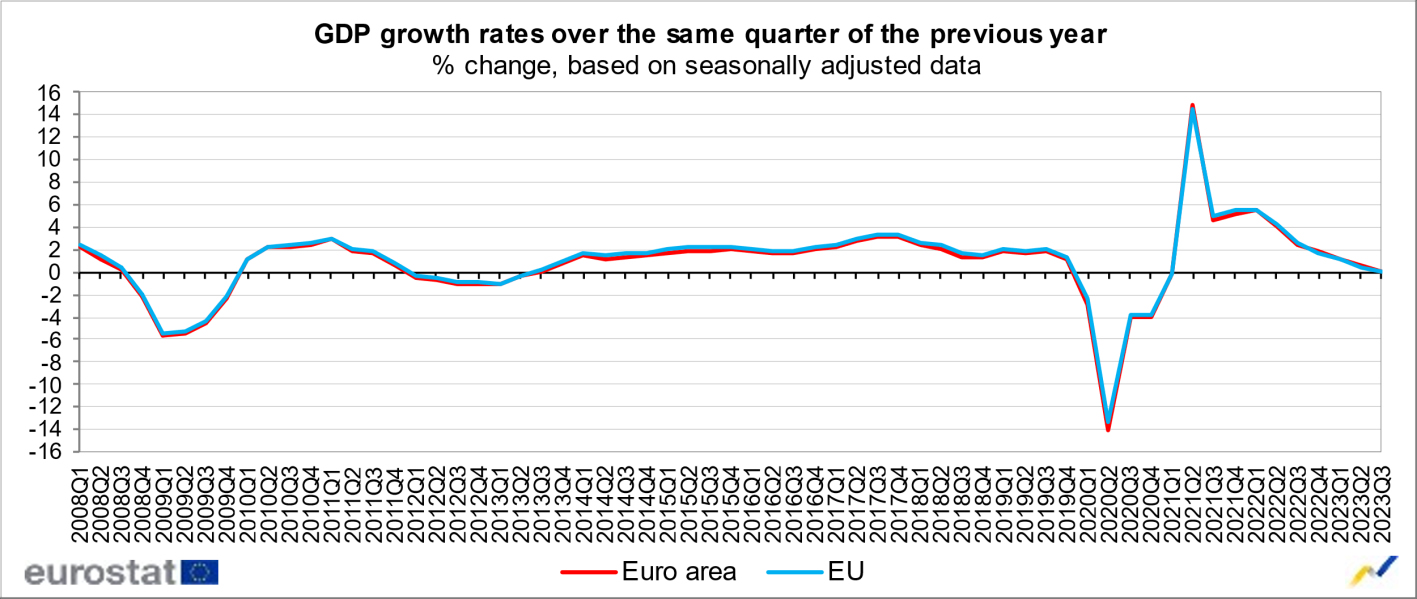
Eurozone's GDP shrank unexpectedly in Q3, contracting by -0.1% qoq, defying expectations of a stagnant 0.0% growth. When compared with the same quarter of the previous year, Eurozone's growth was barely positive at 0.1% yoy. Meanwhile, the broader EU reported a similar pattern, with a 0.1% growth both qoq and yoy.
The performance across member states varied significantly. Latvia emerged as the top performer with 0.6% growth over the previous quarter, followed by Belgium and Spain, recording 0.5% and 0.3% growth respectively. Conversely, Ireland faced the steepest decline with a -1.8% contraction, followed by Austria at -0.6% and Czechia at -0.3%.
Year-on-year growth rates revealed a similar disparity among the member states. Portugal, Spain, and Belgium led the way with 1.9%, 1.8%, and 1.5% growth respectively. However, Ireland experienced a sharp -4.7% decline, with Estonia (-2.5%), Austria and Sweden (-1.2% both) also facing significant contractions.
USD/JPY Analysis: Playing With Fire Continues
Yesterday, the Nikkei newspaper reported that the Bank of Japan is considering adjusting its yield curve control (YCC) policy.
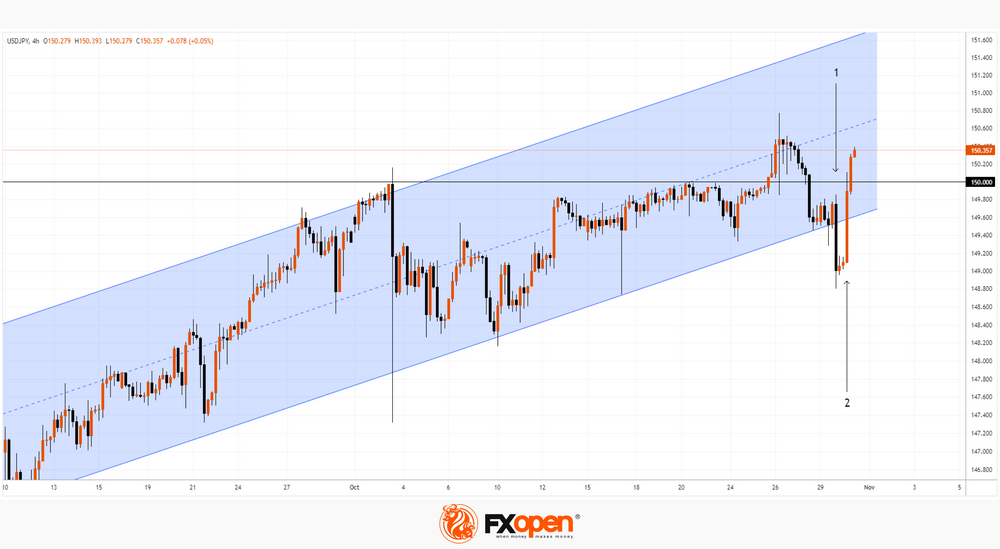
This provoked a strengthening of the yen (1). The USD/JPY rate dropped to a two-week extreme of 148.8 per US dollar in anticipation of news from the Bank of Japan.
The news followed this morning (2). The Bank of Japan kept interest rates at -0.1% and also said the 1% ceiling on the benchmark 10-year yield would be an upper bound rather than a hard limit.
As a result of the Bank's decision, the USD/JPY rate returned to the area above 150 yen per US dollar.
Wherein:
- the price formed a false breakout of the ascending channel (shown in blue). The decline to the level of USD 149 formed a trap for the bears, who are forced to come out of losses today, thereby pushing USD/JPY even higher;
- if the momentum continues, the price may reach the channel median line.
Thus, the upward trend may develop, the main danger for which will be (usually unexpected) statements by officials from the Ministry of Finance and/or the Bank of Japan, which could provoke sharp fluctuations like what has happened in recent days.
This article represents the opinion of the Companies operating under the FXOpen brand only. It is not to be construed as an offer, solicitation, or recommendation with respect to products and services provided by the Companies operating under the FXOpen brand, nor is it to be considered financial advice.
GBPUSD Consolidates Near October Lows
- GBPUSD stuck in a range after steep decline pauses
- Creates a pennant pattern, hinting at potential breakout
- Oscillators suggest that positive momentum is slowly picking up
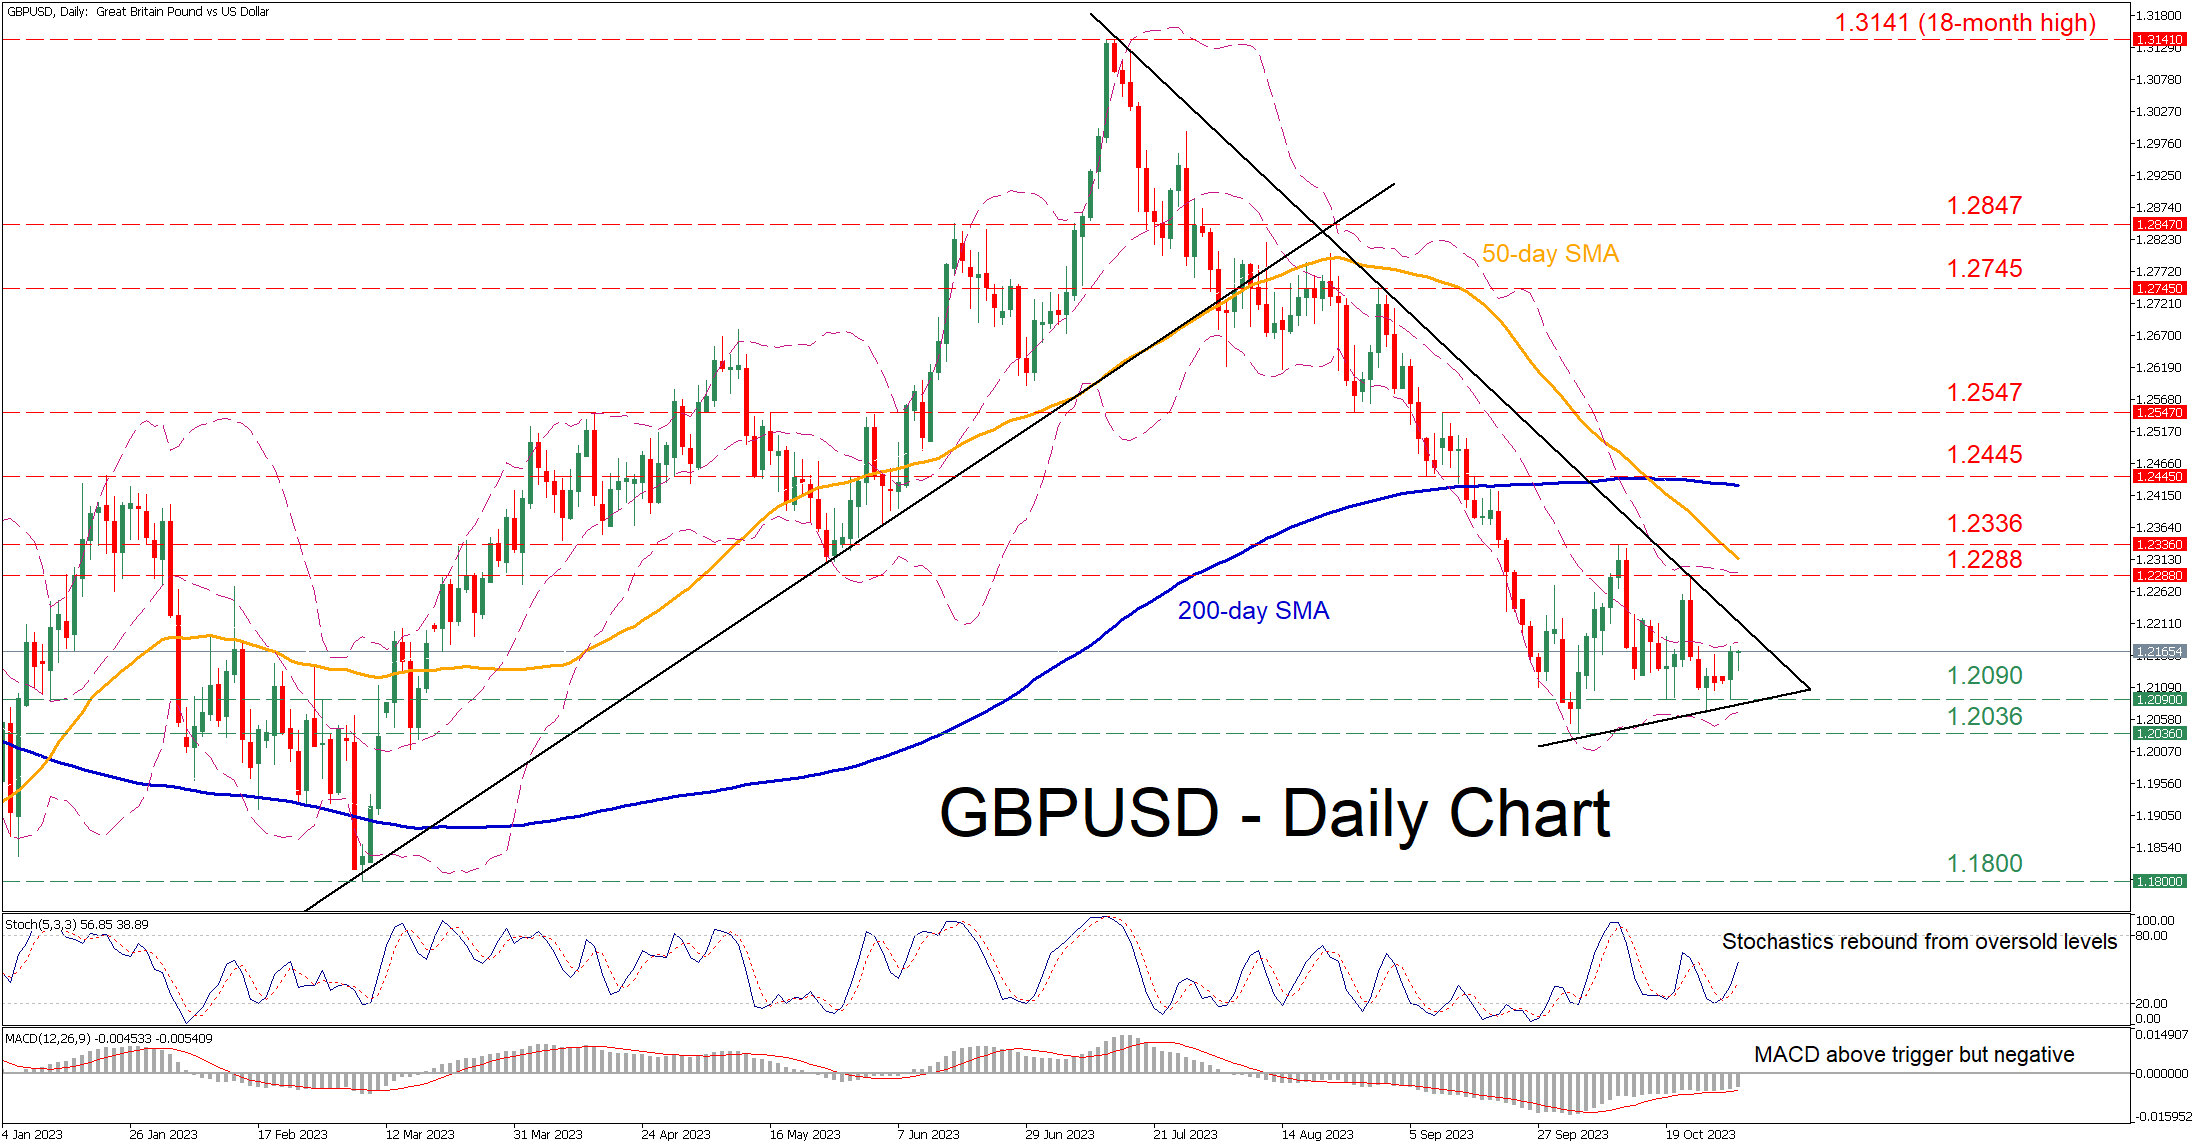
GBPUSD had been forming a profound structure of lower highs and lower lows since its 18-month peak of 1.3141. Although the pair managed to find its feet at the seven-month low of 1.2036, it has been rangebound for almost a month, failing to stage a solid recovery.
Should buying interest intensify, the recent resistance of 1.2288 could act as the first barrier for the bulls to clear. Surpassing that zone, the price could advance towards the October peak of 1.2336. A break above that level could open the door for the December-January resistance zone of 1.2445, which lies close to the 200-day simple moving average (SMA).
Alternatively, if the price moves lower, initial declines could cease around the 1.2090 support territory. Failing to halt there, the pair may challenge the seven-month low of 1.2036. Even lower, the March bottom of 1.1800 could provide downside protection.
In brief, GBPUSD remains a prisoner within its tight range, appearing unable to erase part of its steep retreat. However, the pair has been forming a pennant in the short term, raising the odds for a breakout move towards either direction.
EURJPY Speeds Up after BoJ’s Flexible Tone
- EURJPY gains strong momentum; recoups previous losses
- Technical signals improve but major resistance intact
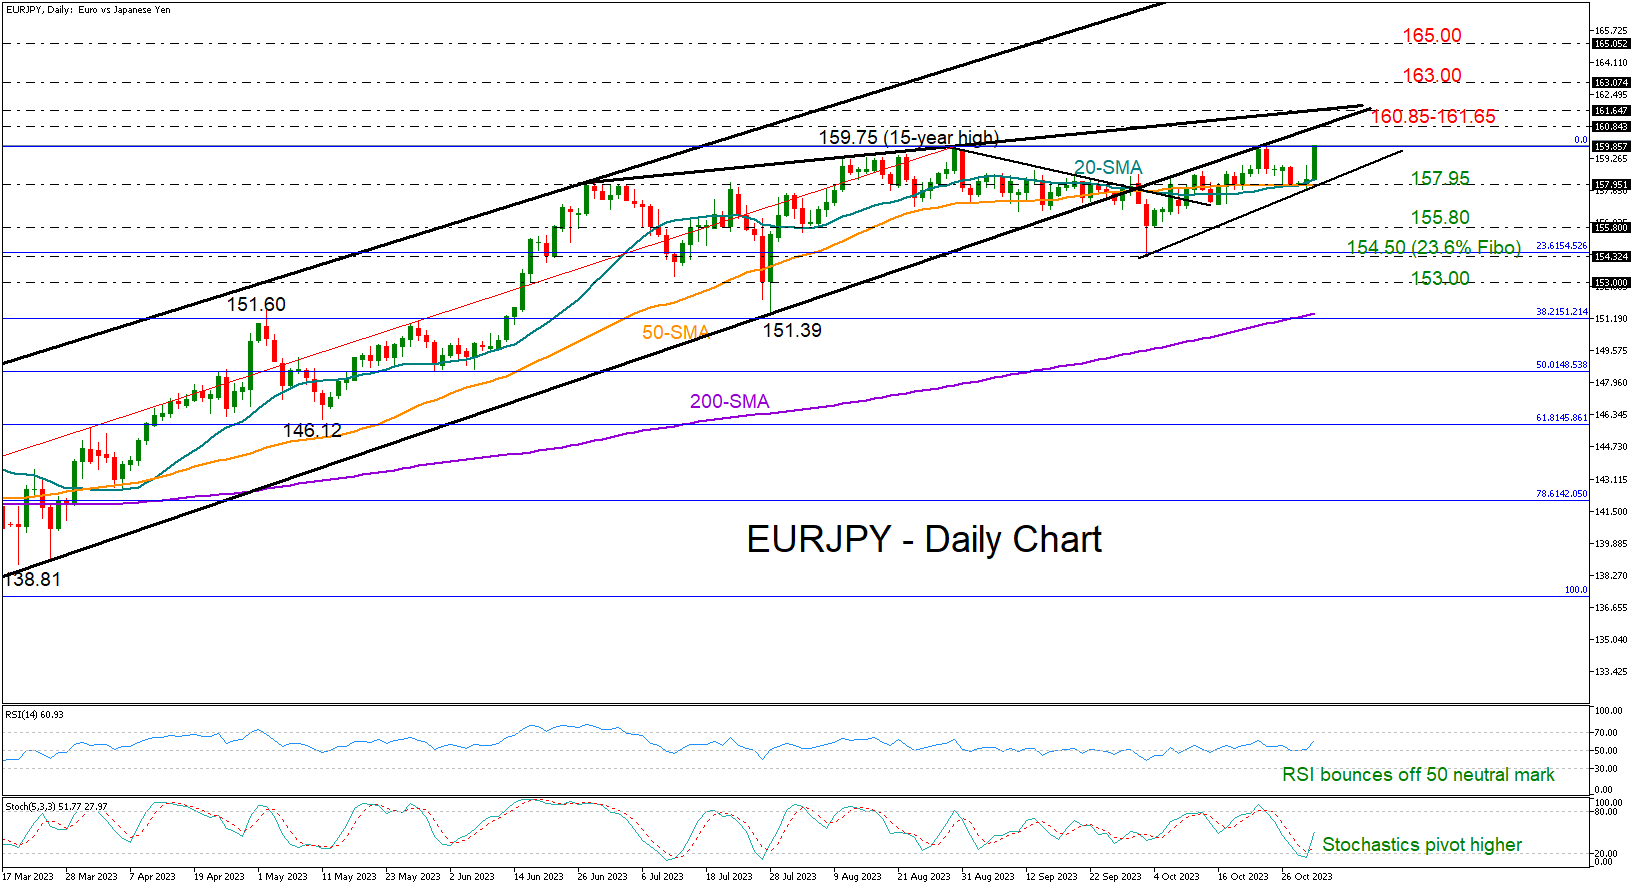
EURJPY sped up to the 159.00 area on Tuesday after the Bank of Japan (BoJ) kept its yield curve control at 1.0%, but softened its language to allow any breaches above that threshold, disappointing those who expected a higher bar at 1.25-1.50%.
The pair is currently flirting with August's 15-year high of 159.75, which cooled last week’s bullish actions, but a bigger challenge could occur within the 160.85-161.65 trendline region. A move higher could immediately reach the 163.00 barrier, while a more aggressive rally could cease near the 165.00 round level, both last seen in 2008.
In technical indicators, the RSI and the stochastic oscillator have rotated higher, endorsing the bullish momentum in the price. A pullback below the 20- and 50-day simple moving averages (SMAs) at 157.95 could be enough to bring the bears back into play, shifting the spotlight to October’s base of 155.80. If selling pressure intensifies there, the door will open for the 23.6% Fibonacci retracement mark of the previous uptrend at 154.50 and then for the 153.00 mark.
Overall, EURJPY keeps fluctuating within a neutral zone. Despite the improving technical signals, the pair needs to advance above 161.65 to upgrade the outlook to bullish.
AUD/USD Technical: Potential Residual Push Down Within Bullish Reversal Configuration
- The price actions of AUD/USD have started to oscillate within an impending “Descending Wedge” bullish reversal configuration.
- The emergence of the “Descending Wedge” coupled with positive reading seen in the daily RSI momentum indicator indicates its current medium-term downtrend phase from the 3 February 2023 high may be coming to its tail-end.
- In the short term, the AUD/USD is at risk of staging a potential residual push down to retest the lower boundary of the “Descending Wedge” acting as support at 0.6270/6260.
- Watch the key short-term resistance at 0.6395 on the AUD/USD.
The price actions of AUD/USD have indeed continued to churn lower towards 0.6310 support as highlighted in our last report.
It printed a recent intraday low of 0.6270 last Thursday, 26 October, and staged a bounce of +113 pips to hit a high of 0.6384 yesterday, 30 October (US session) as we await key external economic data out from China, the NBS Manufacturing and Non-Manufacturing PMI data for October that may impact the movements of the AUD/USD due to Australia’s close trading ties with China.
Consensus estimates have indicated another month of slow recovery in manufacturing and services activities in China for October, but the manufacturing PMI has slipped back to contraction mode with a reading of 49.5 from 50.2 in September while growth in the non-manufacturing PMI inched lower to 50.6, below consensus of 51.8 and September print of 51.7.
Let’s look at the AUD/USD from the lens of technical analysis.
An impending medium-term bullish reversal configuration has emerged
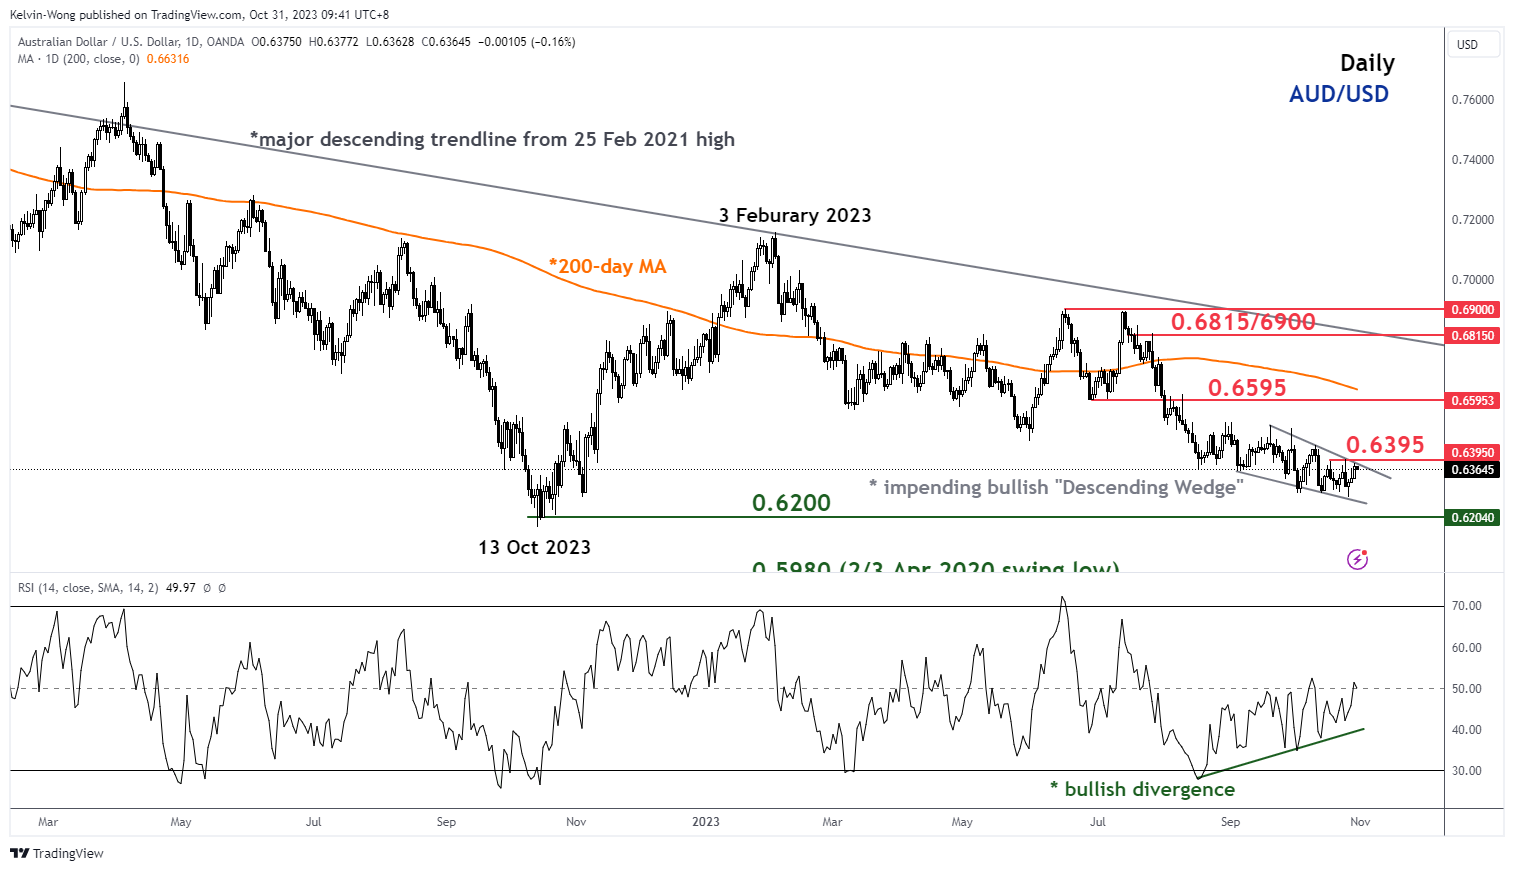
Fig 1: AUD/USD medium-term trend as of 31 Oct 2023 (Source: TradingView, click to enlarge chart)
Since its 5 September 2023 low of 0.6357, the AUD/USD has started to oscillate within an ongoing eight-week impending “Descending Wedge” configuration with its downside momentum abating as indicated by the bullish divergence condition being flashed out in the daily RSI momentum indicator after it hit its oversold region on 17 August 2023.
These observations (price actions pattern coupled with readings seen in momentum indicator) tend to suggest that the medium-term downtrend from the 1 February 2023 high is likely to be approaching its tail-end where a potential imminent bullish reversal may occur next.
The upper limit (resistance) of the impending “Descending Wedge” bullish reversal configuration stands at 0.6395.
Short-term momentum is still bearish
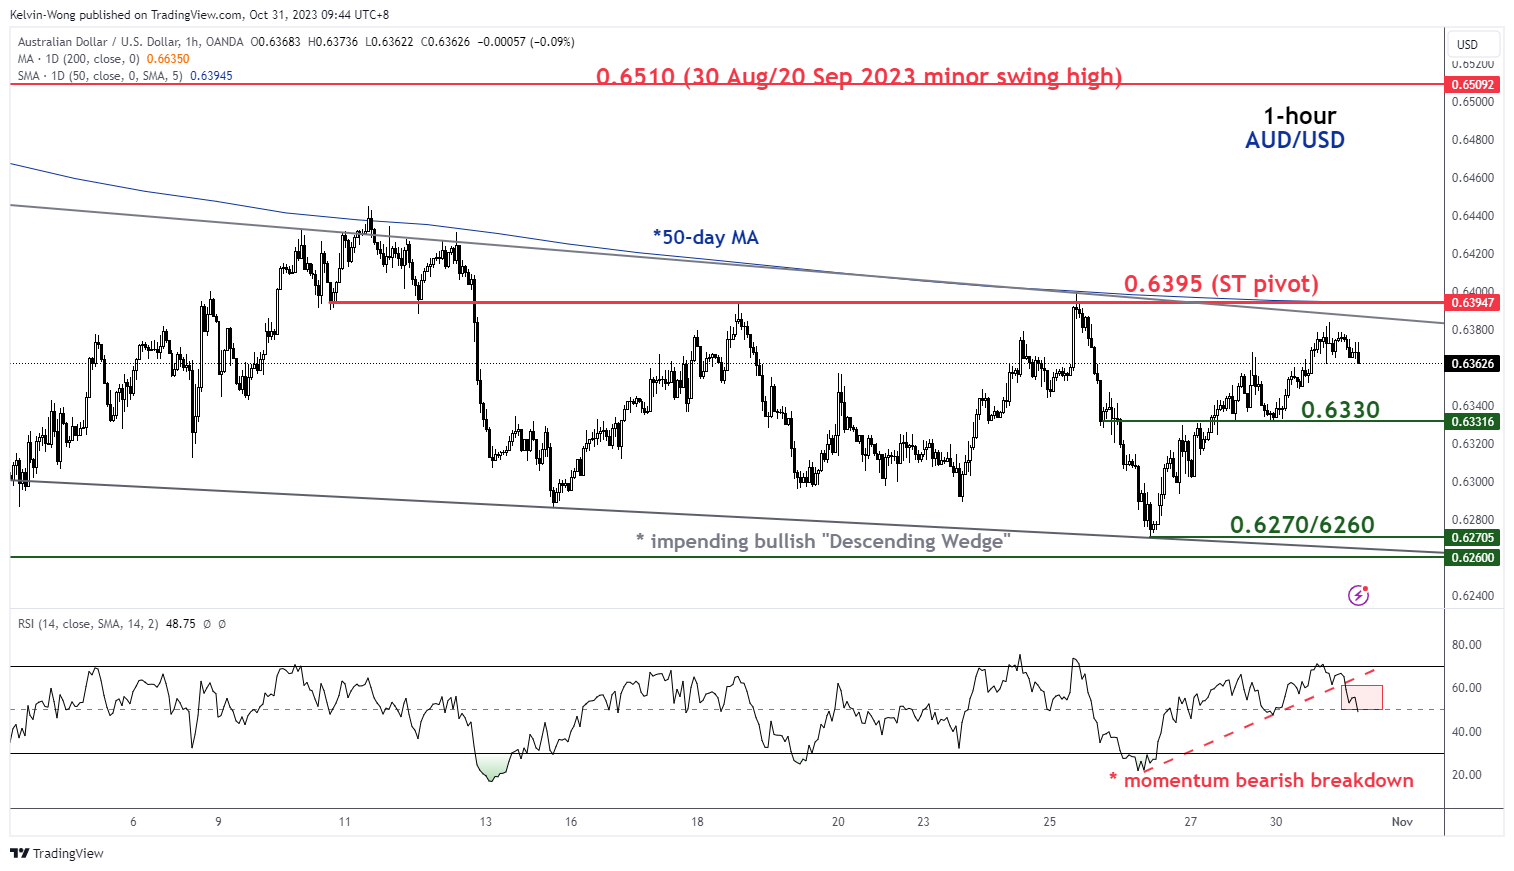
Fig 2: AUD/USD minor short-term trend as of 30 Oct 2023 (Source: TradingView, click to enlarge chart)
In the shorter-term 1-hour chart, the price actions of AUD/USD may shape a potential residual push down to retest the lower boundary of the “Descending Wedge” bullish reversal configuration as indicated by the momentum bearish breakdown condition seen in the 1-hour RSI indicator after it reached its overbought region yesterday, 30 October.
Watch the 0.6395 key short-term pivotal resistance (upper boundary of the “Descending Wedge” & 50-day moving average) for a potential slide toward the immediate supports of 0.6330 and 0.6270/6260 (lower boundary of the “Descending Wedge” & Fibonacci extension) before a potential recovery takes form.
However, a clearance above 0.6395 invalidates the bearish residual push down scenario for a bullish breakout to see the next intermediate resistance coming in at 0.6510 (30 Aug/20 September 2023 minor swing high) in the first step.
Bitcoin Triangle and Altcoin Growth
Market picture
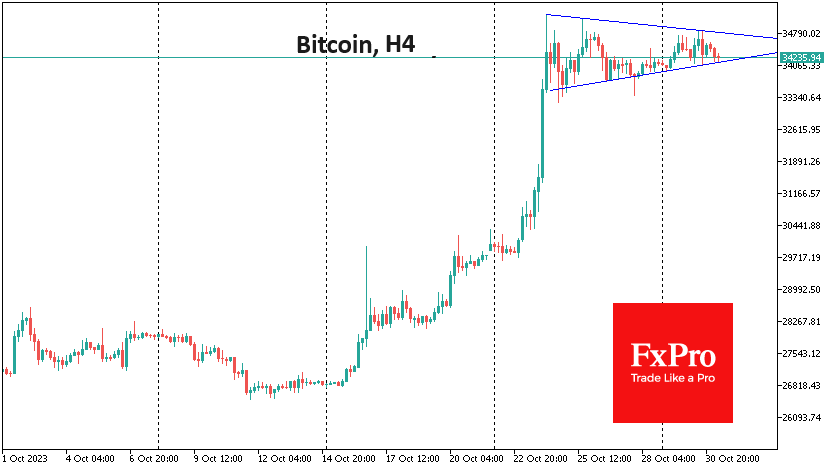
The value of bitcoin has changed little over the past 24 hours, remaining at $34.3K – in the centre of the consolidation range of the past seven days. This ability to hold at new, much higher levels is inspiring altcoin buyers, and the market capitalisation of the entire market has increased by 0.6% over the past 24 hours.
Bitcoin is forming a triangle on the daily chart. It is generally believed that such consolidation formations end with an upward breakout. Confirmation, in this case, would be an exit above $35K.
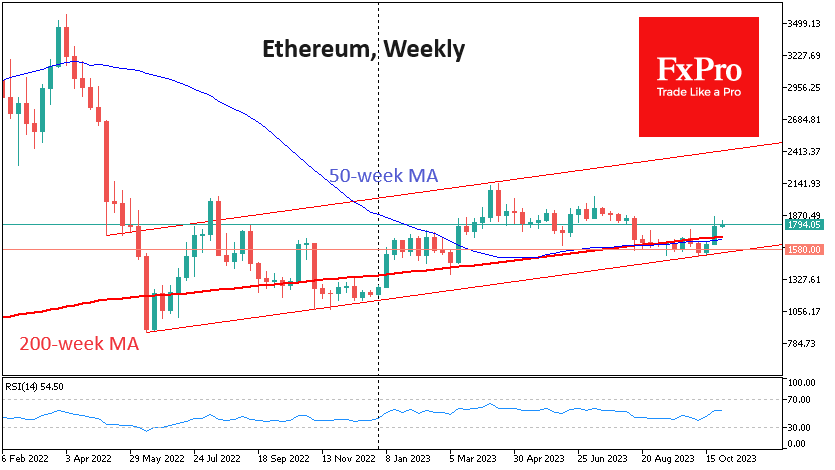
Ethereum followed Bitcoin’s lead and broke out above its 200-week MA after a few weeks below it, breaking the shorter-term downtrend. In other similar cases, we’ve seen some solid and sustained gains. The rebound from the drop below $1500 has confirmed a long-term broad uptrend, with the upper boundary now near $2400. The bulls are likely targeting this upper bound.
CoinShares said crypto fund investments rose by $326 million last week, the fifth consecutive week of inflows. Bitcoin investments rose by $296 million, while Ethereum investments fell by $6 million. Investment in Solana increased by $24 million.
News background
The difficulty of mining Bitcoin has reached an all-time high. According to another recalculation, it has increased by 2.34%, up 76.6% YTD to a new record of 62.46T. The average Bitcoin network hash rate at the current difficulty level is expected to be 449.68 EH/s, also a record.
Investment firm VanEck has filed an updated application with the US Securities and Exchange Commission (SEC) to launch a spot bitcoin ETF. The regulator has previously rejected similar applications from VanEck three times.
VanEck admitted that the Solana blockchain will be the first network to reach 100 million users, and the value of its SOL coin will grow from $32 to a maximum of $3211 by 2030. A conservative growth estimate is $335.
JPMorgan expects the SEC to approve many applications for spot bitcoin ETFs within the next two months.
The UN highlighted the correlation between the Bitcoin price and the network’s energy consumption. The 400% increase in the price of the first cryptocurrency in 2020-2021 was accompanied by a 140% increase in the energy used to mine it.
Bitrace named popular ways to steal bitcoins. Cybercriminals use three main methods to steal digital assets: fake applications, clipboard address spoofing and liquidity fraud.
Bank of Japan Marginally Tweaked Yield Curve ControlPolicy
Markets
Energy-related base effects caused significant slowdowns in headline inflation figures for the likes of Spain, Belgium and Germany, making way for a downward surprise in today’s EMU reading. German Bunds temporarily rallied, but failed to stick to intraday gains. German yield changes eventually ranged between -1 bp and -2.5 bps with the belly of the curve outperforming the wings. US Treasuries underperformed despite a brief uptick around the release of the US Treasury’s quarterly borrowing statement. They cut net borrowing for the October-through-December quarter from an estimated $852bn in July to $776bn (still a record for a Q4 quarter). The end of December Treasury cash balance prognosis is unchanged at $750bn. The reduction is partly due to the magnitude of deferred tax receipts coming from states that had been granted extensions due to natural disasters. For the Jan-Mar 2024 net borrowing is estimated at $816bn with a cash balance at the end of $750bn as well. On Wednesday, the Treasury publishes its new refunding statement. Today’s eco calendar is lengthy (EMU GDP, CPI, Chicago PMI, employment cost index, consumer confidence), but we don’t expect it to leave sustained traces on markets ahead of tomorrow’s Fed.
The Bank of Japan marginally tweaked its Yield Curve Control policy this morning. In July, they doubled the maximum tolerance band around the 0% yield target for the 10-yr Japanese from 50 bps to 100 bps. That 1% was a hard limit which would be defended at all cost. From now on, the 1% turned into more of a “reference”, allowing a more flexible approach and space to breach the 1% mark. The BoJ will continue to conduct bond purchases below/at/above the target level. The Japanese 10-yr bond yield this morning trades at 0.95%, at its highest level in over a decade. Backing the new policy change are updated (core) CPI forecasts. The BoJ raised them for fiscal years 2023 (2.8% from 2.5% in July), 2024 (2.8% from 1.9%) and 2025 (1.7% from 1.6%). BoJ governor Ueda pointed to cost-push inflation and higher oil prices for the revisions. Meanwhile they continue carefully monitoring the wage-price cycle. It’s the first time in over 30 years that Japanese inflation would be above the central bank’s 2% target for three consecutive years (FY 2022 as well), creating space for the BoJ to go even further on its slow normalization quest (scrapping YCC and/or getting rid of negative policy rates). Markets hoped for a bigger step by the BoJ with the Japanese yen paying the price. USD/JPY rises back above the 150-mark (150.30 from 149.10). In October of last year, the BoJ conducted huge FX interventions to defend the currency after breaching that mark.
News& Views
Official Chinese October PMIs came in to the weak side of expectations. The composite indicator fell from 52 to 50.7, the lowest level this year so far, with sentiment across the private sector deteriorating. The manufacturing gauge unexpectedly fell in contraction territory again (49.5), erasing the September uptick. New orders (49.5) and reduced output (50.9) drove the decline. The non-manufacturing sector only narrowly expanded, with the PMI easing from 51.7 to 50.6 vs 52 expected. Key indicators including new business (46.7 from 47.8) and employment (46.5, down 0.3 points) remain subpar. Business activity expectations hit a new YtD low at 58.1. Chinese bourses this morning are among the worst performers. The yuan gapped lower at the open this morning. USD/CNY wiped out yesterday’s marginal losses to trade around the recent highs of 7.317.
The World Bank in its quarterly Commodity Markets Outlook warned oil prices could surge to between $140 and $157 per barrel if the conflict in the Middle East escalates. If sustained it “inevitably means higher food prices”, the Worlds Bank’s deputy chief economist Kose said. It is the worst case scenario where global oil supply shrinks by 6 to 8 million barrels if key Arab producers including Saudi Arabia would cut exports. Opec’s Arab members did so back in the seventies in a move targeting the US and other countries that supported Israel in the Yom Kippur war. Under the World Bank’s small and medium risk scenarios, prices may rally to $102-121 per barrel. The baseline forecast is for overall commodity prices to drop 4.1% next year and oil prices to an average of $81 per barrel. This compares to a projected $90/b in the current quarter.
GBP/JPY Daily Outlook
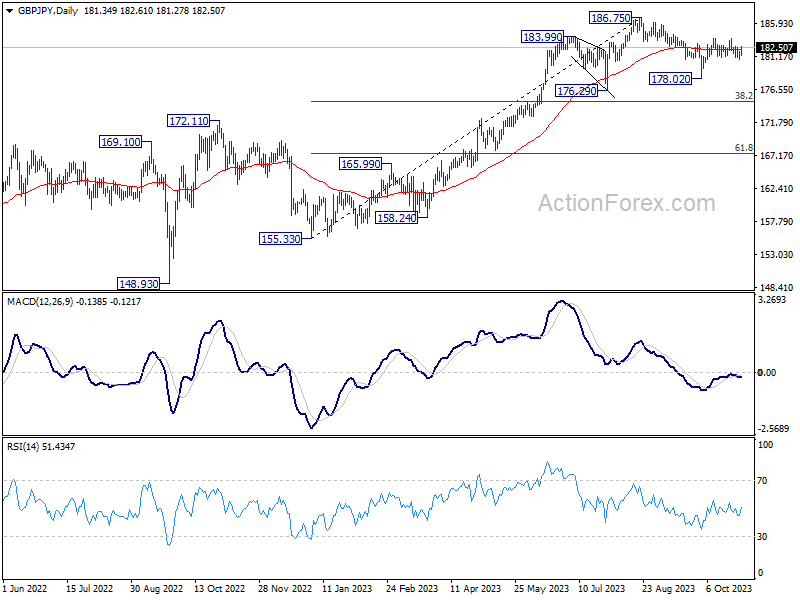
Daily Pivots: (S1) 180.81; (P) 181.35; (R1) 181.92; More...
GBP/JPY recovered quickly after dipping to 180.74. Intraday bias stays neutral and further rise is still in favor. Above 183.79 will resume the rise from 178.02 to retest 186.75 high. However, break of 180.74 will turn bias back to the downside for 178.02 instead.
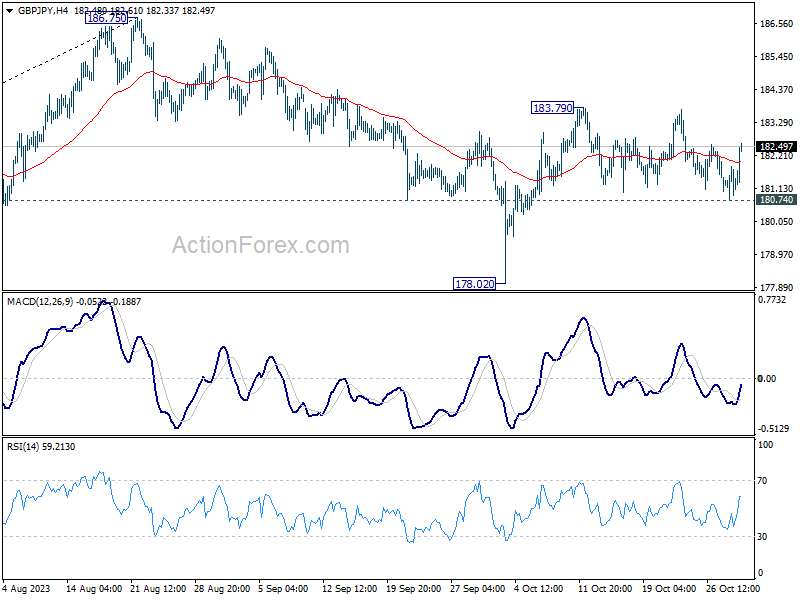
In the bigger picture, fall from 186.75 is seen as a corrective move only. As long as 176.29 support holds, larger up trend from 123.94 (202 low) should still be in progress. Break of 186.75 will target 195.86 (2015 high). Nevertheless, firm break of 176.29 will confirm medium term topping, and bring lengthier and deeper consolidations.
EUR/JPY Daily Outlook
Daily Pivots: (S1) 157.64; (P) 158.29; (R1) 158.87; More....
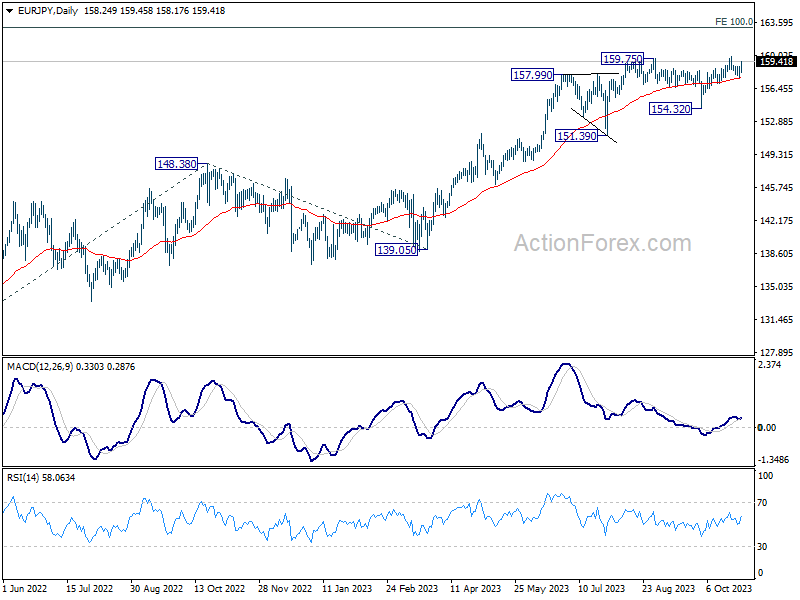
Intraday bias in EUR/JPY remains neutral as it's still bounded in range below 159.90. Further rise is in favor as long as 157.67 support holds. Above 159.90 will resume larger up trend to 163.06 projection level. However, firm break of 157.67 will turn bias back to the downside 154.32 support instead.
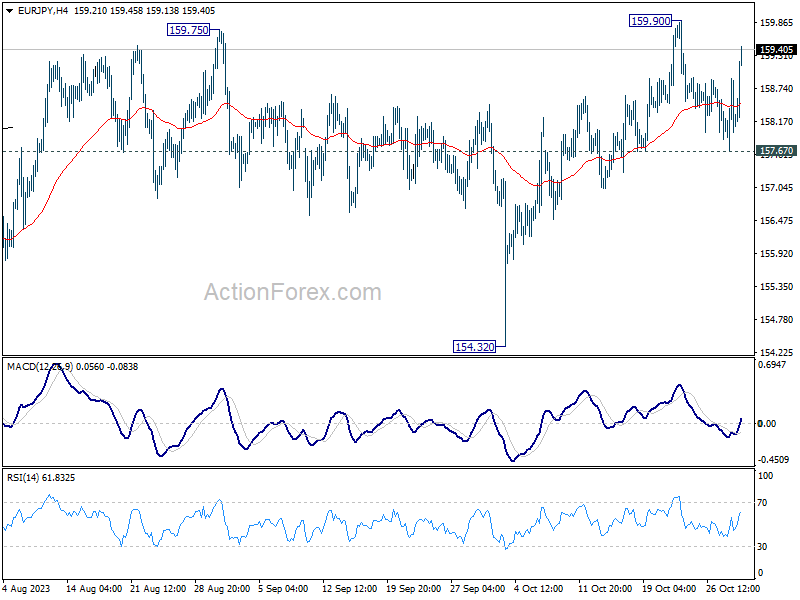
In the bigger picture, rise from 114.42 (2020 low) is in progress. Next target is 100% projection of 124.37 to 148.38 from 139.05 at 163.06. On the downside, break of 154.32 support is needed to be the first sign of medium term topping. Otherwise, outlook will remain bullish even in case of deep pullback.