Sample Category Title
EURCHF Wave Analysis
- EURCHF broke resistance level 0.9530
- Likely to rise to resistance level 0.9615
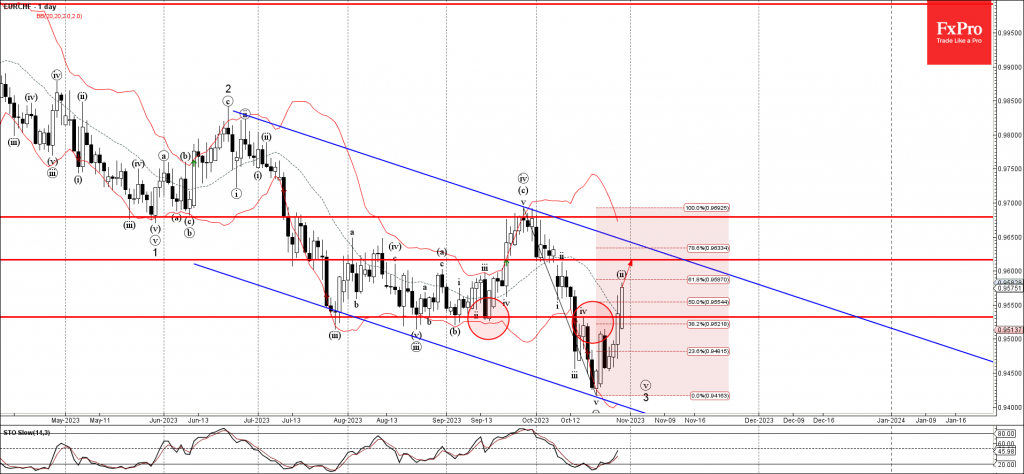
EURCHF recently broke the resistance level 0.9530 (top of the previous minor correction iv) coinciding with the 38.2% Fibonacci correction of the previous downward impulse v from September.
The breakout of the resistance level 0.9530 accelerated the active short-term ABC correction ii.
Given the widespread bearish Swiss franc sentiment, EURCHF can be expected to rise further toward the next resistance level 0.9615 (top of the previous minor wave ii).
AUDUSD Wave Analysis
- AUDUSD reversed from key support level 0.6300
- Likely to rise to resistance level 0.6425
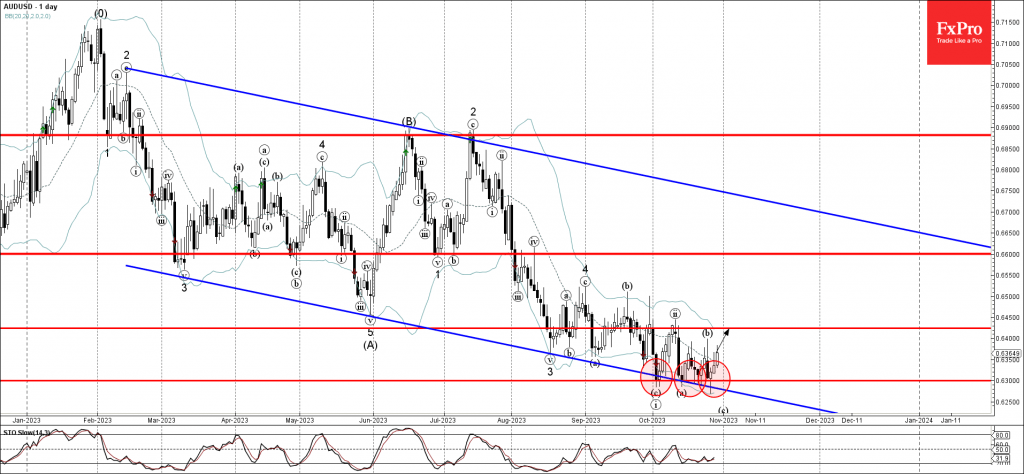
AUDUSD recently reversed up from the key support level 0.6300, which has been steadily reversing the index from the start of October.
The support level 0.6300 was strengthened by the lower daily Bollinger Band and by the support trendline of the weekly own channel from February.
Given the strong USD sales, AUDUSD can be expected to rise further toward the next resistance level 0.6425 (top of the previous correction ii).
EURUSD Restores Bullish Bias after Reclaiming Uptrend Line
- EURUSD bounces higher as positive bias gains traction
- Price climbs above moving averages and ascending trendline
- But how convincing is this rebound?
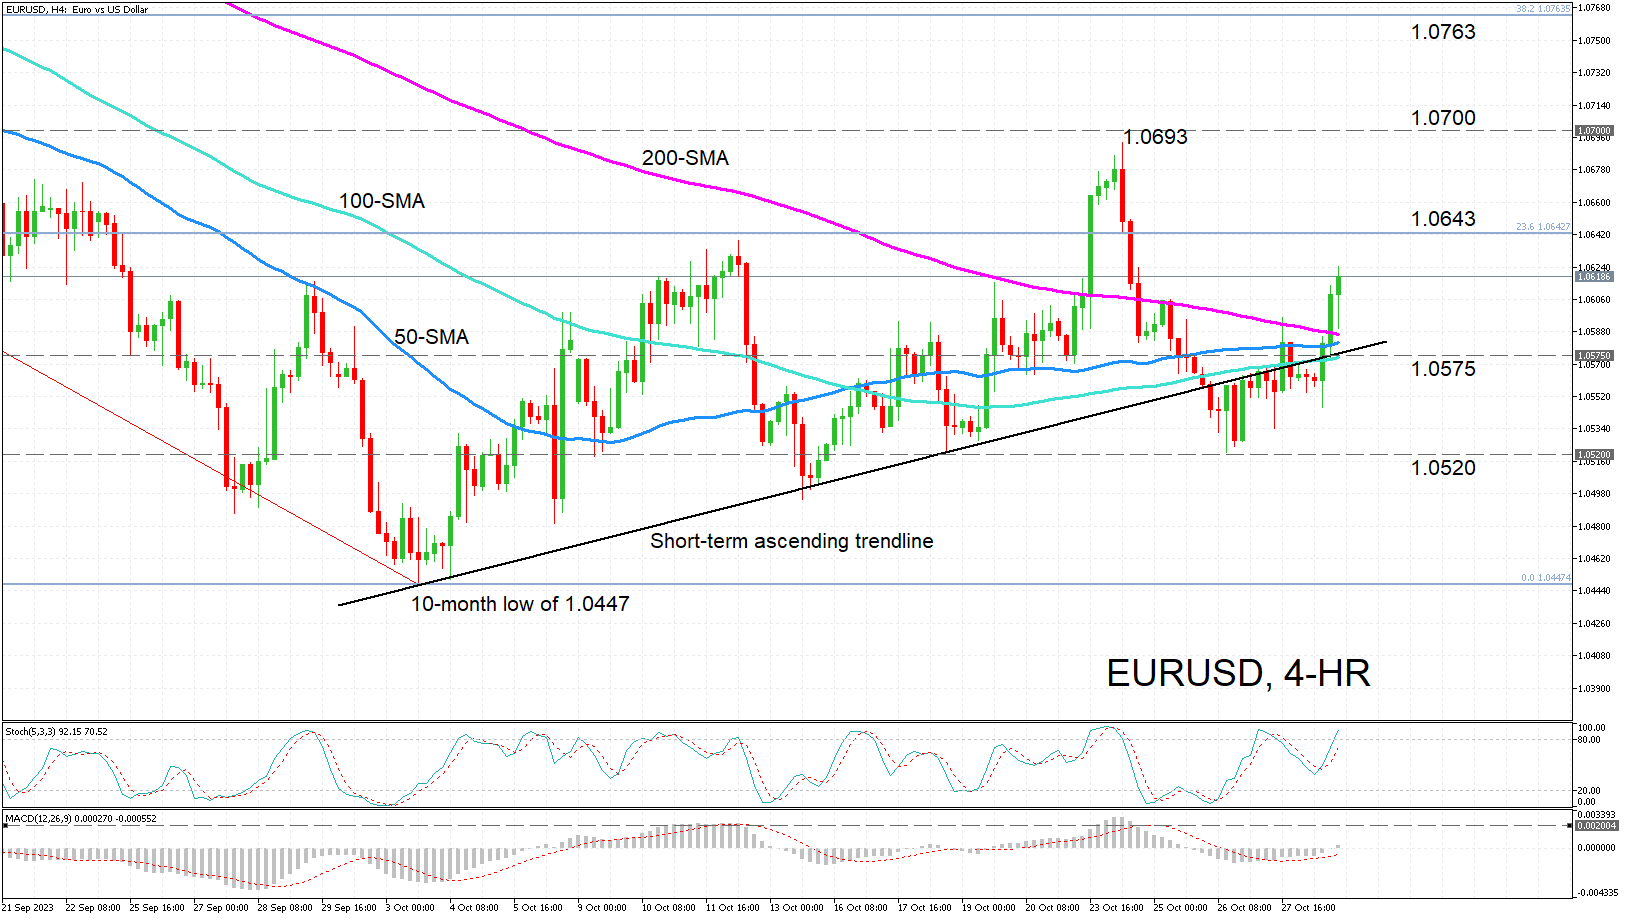
EURUSD is marching higher, pushing above its simple moving averages (SMA), but more importantly, the price action has moved back above the short-term ascending trendline.
The momentum indicators are strongly bullish with the stochastic oscillator plotting higher, while the MACD has just crossed above the zero threshold. Both are positively aligned with their moving averages, although the former is entering the overbought region.
Should the pair continue to head higher, the 23.6% Fibonacci retracement of the July-October downtrend at 1.0643 could obstruct further gains before revisiting the October peak of 1.0693. A successful climb above this top and above the 1.0700 level would open the way until the 38.2% Fibonacci of 1.0763.
However, if the rebound falters, the 100-period moving average, which has converged with the uptrend line, should provide immediate support in the 1.0575 region. Lower down, the proven support level of 1.0520 could halt steeper losses. Otherwise, a re-test of the early October 10-month low of 1.0447 could be on the cards.
To sum up, the short-term picture is looking increasingly positive, although surpassing the October high of 1.0693 would put EURUSD on a surer path upwards. But for the medium-term outlook to also switch to bullish, the gains would need to stretch further, at least until the 38.2% Fibonacci of 1.0763.
Sunset Market Commentary
Markets
Today’s economic calendar served as nothing more than an appetizer compared to what’s to come in the next few days. In the run-up to the euro area wide figure, national inflation readings were due in Spain, Germany and Belgium. They all printed to the soft side of expectations. German HICP even declined 0.2% m/m in October, bringing the yearly outcome to the lowest since July 2021 (3%). Spanish inflation halved in its pace from 0.6% m/m to 0.3% m/m. The expected y/y uptick therefore stayed limited to 3.5% instead of the 3.8% consensus. We also had our first batch of national GDP growth figures. Heavyweight Germany contracted 0.1% q/q in the third quarter this year. That’s less than the -0.2% feared though. The Q2 figure was even revised up marginally to 0.1% q/q. It’s not much but it was enough for the euro to actually gain on the German outcome. EUR/USD bounced off the lower bound up the October upward trading range to test the 1.06 big figure again. We suspect the positive risk environment has a say in this as well. The EuroStoxx50 at some point rose 1% before paring gains to 0.4%. Important support levels survive though barely. US stock indices also add 0.9-1.2%, recouping some of Friday’s losses again. Aside from a pinch of euro strength, dollar weakness is at play too. DXY eases to 106.28. Only an even weaker JPY is preventing more losses in this trade-weighted greenback basket. USD/JPY appreciates to 149.73 as it moves into one of the bigger wildcards for trading this week: the Bank of Japan. They meet tomorrow against the background of a historically weak yen, yields hitting decade highs and stubborn & above-target inflation (cf. Tokyo gauge on Friday). Japanese newspaper Nikkei citing unidentified people familiar with the matter reported that the central bank is indeed considering to let 10-year yields rise above the current 1% cap. If sterling maintains current loses, EUR/GBP is on track to close at the highest level since mid-May (0.873). US Treasuries underperformed Bunds this time around. US yields add 5.4 (2-y) - 7.6 bps (10-y). German yields gapped lower at the open in a catch-up move with the US in late Friday dealings. They bottomed soon thereafter before fully wiping out 7 bps of declines. In another sign of improved sentiment, gold’s rally halted. For one ounce of the shiny metal you’d still have to cough up almost $2000 though. Brent oil erases much of Friday’s (fear-for-a-full-blown-Israeli-invasion driven) gains and is trading back sub $90/b.
News & Views
The National Bank of Belgium reported that the Belgian economy grew by 0.5% Q/Q in Q3 2023 (1.5% Y/Y). Based on an initial estimate, value added fell by 0.6% in the manufacturing industry while services and construction rose by 0.8% and 0.6% respectively. Growth figures are surrounded by even greater uncertainty than normally owing to lack of administrative data for the month September in particular. Belgian inflation rose by 0.34% M/M with the Y/Y-figure dropping from 2.39% to 0.36%, the lowest level since January 2021. This is solely due to energy which came in at -37.15% Y/Y from -28.73% in September and accounts for -5.46 percentage points to total inflation. Inflation based on the health index has fallen from 2.08% to 0.30%. Belgian core inflation which strips out energy products and unprocessed foods is on a much slower slide: 6.55% Y/Y from 6.95% Y/Y in September. Services inflation decreased from 7.18% to 7.09% while food inflation fell from 11.15% to 8.98%. Rent inflation increased from 5.33% to 5.84%.
The Swiss National Bank announced an adjustment to the remuneration of sight deposits (tiered system) from December 1st. First, the central bank will no longer renumerate the entire minimum reserve requirement irrespective of whether it is met using cash or sight deposits. Second, the SNB will lower the threshold factor for the remuneration of sight deposits subject to minimum reserve requirements from 28 to 25. Up to the threshold, the SNB policy rate will be applied. Above it a 0.5 percentage point discount will be applied. In separate comments, SNB vice president Schlegel this weekend suggested that further rate increases to the 1.75% SNB policy rate may still be needed given the very good shape of the labour market. In order to tick the rate hike box, unfavourable inflation developments are needed as well. Swiss money markets currently believe that the next SNB move will be down (next year).
Yen strengthens on rumors of BoJ lifting 10-year yield cap above 1%
Japanese Yen is having notable bounce following emerging reports that BoJ is considering another adjustment to its monetary policy. This potential shift, which may allow 10-year yields to rise above the 1% mark. n official announcement from the central bank is anticipated in the forthcoming Asian trading session.
A report from Nikkei, citing an anonymous source, suggests that BoJ is on the verge of modifying its yield curve control framework. This potential shift aims to facilitate a rise in 10-year Japanese government bond yields beyond the current cap of 1%. It's important to note that this ceiling was only introduced in July, replacing the previous limit of 0.5%.
The rationale behind this move seems to be twofold. Firstly, BOJ aims to more flexibly conduct its JGB purchase operations. This flexibility, coupled with the revised cap on 10-year yields, appears strategically designed to discourage speculators from pushing the yields to their upper bounds. This tactic could alleviate the pressure on BOJ, reducing the necessity for extensive JGB purchases to maintain rates under 1%.
Another crucial component of the upcoming BoJ announcement will be the bank's updated forecasts for inflation and economic growth. The central bank is expected to upgrade its projection for core CPI – which excludes fresh food costs – from the present 2.5% for the fiscal term concluding in March 2024 to 1.9% for the subsequent fiscal year.
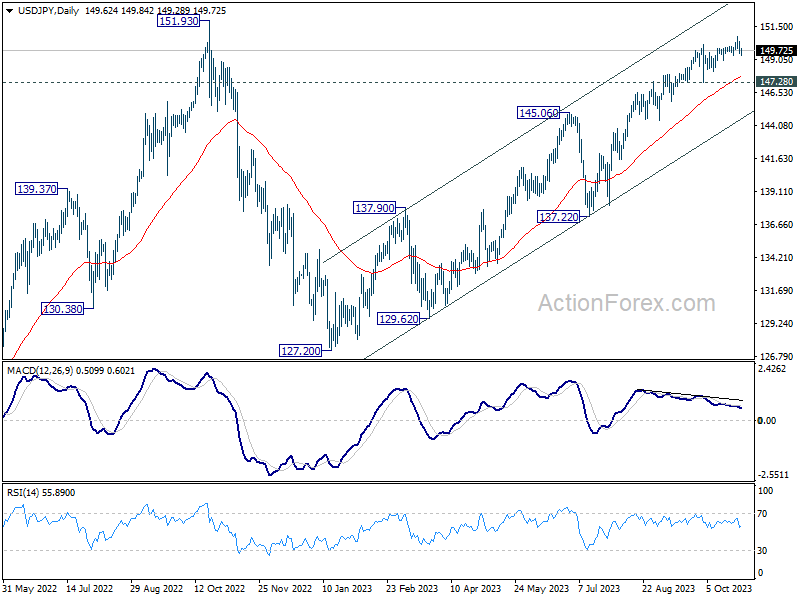
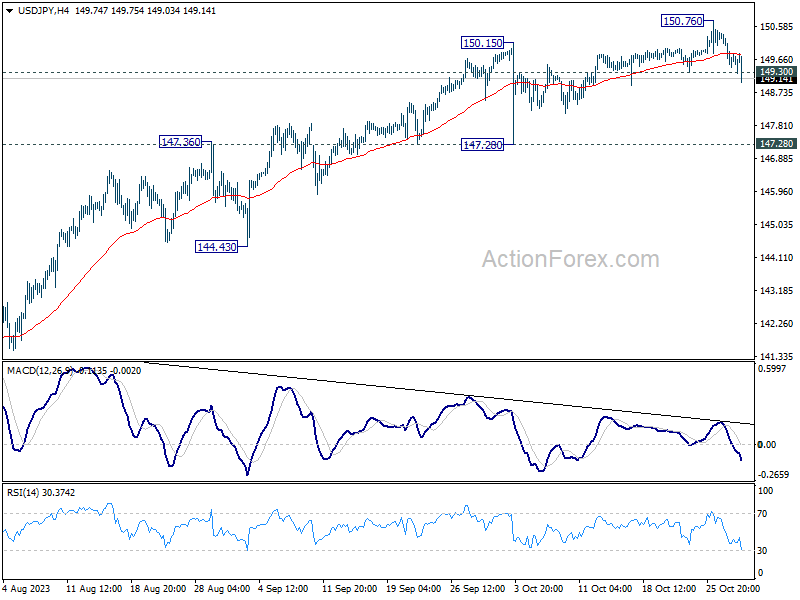
USD/JPY's break of 149.30 support turns intraday bias to the downside for deeper fall towards 147.28 support. But after all, as long as 147.28 holds, price actions from 150.76 are viewed as a corrective move only. Larger rally would still be in favor to continue at a later stage.
Euro Pushes Higher as German Inflation Falls
- German inflation falls to 3.8%
- Eurozone inflation expected to follow suit on Wednesday
The euro is in positive territory on Monday. In the North American session, EUR/USD is trading at 1.0502, up 0.36%.
German inflation slides
Germany’s consumer inflation dropped to 3.8% y/y in October, down sharply from 4.5% in September and below the market consensus of 4.0%. Food and energy prices decreased, which contributed to the inflation print being the lowest since August 2021. Core inflation dropped from 4.6% to 4.3%.
The inflation data is an encouraging sign for the ECB, which paused interest rates last week after 10 consecutive increases. ECB President Lagarde said after the meeting that a pause did not mean that hikes were off the table and poured cold water on any thoughts of a rate cut. Lagarde doesn’t want to commit to rates having peaked, but the ECB would be happy to hold rates, given the worrying growth outlook for the bloc. Unless the economy suddenly rebounds or inflation rises, there is a strong chance that the rate-tightening cycle is over.
The eurozone will release the October inflation report on Tuesday and is expected to follow the German lead. Headline inflation is projected to fall to 3.1%, down from 4.3% in October, while the core rate is expected to fall from 4.5% to 4.2%.
The Federal Reserve has sounded hawkish about inflation and received support for its stance from Friday’s core PCE price index, which rose 0.3% m/m in September, up from 0.1% in August and the highest level in four months. The headline indicator rose 0.4%, unchanged from August and above the estimate of 0.3%. There are some inflation risks heading into next year, but the markets have priced in pauses in the November and December meetings.
EUR/USD Technical
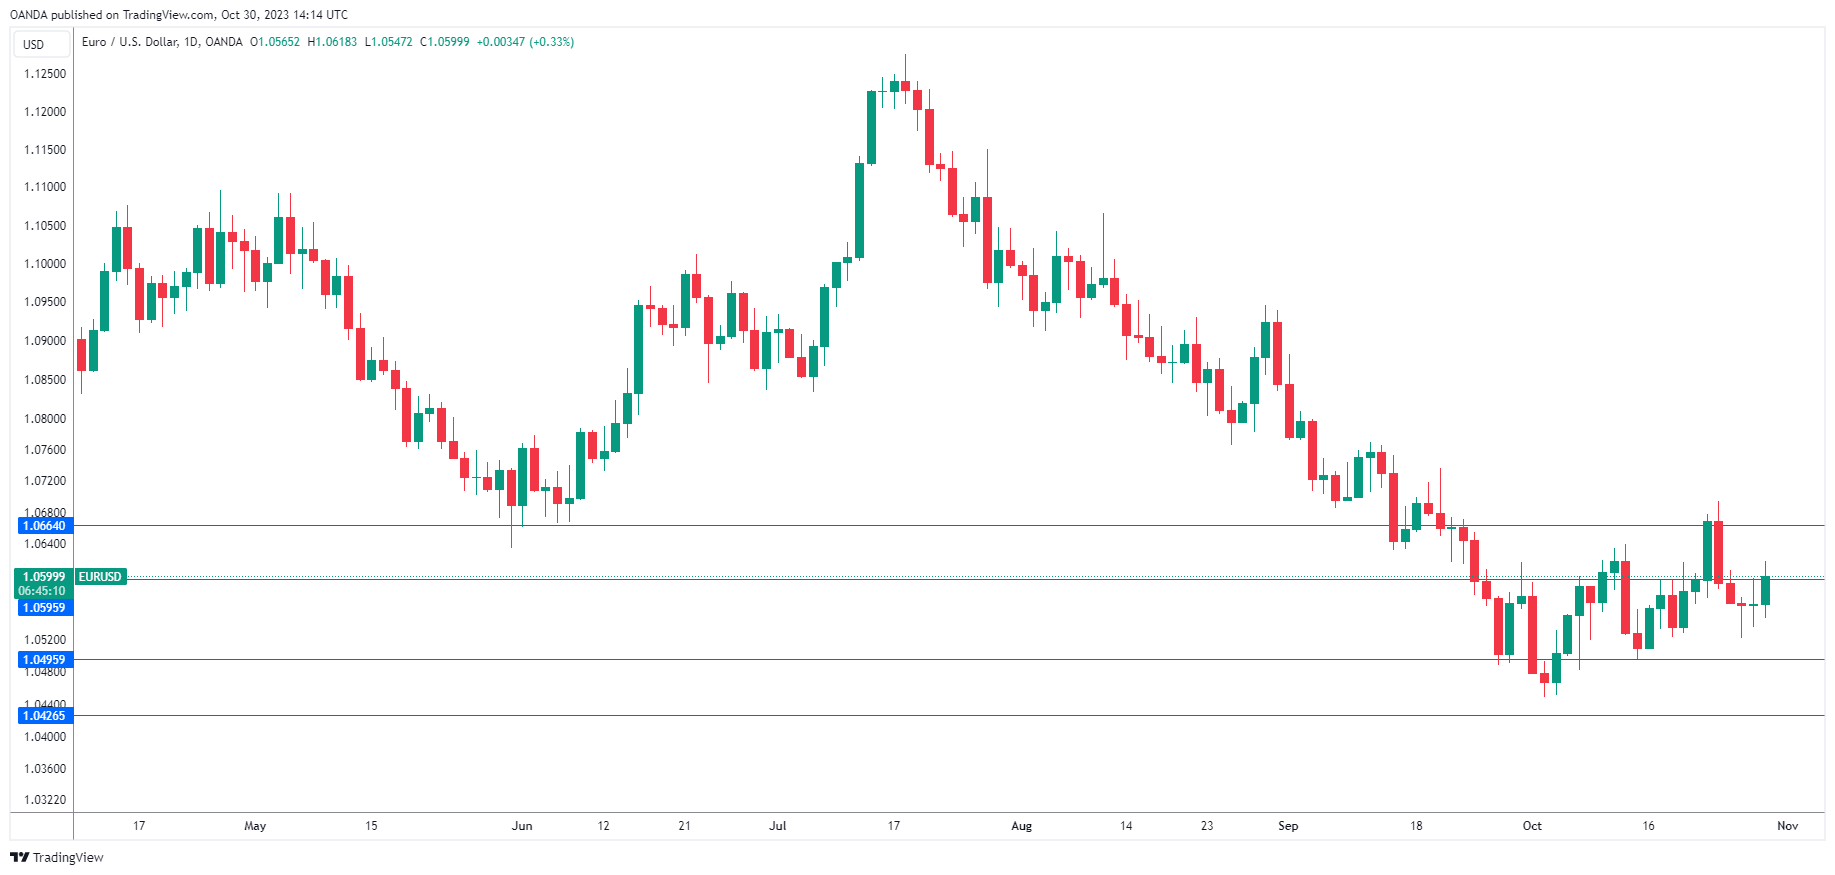
- EUR/USD is testing resistance at 1.0595. The next resistance line is 1.0664
- 1.0495 and 1.0426 are providing support
Brent Crude Holds Ground Around $90 Amid Geopolitical Tensions and Future Expiries
Brent crude is maintaining a steady position, trading close to $89.50 as the market endeavors to find a balance.
Middle Eastern tensions remain the central focus for traders, as the on-ground operations in the region have introduced multiple uncertainties that can sway prices.
Adding to the mix of factors influencing Brent crude this week is the expiration of December Brent futures. This expiration could lead to short-term volatility and impact prices accordingly.
Recent data from Baker Hughes indicates that the number of active oil rigs in the U.S. is on the rise. This week saw an increase of two units, bringing the total to 504 rigs. This growth marks the third week in a row of expansion.
Technical Analysis: Brent Crude
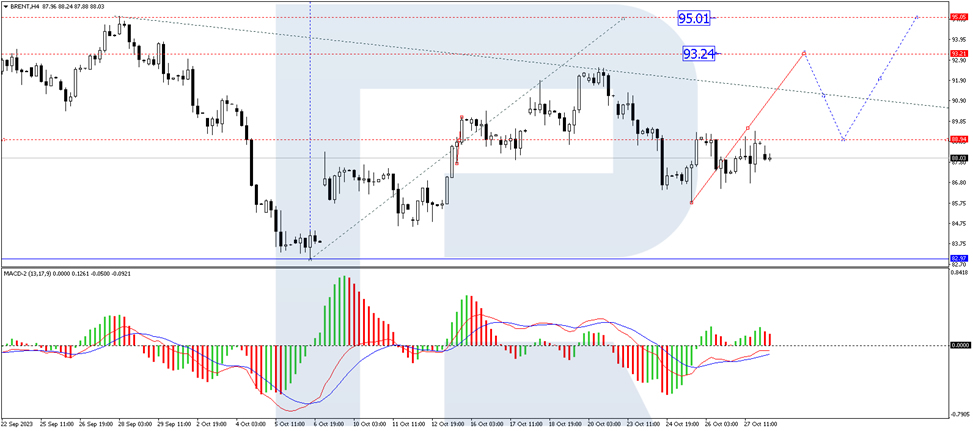
Brent has witnessed a corrective move to the $86.50 mark and is currently crafting an upward trajectory targeting $89.50. Should prices successfully surpass this resistance, we might witness a rally towards $93.20, and potentially even further to the $95.00 mark. The MACD on this timeframe solidifies this bullish sentiment. With its signal positioned below the zero line, it's on an upward trajectory, hinting at possible future highs.
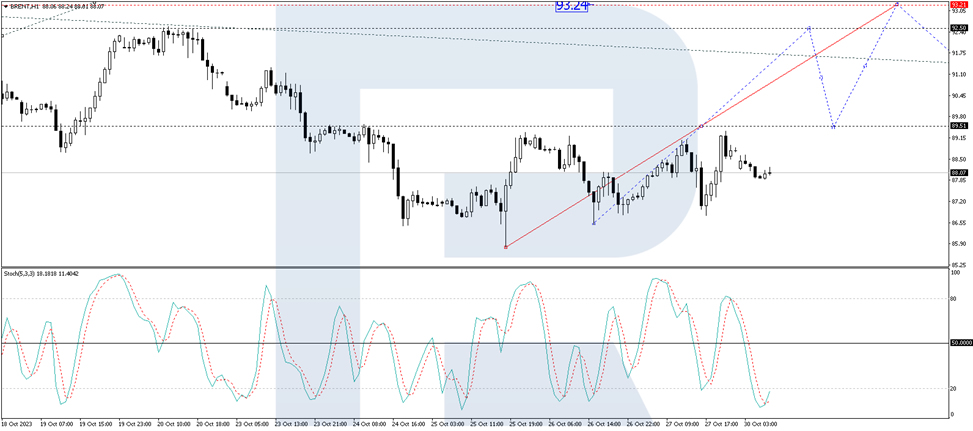
On the hourly frame, Brent has wrapped up a bullish wave reaching $89.36, succeeded by a minor pullback to $87.90 earlier today. The stage appears set for a subsequent bullish move, aiming for the $89.50 resistance. Breaking above this level could potentially unlock the door to $92.50. The Stochastic oscillator on this timeframe amplifies this bullish stance. Its signal, currently below the 20 mark, is pointed sharply upwards, suggesting a possible rally to the 80 level.
S&P 500 Has Cooled Off. What are the Signs of an Upturn?
Futures on the S&P500 are rising early Monday after a correction last week. Markets are gearing up for a week of important events, from releasing the US Treasury’s borrowing plans to the FOMC’s comments on interest rates and the monthly employment report.
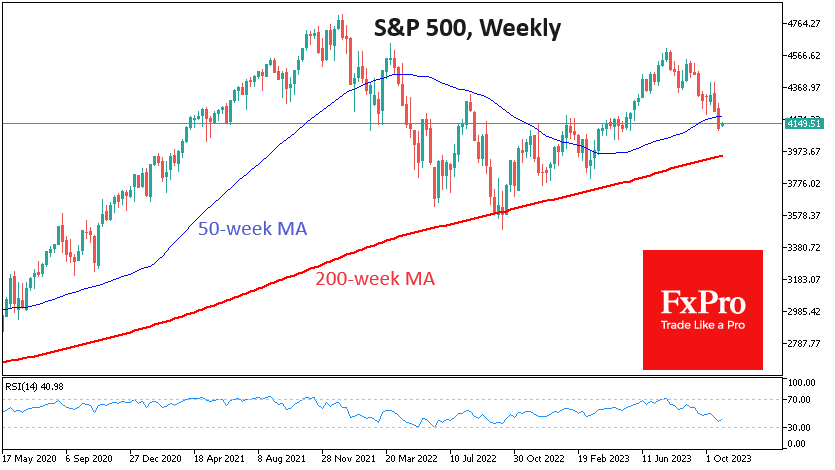
The S&P500 index lost over 10% from its late July peak to last Friday’s close, which is informally considered the beginning of the correction.
Technically, the sell-off in equities intensified after the S&P500 failed to break through resistance at its 50-day moving average in mid-October. A quick pullback to the 200-day followed, but we saw only a brief consolidation, not a rebound.
This week has a good chance of setting the market dynamic for the rest of the year for several reasons.
Firstly, the concentration of top events in the financial world. Wednesday will see the release of the US Treasury’s quarterly borrowing plan. The Treasury’s appetite could set the tone for the bond market, and Bloomberg says this release is more important than the Fed’s comments.
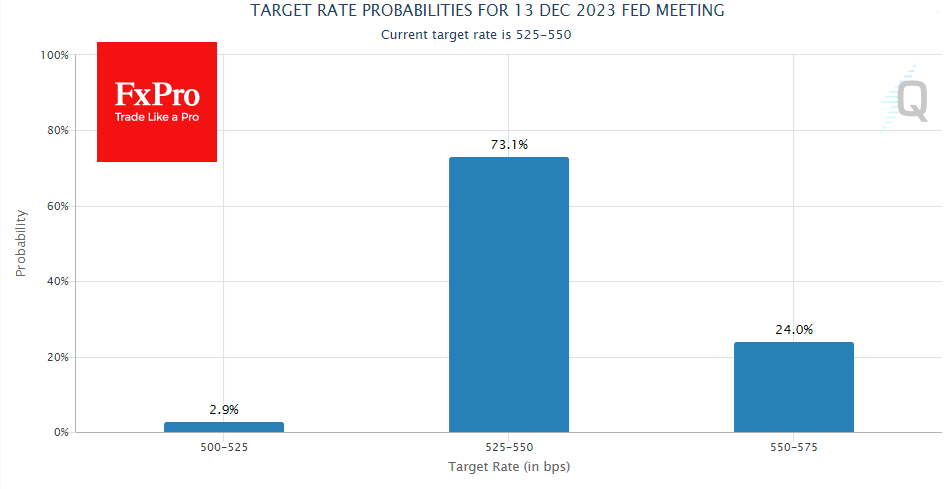
The official FOMC statement and Powell’s remarks at the press conference are a chance to shake up rate expectations. The market focuses on the odds of a December hike (now at 24%) and guidance on when the central bank might start cutting rates.
On Friday, it will be the labour market: the September report was robust on job growth and weak on wages. Which will become a trend?
Secondly, the market looks technically oversold in the short term, which opens the possibility of a bounce. The popular technical oscillator RSI touched oversold territory at Friday’s close. A bounce before regular trading brought the market back out of oversold territory. This could be a repeat of what we saw in early October. Last September, a return from oversold to normal levels also led to impressive inflows into equities.
Thirdly, after almost three months of declines, the market has pulled back from the extremes to prove attractive to buyers, paying attention to the exceptionally healthy consumer demand in the US.
Hypothetically, a dip below the 200-day could prove as false a break as in March. But buyers were encouraged by the Fed’s determination to support regional banks. To confirm this hypothesis, however, we would need a clear signal from the Fed that there’s no point in raising rates further despite solid data.
Even better, if there is confirmation on Friday in the form of a further slowdown in wage growth with further employment growth, it is risky to jump the gun, as we are formally in a downtrend. From a technical point of view, a significant (more than 2%) rise in the daily result on Wednesday or Friday could be an important signal.
USD/JPY Mid-Day Outlook
Daily Pivots: (S1) 149.26; (P) 149.84; (R1) 150.22; More...
Intraday bias in USD/JPY stays neutral at this point. On the downside, below 149.30 minor support will turn bias to the downside for deeper pull back. But outlook will stay bullish as long as 147.28 support holds, even in case of deep retreat. On the upside, above 150.76 will resume larger rally to retest 151.93 high.
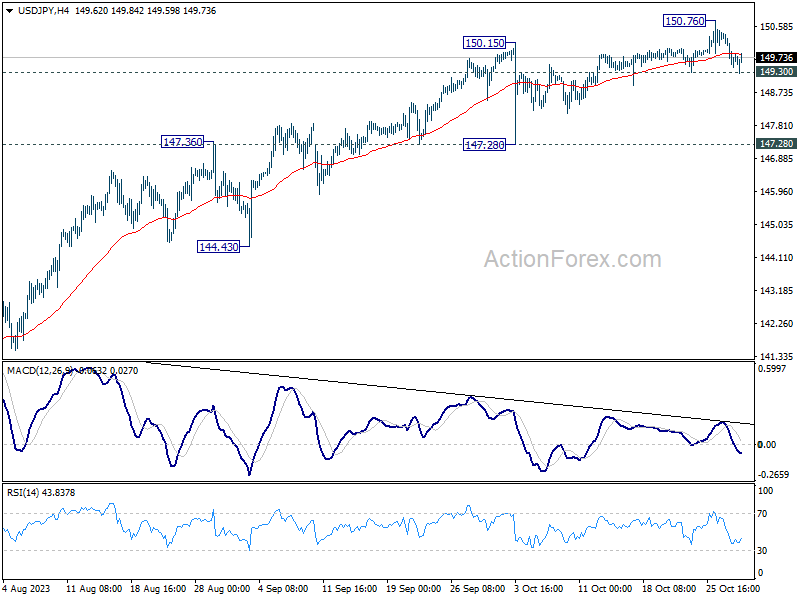
In the bigger picture, while rise from 127.20 is strong, it could still be seen as the second leg of the corrective pattern from 151.93 (2022 high). Rejection by 151.93, followed by sustained break of 145.06 resistance turned support will be the first sign that the third leg of the pattern has started. However, sustained break of 151.93 will confirm resumption of long term up trend.