Sample Category Title
EUR/JPY Mid-Day Outlook
Daily Pivots: (S1) 157.64; (P) 158.29; (R1) 158.87; More....
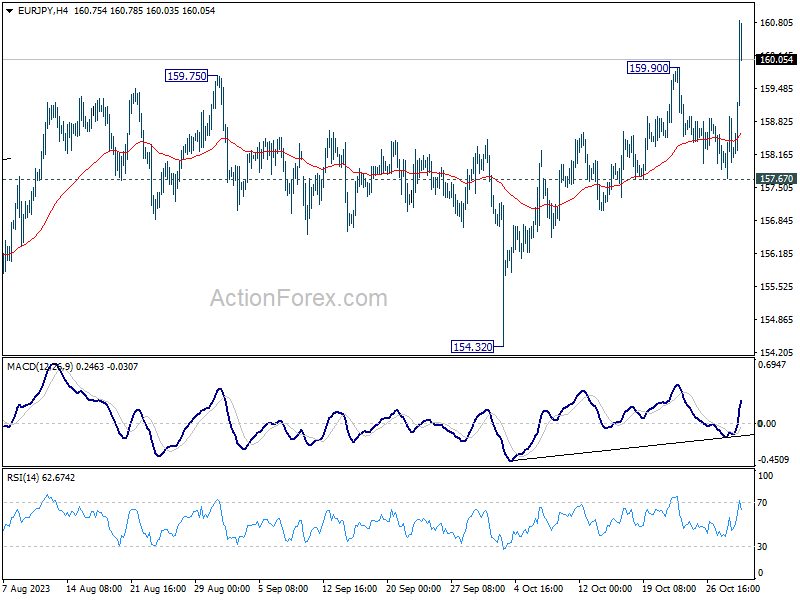
EUR/JPY's up trend resumed by breaking through 159.90 today. Intraday bias is back on the upside. Current rally should target 163.06 projection level next. On the downside, break of 157.67 support is needed to indicate short term topping. Otherwise, outlook will stay bullish in case of retreat.
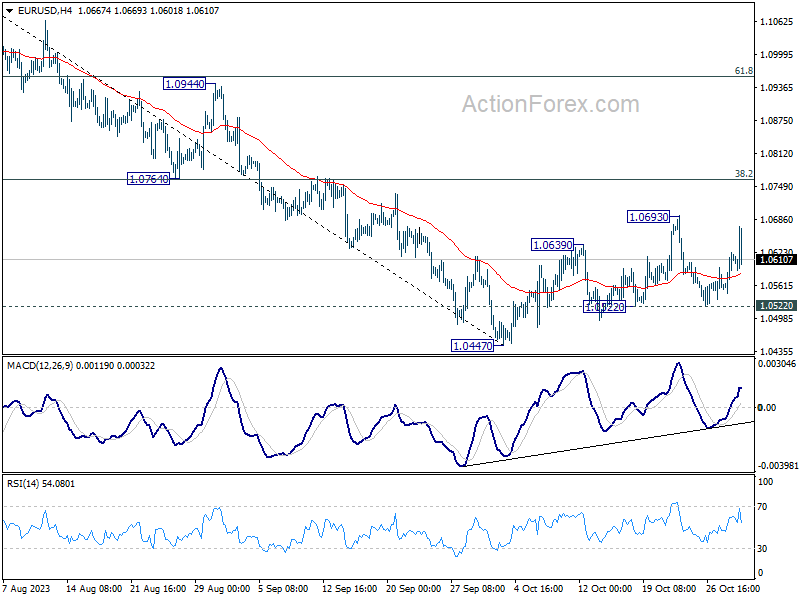
In the bigger picture, rise from 114.42 (2020 low) is in progress. Next target is 100% projection of 124.37 to 148.38 from 139.05 at 163.06. On the downside, break of 154.32 support is needed to be the first sign of medium term topping. Otherwise, outlook will remain bullish even in case of deep pullback.
EUR/USD Mid-Day Outlook
Daily Pivots: (S1) 1.0566; (P) 1.0596; (R1) 1.0644; More...
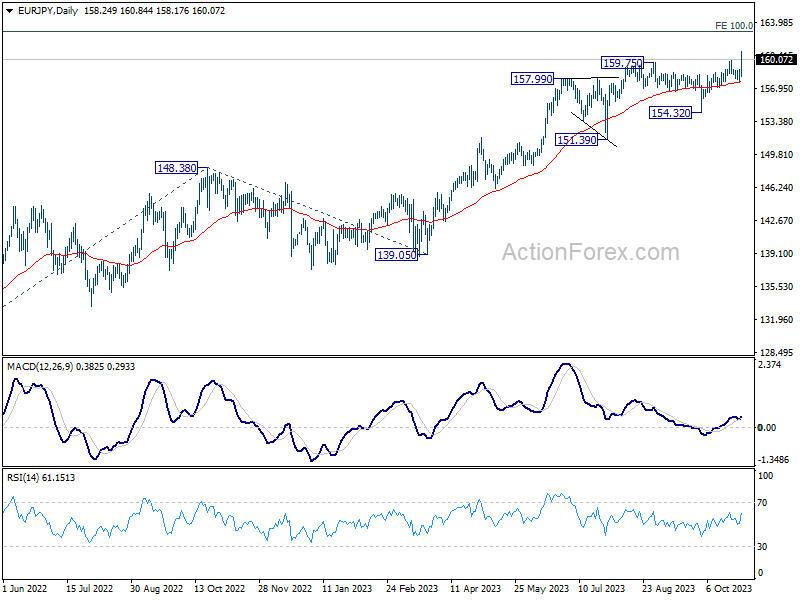
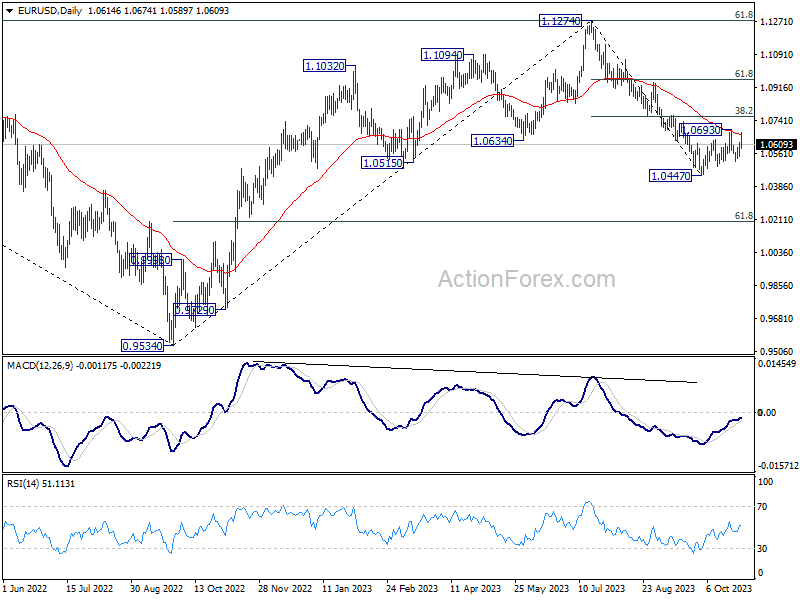
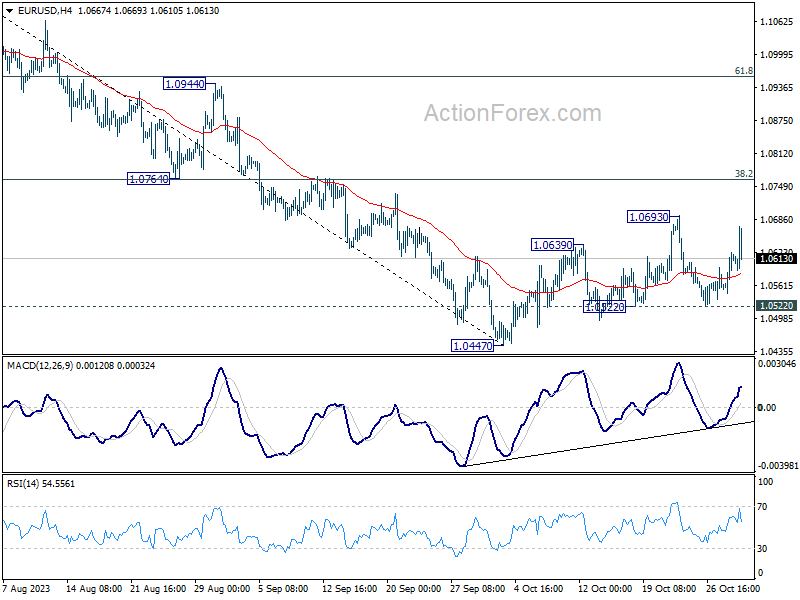
EUR/USD is staying below 1.0693 resistance despite today's rebound. Intraday bias remains neutral at this point. On the downside, break of 1.0522 support will turn bias back to the downside for retesting 1.0447 low. Break there will resume larger fall from 1.1274. On the other hand, strong bounce from current level, followed by break above 1.0693, rebound from 1.0447 to 1.0764 cluster resistance (38.2% retracement of 1.1274 to 1.0447 at 1.0763).
In the bigger picture, fall from 1.1274 medium term top could still be a correction to rise from 0.9534 (2022 low). But chance of a complete trend reversal is rising. In either case, current fall should target 61.8% retracement of 0.9534 to 1.1274 at 1.0199 next. For now, risk will stay on the downside as long as 55 D EMA (now at 1.0665) holds, in case of rebound.
GBP/USD Mid-Day Outlook
Daily Pivots: (S1) 1.2098; (P) 1.2130; (R1) 1.2155; More
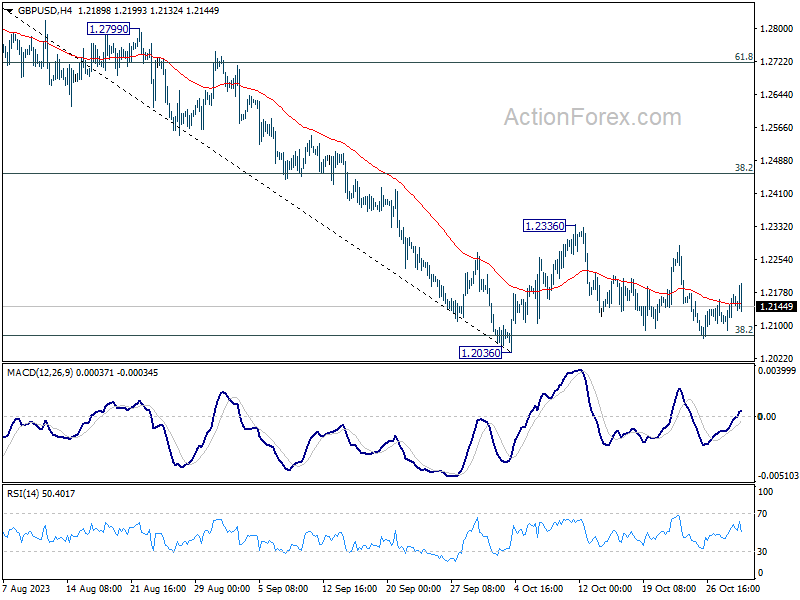
Intraday bias in GBP/USD remains neutral and outlook is unchanged. With 1.2336 resistance intact, downside breakout is expected. On the downside, firm break of 1.2036 will resume whole decline from 1.3141 for 1.1801 support next. However, break of 1.2336 will turn bias back to the upside for 38.2% retracement of 1.3141 to 1.2036 at 1.2458.
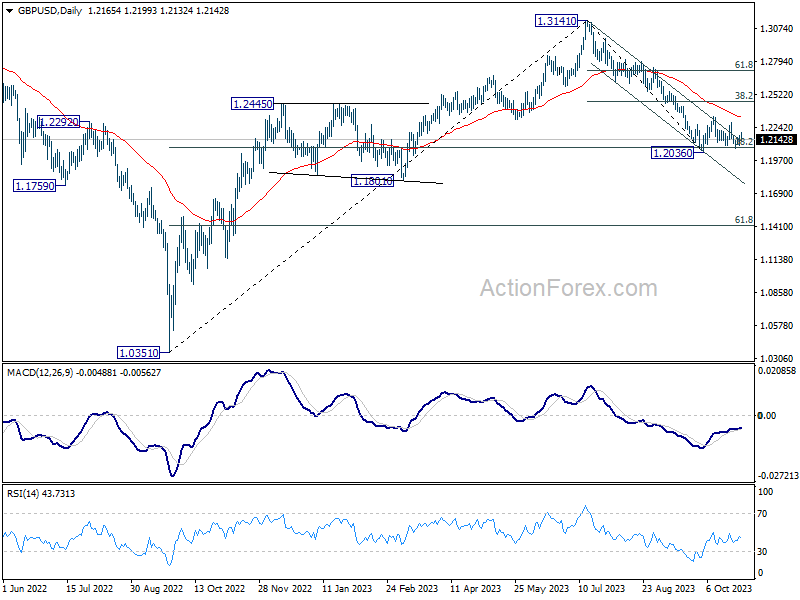
In the bigger picture, fall from 1.3141 medium term top could still be a correction to up trend from 1.0351 (2022 low) only. But risk of complete trend reversal is rising. Sustained break of 38.2% retracement of 1.0351 to 1.3141 at 1.2075 will pave the way to 61.8% retracement at 1.1417. For now, risk will stay on the downside as long as 55 D EMA (now at 1.2346) holds, in case of rebound.
USD/CHF Mid-Day Outlook
Daily Pivots: (S1) 0.8991; (P) 0.9014; (R1) 0.9048; More....
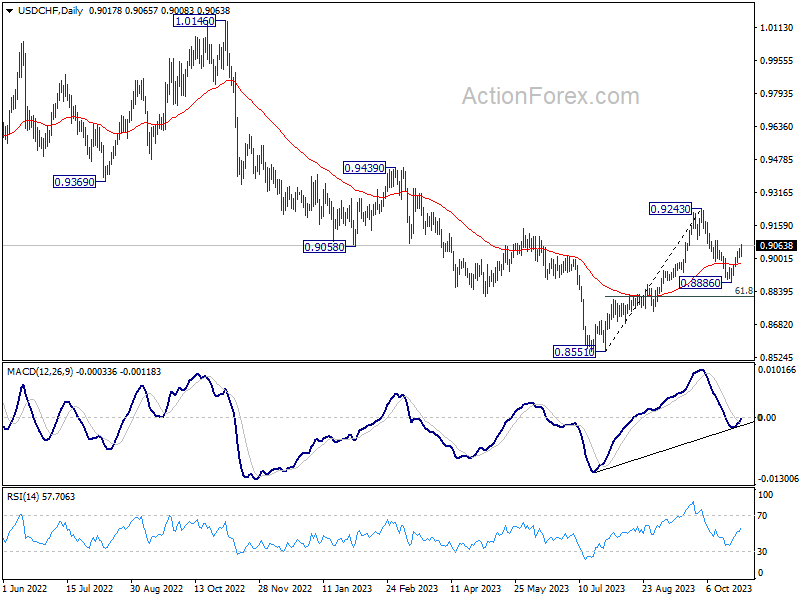
USD/CHF's rebound from 0.8886 resumed by breaking through 0.9047 temporary top. Intraday bias is back on the upside for 0.9086 resistance. Sustained break there will pave the way back to 0.9342 resistance next. On the downside, below 0.9007 minor support will turn intraday bias neutral first.
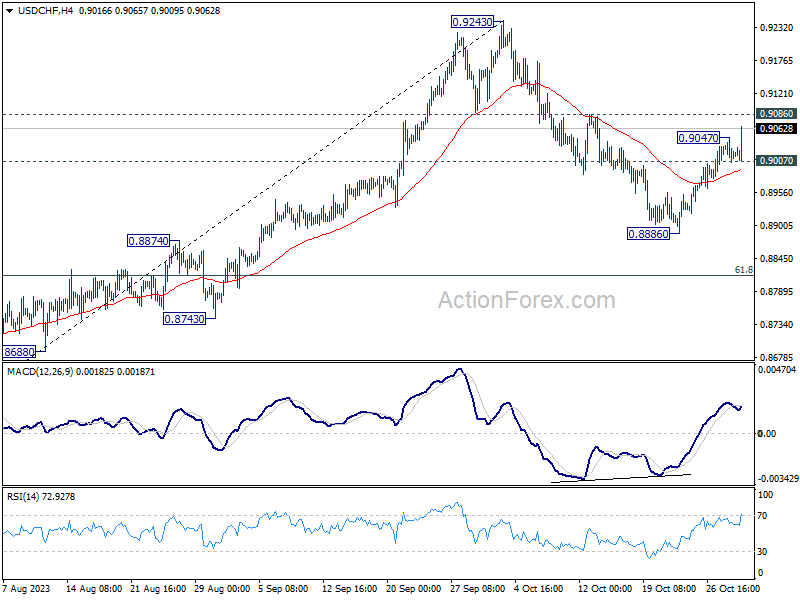
In the bigger picture, outlook is mixed up by the deeper than expected pull back from 0.9243. Yet there was no follow through selling after hitting 0.8886. On the upside, break of 0.9243 resistance will revive the case of medium term bottoming at 0.8851, and turn outlook bullish. However, sustained break of 61.8% retracement of 0.8551 to 0.9243 at 0.8815 will argue that larger decline from 1.0146 is ready to resume through 0.8551 low.
USD/JPY Mid-Day Outlook
Daily Pivots: (S1) 148.63; (P) 149.24; (R1) 149.67; More...
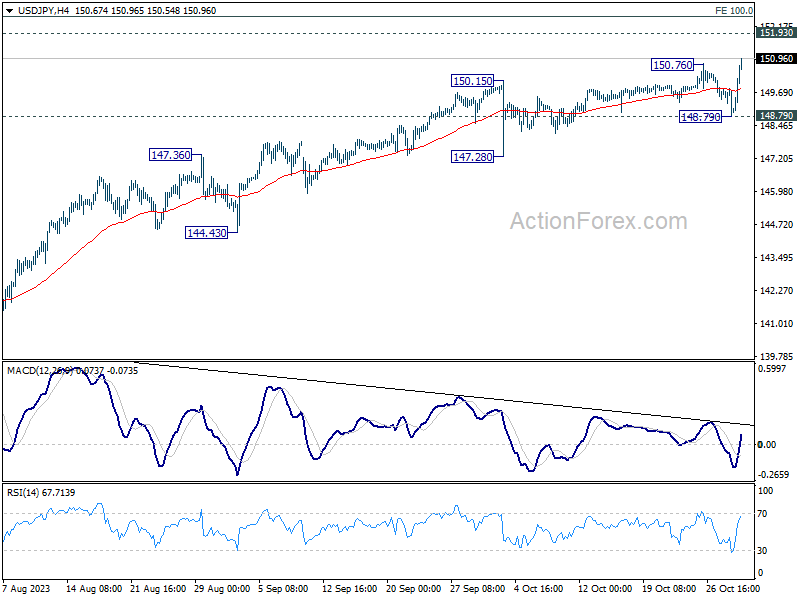
USD/JPY's recent rally resumed by breaking through 150.76 and intraday bias is back on the upside. Next target is 151.93 high. Break there will target 100% projection of 129.62 to 145.06 from 137.22 at 152.66. For now, break of 148.79 support is needed to indicate short term topping. Otherwise, outlook will stay bullish in case of retreat.
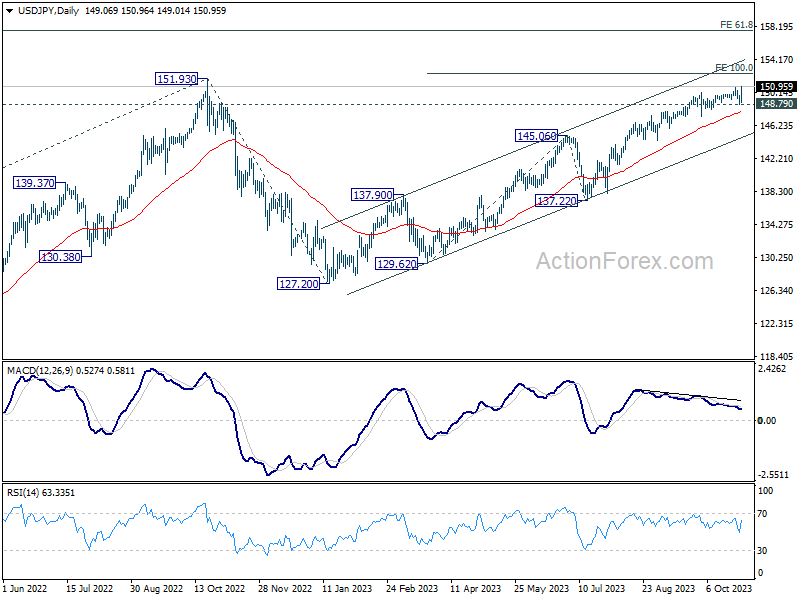
In the bigger picture, immediate focus is now on 151.93 resistance (2022 high). Rejection by 151.93, followed by sustained break of 145.06 resistance turned support will argue that rise from 127.20 has completed, and turn outlook bearish for 137.22 support and below. However, sustained break of 151.93 will confirm resumption of long term up trend. Next target will be 61.8% projection of 102.58 to 151.93 from 127.20 at 157.69.
Yen’s Post-BoJ Selloff Intensifies; Euro Holds Strong Despite Weak Data
Yen continued to face significant pressure in early US session, remaining as the day's weakest performer. Hopes of substantial changes from BoJ were dashed earlier as it made only a minor adjustment to the definition of yield cap. The selling sentiment intensified following revelation that Ministry of Finance refrained from spending on interventions between September 28 and October 27. This has propelled USD/JPY towards 151 mark, while the EUR/JPY surged to its highest in over ten years.
Contrastingly, Euro emerges as the strongest currency of the day, a surprising turn of events given the lower than expected Eurozone GDP and CPI data. However, Euro's lead is being closely challenged by Dollar, and it remains uncertain which currency will prevail as the day's strongest. Nonetheless, Dollar still faces significant challenges ahead, including the upcoming FOMC and ISM manufacturing data tomorrow, and crucial economic indicators later in the week such as non-farm payrolls and ISM services.
In other currency market movements, Australian Dollar experienced a dip, making it the day's second weakest currency, closely followed by Swiss Franc and New Zealand Dollar. Sterling and Canadian Dollar showed mixed responses.
Technically, despite today's strong rebound, EUR/USD is still capped below 1.0693 resistance. Larger decline is in favor to continue and break of 1.0522 support would push EUR/USD through 1.0447 low. However, break of 1.0693 will risk stronger rebound through 1.0764 cluster resistance (38.2% retracement of 1.1274 to 1.0447 at 1.0763).With significant economic events on the horizon, clarity on the currency's direction is likely to emerge in the coming days.
In Europe, at the time of writing, FTSE is up 0.25%. DAX is up 0.59%. CAC is up 0.98%. Germany 10-year yield is down -0.0358 at 2.789. Earlier in Asia, Nikkei rose 0.53%. Hong Kong HSI dropped -1.69%. China Shanghai SSE dropped -0.09%. Singapore Strait Times rose 0.11%. Japan 10-year JGB yield rose 0.0521 to 0.949.
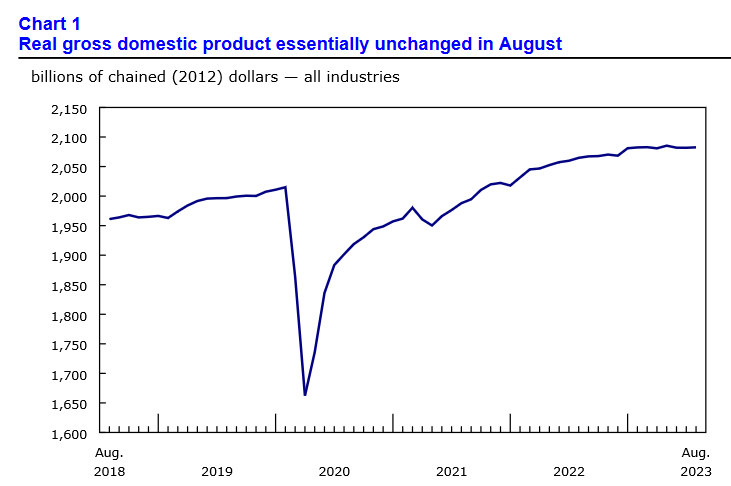
Canada's GDP essentially unchanged in Aug, missed expectations
Canada's GDP was flat at 0.0% mom in August, essentially unchanged for a second month, below expectation of 0.1% mom growth. Services producing industries edged up by 0.1% mom in the month while goods-producing industries contracted -0.2% mom. Overall, 8 of 20 industrial sectors increased.
Statistics Canada noted, "factors such as higher interest rates, inflation, forest fires and drought conditions continued to weigh on the economy".
Advance information suggests that real GDP was essentially unchanged again in September, as well as in Q3. Decreases in mining, quarrying, and oil and gas extraction and utilities were partially offset by increases in the construction and public sectors.
Eurozone CPI slows to 2.9% yoy, lowest since Jul 2021
Eurozone CPI cooled off further in October, decelerating from 4.3% yoy to 2.9% yoy. This slowdown in inflation was more pronounced than market predictions, which had forecasted a rate of 3.1% yoy. Notably, this is the most muted inflation pace the region has experienced since July 2021.
Excluding volatile components in energy, food, alcohol, and tobacco, core CPI experienced a deceleration from 4.5% yoy to 4.2% yoy, hitting its lowest mark since July 2022, and meeting the predictions set by market experts.
Breaking down the main components of inflation, food, alcohol, and tobacco observed the most significant annual inflation rate for October, registering 7.5% compared to 8.8% in September. Services prices recorded a marginal decline, moving from 4.7% in September to 4.6% in October. Non-energy industrial goods also experienced a slowdown, with prices rising 3.5% in October compared to 4.1% in the preceding month.
However, the most dramatic shift was observed in the energy component. Prices in this segment plummeted to -11.1% in October from -4.6% in September, reflecting the volatile nature of global energy markets.
Eurozone GDP contracts -0.1% qoq in Q3, EU grows 0.1% qoq
Eurozone's GDP shrank unexpectedly in Q3, contracting by -0.1% qoq, defying expectations of a stagnant 0.0% growth. When compared with the same quarter of the previous year, Eurozone's growth was barely positive at 0.1% yoy. Meanwhile, the broader EU reported a similar pattern, with a 0.1% growth both qoq and yoy.
The performance across member states varied significantly. Latvia emerged as the top performer with 0.6% growth over the previous quarter, followed by Belgium and Spain, recording 0.5% and 0.3% growth respectively. Conversely, Ireland faced the steepest decline with a -1.8% contraction, followed by Austria at -0.6% and Czechia at -0.3%.
Year-on-year growth rates revealed a similar disparity among the member states. Portugal, Spain, and Belgium led the way with 1.9%, 1.8%, and 1.5% growth respectively. However, Ireland experienced a sharp -4.7% decline, with Estonia (-2.5%), Austria and Sweden (-1.2% both) also facing significant contractions.
BoJ's yield cap redefinition underwhelms
Under the Yield Curve Control framework, BoJ has maintained the short-term policy interest rate at -0.10%, while 10-year JGB yield target remains at around 0%. These decisions were reached unanimously. However, the central bank subtly altered its wording regarding the 10-year JGB yield cap, now referring to the 1.0% level as a "reference in its market operations." This move is perceived as transforming the cap into a flexible upper boundary rather than a strict limit.
Adding to this, BoJ stated, "Given extremely high uncertainties over the economy and markets, it's appropriate to increase flexibility in the conduct of yield curve control." This sentiment was not universally shared, as Nakamura Toyoaki expressed dissent, suggesting that increasing flexibility should be contingent upon confirming a rise to firms' earning power.
In a significant update, BoJ's new economic projections reveal upgraded core inflation forecasts across the board, with a noteworthy jump from 1.9% to 2.8% for fiscal 2024.
Here's a summary of the updated forecasts:
Core CPI Forecasts (July):
- Fiscal 2023: 2.8% (up from 2.5%)
- Fiscal 2024: 2.8% (up from 1.9%)
- Fiscal 2025: 1.7% (up slightly from 1.6%)
Core-Core CPI Forecasts:
- Fiscal 2023: 3.8% (up from 3.2%)
- Fiscal 2024: 1.9% (up from 1.7%)
- Fiscal 2025: 1.9% (up from 1.8%)
GDP Forecasts:
- Fiscal 2023: 2.0% (up from 1.3%)
- Fiscal 2024: 1.0% (down from 1.2%)
- Fiscal 2025: 1.0% (unchanged)
Japan's industrial output lags behind expectations; retail sales see mixed results
Japan's industrial production in September posted subdued growth, clocking in at only 0.2% mom, significantly below the anticipated rise of 2.5% mom. When compared year-on-year , the figures revealed a drop of -4.6% yoy. Furthermore, the output for the third quarter (July-September) saw a decline, registering at -1.3% compared to the preceding quarter. In terms of a seasonally adjusted index, the production at factories and mines was at 103.3, benchmarked against 2020 base of 100.
Feedback from manufacturers, as sourced by the Ministry of Economy, Trade and Industry, paints a mixed picture for the upcoming months. They project an increase in the seasonally adjusted output by 3.9% for October, followed by a decline of -2.8% in November.
Retail statistics for September also indicated a mix of growth and contraction. On a yearly basis, retail sales rose by 5.8% yoy, narrowly missing forecasted 5.9% yoy. However, assessing the data month-on-month reveals a slight decline of -0.1% mom in retail sales.
On the job front, there's a glimmer of positive news. Unemployment rate experienced a marginal dip, moving from 2.7% to 2.6%, aligning with market expectations. The jobs-to-applicant ratio for September remained steady at 1.29, signifying that there were 129 job opportunities available for every 100 job seekers.
China's official PMI indicates manufacturing back in contraction and non-Manufacturing slows
China's economic pulse seems to have lost its rhythm, as indicated by the latest PMI figures for October. The official PMI Manufacturing dropped from 50.2 to 49.5, falling below the anticipated 50.4 mark. This downturn is not an isolated occurrence; the manufacturing sector has experienced contraction in six out of the ten months of 2023 so far.
In a similar vein, PMI Non-Manufacturing sector witnessed a decrease, moving from 51.7 to 50.6, which is also below the projected 51.8. Compounding these concerns is PMI Composite, which aggregates both manufacturing and non-manufacturing sectors. It fell from 52.0 to 50.7, registering its lowest reading since December 2022.
National Bureau of Statistics senior statistician Zhao Qinghe acknowledged these challenges in a statement. He noted, "China's economic activity fell to an extent, and the foundation for a continued recovery still needs to be further solidified."
NZ ANZ business confidence jumped to 23.4, inflation pressures remain
New Zealand's ANZ Business Confidence for October showcased a significant rise, moving from 1.5 to a robust 23.4. This upbeat sentiment was mirrored in the Own Activity outlook, which climbed from 10.9 to 23.1.
A broader analysis of the report's details reveals positive shifts across multiple components: Export intentions rose from -0.4 to 6.1, Investment intentions moved from a negative -4.1 to a positive 3.8, and Employment intentions took a jump from 1.2 to 5.6.
However, while these figures indicate growing optimism in business activities and prospects, inflation front remains a concern. Cost expectations reduced slightly from 78.6 to 76.0. Similarly, Pricing intentions saw a minor drop, moving from 47.1 to 46.3. Inflation expectations also experienced a negligible downtick, adjusting from 4.95% to 4.94%.
Reacting to these numbers, ANZ remarked, "Just as we thought that the rebound in activity indicators in the ANZ Business Outlook survey might be running out of steam, we've seen a marked jump across most."
The bank also cautioned against hasty conclusions based on the current data, especially considering the potential disruptions from the election, suggesting a wait-and-watch approach: "we'll see whether the newfound (relative) optimism persists over the next few months."
On the inflation front, ANZ noted that, "inflation pressures are gradually waning in the big picture." Despite this, the bank emphasized that significant progress in curbing inflation has been missing over recent months. The journey back to the inflation target remains substantial. "We continue to expect it'll take at least one more OCR hike to get us there."
USD/JPY Mid-Day Outlook
Daily Pivots: (S1) 148.63; (P) 149.24; (R1) 149.67; More...
USD/JPY's recent rally resumed by breaking through 150.76 and intraday bias is back on the upside. Next target is 151.93 high. Break there will target 100% projection of 129.62 to 145.06 from 137.22 at 152.66. For now, break of 148.79 support is needed to indicate short term topping. Otherwise, outlook will stay bullish in case of retreat.
In the bigger picture, immediate focus is now on 151.93 resistance (2022 high). Rejection by 151.93, followed by sustained break of 145.06 resistance turned support will argue that rise from 127.20 has completed, and turn outlook bearish for 137.22 support and below. However, sustained break of 151.93 will confirm resumption of long term up trend. Next target will be 61.8% projection of 102.58 to 151.93 from 127.20 at 157.69.
Economic Indicators Update
| GMT | Ccy | Events | Actual | Forecast | Previous | Revised |
|---|---|---|---|---|---|---|
| 21:45 | NZD | Building Permits M/M Sep | -4.70% | -6.70% | -7.00% | |
| 23:30 | JPY | Unemployment Rate Sep | 2.60% | 2.60% | 2.70% | |
| 23:50 | JPY | Industrial Production M/M Sep P | 0.20% | 2.50% | -0.70% | |
| 23:50 | JPY | Retail Trade Y/Y Sep | 5.80% | 5.90% | 7.00% | |
| 00:00 | NZD | ANZ Business Confidence Oct | 23.4 | 1.5 | ||
| 00:30 | AUD | Private Sector Credit M/M Sep | 0.50% | 0.40% | ||
| 01:00 | CNY | NBS Manufacturing PMI Oct | 49.5 | 50.4 | 50.2 | |
| 01:00 | CNY | NBS Non-Manufacturing PMI Oct | 50.6 | 51.8 | 51.7 | |
| 03:28 | JPY | BoJ Interest Rate Decision | -0.10% | -0.10% | -0.10% | |
| 05:00 | JPY | Housing Starts Y/Y Sep | -6.80% | -6.20% | -9.40% | |
| 05:00 | JPY | Consumer Confidence Index Oct | 35.7 | 35.1 | 35.2 | |
| 06:30 | EUR | France Consumer Spending M/M Sep | 0.20% | 0.60% | -0.50% | -0.60% |
| 06:30 | EUR | France GDP Q/Q Q3 P | 0.10% | 0.10% | 0.50% | 0.60% |
| 07:00 | EUR | Germany Import Price Index M/M Sep | 1.60% | 0.40% | 0.40% | |
| 07:00 | EUR | Germany Retail Sales M/M Sep | -0.80% | 0.50% | -1.20% | -1.10% |
| 07:30 | CHF | Real Retail Sales Y/Y Sep | -0.60% | -1.20% | -1.80% | -2.20% |
| 09:00 | EUR | Italy GDP Q/Q Q3 P | 0.00% | 0.10% | -0.40% | |
| 10:00 | EUR | Eurozone GDP Q/Q Q3 P | -0.10% | 0.00% | 0.10% | |
| 10:00 | EUR | Eurozone CPI Y/Y Oct P | 2.90% | 3.10% | 4.30% | |
| 10:00 | EUR | Eurozone CPI Core Y/Y Oct P | 4.20% | 4.20% | 4.50% | |
| 12:30 | CAD | GDP M/M Aug | 0.00% | 0.10% | 0.00% | |
| 12:30 | USD | Employment Cost Index Q3 | 1.10% | 1.00% | 1.00% | |
| 13:00 | USD | S&P/CS Composite-20 HPI Y/Y Aug | 0.30% | 0.10% | ||
| 13:00 | USD | Housing Price Index M/M Aug | 0.50% | 0.80% | ||
| 13:45 | USD | Chicago PMI Oct | 44.7 | 44.1 | ||
| 14:00 | USD | Consumer Confidence Oct | 100.4 | 103 |
Canada’s GDP essentially unchanged in Aug, missed expectations
Canada's GDP was flat at 0.0% mom in August, essentially unchanged for a second month, below expectation of 0.1% mom growth. Services producing industries edged up by 0.1% mom in the month while goods-producing industries contracted -0.2% mom. Overall, 8 of 20 industrial sectors increased.
Statistics Canada noted, "factors such as higher interest rates, inflation, forest fires and drought conditions continued to weigh on the economy".
Advance information suggests that real GDP was essentially unchanged again in September, as well as in Q3. Decreases in mining, quarrying, and oil and gas extraction and utilities were partially offset by increases in the construction and public sectors.
A Trick or a Treat from Bank of Japan: Indirect Way of Scrapping YCC
- BoJ has subtly removed the 1% “hard-capped” upper limit of the 10-year JGB yield which suggests an imminent end to YCC may come sooner than expected.
- Upbeat revised inflation forecasts for FY 2023 to FY 2025 gave a boost to the Japanese stock market where the Nikkei 225 has managed to stage a rebound from its key 200-day MA acting as a support at 30,490,
- The JPY has ignored the indirect mild hawkish guidance from BoJ, and the JPY is the weakest major currency (-1.10% intraday) so far against the US dollar.
- The current 2-year/10-year yield premium spreads between US Treasuries and JGBs have narrowed which does not support the current bullish tone seen in the USD/JPY.
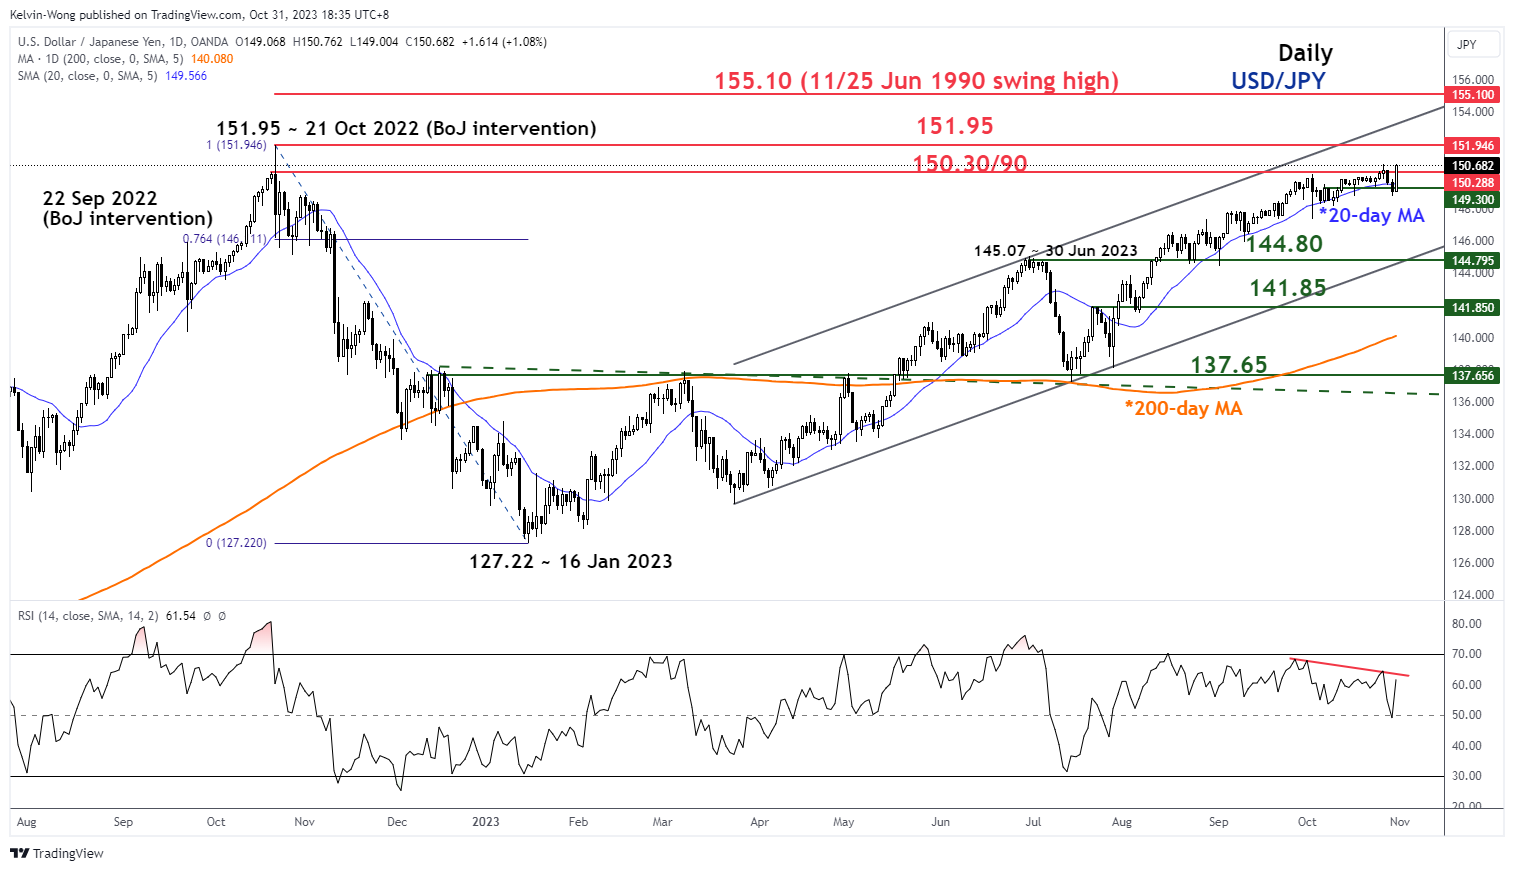
- Watch the 150.90 key medium-term resistance on USD/JPY.
The Bank of Japan (BoJ) has kept its key policy short-term interest rates unchanged at -0.1%, the sole major central bank that still maintains negative interest rates while the rest of the developed world has already exited from accommodative monetary policies except for China.
10-year JGB yield is no longer hard-capped at 1%
Interestingly, BoJ has now introduced another “innovative” way of communicating its forward guidance on its monetary policy by the removal of its 1% hard-capped upper limit of the yield curve control programme (YCC) on the 10-year Japanese government bond (JGB) yield via a redefinition of the 1% as a “loose upper bound” rather than a rigid ceiling.
Also, it has removed the pledge to guard the 1% level on the 10-year JGB yield which in turn put a stop to its daily unlimited bond buying operation.
It seems to be a sneaky move by BOJ, instead of choosing to increase the upper limit of the YCC to a higher “hard” upper limit of 1.5%, it chooses to now use the 1% upper limit as a reference with the “nimbly conducting market operations” balloon box pointing above the 1% reference level (see Figure 1).
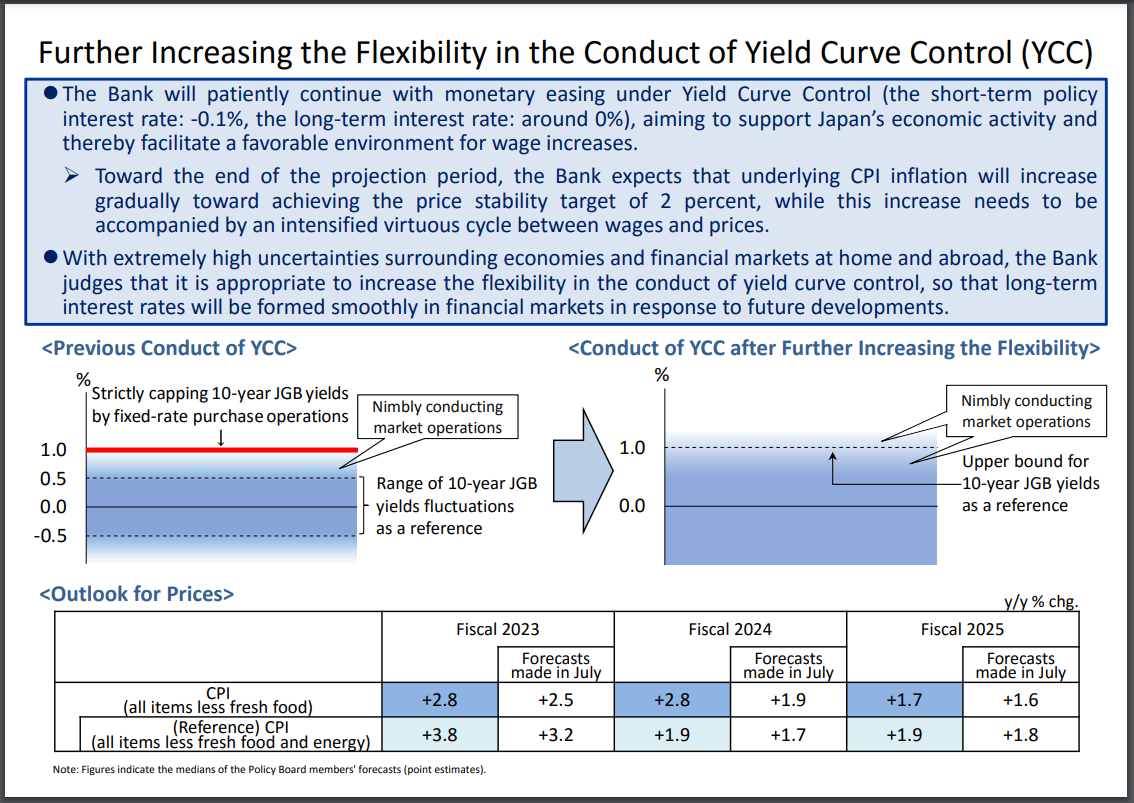
Fig 1: New ultra-flexible yield curve control programme on the 10-year JGB yield (Source: Bank of Japan)
It is the third time since last year December that BoJ has adjusted the effective upper limit of the 10-year JGB yield which clearly suggests the ongoing challenges it faces in maintaining the YCC as it owns more than 50% of outstanding JGBs since the start of the YCC programme in September 2016 that led to an increase in microstructure risk of the JGB market.
Hence, it is an indirect way of upping the upper limit without a new higher “hard level” so that BoJ will not be trapped next time or gamed by speculators if they want to exit YCC completely soon without triggering a potentially disorderly scenario that may trigger negative repercussions in the global financial markets.
Upbeat inflationary forecasts boost positive sentiment in the Japanese stock market
In addition, upbeat inflationary (core-core) forecasts were revised upwards for FY2023 (3.8% y/y vs 3.2% y/y in July), FY2024 (1.9% y/y vs 1.7% y/y in July), and FY2025 (1.9% y/y vs 1.8% y/y in July) indicate a slight hawkish forward guidance which suggests that monetary policy adjustment away from short-term negative interest rates remains on track in the first half of next year which in turn negates imported inflation via a stronger JPY that is likely a boost to consumer sentiment.
The Nikkei 225 has reacted positively and managed to bounce off the key 200-day MA acting as a support at 30,490 for the third time in the past week. In the short to medium term, domestic demand-sensitive sectors such as Retail Trade, Banks, and Financials are likely to see potential positive reactions due to a boost to consumer sentiment and a steeper JGB yield curve (see Figure 2).
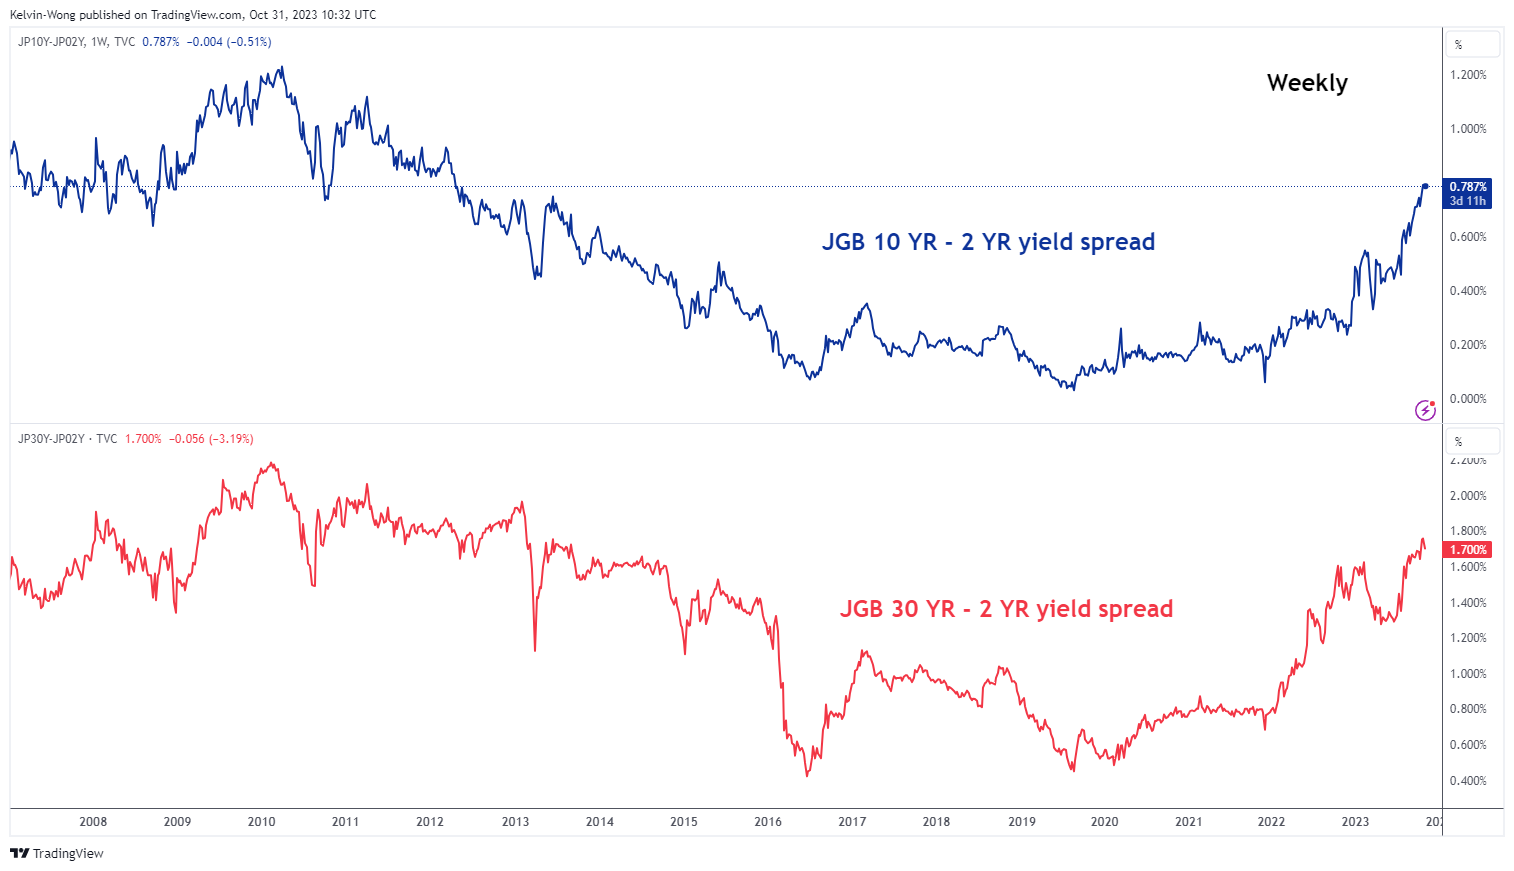
Fig 2: JGB yield curves as of 31 Oct 2023 (Source: TradingView, click to enlarge chart)
In the short term, JPY’s weakness has continued to be stubbornly persistent where the JPY is the worst performing major currency against the US dollar where it shed -1.10% intraday at this time of the writing.
The USD/JPY has completely erased yesterday’s (30 October) US session loss after it printed an intraday low of 148.80 and rallied to hit a current intraday high of 150.76 during the European session today.
Narrowing of the yield premium of US Treasuries over JGBs do not support current bout of JPY weakness
Based on an intermarket perspective, the ongoing swift up move of the USD/JPY may not be sustainable as the 10-year JGB yield is now able to move more “freely” on the upside as the 1% is no longer a hard cap and it rallied to a fresh year-to-date high of 0.96% today, its highest level not seen since May 2013.
In addition, the shorter-term 2-year JGB yield that is more sensitive to the short-term interest rate policy has risen by a steeper pace to close at 0.16% today.
All in all, the 2-year and 10-year yield premium of the US Treasuries over JGBs have continued to narrow this week which in turn does not support the current bullish tone seen in the USD/JPY as it is now approaching the upper limit of the key medium-term resistance zone of 150.30/150.90. (see Figure 3).
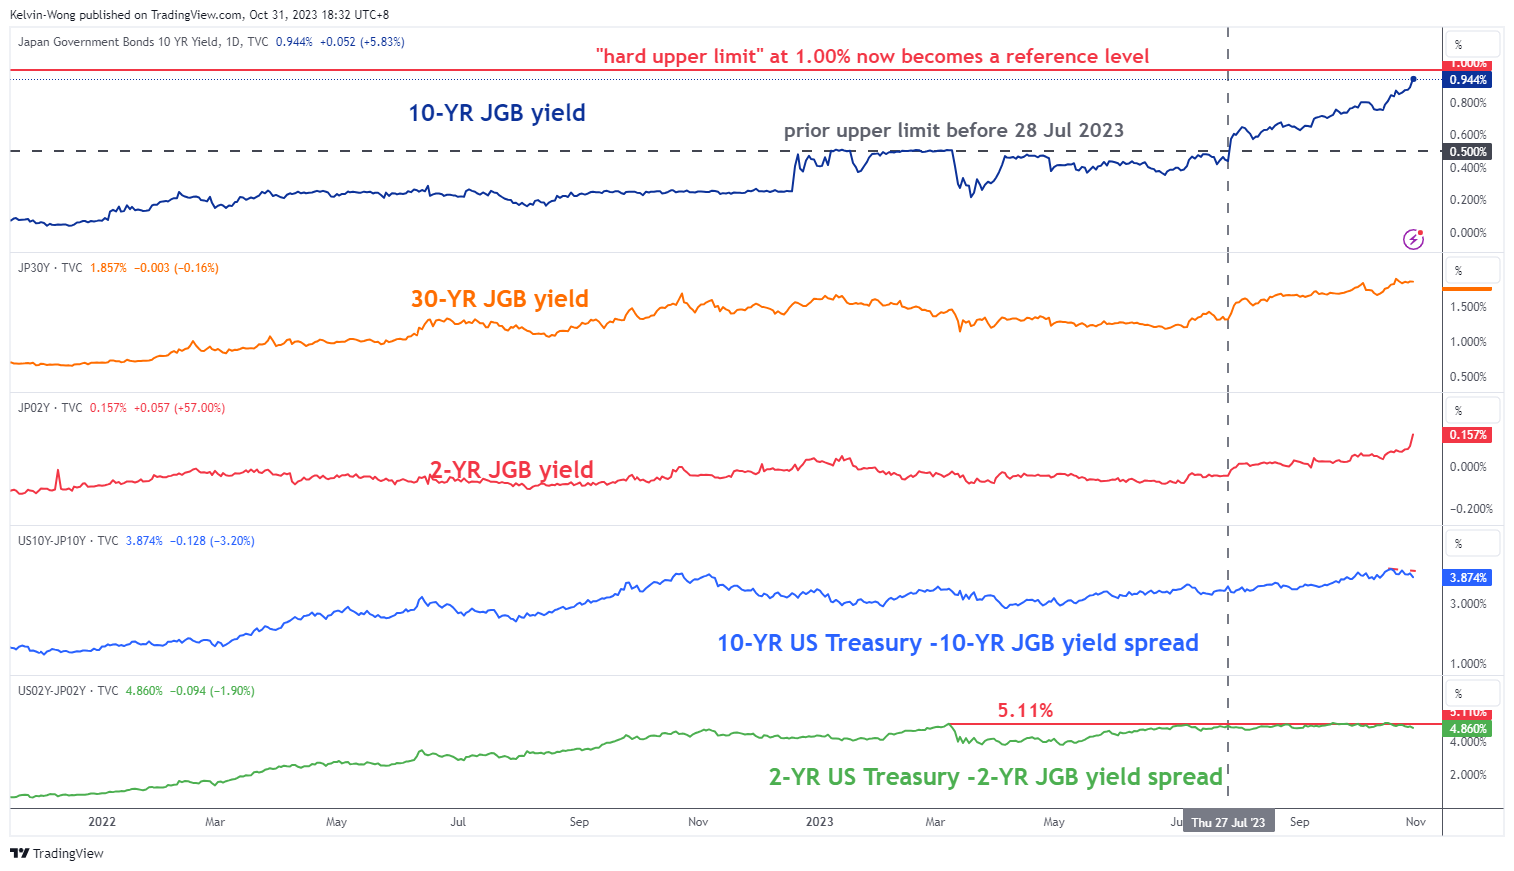
Fig 3: JGB yields, yield spreads & USD/JPY medium-term trend as of 31 Oct 2023 (Source: TradingView, click to enlarge chart)
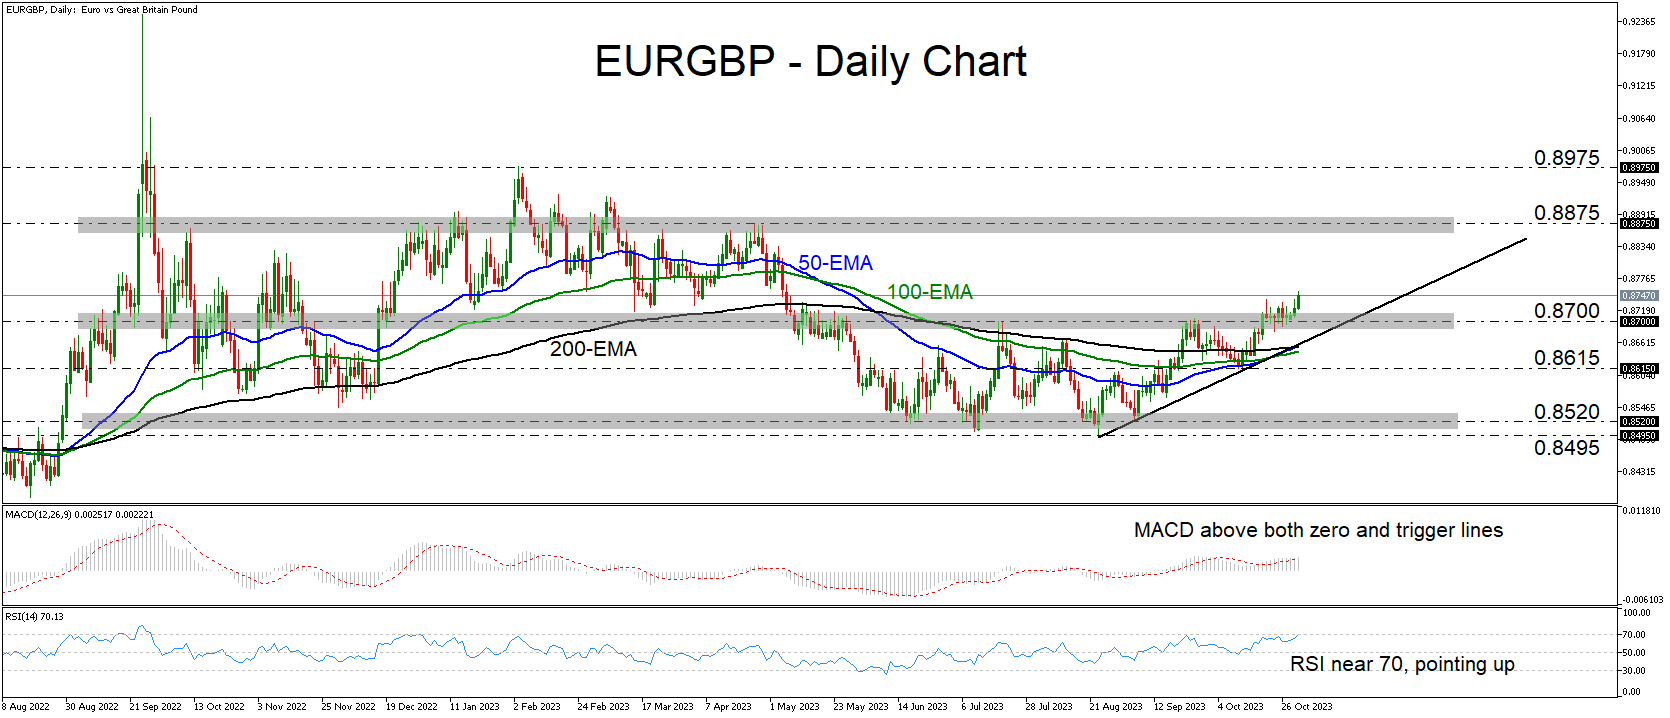
EURGBP Bulls Take the Steering Wheel
- EURGBP moves further away from the upper end of a prior range
- Both the MACD and the RSI indicate positive momentum
- These signs paint a cautiously positive short-term picture
EURGBP bulls have gained the upper hand this week, distancing themselves from the key barrier of 0.8700, fractionally above which the pair has been oscillating since October 20. That zone acted as the upper bound of the sideways range that had been containing most of the price action since May, and thus, the fact that the price is trading above it paints a cautiously positive picture.
Both the MACD and the RSI are detecting upside momentum, corroborating the notion that the bulls will likely stay in the driver’s seat for a while longer. The former runs above both its zero and trigger lines, while the latter lies near its 70 line, pointing up.
If the bulls are willing to continue pushing higher, they may eventually reach the 0.8875 territory, which provided strong resistance on several occasions between December and April. If they are strong enough to overcome it, then the advance may continue towards the peak of February 3 at 0.8975.
On the downside, a slide below 0.8700 and the upside support line drawn from the low of August 23 could confirm the pair’s return within the aforementioned sideways range and turn the outlook back to neutral. The bears may get encouraged to aim for the 0.8615 level, the break of which could carry extensions towards the lower end of the range at around 0.8520.
To recap, EURGBP has been rising this week, already above the key resistance zone of 0.8700, which was the upper boundary of a prior sideways range. From a technical standpoint, this paints a cautiously positive picture, adding to the likelihood of some further advances.
USD/JPY: On Track for Biggest Daily Gain in Months after Bulls Regained Control
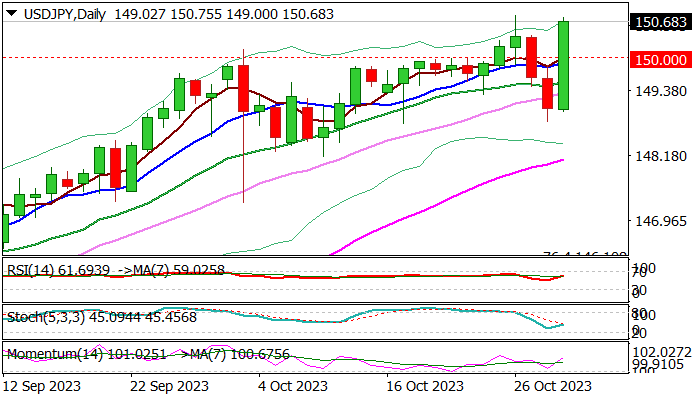
USDJPY bounced strongly on Tuesday and returned above 150 barrier, fully retracing pullback of past two days.
Corrective dip was short-lived and left a bear-trap under 149.03 (50% retracement of 147.29/150.77 upleg), signaling that larger bulls remained unharmed for further gains, as threats of possible intervention faded.
Technical picture on daily chart remains bullish, with repeated daily close above 150 barrier, to confirm fresh signal, along with today’s large bullish daily candle (the pair is on track for the biggest daily gain since July 28).
Renewed bulls cracked former high at 150.77 (Oct 26) and eye a multi-decade peak at 151.94 (Oct 2022).
Dip-buying above 150 (psychological/10DMA) is favored, with 20DMA (149.55) marking the first lower pivot and guard a breakpoint at 149.00 zone.
Res: 150.77; 151.23; 151.56; 151.94.
Sup: 150.40; 150.00; 149.44; 149.03.