Sample Category Title
Markets Quiet in Anticipation: BoJ, Fed, and BoE Coupled with Key Economic Releases
The foreign exchange markets have commenced the week on a relatively quiet note, with major currency pairs and crosses adhering closely to Friday's trading range. Commodity currencies have shown a modest edge, while European majors appear somewhat subdued. Yen and Dollar find themselves in an intermediate position, but overall market volatility remains notably low. Traders are poised for a week packed with significant events, including pivotal meetings by BoJ, Fed, and BoC, alongside critical data releases such as Eurozone CPI and US non-farm payrolls.
In equity markets, Japan's Nikkei index is experiencing notable weakness, particularly with eyes on 30k mark in anticipation of BoJ's decision. Chinese stocks, on the other hand, seem to have found some stability. Over the weekend, news that over 30 Chinese listed companies announced share buyback and purchase plans provided a degree of support. However, the resultant uplift in Shanghai's SSE index remains somewhat muted. In the commodities sector, Gold is holding steady above 2000 level, with no immediate indications of a pullback. Similarly, Bitcoin is trading within a tight range, just below 35k mark.
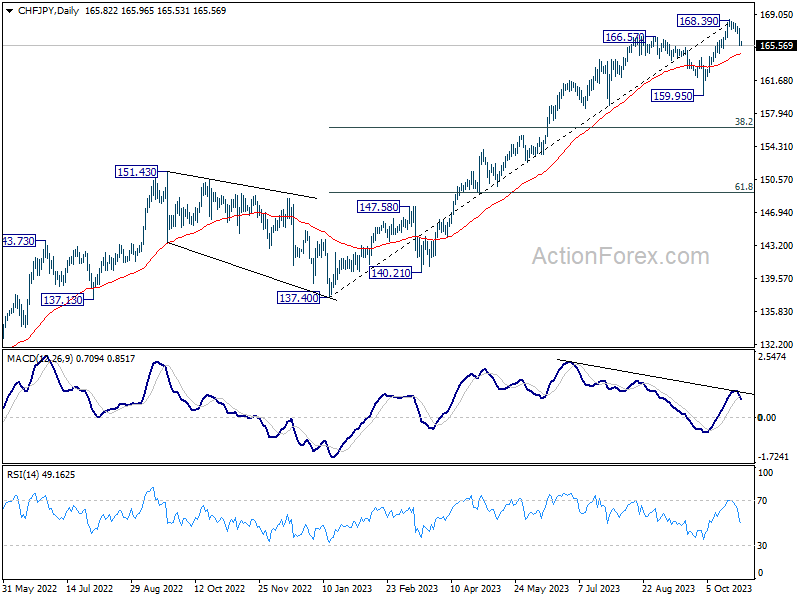
Technically, CHF/JPY's pull back from 168.39 appears to be gathering some momentum. Risk is now mildly on the downside for a take on 55 D EMA (now at 164.61). Sustained break there will argue that a medium term top was already formed, on bearish divergence condition in D MACD. In this case, deeper decline would be seen to 159.95 support, and possibly below. Eyes are now on how the CHF/JPY will respond to the upcoming BoJ policy decision, slated for tomorrow.
In Asia, at the time of writing, Nikkei is down -1.33%. Hong Kong HSI is down -0.28%. China Shanghai SSE is up 0.17%. Singapore Strait Times is up 0.16%.
Australian retails rose 0.9% mom, strong Sep in subdued 2023
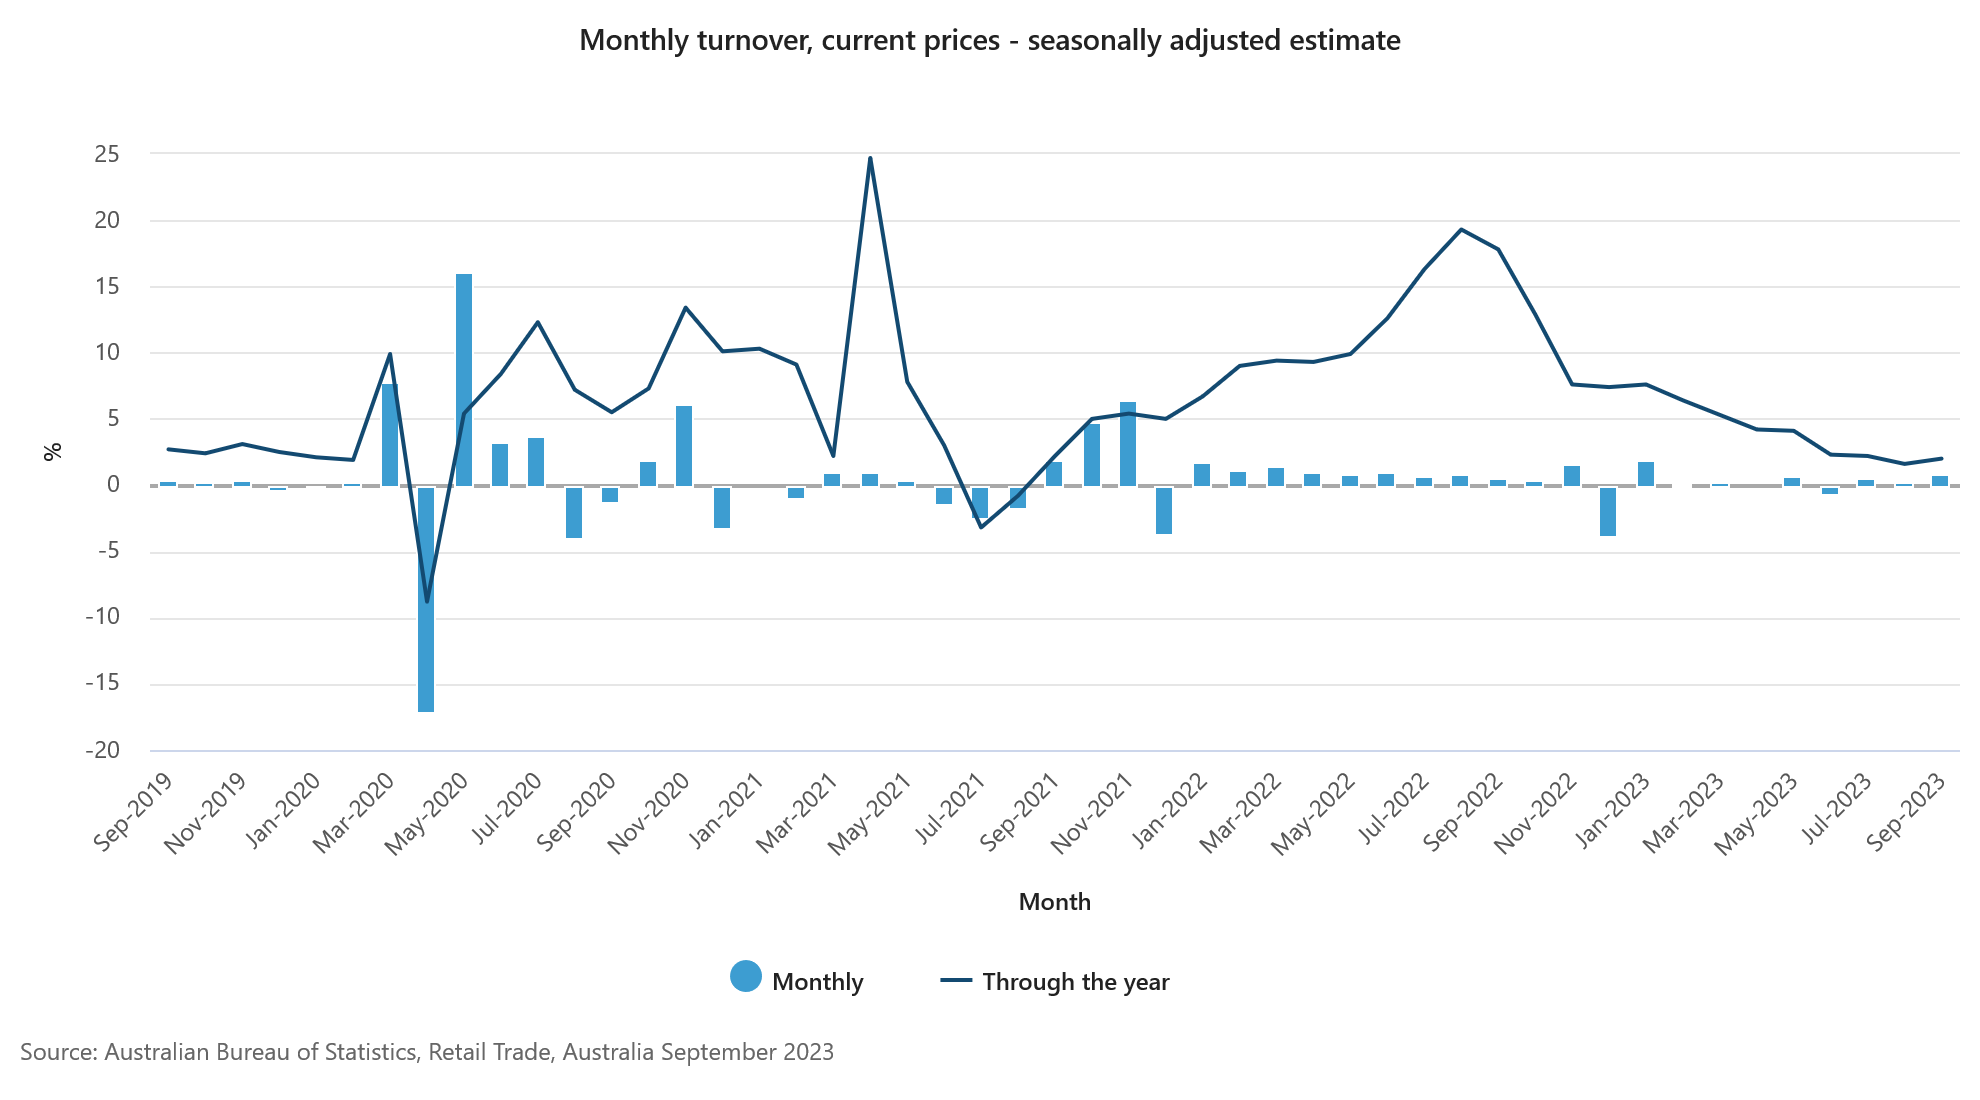
Australia's retail sales turnover registered a 0.9% mom growth in September to AUD 35.87B. This robust performance dwarfed the modest analyst expectations of a 0.3% mom growth. On an annual basis, sales turnover presented a rise of 2.0% yoy compared to the same month in the preceding year.
Speaking on the development, Ben Dorber, ABS head of retail statistics, elucidated, "The strong rise in September came from a diverse range of factors across the Retail industry." He pinpointed the uncommonly warm onset of spring as a significant catalyst while technology and energy-conscious programs also had their roles.
However, while September's figures paint a buoyant picture, Dorber pointed to a more restrained broader context.
"While the rise in September was the largest since January, subdued spending for most of 2023 means that underlying growth in Retail turnover remains historically low," he said.
Adding weight to this perspective, he shared that "Retail turnover in trend terms is up only 1.5 per cent compared to September 2022 - the smallest trend growth over 12 months in the history of the series."
BoJ, Fed, and BoE meetings aid key data tsunami
This week, the global financial markets are eagerly awaiting decisions and insights from three major central banks, coupled with a flurry of critical economic data set to be released.
Starting with BoJ on Tuesday, expectations are firmly set on maintaining current monetary policy, including -0.10% negative short-term rate target and yield curve control parameters. However, a significant focus will be on the bank's new inflation projections in the quarterly Outlook for Economic Activity and Prices report. Market anticipations lean towards an upgraded fiscal 2024 core inflation forecast to 2% range.
Discussions around BoJ's exit from its ultra-loose monetary policy have been rife, but such a move doesn't seem imminent. A recent Reuters poll revealed that only 17 of 27 economists foresee BoJ ending its negative rate policy by the end of 2024, with the rest predicting "2025 or later". Of those predicting a 2024 change, April is flagged by 10 economists as the likely timing for the end of negative rates.
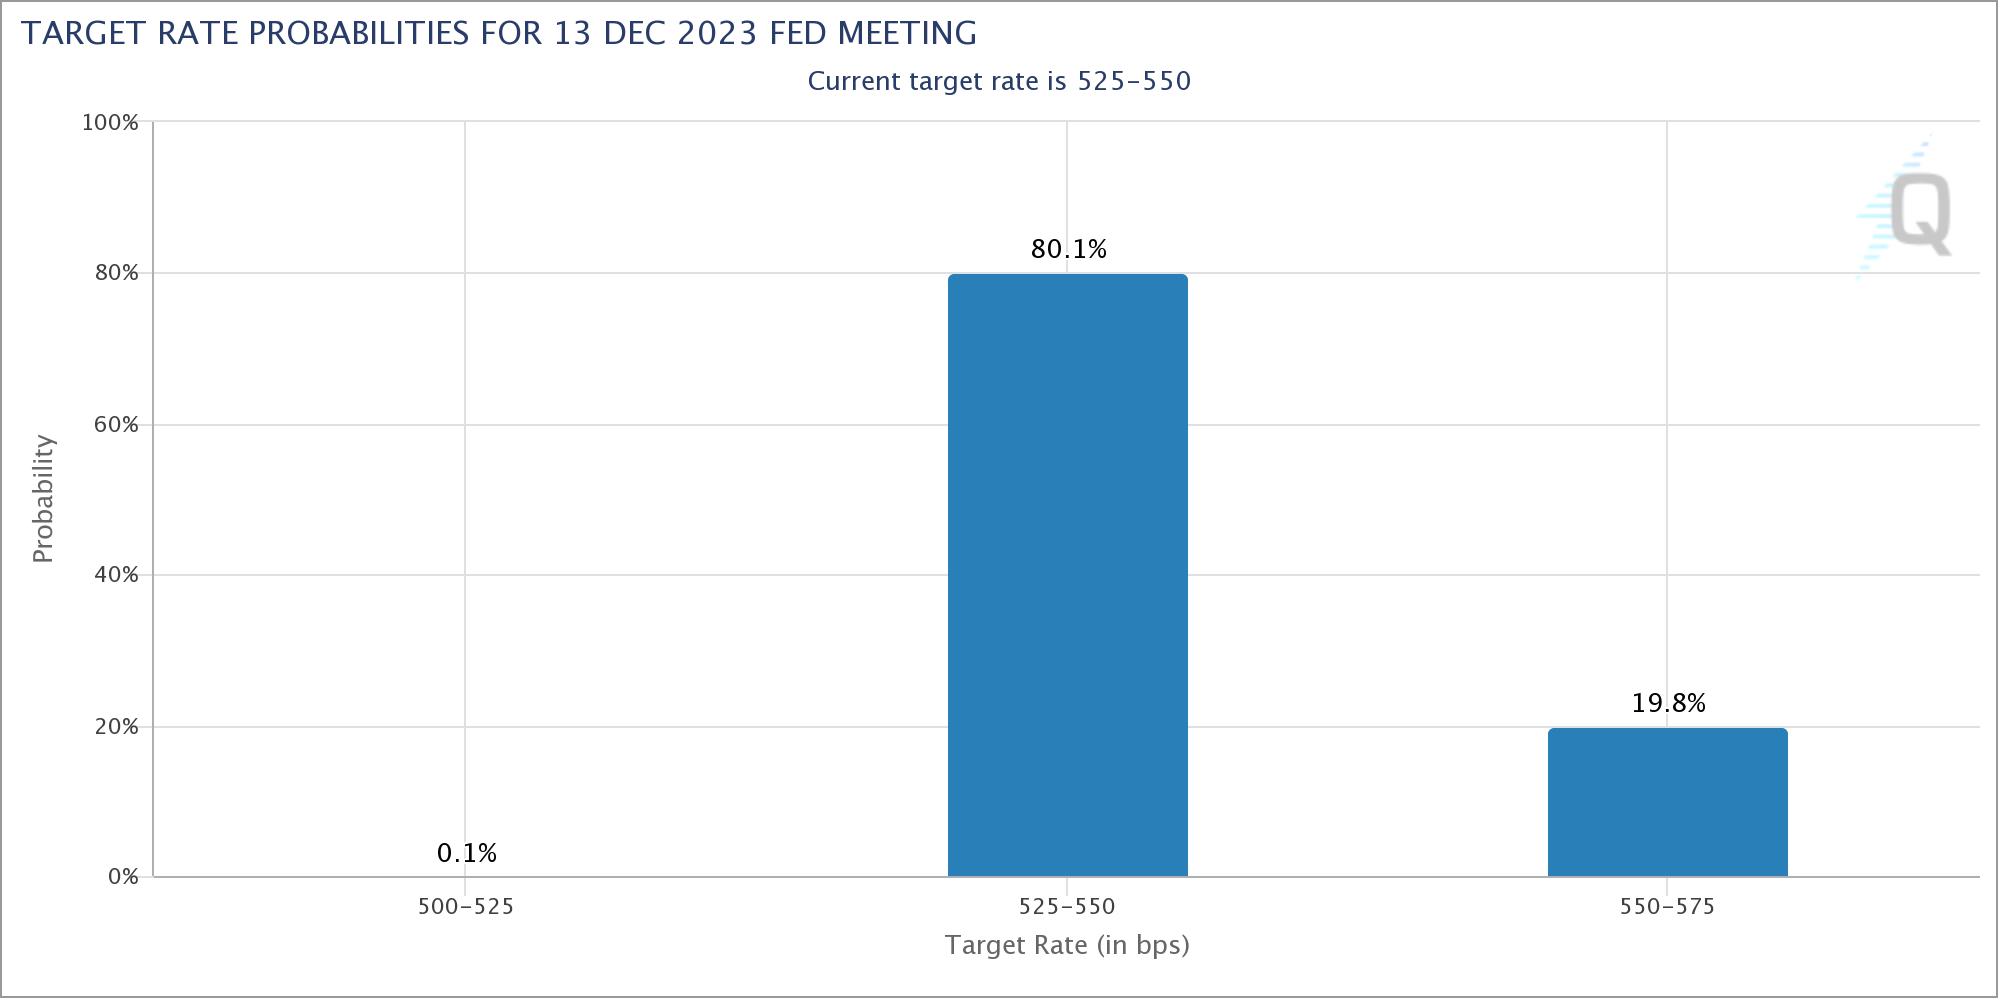
Shifting focus to Fed decision on Wednesday, it is widely anticipated that interest rates will remain unchanged at 5.25-5.50% for the second consecutive meeting. The likelihood of a surprise is minimal, as fed fund futures indicate a 99.9% chance of maintaining the current rate. However, the possibility of another rate hike in December remains a topic of debate. Currently, the probability of an additional 25bps hike is priced in at just 19.8% in fed funds futures.
Fed Chair Jerome Powell is expected to reinforce the commitment to combating inflation while maintaining vigilance. He may also reiterate the idea that higher treasury yields could reduce the need for further tightening. Beyond that, it's unlikely for Powell to give more hints. For FOMC members, December decision would be heavily dependent on the new economic projections available by then.
Over at BoE on Thursday, the consensus is for interest rates to hold steady at 5.50%, despite September's unexpectedly stable inflation rate of 6.7%. According to a Reuters poll, the majority of economists, 61 of 73, predict no rate change this time. However, given the tight 5-4 vote during the last decision to hold, any unexpected shifts in the upcoming economic projections could easily tilt the scales.
Apart from these central bank meetings, the economic calendar is packed with high-profile data releases, including US ISMs and Nonfarm Payrolls, Eurozone CPI flash and GDP, Swiss CPI, Canadian CPI, New Zealand employment, and Chinese PMIs. These data points, along with the central banks' decisions and projections, will be crucial in shaping market sentiments and potentially ushering in new market trends.
USD/CAD Daily Outlook
Daily Pivots: (S1) 1.3820; (P) 1.3850; (R1) 1.3905; More...
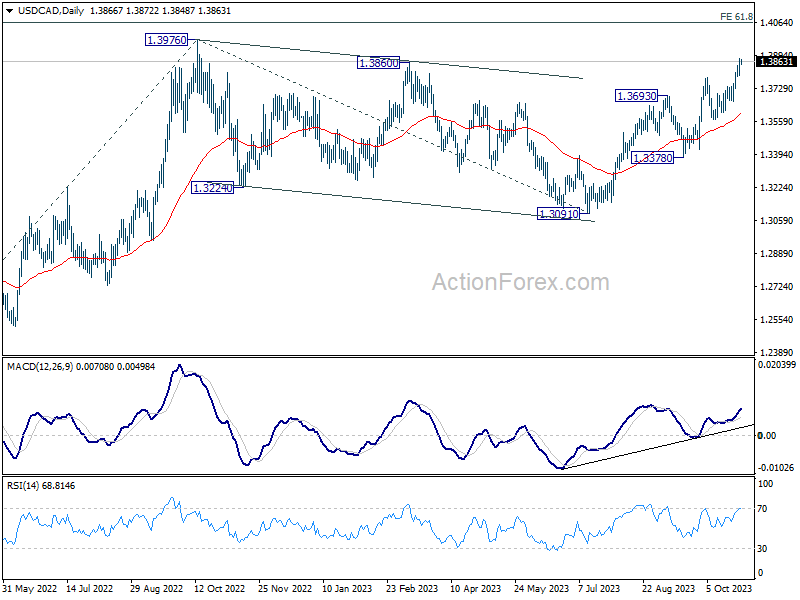
Intraday bias in USD/CAD remains on the upside at this point. Further rally should be seen to retest 1.3976. Decisive break there will resume larger up trend to 1.4064 projection level. On the downside, below 1.3794 minor support will turn intraday bias neutral and bring consolidations, before staging another rally.
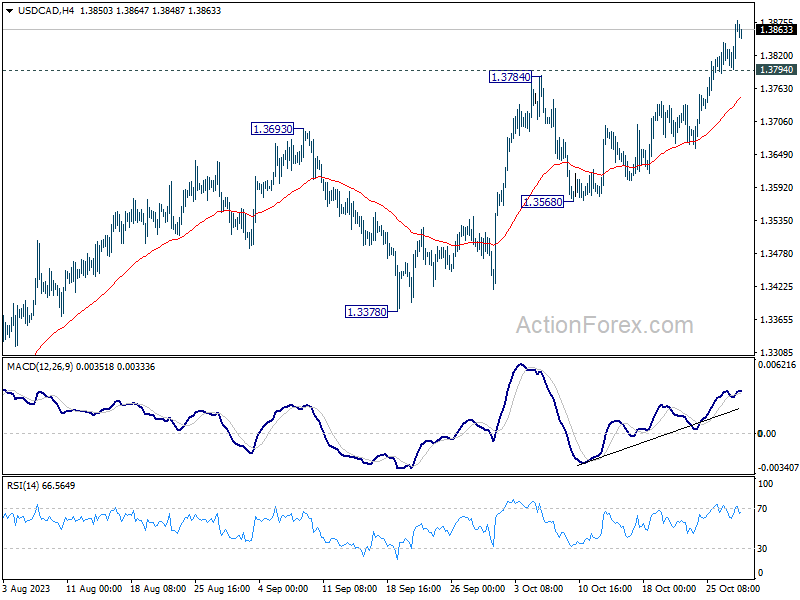
In the bigger picture, corrective pattern from 1.3976 (2022 high) should have completed with three waves down to 1.3091. Decisive break of 1.3976 high will confirm resumption of up trend from 1.2005 (2021 low). Next target will be 61.8% projection of 1.2401 to 1.3976 from 1.3091 at 1.4064. This will now remain the favored case as long as 1.3568 support holds.
Economic Indicators Update
| GMT | Ccy | Events | Actual | Forecast | Previous | Revised |
|---|---|---|---|---|---|---|
| 00:30 | AUD | Retail Sales M/M Sep | 0.90% | 0.30% | 0.20% | 0.30% |
| 07:00 | EUR | Germany GDP Q/Q Q3 P | -0.20% | 0.00% | ||
| 08:00 | CHF | KOF Economic Barometer Oct | 95.6 | 95.9 | ||
| 09:30 | GBP | Mortgage Approvals (GBP) Sep | 44K | 45K | ||
| 09:30 | GBP | M4 Money Supply M/M Sep | 0.10% | 0.20% | ||
| 10:00 | EUR | Eurozone Economic Sentiment Indicator Oct | 93.3 | 93.3 | ||
| 10:00 | EUR | Eurozone Industrial Confidence Oct | -9 | |||
| 10:00 | EUR | Eurozone Services Sentiment Oct | 4 | |||
| 10:00 | EUR | Eurozone Consumer Confidence Oct F | -17.9 | -17.9 | ||
| 13:00 | EUR | Germany CPI M/M Oct P | 0.20% | 0.30% | ||
| 13:00 | EUR | Germany CPI Y/Y Oct P | 4.00% | 4.50% |
Technical Outlook and Review
DXY:
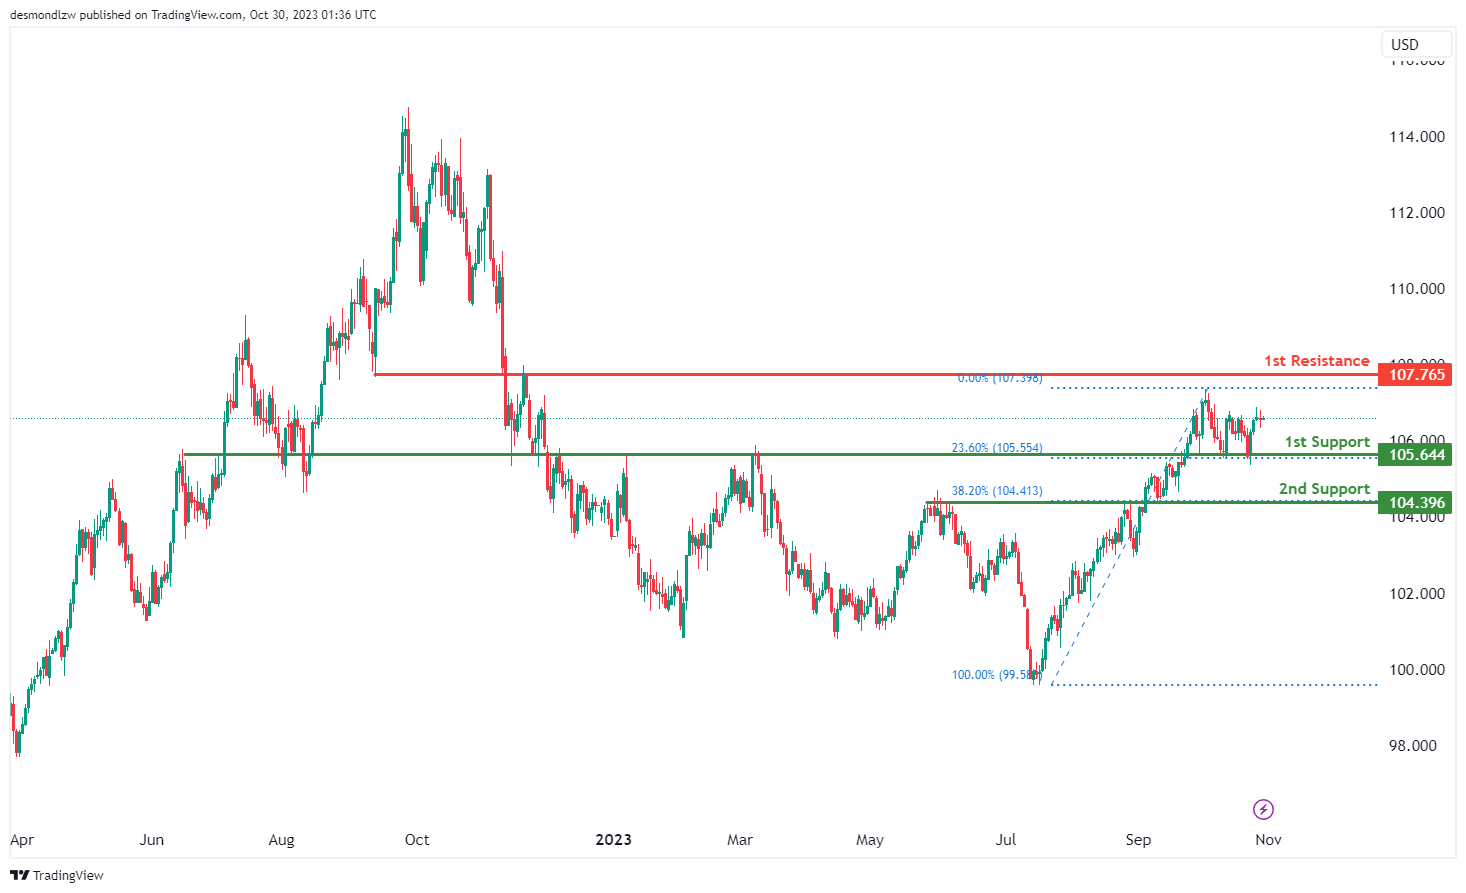
The DXY chart currently exhibits bullish momentum, suggesting the potential for a bullish continuation towards the 1st resistance.
The 1st support at 105.64 is considered significant as it aligns with an overlap support and coincides with the 23.60% Fibonacci Retracement level, indicating its potential to serve as a strong area of price support. Additionally, the 2nd support at 104.39 is identified as another overlap support and corresponds to the 38.20% Fibonacci Retracement level, further reinforcing its potential as a support level.
On the resistance side, the 1st resistance at 107.76 is characterized as an overlap resistance, implying that it could pose a significant obstacle to any notable upward price movement. The overall bullish momentum suggests a potential continuation towards this resistance level.
EUR/USD:
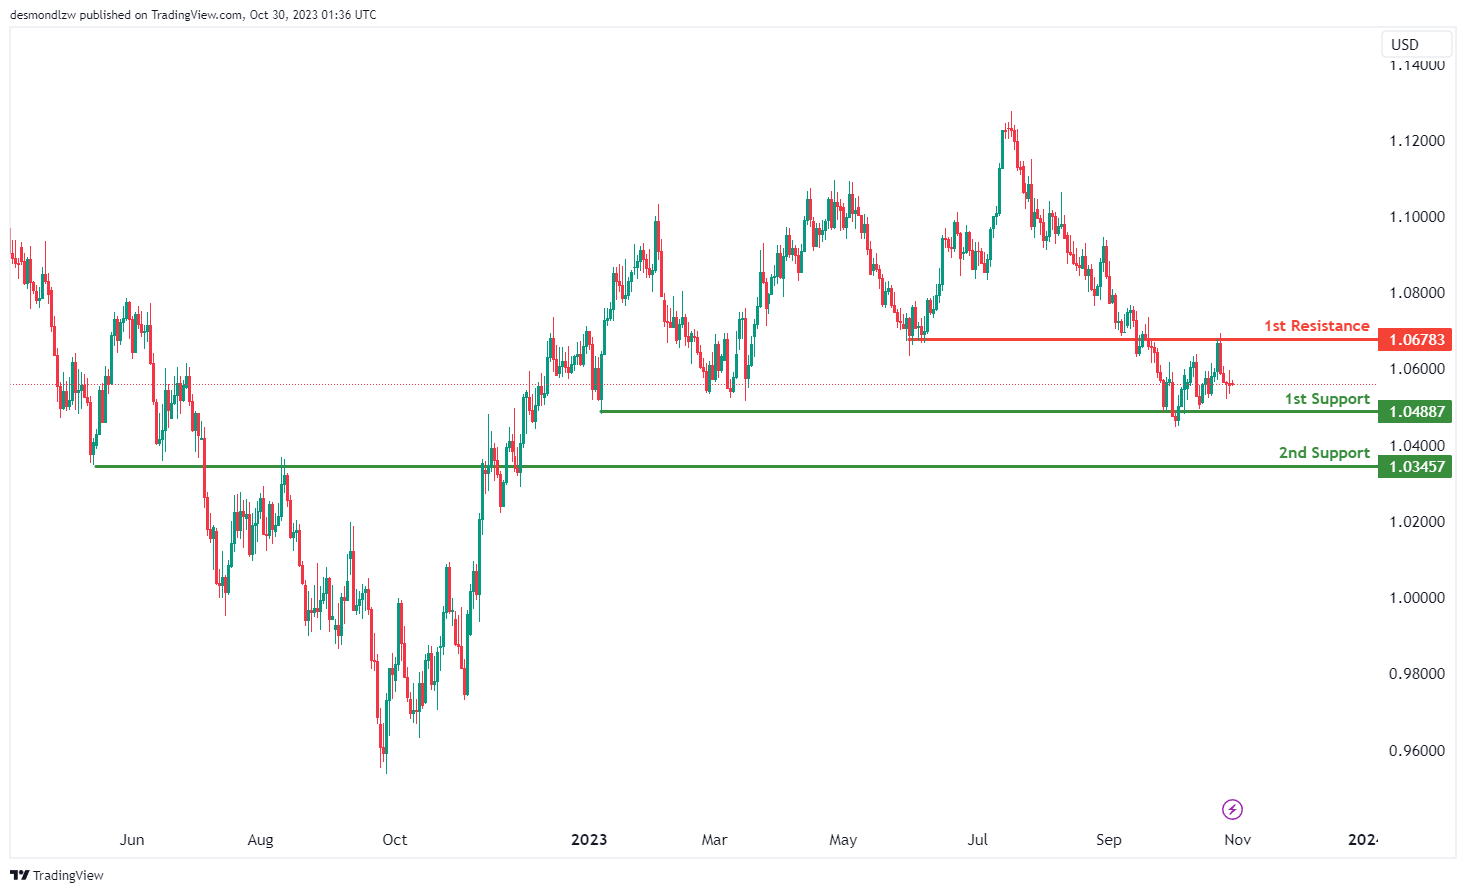
The EUR/USD chart currently demonstrates neutral momentum, indicating the potential scenario of price fluctuating between the 1st resistance and 1st support levels.
The 1st support at 1.0488 is considered significant as it aligns with an overlap support, suggesting a potential area of price support. Additionally, the 2nd support at 1.0345 is also identified as an overlap support, reinforcing its potential role as a support level.
On the resistance side, the 1st resistance at 1.0678 is characterized as an overlap resistance, indicating a potential barrier to further upward price movements. The overall neutral momentum suggests that the price may oscillate within this range for the time being.
EUR/JPY:
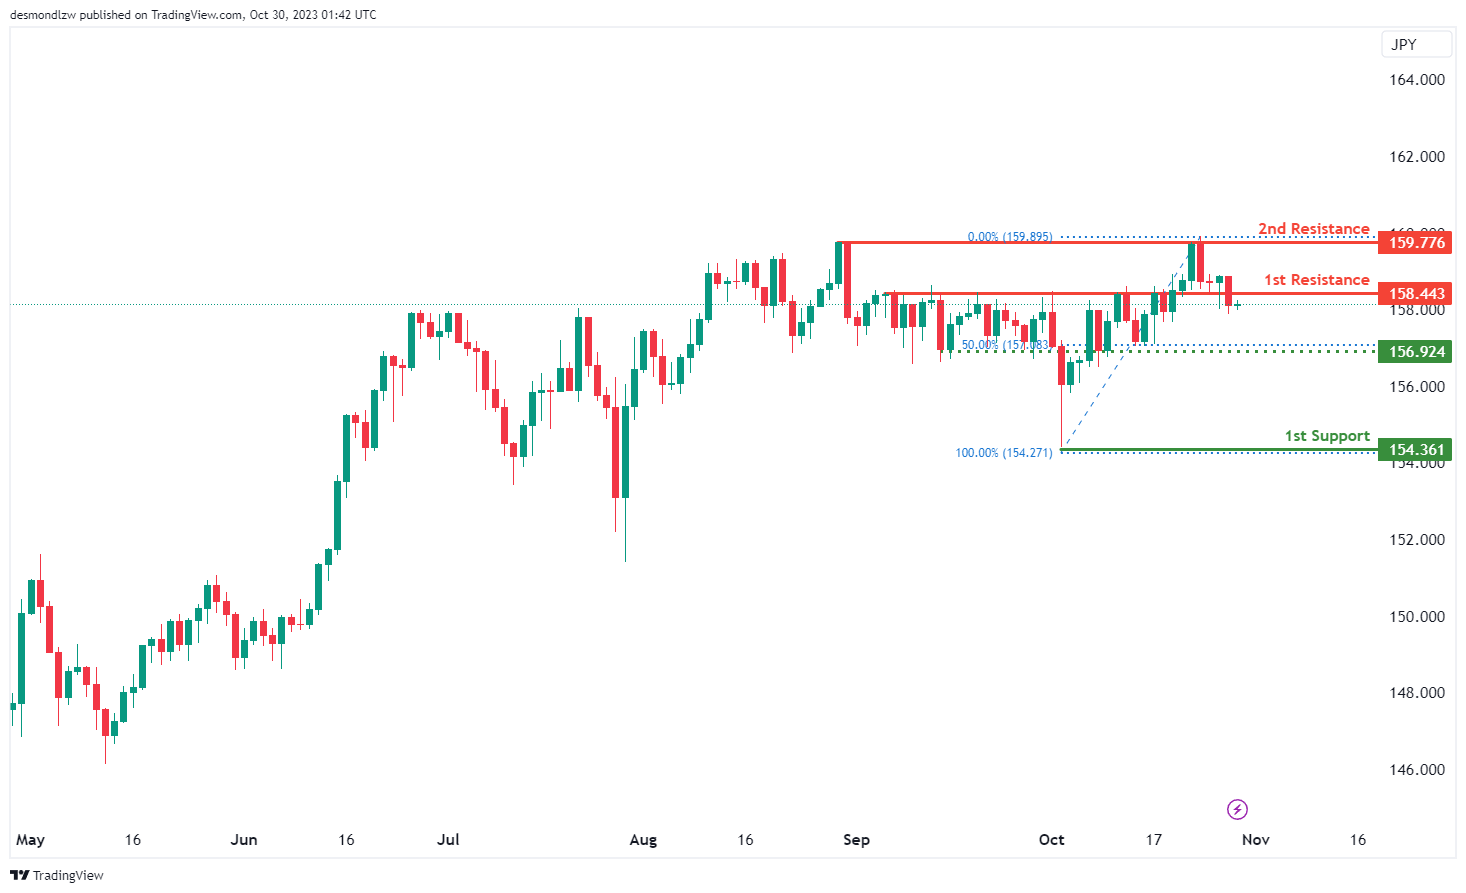
The EUR/JPY chart currently exhibits bearish momentum, suggesting the potential for a bearish continuation towards the 1st support level.
The 1st support at 154.36 is considered significant as it aligns with a swing low support level, indicating a potential area of price support. Additionally, there is an intermediate support at 156.92, which coincides with an overlap support and the 50% Fibonacci Retracement level, further reinforcing its significance as a potential strong support level.
On the resistance side, the 1st resistance at 158.44 is identified as a pullback resistance level. Additionally, the 2nd resistance at 159.77 is characterized as a swing high resistance, indicating another potential level where the price may face resistance in its bearish trajectory.
EUR/GBP:
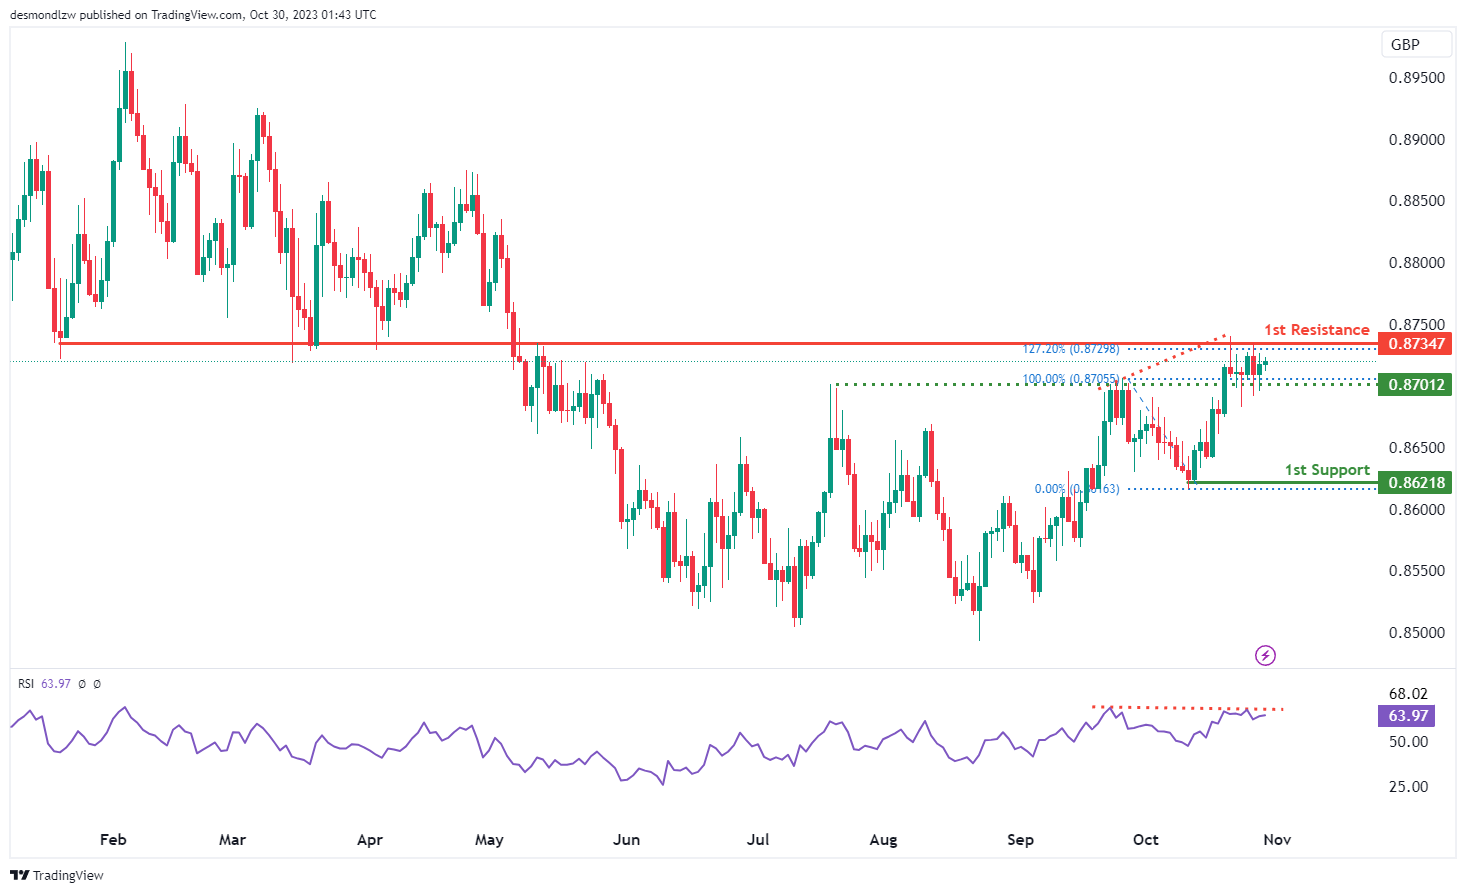
The EUR/GBP chart currently demonstrates bearish overall momentum, indicating the potential for a bearish continuation towards the 1st support at 0.8622.
The 1st support is considered significant as it aligns with a swing low support, indicating its potential as a strong support level. Additionally, there is an intermediate support at 0.8701, identified as an overlap support, which adds another layer of potential price support.
On the resistance side, the 1st resistance at 0.8735 is characterized as an overlap resistance, reinforcing its potential as a barrier to upward price movements.
It’s worth noting that the Relative Strength Index (RSI) is also displaying bearish divergence versus price, suggesting the possibility of a reversal occurring soon. This divergence adds further weight to the potential for a bearish move.
GBP/USD:
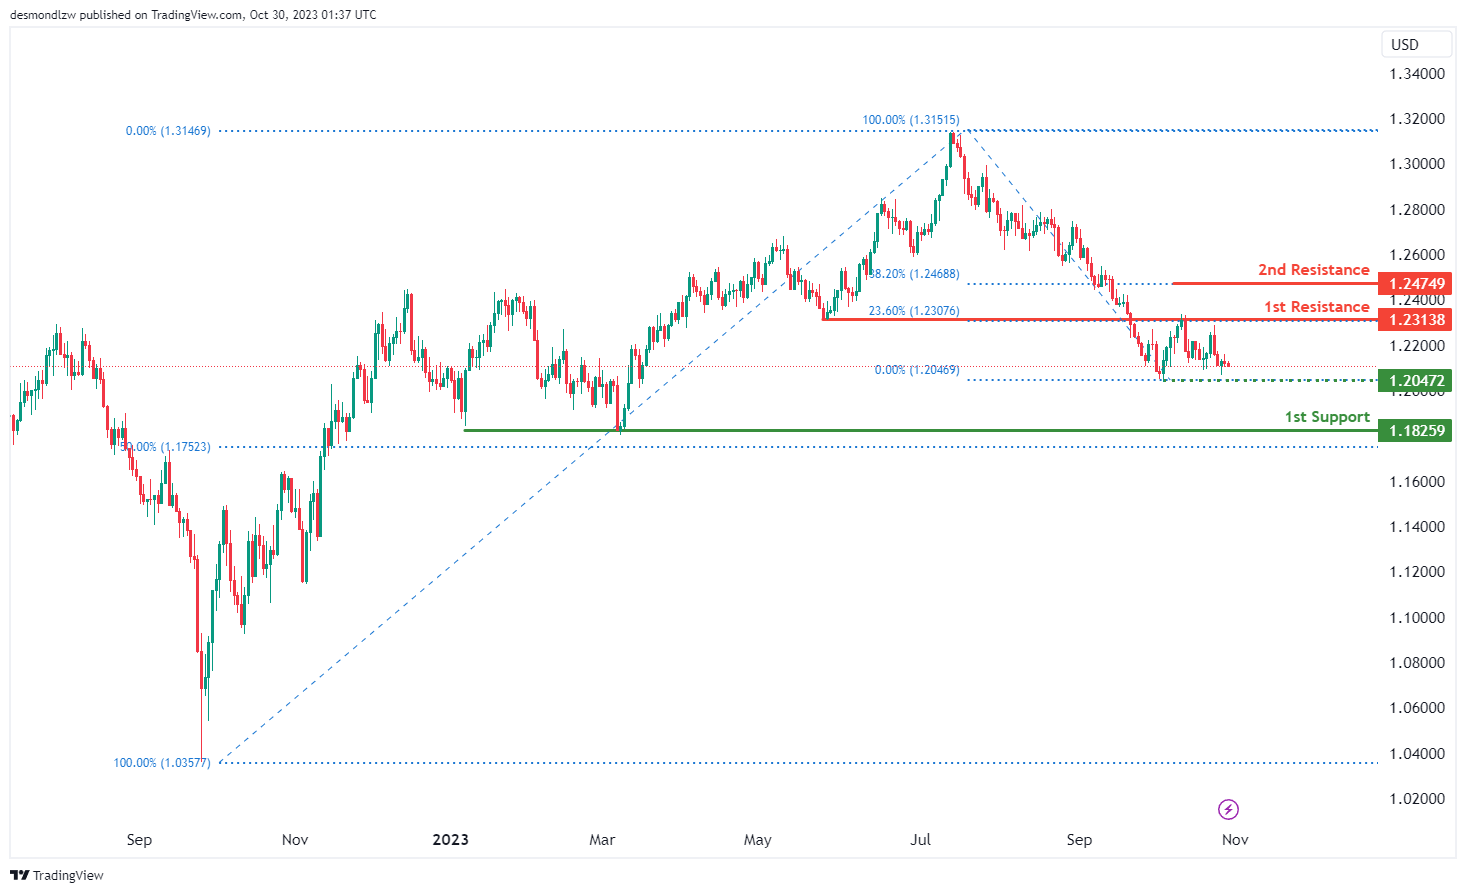
The GBP/USD chart currently demonstrates a bearish momentum, suggesting the potential for a bearish continuation towards the 1st support level at 1.1825.
The 1st support at 1.1825 is considered significant as it aligns with a swing low support level and coincides with the 50% Fibonacci Retracement, making it a strong potential support zone. Additionally, there is an intermediate support at 1.2047, which is associated with a swing low support, providing further potential support for the price.
On the resistance side, the 1st resistance at 1.2313 is characterized as an overlap resistance and aligns with the 23.60% Fibonacci Retracement, indicating a potential barrier to further upward price movements. Furthermore, the 2nd resistance at 1.2474 is noted as a level with 38.20% Fibonacci Retracement, adding to its significance as a potential area where the price may face resistance.
GBP/JPY:
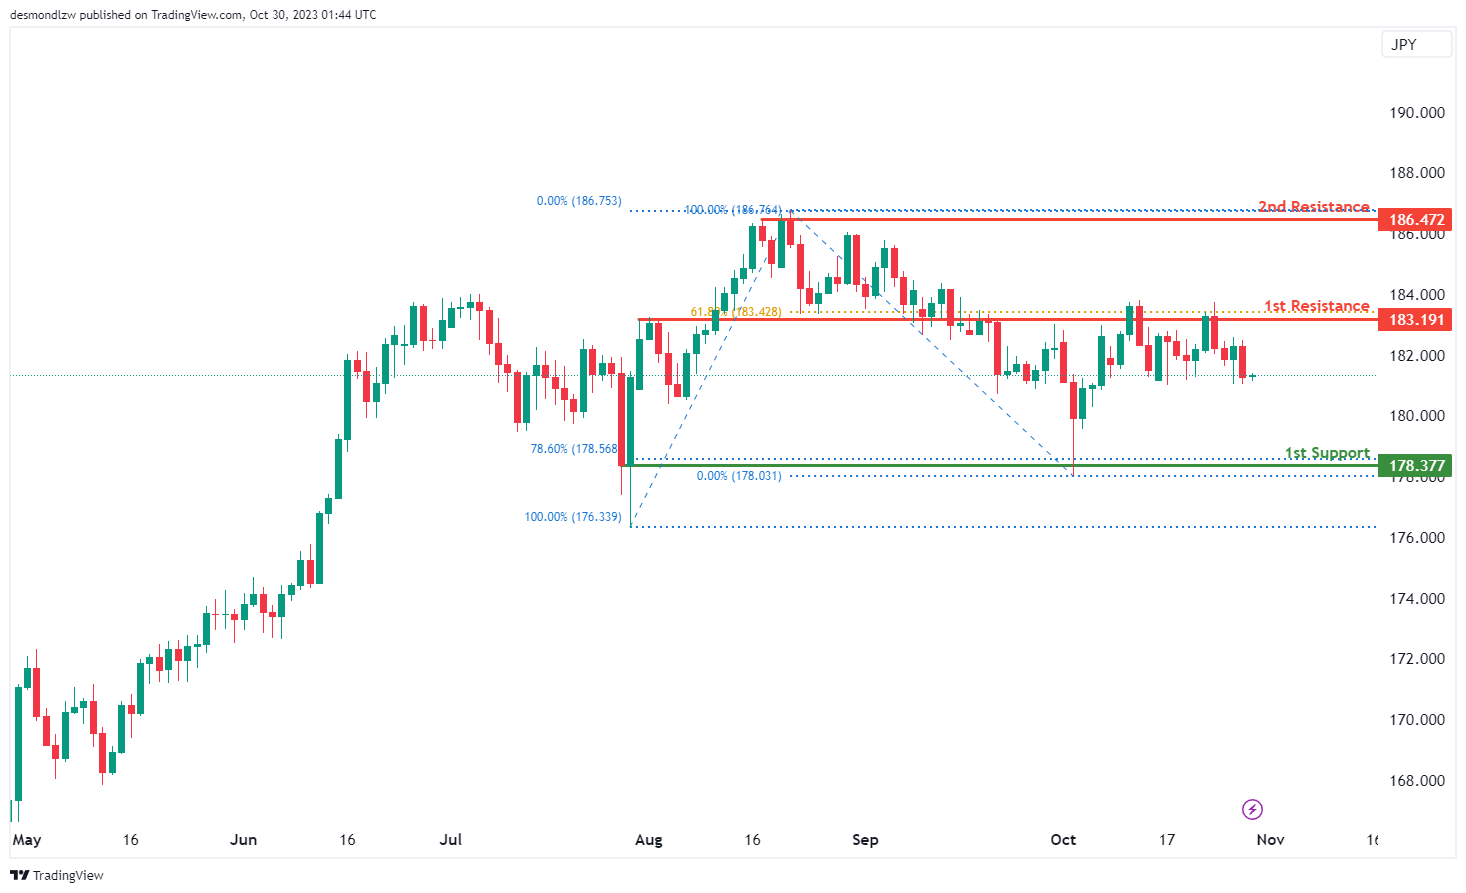
The GBP/JPY chart currently exhibits bearish overall momentum, indicating the potential for a bearish continuation towards the 1st support at 178.37.
The 1st support is considered significant as it aligns with a multi-swing low support and coincides with the 78.60% Fibonacci Retracement level, making it a strong potential support zone.
On the resistance side, the 1st resistance at 183.19 is characterized as an overlap resistance and is associated with the 61.80% Fibonacci Retracement level, making it a potential barrier to further upward price movement. The 2nd resistance at 186.47 is identified as a multi-swing high resistance, further reinforcing its potential as a resistance level.
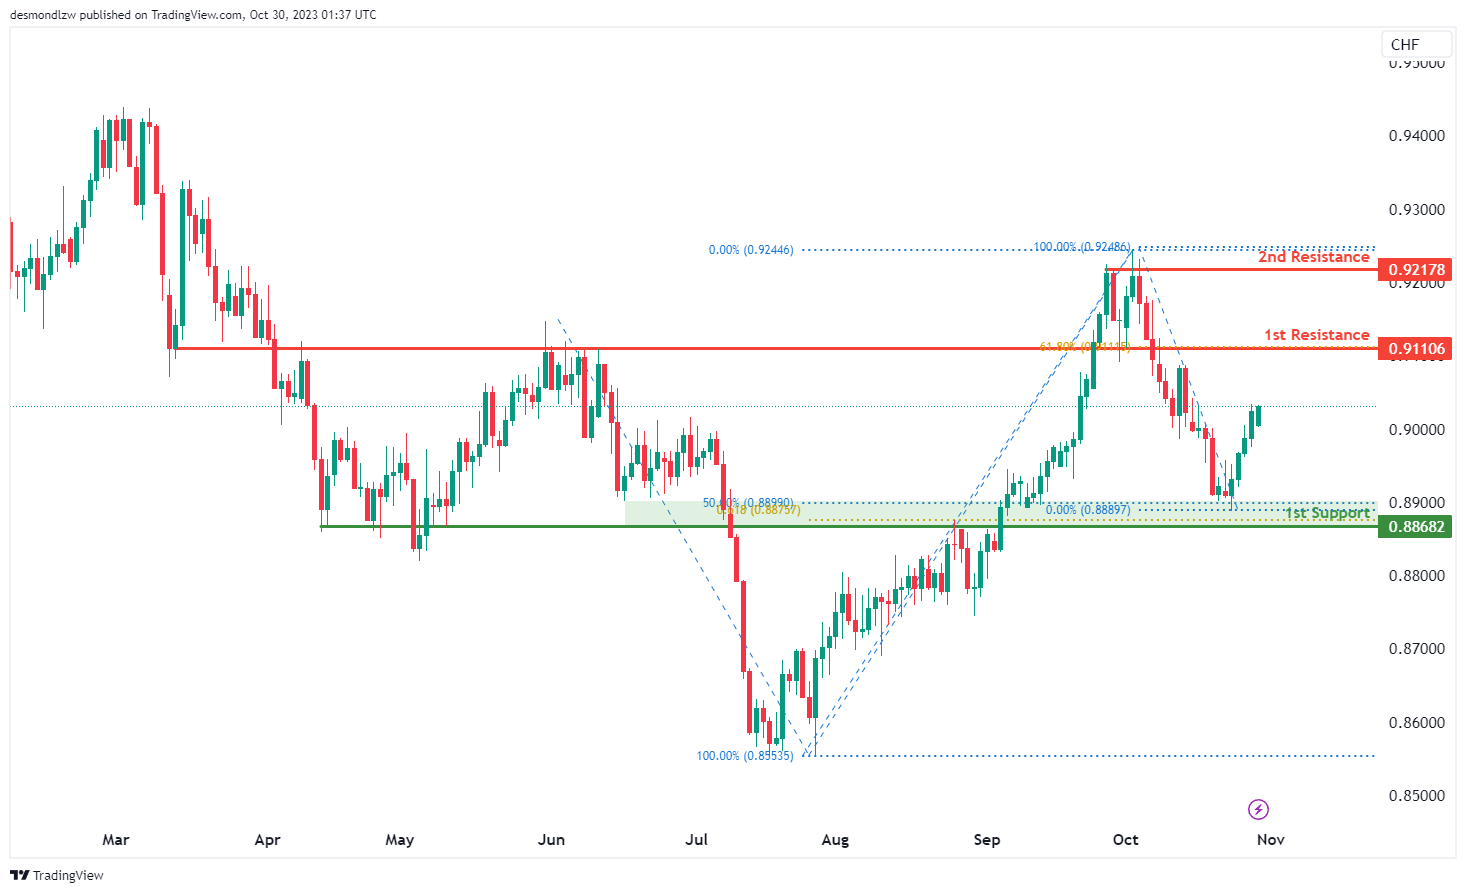
USD/CHF:
The USD/CHF chart currently exhibits a bullish overall momentum, indicating the potential for a bullish continuation towards the 1st resistance level.
The 1st support at 0.8868 is considered significant as it aligns with an overlap support level, and it also coincides with the 50% Fibonacci Retracement and the 61.80% Fibonacci Projection, indicating Fibonacci confluence. This makes it a strong potential support zone.
On the resistance side, the 1st resistance at 0.9110 is characterized as a pullback resistance level, and it aligns with the 61.80% Fibonacci Retracement. Additionally, there is a 2nd resistance level at 0.9217, which is identified as a multi-swing high resistance, further reinforcing the potential for resistance in this area.
USD/JPY:
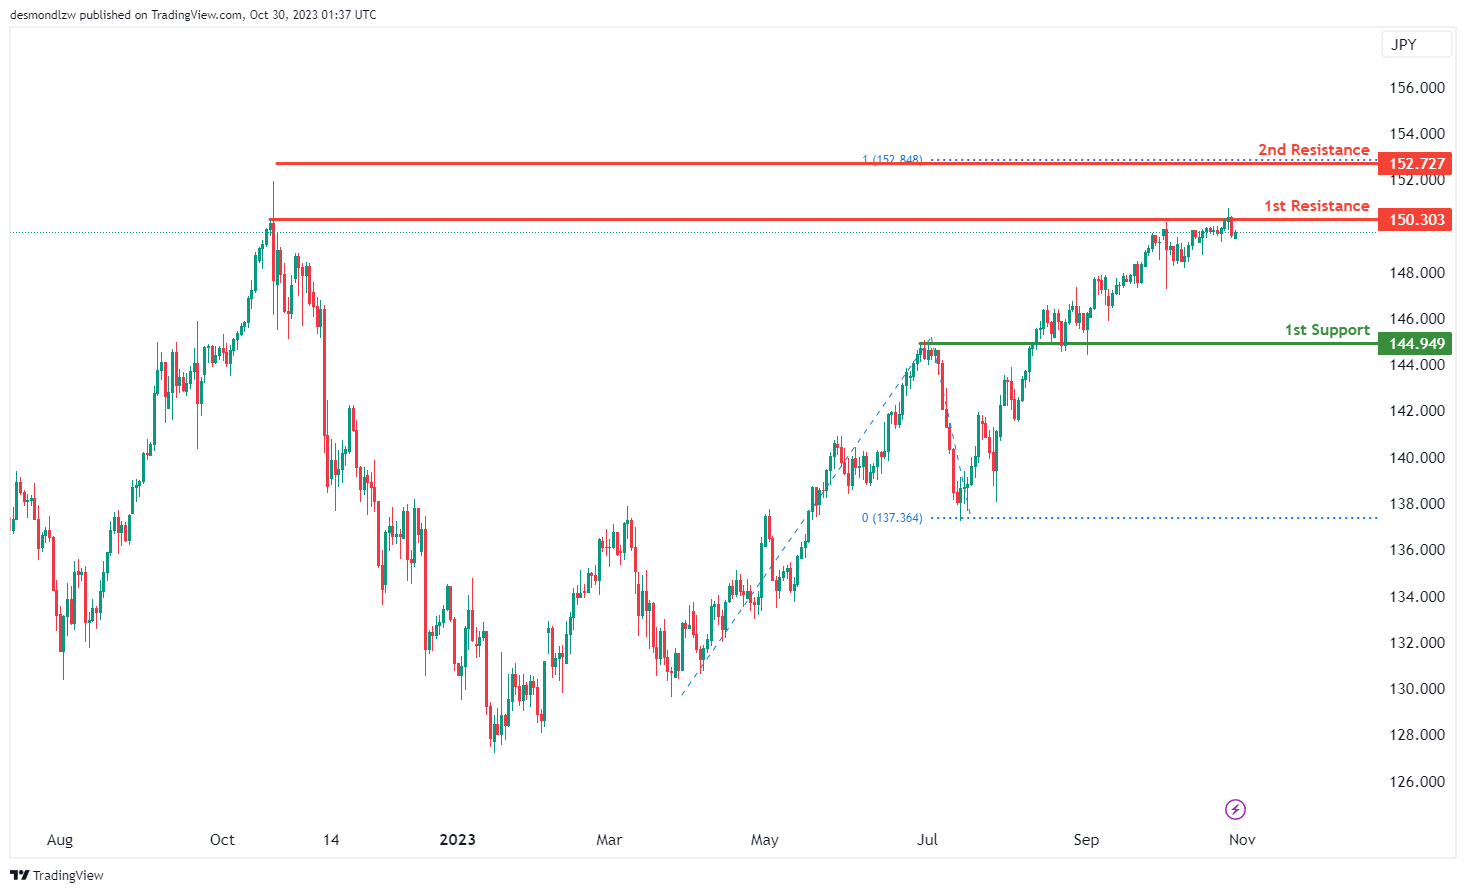
The USD/JPY chart currently has a bearish overall momentum, suggesting the potential for a bearish continuation towards the 1st support.
The 1st support at 144.94 is considered significant as it aligns with an overlap support level, indicating its potential to serve as a crucial price support zone.
On the resistance side, the 1st resistance at 150.30 is characterized as a multi-swing high resistance level, implying that it could pose as a significant obstacle to any notable upward price movement. Beyond this, the 2nd resistance at 152.72 is identified as a swing high resistance level, coinciding with the 100% Fibonacci Projection, further reinforcing the potential for resistance in this region.
USD/CAD:
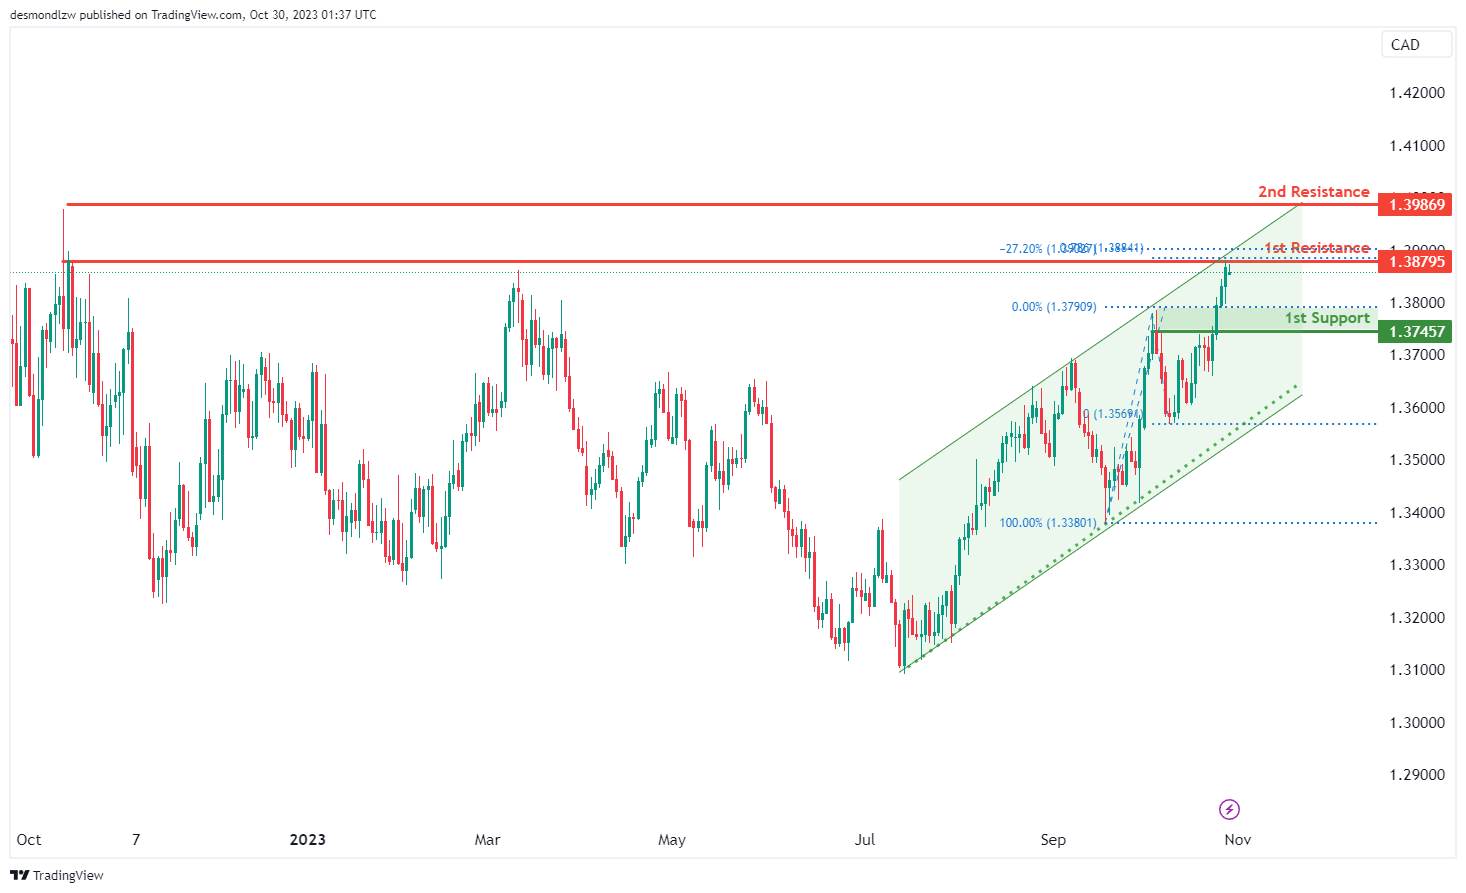
The USD/CAD chart currently demonstrates a bullish overall momentum, attributed to its position within a bullish ascending channel. However, there is a potential scenario for a short-term drop to the 1st support before bouncing and rising towards the 1st resistance.
The 1st support at 1.3745 is considered a good support level as it aligns with a pullback support, indicating a potential area of price support. In the short term, there may be a drop towards this level.
On the resistance side, the 1st resistance at 1.3879 is characterized as a multi-swing high resistance. It’s significant because it aligns with the -27% Fibonacci Expansion level, making it a strong potential resistance zone. Beyond that, there is a 2nd resistance at 1.3986, which is marked as a swing high resistance, further reinforcing the potential for resistance in that region.
AUD/USD:
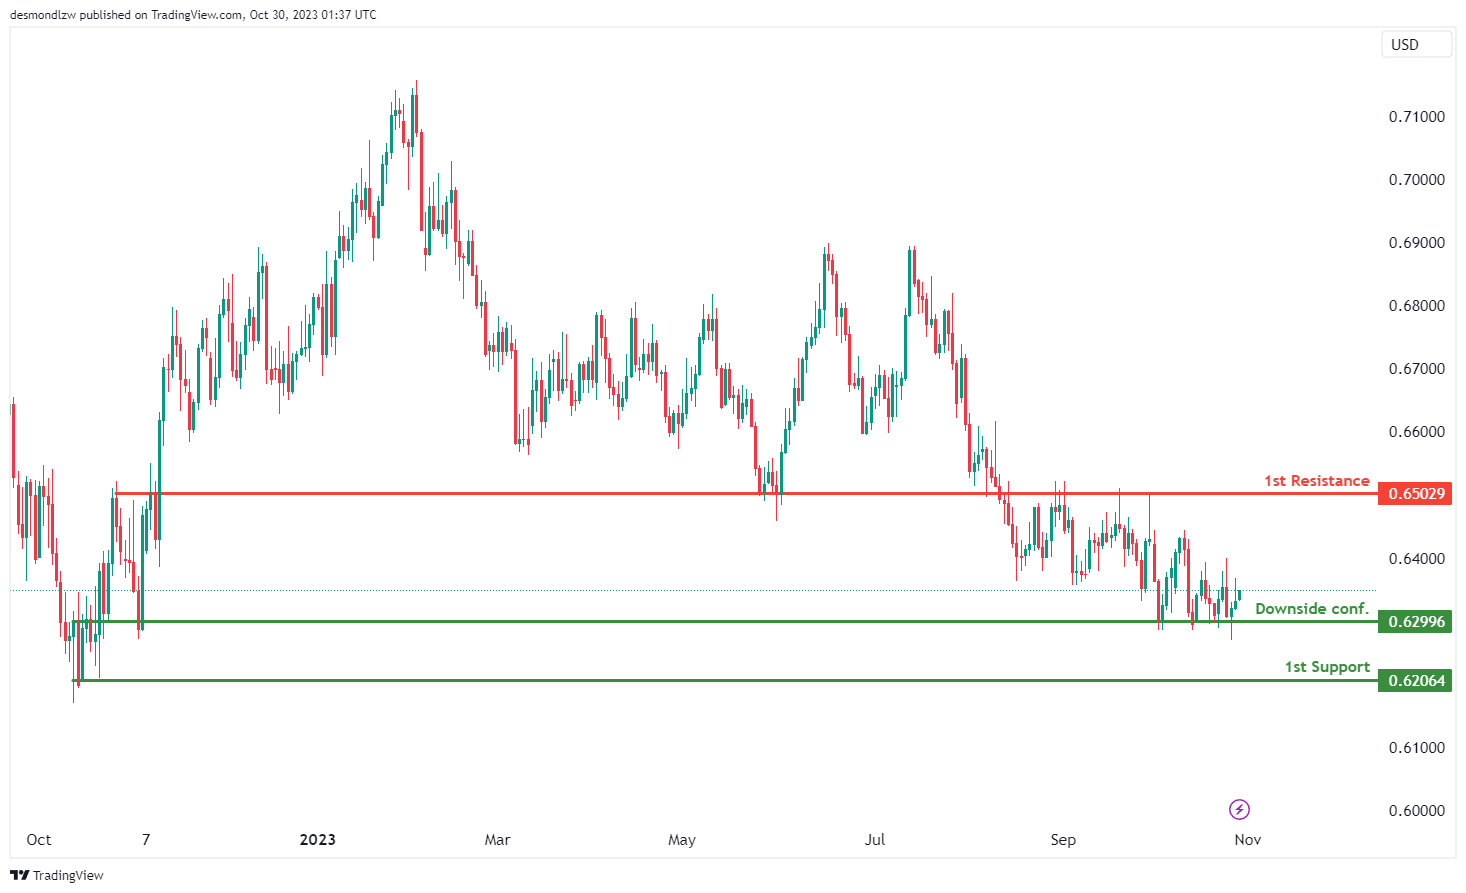
The AUD/USD chart currently exhibits a bullish overall momentum. There’s a potential scenario where the price could experience a bullish bounce off the 1st support at 0.6206 and head towards the 1st resistance at 0.6520.
The 1st support at 0.6206 is considered a swing low support, indicating its potential as a level of price support. Additionally, traders are waiting for downside confirmation at the level of 0.6299, which is identified as another swing low support, adding to its significance.
On the resistance side, the 1st resistance at 0.6520 is characterized as an overlap resistance. This analysis suggests the possibility of a bullish move in the AUD/USD chart, with the 1st support acting as a potential bounce point and the 1st resistance as a target for upward price movement.
NZD/USD
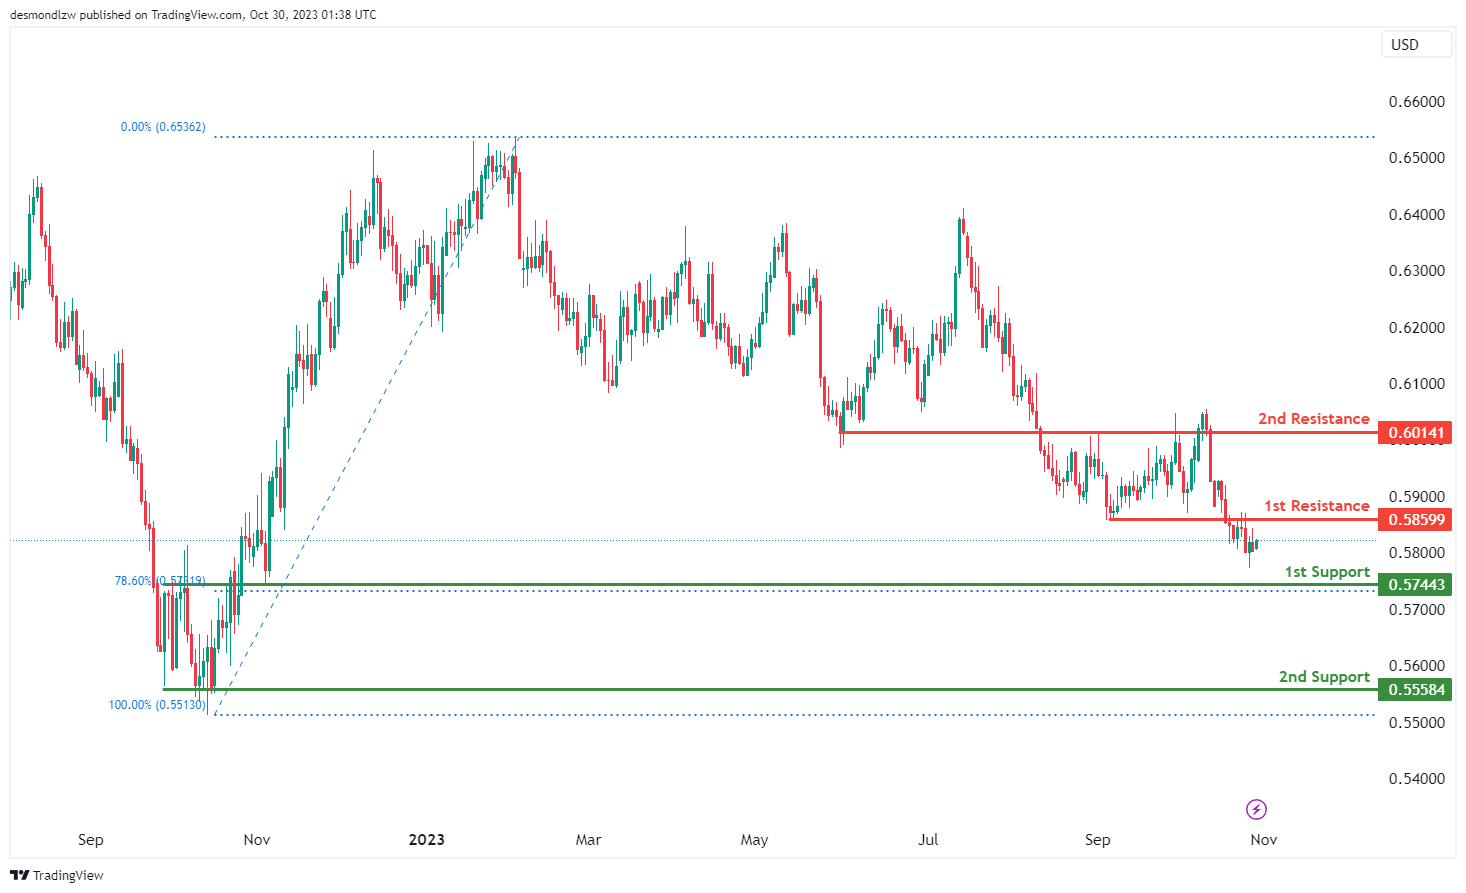
The NZD/USD chart currently demonstrates a bearish overall momentum, suggesting the potential for a bearish continuation towards the 1st support level.
The 1st support at 0.5744 is considered significant as it aligns with an overlap support and coincides with the 78.60% Fibonacci Retracement level, providing a strong potential support zone. Additionally, there is a 2nd support level at 0.5558, identified as a multi-swing low support, which further reinforces the potential for bearish movement.
On the resistance side, the 1st resistance at 0.5859 is characterized as an overlap resistance, and beyond this, the 2nd resistance at 0.6014 is also noted as an overlap resistance. These levels may act as barriers to upward price movements in the bearish scenario.
DJ30:
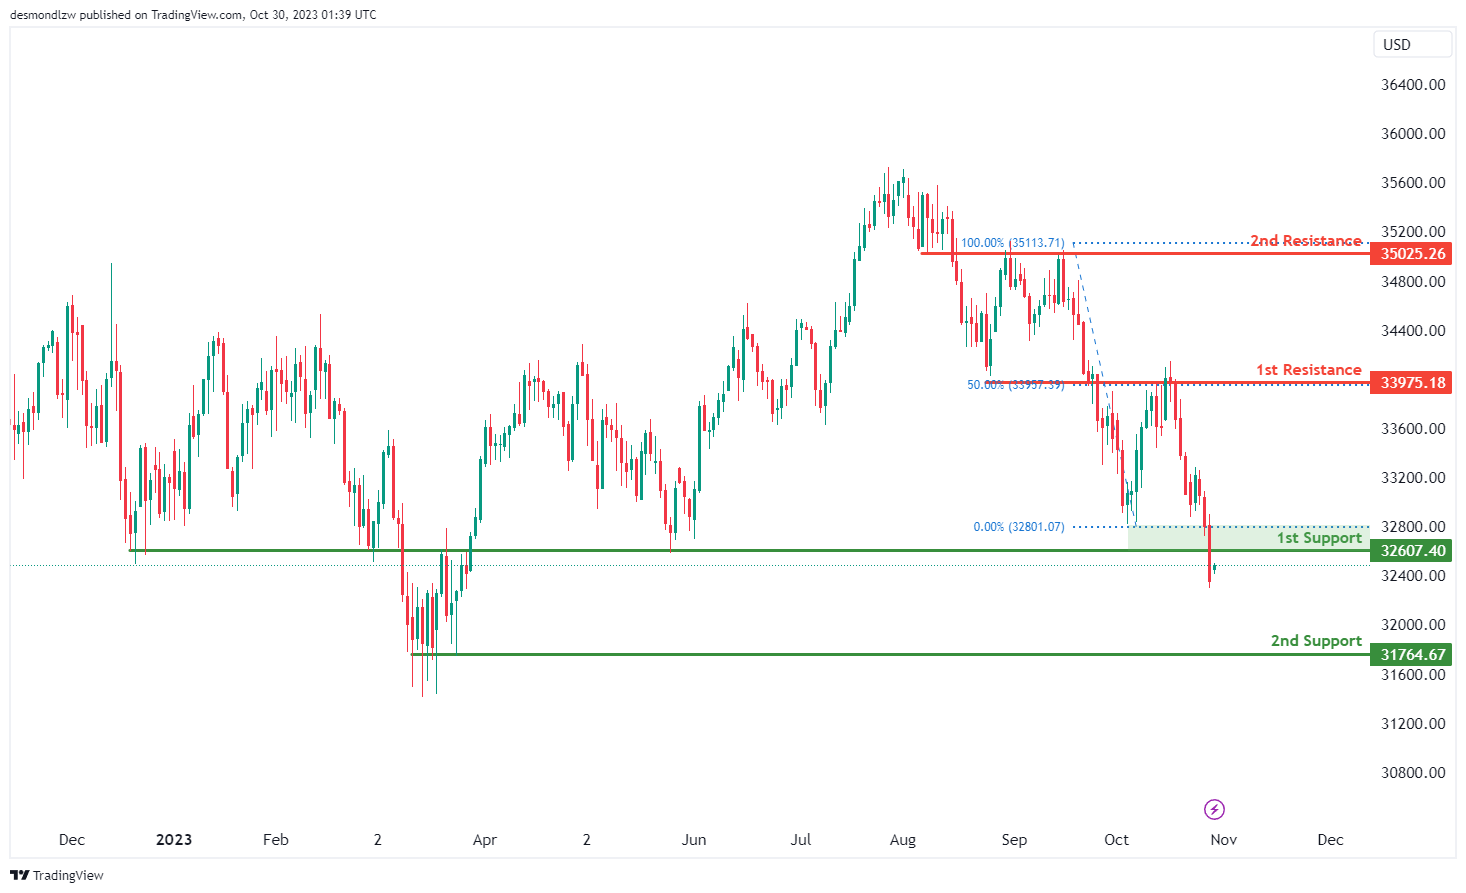
The DJ30 (Dow Jones Industrial Average) chart currently demonstrates a bearish overall momentum, suggesting the potential for a bearish break off the 1st support level and a drop towards the 2nd support.
The 1st support at 32607.40 is considered significant as it aligns with a pullback support, indicating a potential area of price support. However, there is also a 2nd support level at 31764.67, which is identified as a multi-swing low support, further reinforcing the potential for it to act as a support zone.
On the resistance side, the 1st resistance at 33975.18 is characterized as an overlap resistance and is notable because it aligns with the 50% Fibonacci Retracement level, suggesting a potential strong resistance zone that could impede upward price movement. Additionally, there is a 2nd resistance at 35025.26, marked as an overlap resistance, indicating another potential level where the price may face resistance.
GER40:
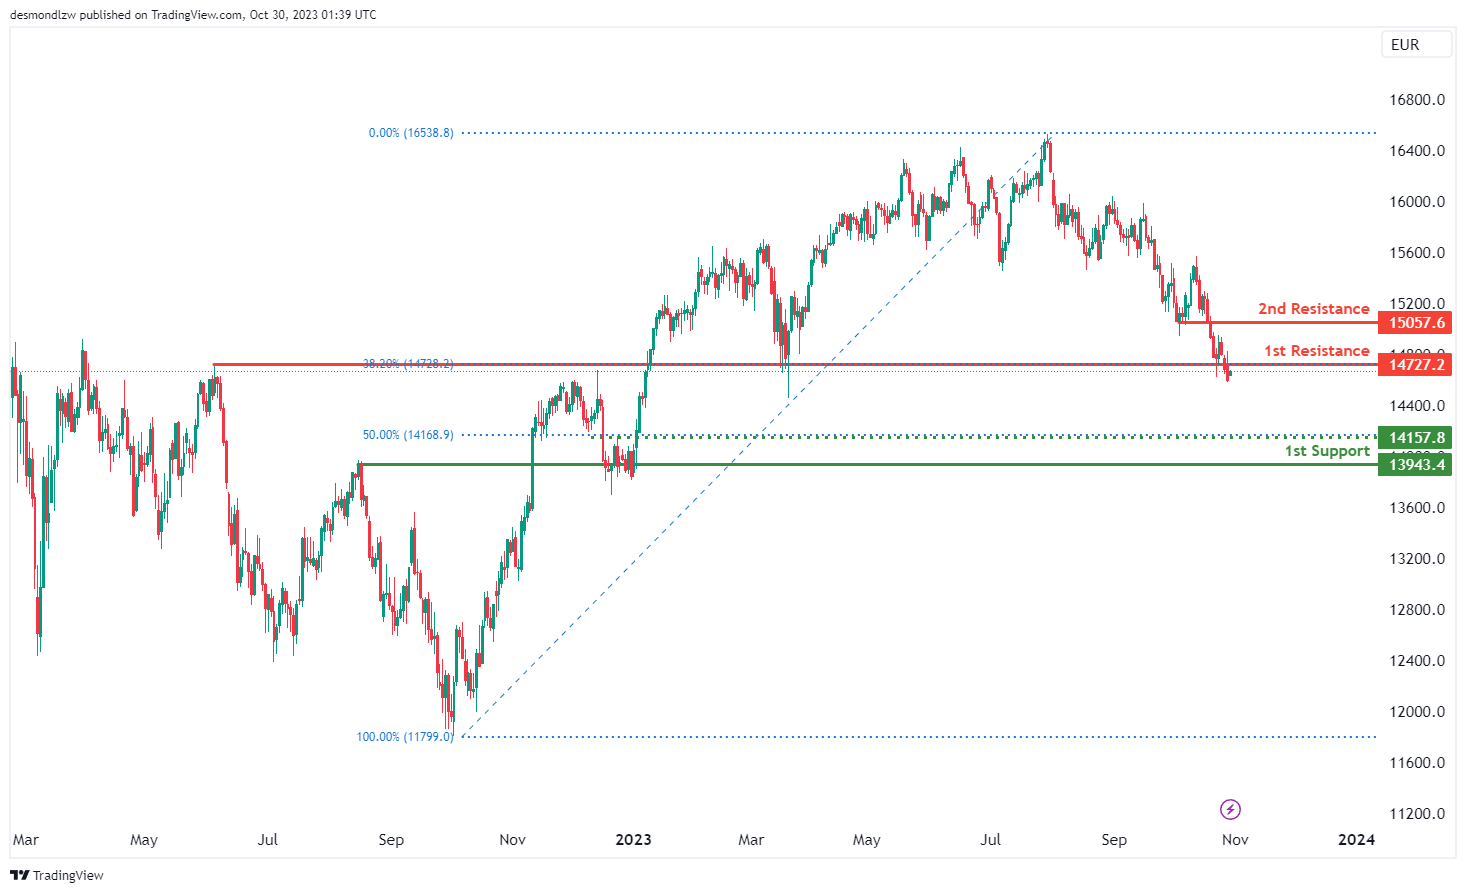
The GER40 chart currently exhibits a bearish overall momentum, suggesting the potential for a bearish continuation towards the 1st support level at 13943.40.
The 1st support at 13943.40 is considered significant as it aligns with an overlap support and coincides with the 50% Fibonacci Retracement level, indicating a potential strong support zone. Additionally, there is an intermediate support level at 14157.80, characterized as a pullback support, which further reinforces the potential for it to act as a support level.
On the resistance side, the 1st resistance at 14727.20 is identified as a pullback resistance and is notable because it aligns with the 38.20% Fibonacci Retracement level. This resistance level suggests a potential barrier to upward price movement. Furthermore, there is a 2nd resistance at 15057.60, marked as a pullback resistance, indicating another potential level where the price may face resistance.
US500
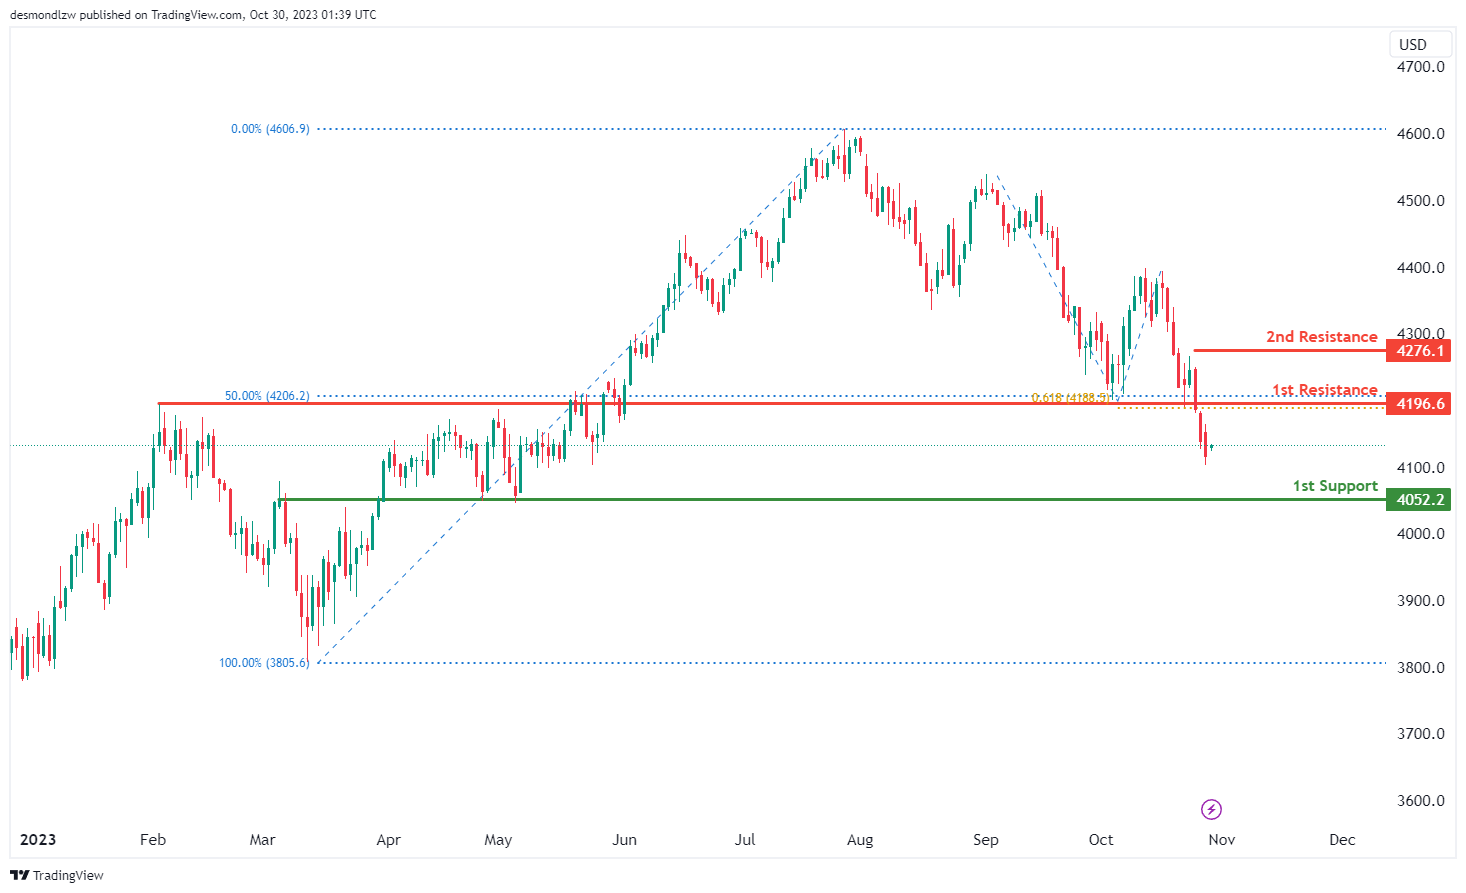
The US500 chart currently exhibits a bearish overall momentum. There’s a potential scenario for a bearish continuation towards the 1st support level at 4052.2.
The 1st support at 4052.2 is considered significant as it aligns with an overlap support, indicating its potential to act as a strong support level.
On the resistance side, the 1st resistance at 4196.6 is characterized as a pullback resistance. This resistance level is notable because it aligns with both the 50% Fibonacci Retracement and the 61.80% Fibonacci Projection, indicating a Fibonacci confluence, which makes it a strong potential barrier to upward price movement. Additionally, there is a 2nd resistance at 4276.1, identified as a swing high resistance, further reinforcing the potential for resistance in this region.
BTC/USD:
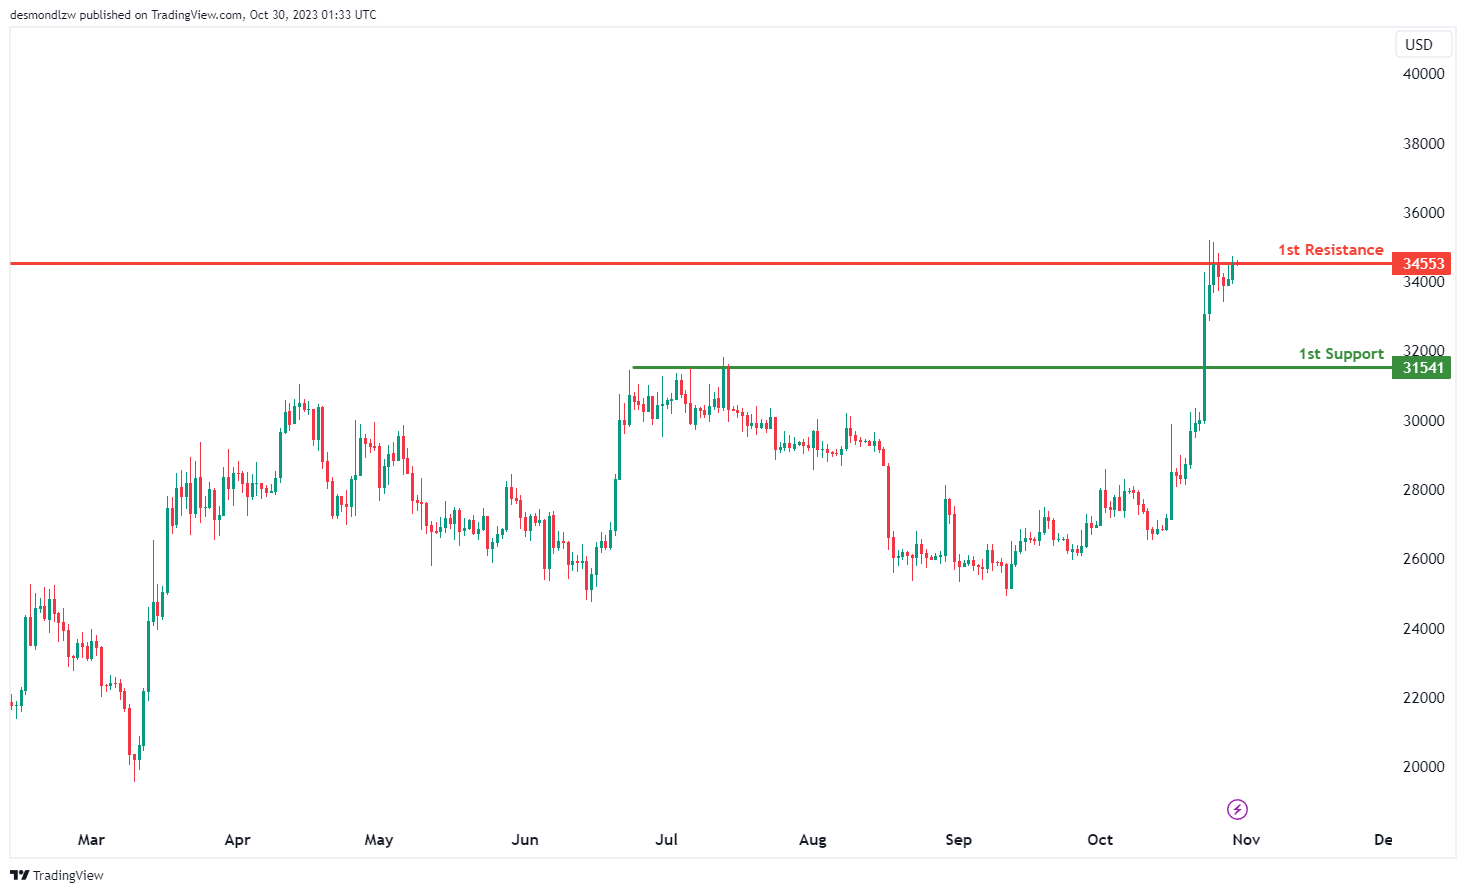
The BTC/USD chart currently has a bearish overall momentum, and there is a potential scenario for a bearish continuation towards the 1st support level at 31541.
The 1st support at 31541 is considered significant as it aligns with a pullback support level, indicating a potential area of price support.
On the resistance side, the 1st resistance at 34553 is characterized as an overlap resistance level, which could pose as a barrier to further upward price movements in the bearish direction.
ETH/USD:
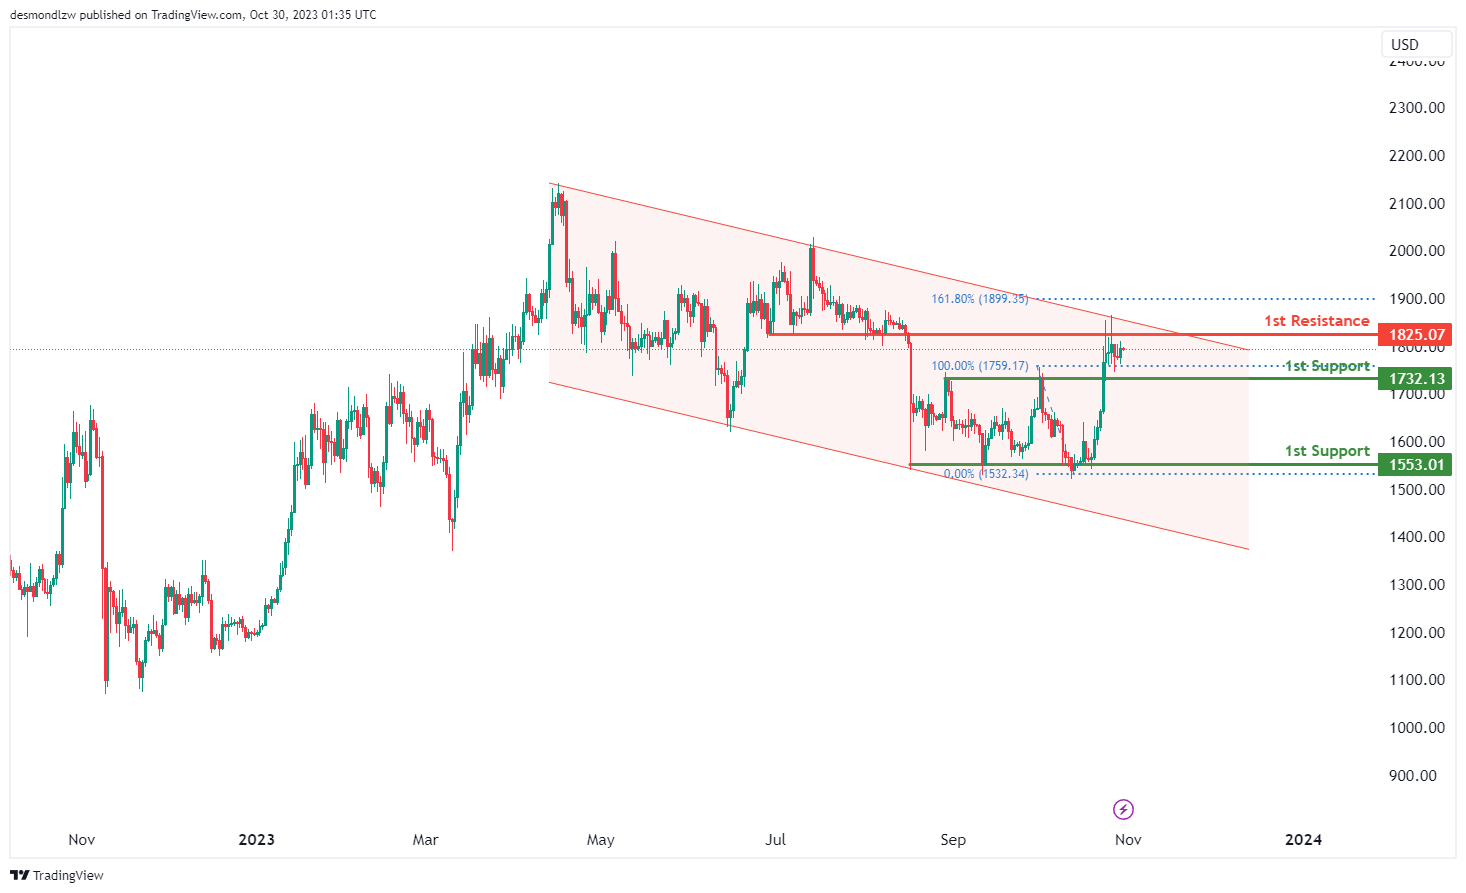
The ETH/USD chart currently exhibits a bearish overall momentum, and this momentum is reinforced by the price being within a bearish descending channel. There’s a potential scenario for a bearish continuation towards the 1st support level at 1732.13.
The 1st support at 1732.13 is considered significant as it aligns with a pullback support level, suggesting it could act as a substantial area of price support. Additionally, there is a 2nd support level at 1553.01, identified as a multi-swing low support, further reinforcing the potential for it to serve as a support zone.
On the resistance side, the 1st resistance at 1825.07 is characterized as an overlap resistance, indicating a potential barrier to further upward price movements in the bearish direction.
WTI/USD:
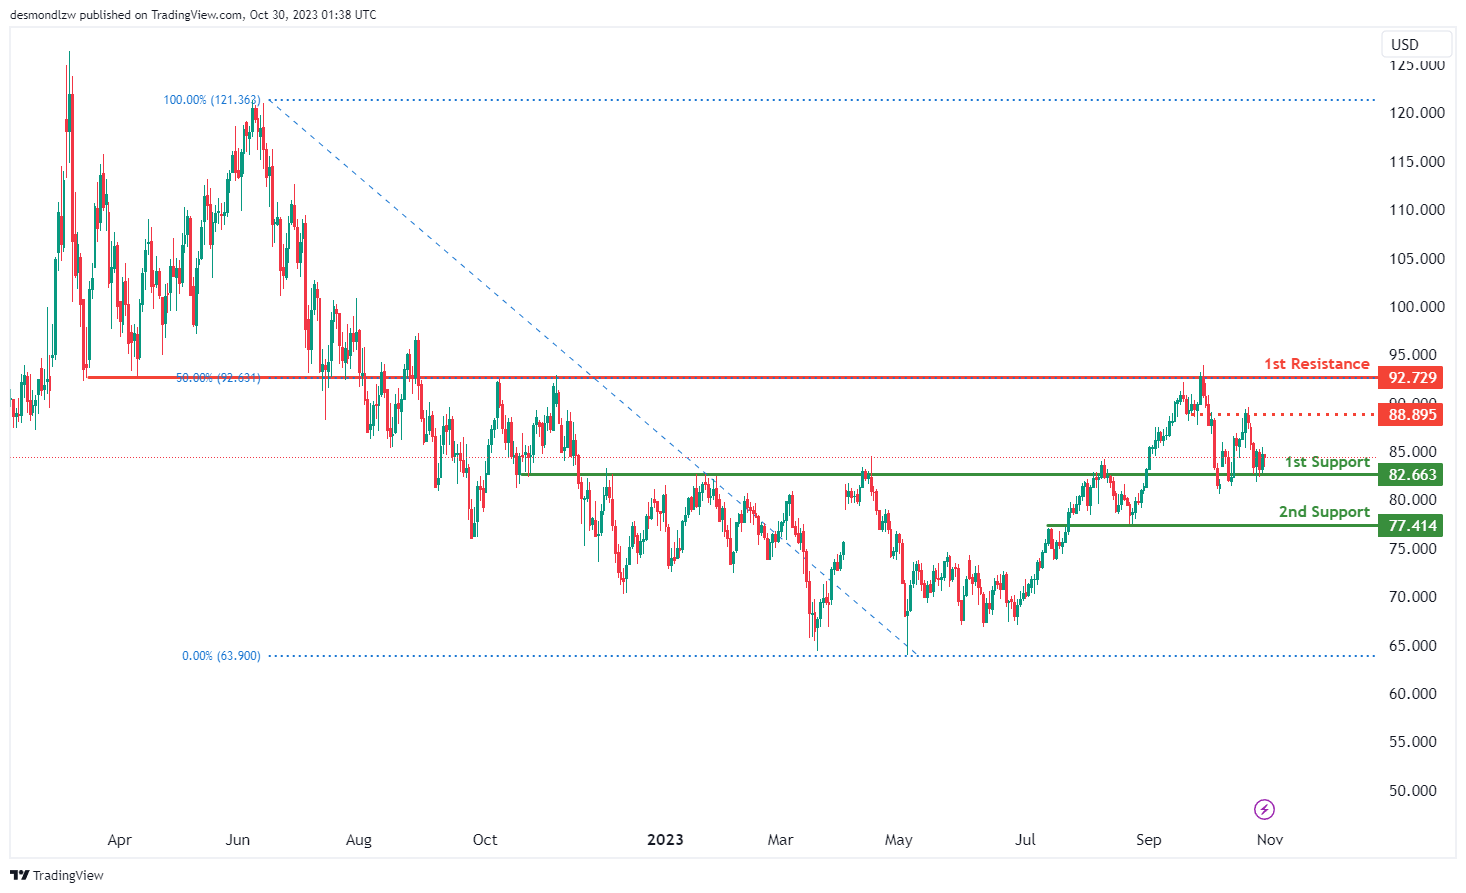
The WTI chart currently exhibits a bullish overall momentum, indicating the potential for a bullish bounce off the 1st support level and a move towards the 1st resistance.
The 1st support at 82.66 is considered significant as it aligns with an overlap support, making it a potentially strong support level. Additionally, there is a 2nd support at 77.41, which is also identified as an overlap support, reinforcing the potential support zone.
On the resistance side, the 1st resistance at 92.72 is characterized as an overlap resistance and coincides with the 50% Fibonacci Retracement level, making it a strong potential barrier to upward price movement. There is also an intermediate resistance level at 88.89, marked as an overlap resistance, which could further impede upward price advances.
XAU/USD (GOLD):
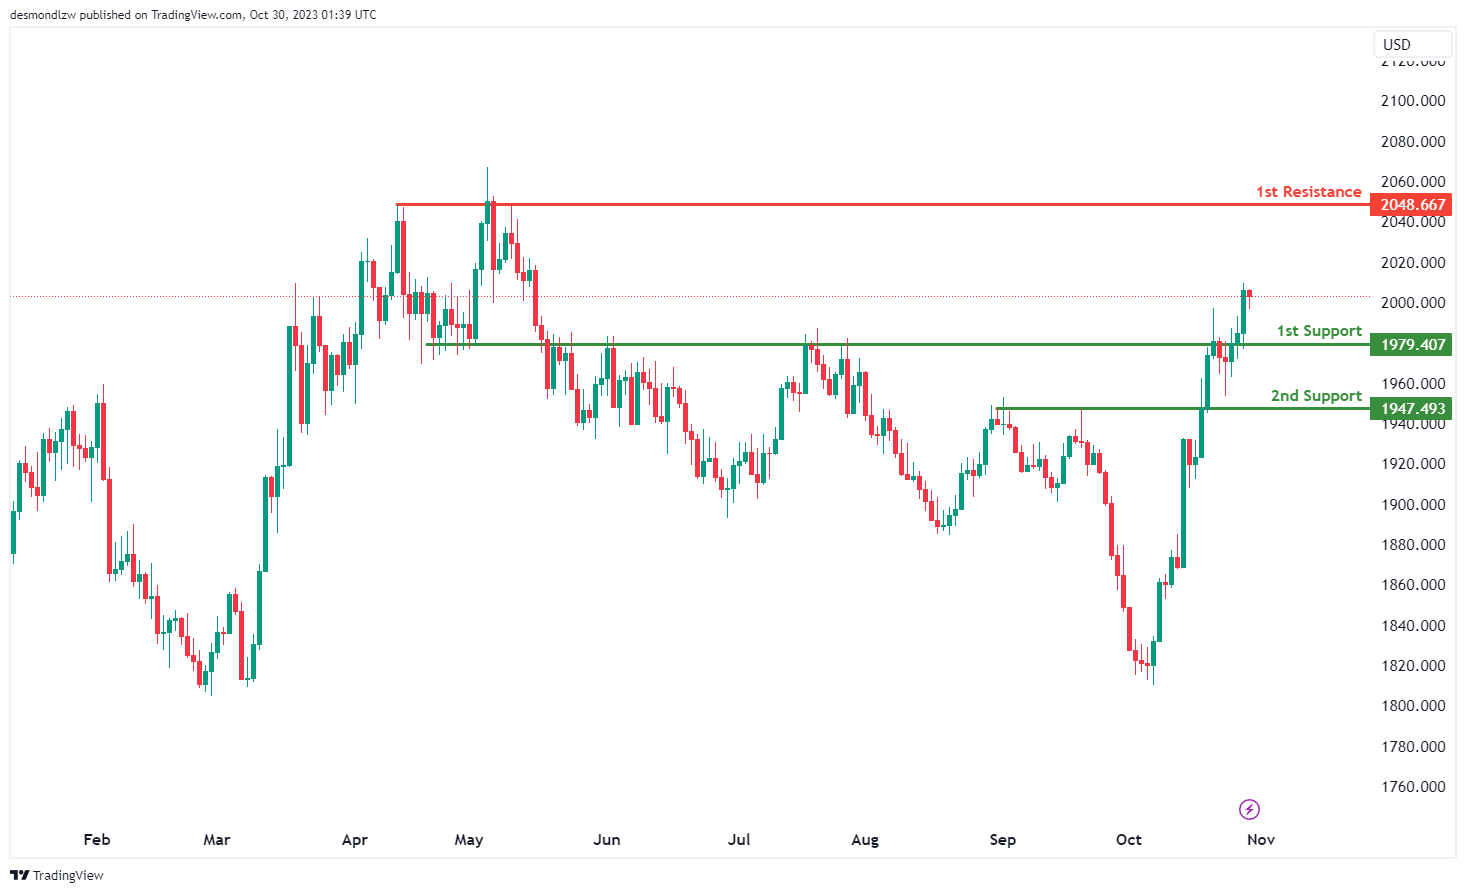
The XAU/USD (Gold/US Dollar) chart currently demonstrates bullish momentum, suggesting the potential for a bullish continuation towards the 1st resistance level at 2048.66.
The 1st support at 1979.40 is considered significant as it aligns with an overlap support, indicating its potential to act as a strong support level. Additionally, the 2nd support level at 1947.49 is identified as a pullback support, reinforcing the potential support zone.
On the resistance side, the 1st resistance at 2048.66 is characterized as a multi-swing high resistance, implying that it could pose a significant obstacle to any notable upward price movement in the bullish direction.
Australian retails rose 0.9% mom, strong Sep in subdued 2023
Australia's retail sales turnover registered a 0.9% mom growth in September to AUD 35.87B. This robust performance dwarfed the modest analyst expectations of a 0.3% mom growth. On an annual basis, sales turnover presented a rise of 2.0% yoy compared to the same month in the preceding year.
Speaking on the development, Ben Dorber, ABS head of retail statistics, elucidated, "The strong rise in September came from a diverse range of factors across the Retail industry." He pinpointed the uncommonly warm onset of spring as a significant catalyst while technology and energy-conscious programs also had their roles.
However, while September's figures paint a buoyant picture, Dorber pointed to a more restrained broader context.
"While the rise in September was the largest since January, subdued spending for most of 2023 means that underlying growth in Retail turnover remains historically low," he said.
Adding weight to this perspective, he shared that "Retail turnover in trend terms is up only 1.5 per cent compared to September 2022 - the smallest trend growth over 12 months in the history of the series."
EUR/USD At Risk of Fresh Decline, Gold Breaks $2K
Key Highlights
- EUR/USD is struggling to clear the 1.0625 resistance zone.
- It broke a key bullish trend line with support near 1.0585 on the 4-hour chart.
- Gold price surged further and surpassed the $2,000 resistance.
- GBP/USD is showing bearish signs below the 1.2200 pivot level.
EUR/USD Technical Analysis
The Euro started a fresh decline from the 1.0695 zone against the US Dollar. EUR/USD traded below the 1.0620 support to enter a bearish zone.
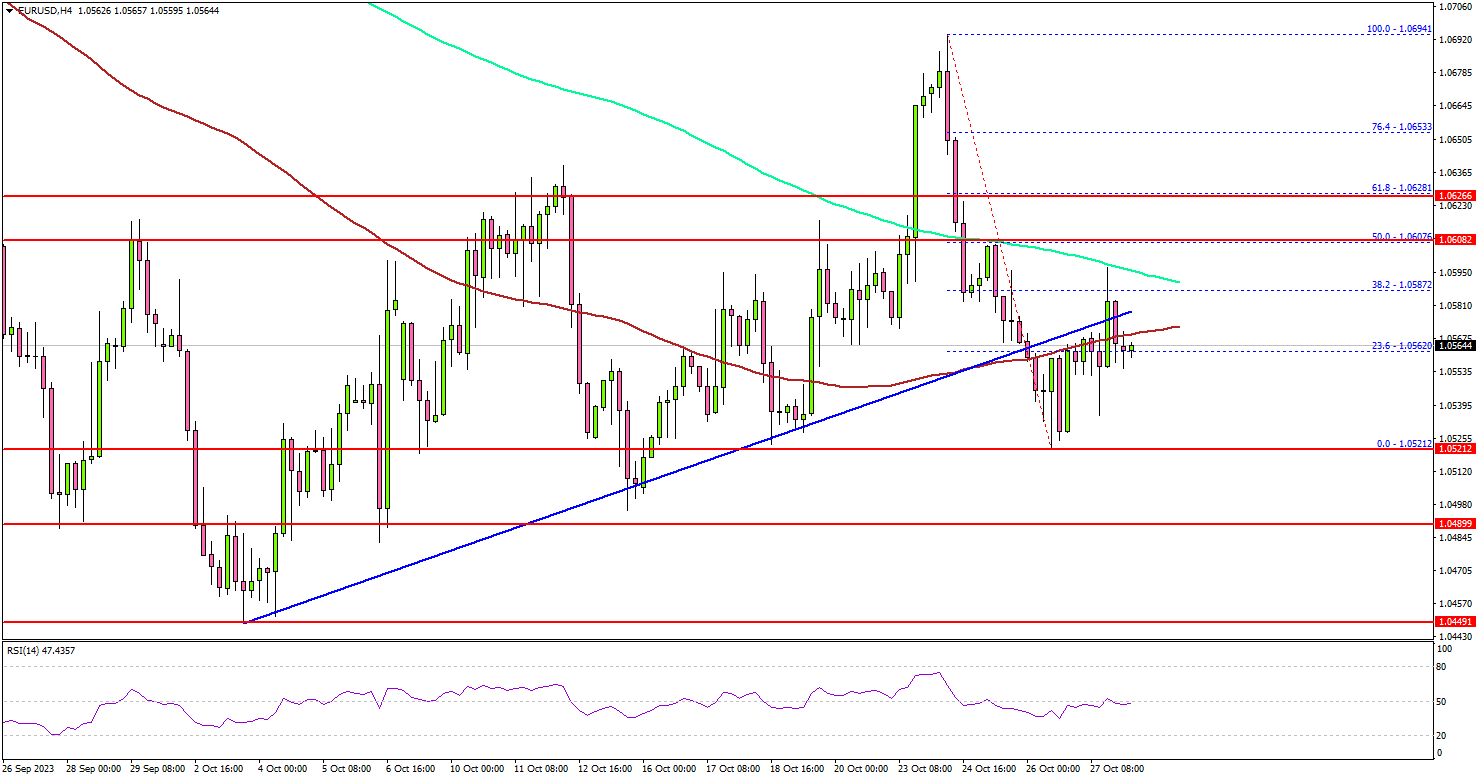
Looking at the 4-hour chart, the pair broke a key bullish trend line with support near 1.0585. There was a spike below the 100 simple moving average (red, 4 hours). The pair settled below the 200 simple moving average (green, 4 hours).
It traded as low as 1.0521 before the bulls appeared. The pair is now consolidating losses and facing resistance near the 1.0600 zone.
On the upside, the pair might face strong resistance near the 1.0620 level. If there is a clear move above 1.0620, the pair could rise toward the 1.0650 resistance. The next key resistance is near 1.0665, above which the pair could rise toward the 1.0700 level.
If there is a fresh decline, the pair might find bids near 1.0520. The next key support is seen near 1.0500, below which it could test 1.0440. Any more losses might send the pair toward the 1.0400 level.
Looking at gold, there was a strong increase above the $1,980 resistance and the bulls even pumped it above the $2,000 barrier.
Economic Releases
- German Gross Domestic Product for Q3 2023 (QoQ) (Prelim) – Forecast -0.3%, versus 0% previous.
- German Consumer Price Index for Oct 2023 (YoY) (Prelim) – Forecast +4.0%, versus +4.5% previous.
- German Consumer Price Index for Oct 2023 (MoM) (Prelim) – Forecast +0.2%, versus +0.3% previous.
Dow Jones index Wave Analysis
- Dow Jones index broke key support level 32875.00
- Likely to fall to support level 32000.00
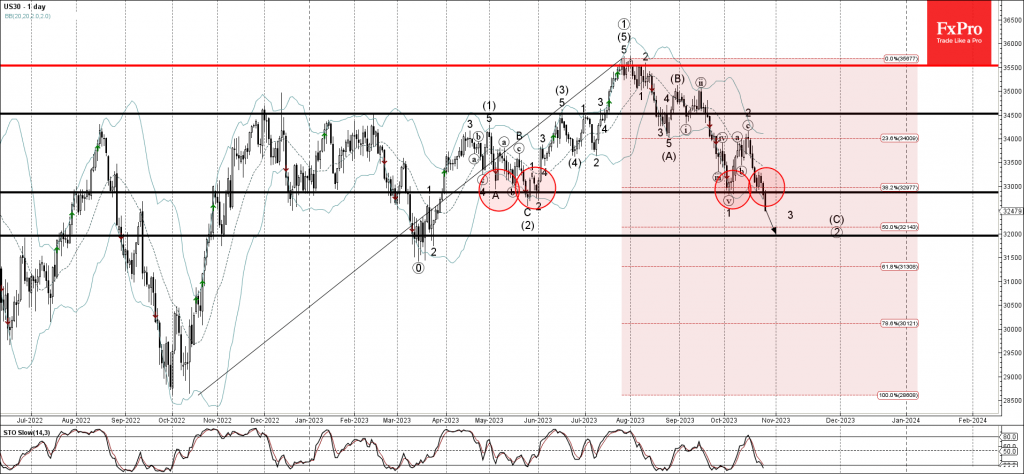
Dow Jones index recently broke the key support level 32875.00, which has been repeatedly reversing the index from the start of May.
The breakout of the support level 32875.00 coincided with the breakout of the 38.2% Fibonacci correction of the upward trend from October of 2022.
Dow Jones index can be expected to fall further toward the next support level 32000.00, former multi-month support cluster from March.
USDCHF Wave Analysis
- USDCHF reversed from support level 0.8900
- Likely to rise to resistance level 0.9085
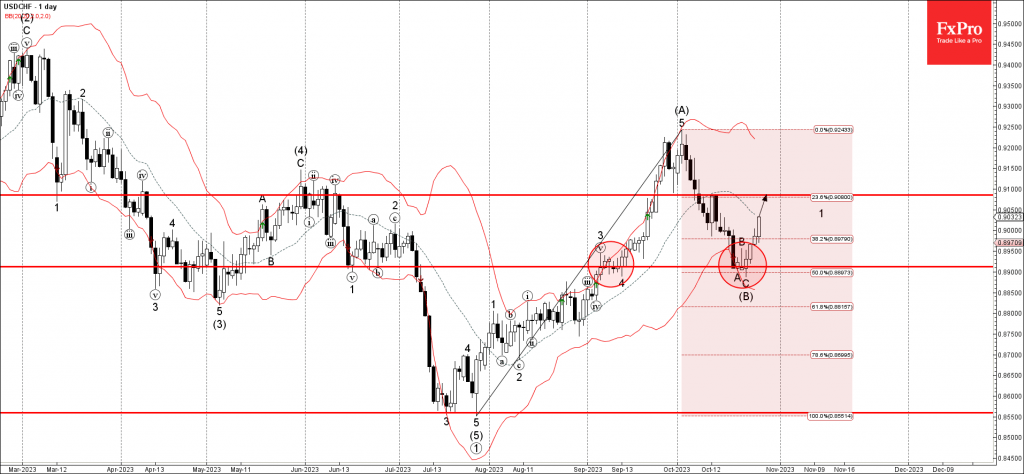
USDCHF currency pair recently reversed up from the key support level 0.8900 (which has been reversing the pair from September) standing near the lower daily Bollinger Band.
The upward reversal from the support level 0.8900 stopped the previous sharp downward ABC correction (2).
Given the strength of the support level 0.8900, USDCHF currency pair can be expected to rise further toward the next resistance level 0.9085.
Forex and Cryptocurrencies Forecast
EUR/USD: Awaiting the Pair at 1.0200?
Having started the past week on a positive note, EUR/USD approached a significant support/resistance level at the 1.0700 zone on Tuesday, October 24, before reversing and sharply declining. According to several analysts, the correction of the DXY Dollar Index that began on October 3rd, which correspondingly drove EUR/USD northward, has come to an end.
The trigger for the trend reversal was disappointing data on business activity (PMI) in Germany and the Eurozone, which fell short of forecasts and dropped below the key 50.0-point mark, indicating a deteriorating economic climate. These figures, remaining at a five-year low, starkly contrasted with similar indicators from the United States, which were released on the same day and exceeded both forecasts and the 50.0-point level. (As noted by proponents of technical analysis, the decline was also facilitated by the fact that as EUR/USD approached 1.0700, it hit its 50-day MA.)
In addition to PMI, preliminary U.S. GDP data for Q3, released on Thursday, October 26, served as further evidence that the American economy is coping well with a year and a half of aggressive monetary tightening. The annualized figures were significantly higher than both previous values and forecasts. Economic growth reached 4.9% compared to 2.1% and 4.2%, respectively. (It's worth noting that despite this growth, experts from the Wall Street Journal predict a GDP slowdown to 0.9%, which has led to a drop in the yield of U.S. Treasury bonds and slightly stalled the rise of the DXY.).
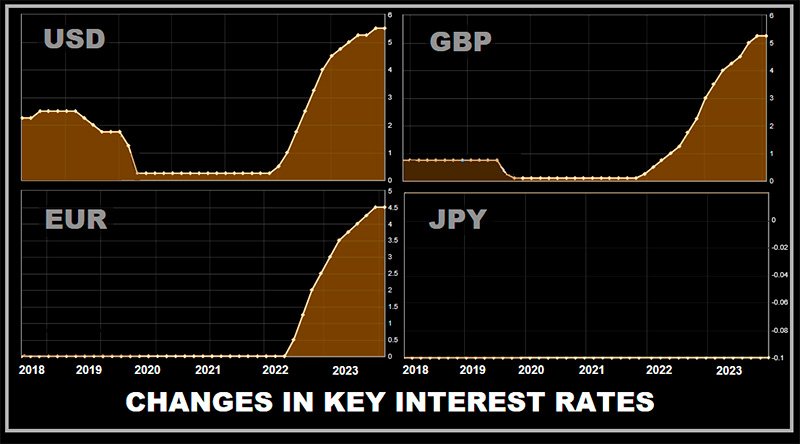
Also on Thursday, October 26, a European Central Bank (ECB) meeting took place, where the Governing Council members were expected to decide on the Eurozone interest rate. According to the consensus forecast, the rate was expected to remain at the current level of 4.50%, which indeed occurred. Market participants were more interested in the statements and comments made by the European Central Bank's leadership. From ECB President Christine Lagarde's remarks, it was inferred that the ECB is conducting "effective monetary policy, particularly in the banking sector." Nevertheless, the situation in Europe is not ideal. "Interest rates have likely reached their peak, but the Governing Council does not rule out an increase," she stated. Now more than ever, a data-dependent policy should be adopted. Inaction is sometimes also an action.
Apart from raising rates and maintaining the status quo, there is a third option: lowering rates. Madam Lagarde dismissed this route, stating that discussing a rate cut at this time is premature. However, market sentiment suggests that the ECB will formally announce the end of the current rate-hiking cycle at one of its upcoming meetings. Furthermore, derivatives indicate that the easing of the European regulator's monetary policy could start as early as April, with the likelihood of this happening by June being close to 100%. All of this could lead to a long-term depreciation of the European currency.
Certainly, the U.S. dollar benefits from a higher current interest rate (5.50% vs. 4.50%), as well as different economic dynamics and resilience to stress between the U.S. and Eurozone economies. Furthermore, the dollar is attractive as a safe-haven asset. These factors, along with expectations that the European Central Bank (ECB) will turn dovish before the Federal Reserve does, lead experts to predict a continuing downtrend for EUR/USD. However, considering the likelihood of a significant slowdown in U.S. GDP growth, some analysts believe the pair may stabilize within a sideways channel in the short term. For instance, economists at Singapore's United Overseas Bank (UOB) anticipate that the pair will likely trade in the range of 1.0510-1.0690 over the next 1-3 weeks.
Looking at forecasts for the end of the year, strategists from the Japanese financial holding company Nomura identify several other catalysts driving down EUR/USD: 1) deteriorating global risk sentiment due to rising bond yields; 2) widening yield spreads between German and Italian bonds; 3) reduced political uncertainty in the U.S., as the likelihood of a government shutdown diminishes; and 4) geopolitical tensions in the Middle East serving as a potential trigger for rising crude oil prices. Nomura believes that recent positive news about China's economic growth is unlikely to sufficiently offset these factors, keeping market participants bearish on the euro. Based on these elements, and even assuming that the Federal Reserve keeps interest rates unchanged next week, Nomura forecasts that the EUR/USD rate will fall to 1.0200 by year's end.
Strategists from Wells Fargo, part of the "big four" U.S. banks, expect the pair to reach the 1.0200 level slightly later, at the beginning of 2024. A bearish sentiment is also maintained by economists from ING, the largest banking group in the Netherlands.
Following the release of data on U.S. personal consumption expenditure, which aligned perfectly with forecasts, EUR/USD closed the past week at a level of 1.0564. Expert opinions on its near-term outlook are mixed: 45% advocate for a strengthening dollar, 30% favour the euro, and 25% maintain a neutral position. In terms of technical analysis, the D1 chart oscillators provide no clear direction: 30% point downward, 20% upward, and 50% remain neutral. Trend indicators offer more clarity: 90% look downward, while only 10% point upward. Immediate support levels for the pair are around 1.0500-1.0530, followed by 1.0450, 1.0375, 1.0200-1.0255, 1.0130, and 1.0000. Resistance for the bulls lies in the ranges of 1.0600-1.0620, 1.0740-1.0770, 1.0800, 1.0865, and 1.0945-1.0975.
The upcoming week promises to be packed with significant events. On Monday, October 30, we'll receive GDP and inflation (CPI) data from Germany. On Tuesday, October 31, retail sales figures from this engine of the European economy will be released, along with preliminary data on Eurozone-wide GDP and CPI. On Wednesday, November 1, employment levels in the U.S. private sector and Manufacturing PMI data will be published. The day will also feature the most critical event: the FOMC (Federal Open Market Committee) meeting, where an interest rate decision will be made. The consensus forecast suggests that rates will remain unchanged. Therefore, market participants will be particularly interested in statements and comments from the leaders of the U.S. Federal Reserve.
On Thursday, November 2, we'll find out the number of initial jobless claims in the U.S. The torrent of labour market data will continue on Friday, November 3. As is traditional on the first Friday of the month, we can expect another round of key macro statistics, including the unemployment rate and the number of new non-farm jobs created in the United States.
GBP/USD: Awaiting the Pair at 1.1600?
Last week's published data indicated that although the UK's unemployment rate fell from 4.3% to 4.2%, the number of jobless claims amounted to 20.4K. This figure is significantly higher than both the previous value of 9.0K and the forecast of 2.3K. The Confederation of British Industry's (CBI) October data on major retailers' retail sales revealed that the Retail Sales Index dropped from -14 to -36 points, marking its lowest level since March 2021. Furthermore, analysts fear that the situation could deteriorate in November as households face pressure from high prices, leading them to significantly cut back on spending.
According to ING's forecast, in the short-term, risks for the pound remain skewed towards a decline to the key support level of 1.2000. Transitioning to medium-term expectations, Wells Fargo economists believe that not just the European but also the British currency will trend downward. "Europe's poor performance compared to the U.S. should exert pressure on both currencies," they write. "The ECB and the Bank of England have signalled that interest rates have likely reached their peak, which weakens the currencies' support from interest rates. Against this backdrop, we expect the pound to weaken [...] in early 2024, targeting a minimum for GBP/USD around 1.1600."
The Bank of England (BoE) is scheduled to hold a meeting on Thursday, November 2, following the Federal Reserve meeting earlier in the week. According to forecasts, the British regulator is expected to leave its monetary policy parameters unchanged, maintaining the interest rate at 5.25%, similar to the actions taken by the ECB and the Fed. However, given the high inflation rates in the United Kingdom, which exceed those of its main economic competitors, the BoE's rhetoric could be more hawkish than that of Madame Lagarde. In such a case, the pound may find some support against the European currency, but this is unlikely to offer much help against the dollar.
GBP/USD closed the past week at a level of 1.2120. When polled about the pair's near-term future, 50% of analysts voted for its rise. Only 20% believe the pair will continue its movement towards the target of 1.2000, while the remaining 30% maintain a neutral stance. Trend indicators on the D1 chart are unanimously bearish, with 100% pointing to a decline and coloured in red. Oscillators are slightly less conclusive: 80% indicate a decline (of which 15% are in the oversold zone), 10% suggest a rise, and the remaining 10% are in a neutral grey colour. In terms of support levels and zones, should the pair move downward, it would encounter support at 1.2000-1.2040, 1.1960, and 1.1800-1.1840, followed by 1.1720, 1.1595-1.1625, and 1.1450-1.1475. If the pair rises, it will meet resistance at 1.2145-1.2175, 1.2190-1.2215, 1.2280, 1.2335, 1.2450, 1.2550-1.2575, and 1.2690-1.2710.
Aside from the aforementioned Bank of England meeting on November 2, no other significant events concerning the British economy are anticipated for the upcoming week.
USD/JPY: Awaiting the Pair at 152.80?
The Japanese yen remains the weakest among the currencies of developed nations. USD/JPY has been rising throughout the year, and on Thursday, October 26, it reached a new annual high of 150.77. The primary reason for this trend, as we have frequently emphasized in our reviews, is the disparity in monetary policies between the Bank of Japan (BoJ) and other leading central banks. The BoJ shows no signs of relinquishing its ultra-accommodative monetary policy, maintaining its interest rate at a negative -0.1%. With the Federal Reserve's rate standing at +5.50%, a simple carry-trade operation exchanging yen for dollars provides substantial returns due to this rate difference.
The yen is also not helped by the easing control over the yield curve of Japanese government bonds. Currently, the yield on 10-year bonds can deviate from zero by no more than 0.5%. At its July meeting, the BoJ decided that this range would be more of a guideline than a hard boundary. However, subsequent experience has shown that any notable deviation from this range triggers the BoJ to buy bonds, which again leads to yen weakening.
Even the currency interventions conducted on October 3, when USD/JPY exceeded the 150.00 mark, failed to support the yen. The pair was temporarily brought down to 147.26, but it quickly rebounded and is now once again approaching the 150.00 level.
Leaders of Japan's Ministry of Finance and the Central Bank continually attempt to bolster their currency with reassuring yet rather vague statements, asserting that Japan's overall financial system remains stable and that they are closely monitoring exchange rates. However, as evident, their words have had limited impact. On the past Friday, October 27, Hirokazu Matsuno, the Chief Cabinet Secretary, added to the ambiguity. According to him, he expects the Bank of Japan to conduct appropriate monetary policy in line with objectives for achieving stable and sustainable price levels. While this sounds very good, understanding its implications is also very challenging. What exactly constitutes "appropriate" policy? And where does this elusive "target price level" stand?
According to experts at Germany's Commerzbank, "not everything in Japan's monetary and foreign exchange policy is always logical." "The market is likely to continue testing higher levels in USD/JPY," forecast the bank's economists. "Then there are two possible scenarios: either the Ministry of Finance conducts another intervention, or the yen's depreciation accelerates as the market starts to price out the risk of intervention."
"In the medium to long term," Commerzbank analysts continue, "an intervention won't be able to prevent a depreciation of the currency, especially if the Bank of Japan keeps exerting pressure on the yen by maintaining its ultra-expansionary monetary policy. Therefore, the only logical response would be, at the very least, a gradual normalization of monetary policy, possibly through further easing of the yield curve control (YCC). However, there is no certainty that easing the YCC would be sufficient, nor is there any certainty that the Bank of Japan will change anything in its meeting on Tuesday [October 31]."
As a result, analysts at the French bank Societe Generale believe that current dynamics favour a continuation of the upward movement. The next potential hurdles, in their opinion, lie at the 151.25 level and in the zone of last year's highs of 152.00-152.80. A key support zone is at 149.30-148.85, but overcoming this area would be necessary to confirm a short-term decline.
USD/JPY closed the past trading week at a level of 149.63. When discussing its near-term prospects, analysts are evenly split: 50% predict the pair will rise, and 50% anticipate a decline. Trend indicators on the D1 chart show 65% in green, indicating bullishness, and 35% in red, signalling bearishness. Among oscillators, there is unanimous lack of sentiment for a downward move. 50% point north, and the remaining 50% indicate a sideways trend. The nearest support levels are situated in the zones of 148.30-148.70, followed by 146.85-147.30, 145.90-146.10, 145.30, 144.45, 143.75-144.05, and 142.20. The closest resistance lies at 150.00-150.15, then 150.40-150.80, followed by 151.90 (October 2022 high) and 152.80-153.15.
No significant economic data pertaining to the state of the Japanese economy is scheduled for release in the upcoming week. Naturally, attention should be paid to the Bank of Japan's meeting on Tuesday, October 31, although no major surprises are expected. Traders should also be aware that Friday, November 3, is a public holiday in Japan as the country observes Culture Day.
A bit of reassuring information for proponents of the Japanese currency comes from Wells Fargo. They anticipate that "if the Federal Reserve does indeed cut rates, and even if the Bank of Japan continues to gradually tighten monetary policy, the yield differential should shift in favour of the yen in the long term." Wells Fargo strategists forecast that "by the end of next year, USD/JPY could be heading toward 146.00."
This American bank's outlook may instil optimism in traders who opened short positions at 150.00. However, what course of action should be taken by those who pressed 'Sell' in January 2023 when the pair was trading at 127.00?
CRYPTOCURRENCIES: Start of a Bull Rally or Another Bull Trap?
Today's cryptocurrency market review is decidedly optimistic, and for good reason. On October 23-24, bitcoin surged to $35,188 for the first time since May 2022. The rise in the leading cryptocurrency occurred amid a mix of tangible events, speculative buzz, and fake news related to the U.S. Securities and Exchange Commission (SEC).
For instance, Reuters and Bloomberg reported that the SEC will not appeal a court ruling in favour of Grayscale Investments. Additionally, news emerged that the SEC is discontinuing its lawsuit against Ripple and its executives. Speculation also abounded regarding potential SEC approval of an Ethereum ETF and rumours of a spot BTC-ETF approval for BlackRock. Last week, BlackRock confirmed that the latter news was false. However, the short squeeze triggered by this fake news facilitated the coin's rise, shaking up the market. The initial local trend was amplified by a cascade of liquidations of short positions opened with significant leverage. According to Coinglass, a total of $161 million in such positions was liquidated.
While the news was fake, the saying goes, "Where there's smoke, there's fire." BlackRock's spot bitcoin exchange-traded fund, iShares Bitcoin Trust, appeared on the Depository Trust and Clearing Corporation (DTCC) list. BlackRock itself informed the SEC about its plans to initiate a test seed round in October for its spot BTC-ETF, potentially already beginning its cryptocurrency purchasing. This too fuelled speculation and rumours that the approval of its ETF is inevitable.
Moreover, according to some experts, technical factors contributed to the rise in quotes. Technical analysis had long pointed to a possible bull rally following an exit from the sideways trend.
Some analysts believe that another trigger for bitcoin's surge was the decline of the Dollar Index (DXY) to monthly lows on October 23. However, this point is debatable. We have previously noted that bitcoin has recently lost both its inverse and direct correlations, becoming "decoupled" from both the U.S. currency and stock market indices. The chart shows that on October 24, the dollar reversed its trend and began to rise. Risk assets like the S&P 500, Dow Jones, and Nasdaq Composite indices responded to this with sharp declines. But not BTC/USD, which shifted to a sideways movement around the Pivot Point of $34,000.
While the S&P 500 has been in a bearish trend for 13 weeks, BTC has been rising since August 17 despite challenges. During this period, the leading cryptocurrency has gained approximately 40%. Looking at a more extended timeframe, over the last three years, bitcoin has grown by 147% (as of October 20, 2023), while the S&P 500 has increased by only 26%.
Last week, the average BTC holder returned to profitability. According to calculations by analytics agency Glassnode, the average acquisition cost for investors was $29,800. For short-term holders (coins with less than 6 months of inactivity), this figure stands at $28,000. As of the writing of this review, their profit is approximately 20%.
The situation is somewhat different for long-term hodlers. They rarely react to even significant market upheavals, aiming for substantial profits over a multi-year horizon. In 2023, over 30% of the coins they held were in a drawdown, but this did not deter them from continuing to accumulate. Currently, holdings for this investor category amount to a record 14.9 million BTC, equivalent to 75% of the total circulating supply. The most notable and largest among such "whales" is MicroStrategy Incorporated. The company purchased its first batch of bitcoin in September 2020 at a price of $11,600 per coin. Subsequent acquisitions occurred during both market upswings and downturns, and it now owns 158,245 BTC, having spent $4.7 billion on the asset. Therefore, MicroStrategy's unrealized profit stands at approximately $0.65 billion, or roughly 13.6%.
The anticipation of the imminent launch of spot BTC ETFs in the U.S. is fuelling institutional interest in cryptocurrency. However, due to regulatory hurdles posed by the SEC, this interest is mostly deferred, according to analysts at Ernst & Young. By some estimates, this pent-up demand amounts to around $15 trillion, which could potentially drive BTC/USD to $200,000 in the long term. What can be said for certain is that open interest in futures on the Chicago Mercantile Exchange (CME) has surpassed a record 100,000 BTC, and daily trading volume has reached $1.8 billion.
Another driver of increased activity, according to experts, is the inflationary concerns in the U.S. and geopolitical risks such as the escalating situation in the Middle East. Zach Pandl, Managing Director of Grayscale Investments, explained that many investors view bitcoin as "digital gold" and seek to minimize financial risks through it. According to CoinShares, investments in crypto funds increased by $66 million last week; this marks the fourth consecutive week of inflows.
According to experts at JPMorgan, a positive decision from the SEC on the registration of the first spot bitcoin ETFs can be expected "within months." The specialists noted the absence of an SEC appeal against the court decision in the Grayscale case. The regulator has been instructed not to obstruct the transformation of the bitcoin trust into an exchange-traded fund. "The timelines for approval remain uncertain, but it is likely to happen [...] by January 10, 2024, the final deadline for the ARK Invest and 21 Co. application. This is the earliest of various final deadlines by which the SEC must respond," noted the experts at JPMorgan. They also emphasized that the Commission, in the interest of maintaining fair competition, may approve all pending applications simultaneously.
The future price behaviour of bitcoin is a topic of divided opinion within the crypto community. Matrixport has published an analytical report discussing the rising FOMO (Fear of Missing Out) effect. Their analysts rely on proprietary indicators that enable them to make favourable predictions for digital assets. They believe that by year-end, bitcoin could reach $40,000 and may climb to $56,000 if a bitcoin ETF is approved.
Many market participants are confident that a positive news backdrop will continue to support further cryptocurrency growth. For instance, Will Clemente, co-founder of Reflexivity Research, believes that the coin's behaviour should unsettle bears planning to buy cheaper BTC. A trader and analyst known as Titan of Crypto predicts the coin to move towards $40,000 by November 2023. Optimism is also shared by Michael Van De Poppe, founder of venture company Eight, and Charles Edwards, founder of Capriole Fund.
However, there are those who believe that BTC will not make further gains. Analysts Trader_J and Doctor Profit, for example, are certain that after reaching a new local maximum, the coin will enter an extended correction. Their forecast does not rule out a decline of BTC/USD to $24,000-$26,000 by year-end. A trader known as Ninja supports this negative bitcoin outlook. According to him, the technical picture, which includes an analysis of gaps on CME (the space between the opening and closing prices of bitcoin futures on the Chicago Mercantile Exchange), suggests the likelihood of BTC falling to $20,000.
As of the time of writing this review, on Friday, October 27, BTC/USD is trading at $33,800. The overall market capitalization of the crypto market stands at $1.25 trillion, up from $1.12 trillion a week ago. The Crypto Fear & Greed Index has risen over the week from 53 points to 72, moving from the Neutral zone into the Greed zone. It recorded its 2023 peak before slightly retreating and currently stands at 70 points. It's worth noting that just a month ago, the Index was in the Fear zone. Similar explosive rises in market sentiment were previously recorded in mid-2020 and mid-2021, correlating with price increases.
In conclusion of this generally optimistic overview, let's introduce a bit of pessimism from Peter Schiff, President of Euro Pacific Capital. This long-time critic of the leading cryptocurrency stated that bitcoin is "not an asset, it's nothing." He also likened bitcoin holders to a cult, saying, "No one needs bitcoin. People buy it only after someone else convinces them to do so. After acquiring [BTC], they immediately try to draw others into it. It's like a cult," wrote Schiff.
However, it's worth noting that this is a very large and rapidly growing "cult." If in 2016 the number of BTC holders was just 1.2 million, by May 2023, according to various sources, global ownership is estimated at 420 million, or 5.1% of the world's population.
Global Markets in Flux: Gold and Bitcoin Rally, Stocks Stumble, Yield and Dollar Hesitate
It was a week marked by a series of significant headlines that captured the attention of global investors.
- Bitcoin led the charge and surged sharply, touching 35k mark, a noteworthy move for the cryptocurrency giant.
- At the same time, US 10-year yield demonstrated ambition as it flirted with 5% level, but lacked the momentum to seal the deal decisively.
- Major US stock indexes sent alarm bells ringing. Falling into what analysts label as "correction territory."
- Gold, acting as the traditional safe haven, rode on the back of global uncertainty, breaking past the significant 2000 handle.
- Japanese Yen drew attention as well, as it momentarily dipped below 150 level but managed to recover, all without BoJ stepping in.
- On economic events, ECB's move this week was highly anticipated by many. After a streak of ten rate hikes, the bank decided to hit the pause button. Meanwhile, the robust US Q3 GDP growth surpassed market expectations.
- In the background, geopolitical conflicts in the Middle East cast a lingering shadow, adding an element of unpredictability to the already complex financial equation.
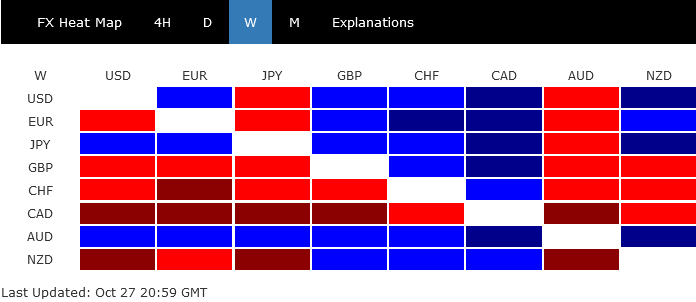
On the currency front, Dollar, despite its general strength, only secured the third spot, hindered by 10-year yield's hesitance to break past the 5% mark decisively. Despite momentarily crossing 150 level, Yen reverted to close as second strongest. Australian Dollar made notable strides, outpacing both Dollar and Yen. This uptick is bolstered by robust CPI data, which has solidified expectations of an imminent interest rate hike by RBA in the coming month.
Conversely, Canadian Dollar did not fare as well, emerging as the week's weakest performer. BoC's decision to hold rates was a significant factor, coupled with growing consensus that the current rate cycle might have hit its peak. Swiss Franc continued to shed its recent gains, while Sterling and Euro were mixed.
Stocks dive, 10-year yield flirts with 5%, Dollar index holds Firm
The financial markets exhibited a notable downturn last week, with sentiment taking a hit from ongoing geopolitical strife in the Middle East and concerns over an impending economic slowdown. Despite a strong showing in the US Q3 GDP, apprehensions loom large as Fed's "high for longer" monetary policy is expected to decelerate economic growth. Market observers are now left grappling with the questions surrounding the depth and speed of the anticipated deceleration.
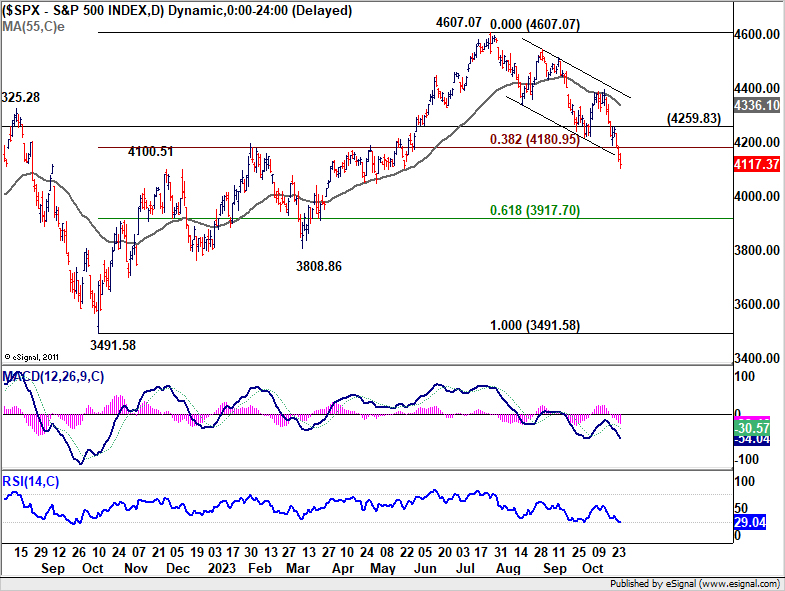
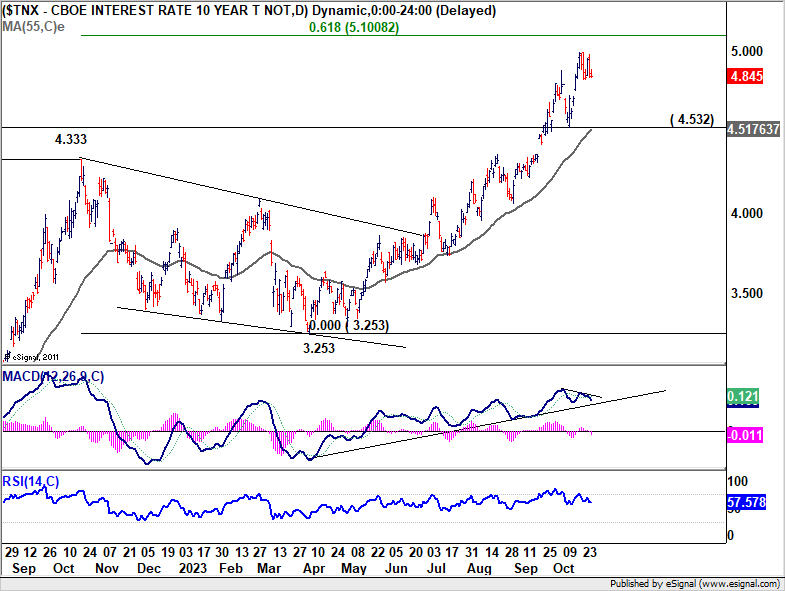
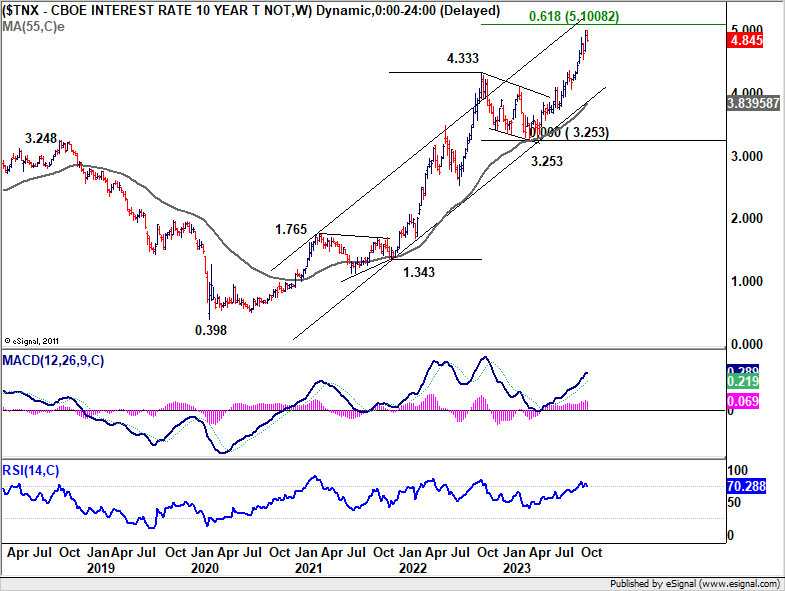
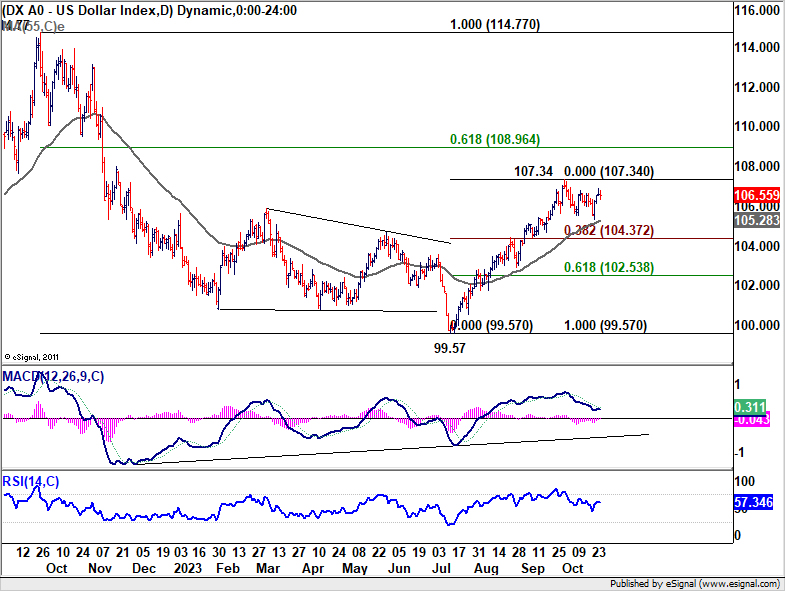
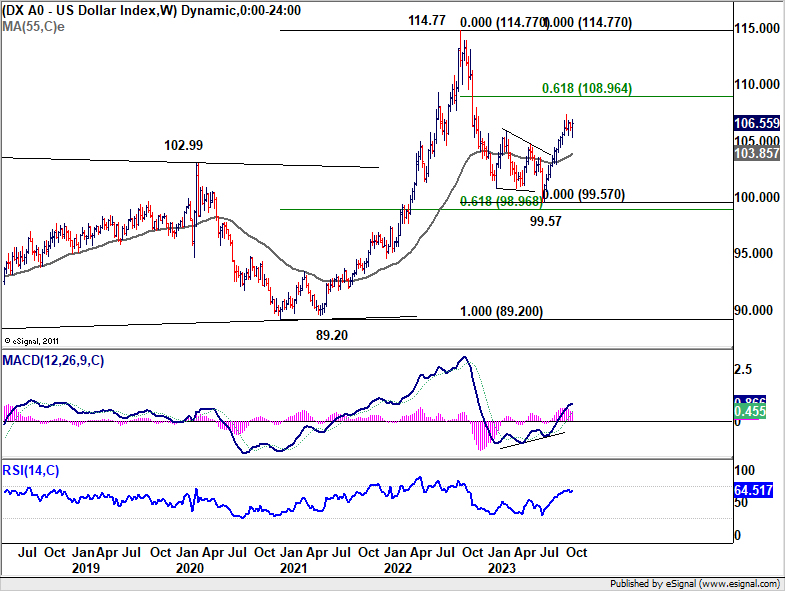
Major US indices registered declines, with DOW, S&P 500, and NASDAQ dropping by -2.1%, -2.5%, and -2.6% respectively. Significantly, both S&P 500 and NASDAQ have plummeted over 10% since their July highs. US 10-year yield flirted with 5% but ultimately fell short. While there's still a tilt towards higher yield, diminishing momentum might cap the rise around 5.1% mark. Concurrently, Dollar Index maintains its bullish stance, eyeing a breakout above 107.34. However, should Treasury yields lose steam, Dollar Index might require additional support from risk-off sentiment to surpass a hurdle at 108.9 Fibonacci resistance.
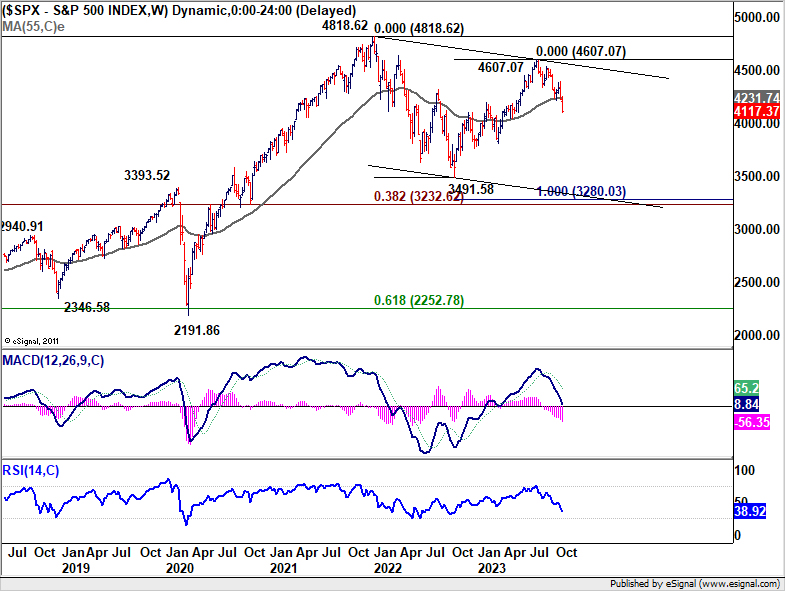
S&P 500's decline from 4607.07 extended through 38.2% retracement of 3491.58 to 4607.07 at 4180.95. Break of near term falling channel support argues that it's probably in downside acceleration. Near term outlook will stay bearish as long as 4259.84 resistance holds. Next near term target is 61.8% retracement at 3917.70.
More importantly, the fall from 4607.07 could be viewed as the third leg of the pattern from 4818.62 (2022 high. The strong break of 55 W EMA (now at 4231.74) is a medium term bearish sign too. This decline could eventually extend through 3491.58 support to 100% projection of 4818.62 to 3491.58 from 4607.07 at 3280.03 before completion.
10-year yield extended near term consolidation below 5% handle last week but the retreat has been shallow so far. Mild bearish divergence condition in D MACD argues that while further rise is in favor, 61.8% projection of 1.343 to 4.333 from 3.253 at 5.100 should hold on first attempt. But after all, even in case of extended pull back, near term outlook will stay bullish as long as 4.532 support holds.
Dollar index extended the corrective pattern from 107.34 with another dip last week. But it recovered ahead of 55 D EMA (now at 105.28). Outlook will stay bullish as long as 38.2% retracement of 99.57 to 107.34 at 104.37. Break of 107.34 will resume the rise from 99.57 to 61.8% retracement of 114.77 to 99.57 at 108.96. This would now be the important hurdle to overcome.
Gold and Bitcoin soar as global tensions intensify
With the current global backdrop, it's crucial to cast an eye on the noteworthy developments in Gold and Bitcoin, as both assets have charted a course of strong rally. While Gold has traditionally been embraced as a safe-haven asset, the recent surge suggests that Bitcoin might be joining its ranks, benefiting from a similar flight to safety.
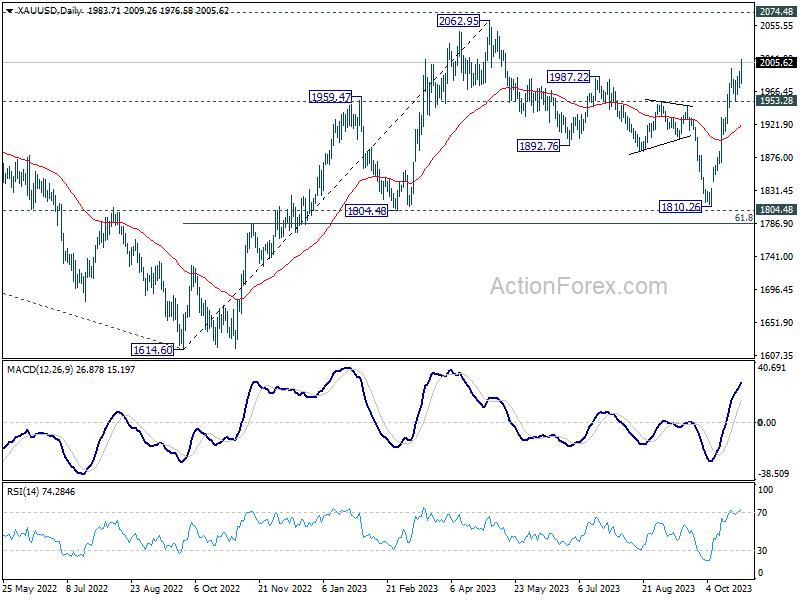
Over the last week, Gold primarily lingered in a phase of consolidation but made a decisive move, breaking 2000 handle as its recent robust rally picked up momentum on Friday. This upward trajectory coincides with the international community's unsuccessful appeals for a humanitarian truce between Israel and Hamas. Despite the United Nations General Assembly's efforts, the call for peace has yet to be heeded.
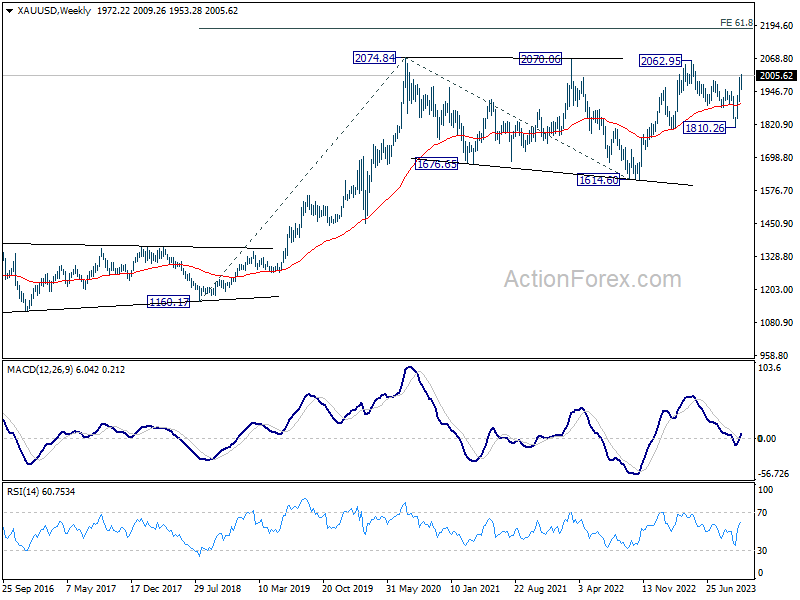
Technically, as long as 1953.28 support holds, Gold's bullish momentum would continue to 2062.95/2074.48 long term resistance zone. Given the three-wave corrective structure observed from 2062.95 to 1810.26, uptrend from 1614.60 is likely ready to resume through 2062.95. This would also mean that the long-term uptrend would be back in play. Next medium term target will be 61.8% projection of 1160.17 to 2074.84 from 1614.60 at 2179.86.
Shifting to Bitcoin, some analysts believe its rally transcends the mere anticipation of the Spot BTC ETF's eventual rollout. They posit that Bitcoin is increasingly being viewed as a "flight to quality" amidst escalating global tensions and conflicts. Furthermore, the indirect impact of warfare on depreciating fiat currencies due to governmental spending cannot be overlooked.
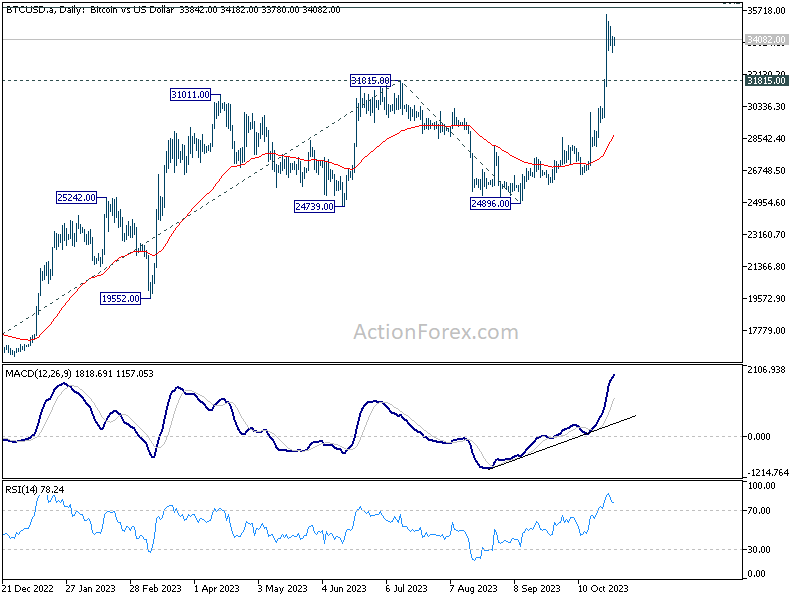
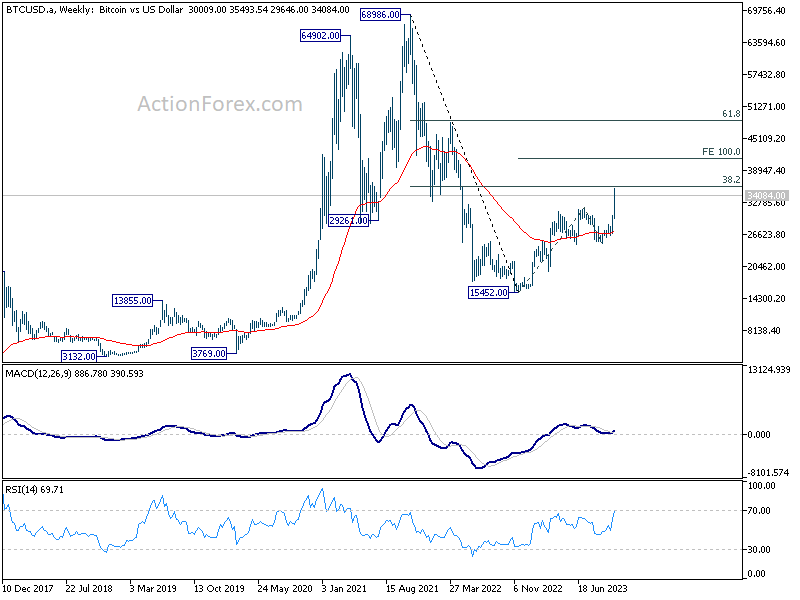
Technically, Bitcoin's gaze is fixed on the pivotal resistance of 38.2% retracement of 68986 to 15452 at 35901. Sustained break of this threshold would suggest bullish trend reversal, rather than a mere correction, of the overall downtrend from 2021 high of 68986. The next immediate target is 100% projection of 15452 to 31815 from 24896 at 41259. However, should 31815 resistance-turned-support be broken, it could signal a decrease in upward pressure, leading to a phase of consolidations first.
EUR/CAD continues upward march following BoC and ECB holds
EUR/CAD extended recent rally last week as the financial markets parsed the implications of policy decisions by BoC and ECB.
BoC elected to hold its policy rate steady at 5.00%. Despite maintaining a moderate hawkish bias, a growing consensus among analysts suggests that we might have seen the peak of this rate cycle. Canada's growth outlook is on a subdued trajectory, a consequence of prior tightening measures still permeating through the economy. Meanwhile, the pace of disinflation was evident, even if its pace might not align with BoC's idea. Money markets have recalibrated their expectations post the rate decision, now seeing a reduced 40% likelihood of a further rate hike in the coming months, a notable decline from the earlier 60% probability.
On the European front, ECB also opted to keep its main refinancing rate unchanged at 4.50%. President Christine Lagarde emphasized the prevalent economic uncertainties but voiced confidence that sticking to the current rates for an extended period would guide inflation back to the bank's target. Notably absent was any conversation about hastening the conclusion of PEPP reinvestments.
While the peak for interest rates from both banks might have been attained, forecasts diverge regarding the timing of the first potential rate cut, and the subsequent moves. Some financial experts anticipate the BoC might slash rates as soon as in early Q2 2024, positioning the rate between 3.00% and 3.50% by year's end. Simultaneously, market sentiments lean towards a rate cut by the ECB later in the same quarter, followed by two subsequent reductions, settling the rate at approximately 3.75% by the close of 2024.
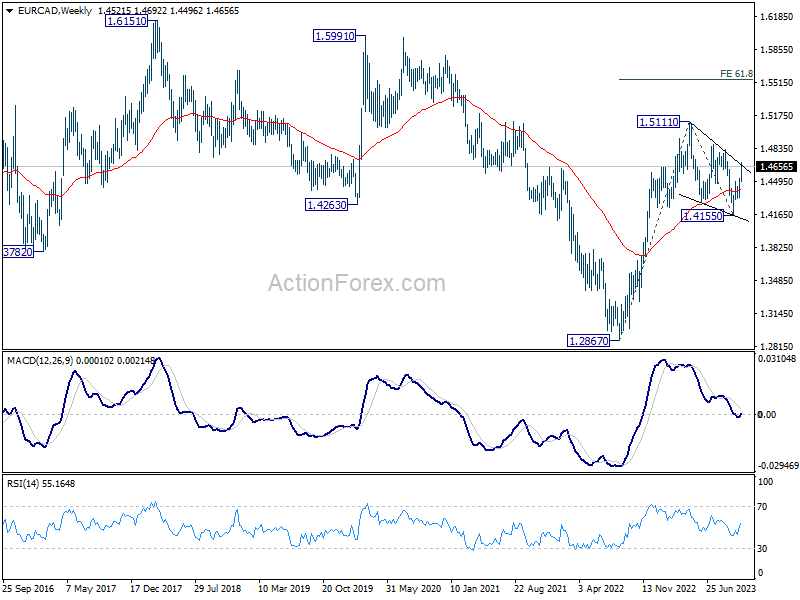
That could partly explain the recent rally in EUR/CAD, which continued last week. From a technical perspective, EUR/CAD's corrective fall from 1.5111 should have completed with three waves down to 1.4155. Further rise is expected as long as 1.4495 support holds, to 1.4822 resistance next.
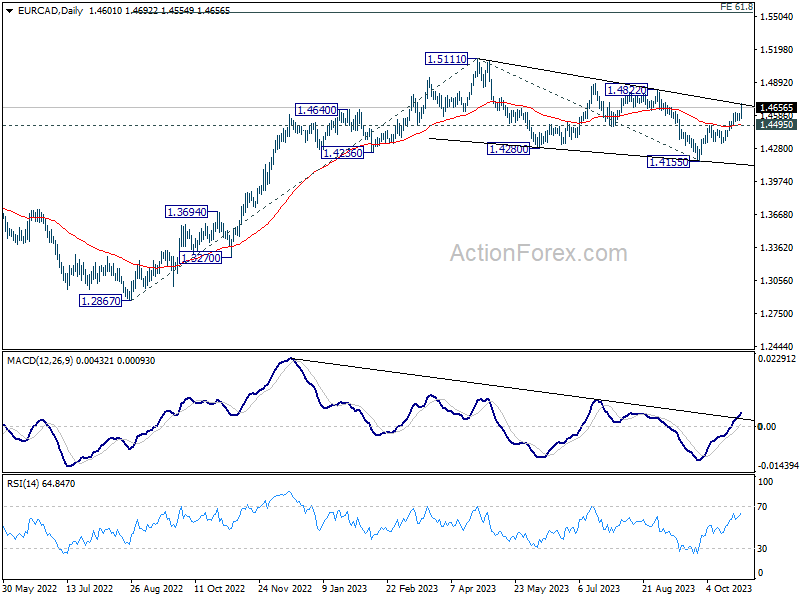
Decisive break of 1.4822 will bolster the chance of up trend resumption through 1.5111 high. In this bullish case, next target will be 61.8% projection of 1.2867 to 1.5111 from 1.4155 at 1.5542.
Yen mounts comeback as bears left wanting
Yen underwent an initial decline, slipping below 150 psychological level against Dollar, but managed to stage a recovery on Friday without any evident backing from Japan's intervention.
The resurgence in Tokyo inflation strengthened expectation that BoJ would raise its core inflation forecast for fiscal 2024 into 2% range. Additionally, ongoing conjectures suggest BoJ might be on the cusp of adjusting policies, potentially paving the path towards exiting negative interest rates in 2024.
However, it's essential to remember that even the most optimistic BoJ board members foresee "January to March of next year" as the earliest window for tangible evidence of sustained wage growth and inflation. Furthermore, the current JGB yield curve doesn't display significant distortions that would necessitate another adjustment in yield curve control. Consequently, the upcoming BoJ meeting might be premature for any substantial policy adjustments.
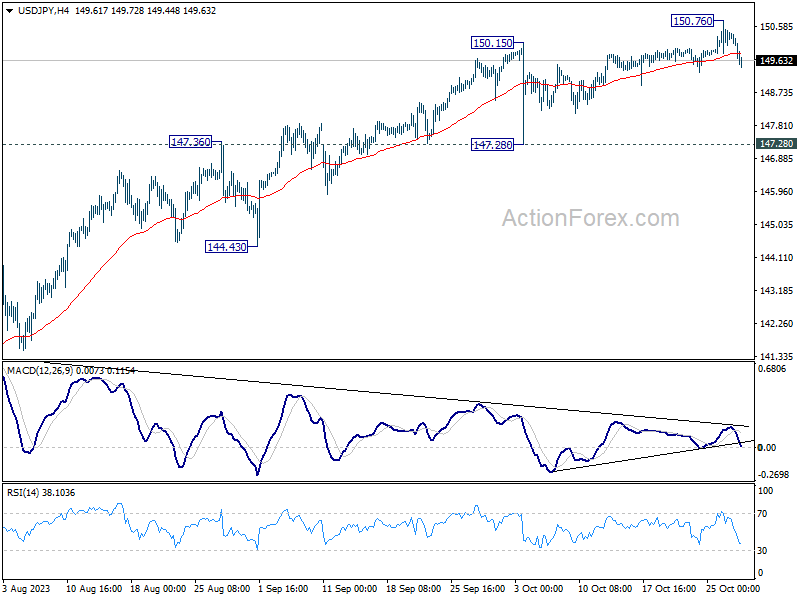
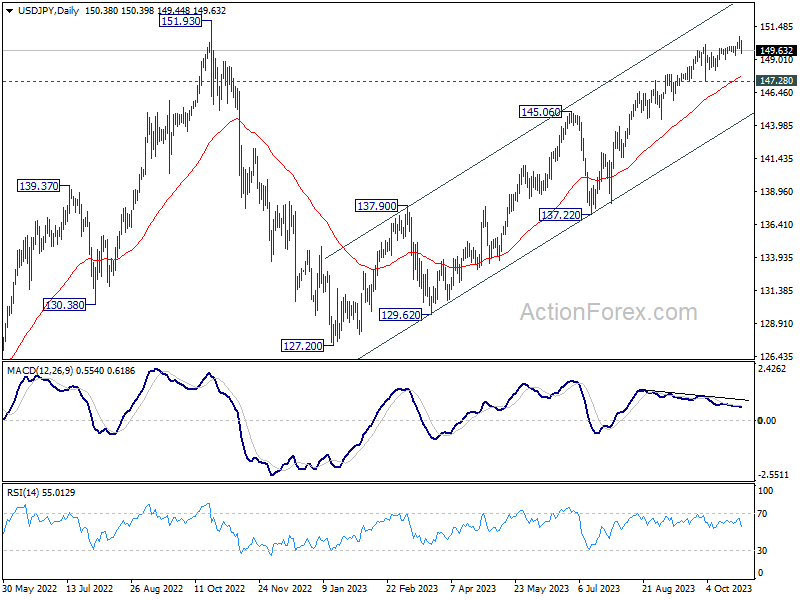
The late-week recovery of Yen could likely stem from the disappointment among Yen bears, who observed no follow-through in the markets after USD/JPY breached 150.15 mark. From a technical standpoint, USD/JPY is just in near term consolidations. While deeper retreat cannot be ruled out, outlook will stay bullish as long as 147.28 support holds, for another attempt on 151.93 high.
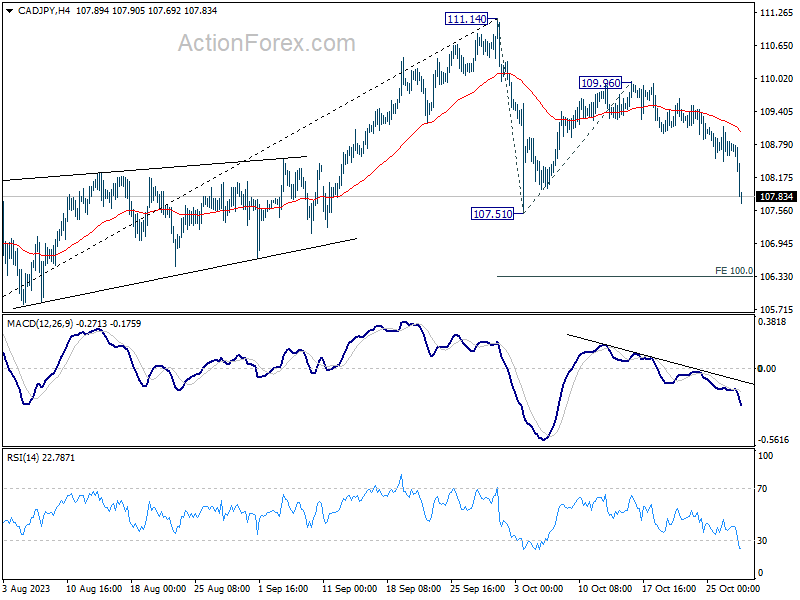
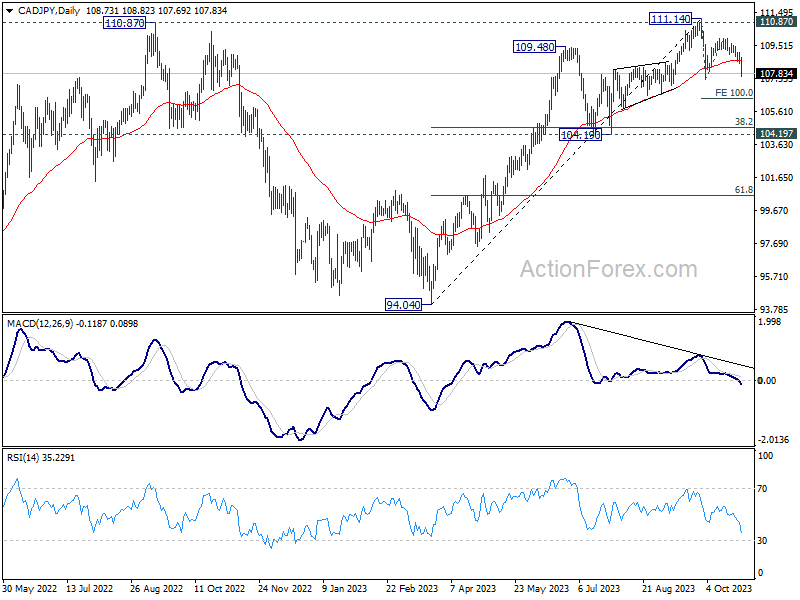
However, Yen's rally was far more pronounced against Canadian Dollar. CAD/JPY's steep fall on Friday indicates that fall from 111.14 is ready to resume. Firm break of 107.51 support will target 100% projection of 111.14 to 107.51 from 109.96 at 106.63, or even further to 104.19 support which is close to 38.2% retracement of 94.04 to 111.14 at 104.60.
AUD/USD Weekly Report
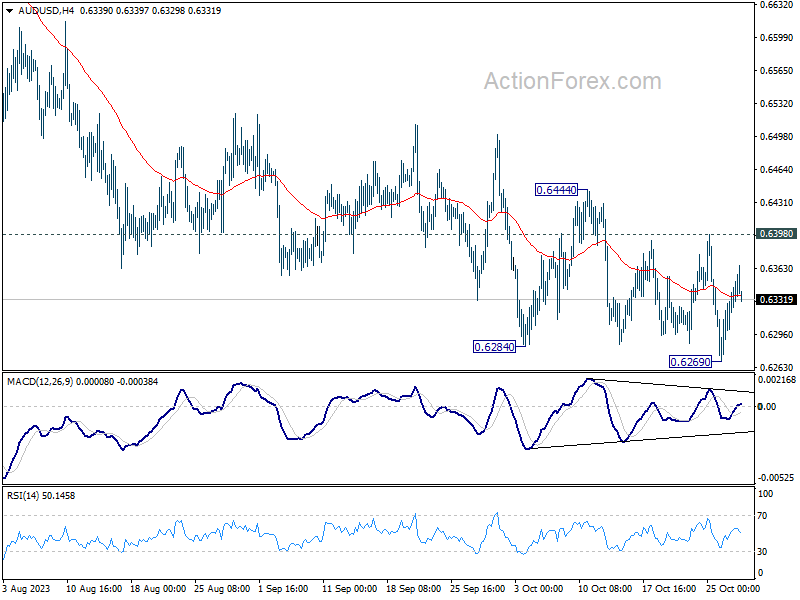
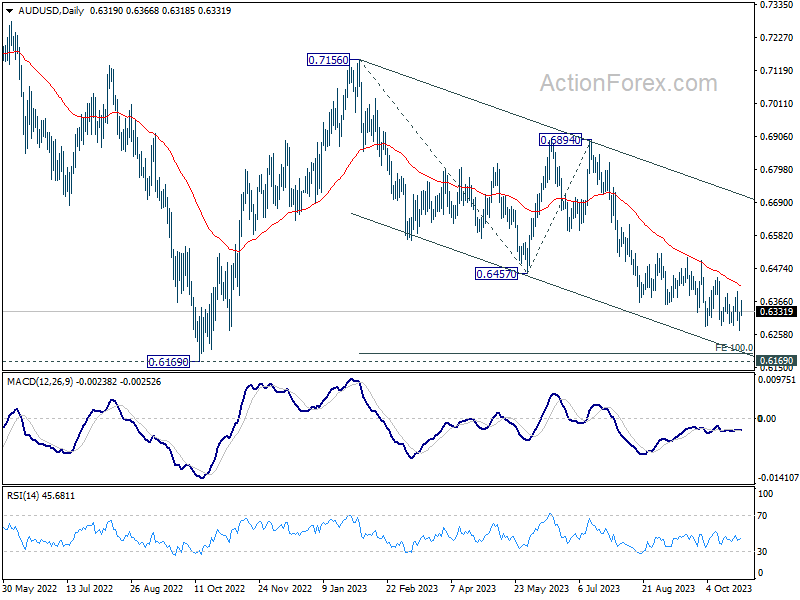
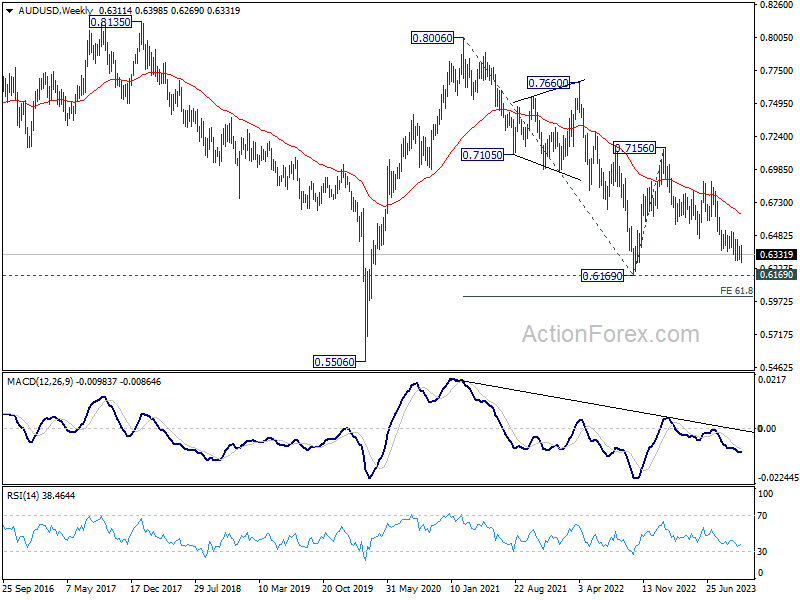
AUD/USD edged lower to 0.6269 last week but quickly recovered. Initial bias remains neutral this week first. Outlook will stay bearish as long as 0.6398 resistance holds. Break of 0.6269 will resume larger fall from 0.7156 to 100% projection of 0.7156 to 0.6457 from 0.6894 at 0.6195, which is close to 0.6169 medium term support.
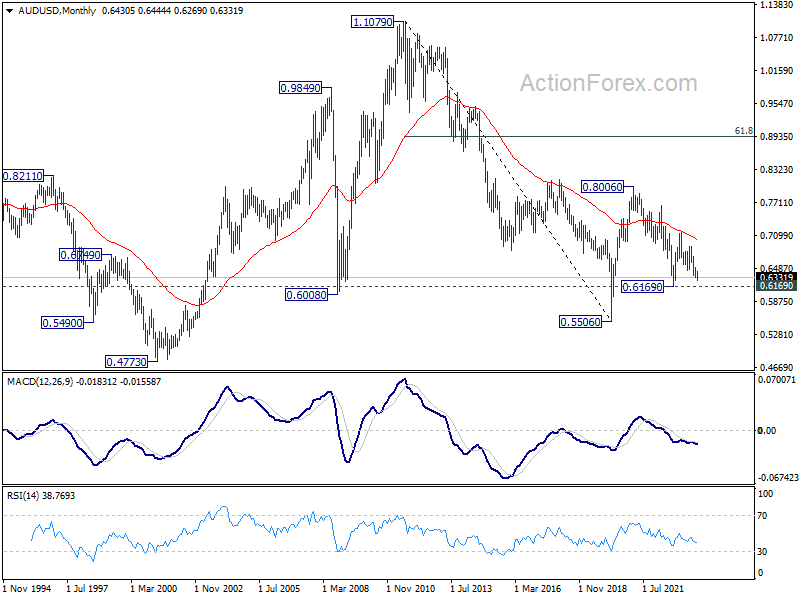
In the bigger picture, down trend from 0.8006 (2021 high) is possibly still in progress. Decisive break of 0.6169 will target 61.8% projection of 0.8006 to 0.6169 to 0.7156 at 0.6021. This will now remain the favored case as long as 0.6894, in case of strong rebound.
In the long term picture, while fall from 0.8006 might extend lower, the structure argues that it's merely a correction to rise from 0.5506 (2020 low). In case of downside extension, strong support should emerge above 0.5506 to bring reversal. But still, momentum of the next move will be monitored to adjust the assessment.
EUR/USD Weekly Outlook
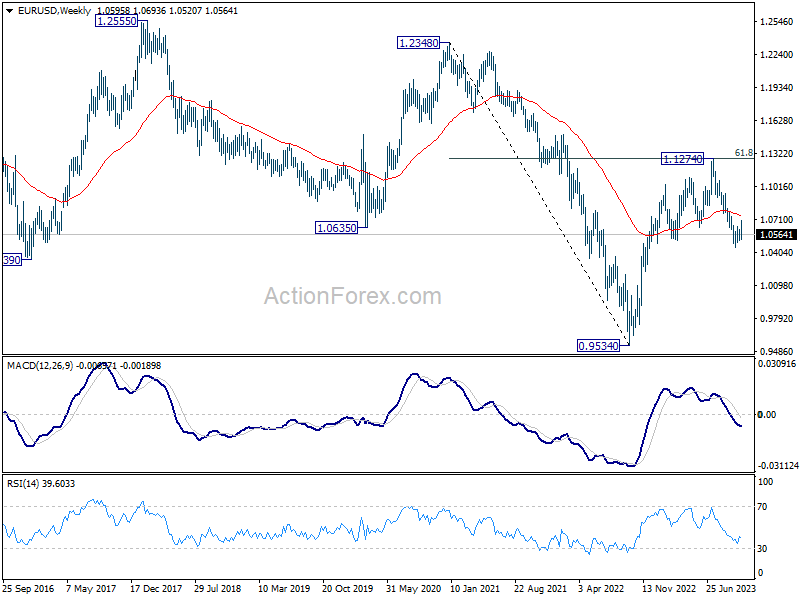
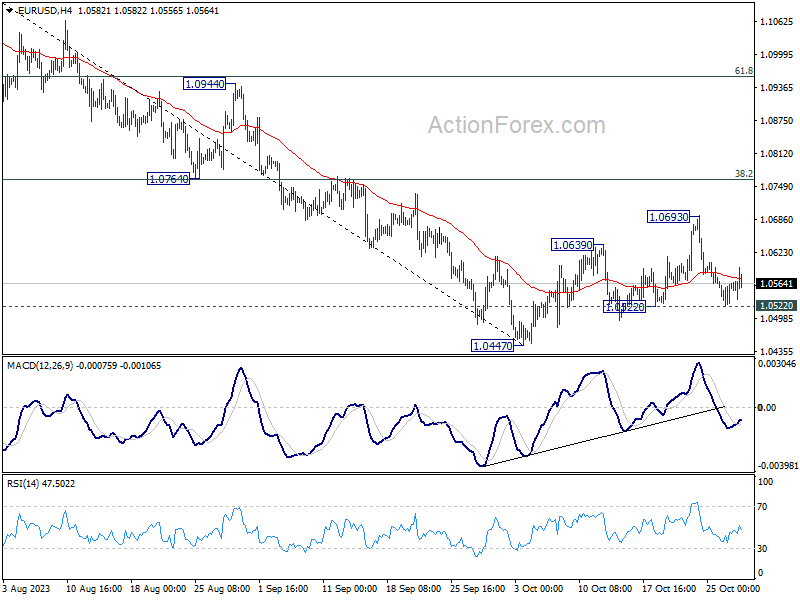
EUR/USD rebounded further to 1.0693 last week but was rejected by 55 D EMA and retreated. Initial bias stays neutral this week first. On the downside, break of 1.0522 support will turn bias back to the downside for retesting 1.0447 low. Break there will resume larger fall from 1.1274. On the other hand, strong bounce from current level, followed by break above 1.0693, rebound from 1.0447 to 1.0764 cluster resistance (38.2% retracement of 1.1274 to 1.0447 at 1.0763).
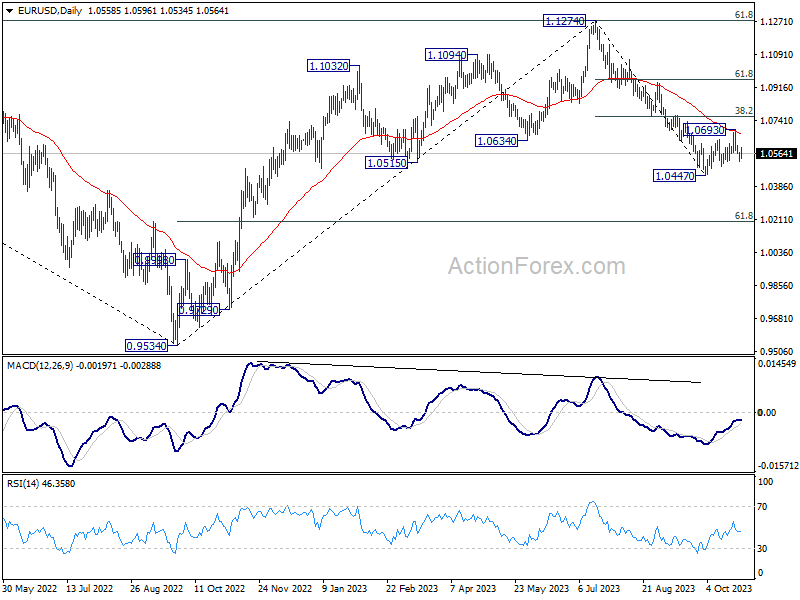
In the bigger picture, fall from 1.1274 medium term top could still be a correction to rise from 0.9534 (2022 low). But chance of a complete trend reversal is rising. In either case, current fall should target 61.8% retracement of 0.9534 to 1.1274 at 1.0199 next. For now, risk will stay on the downside as long as 55 D EMA (now at 1.0668) holds, in case of rebound.
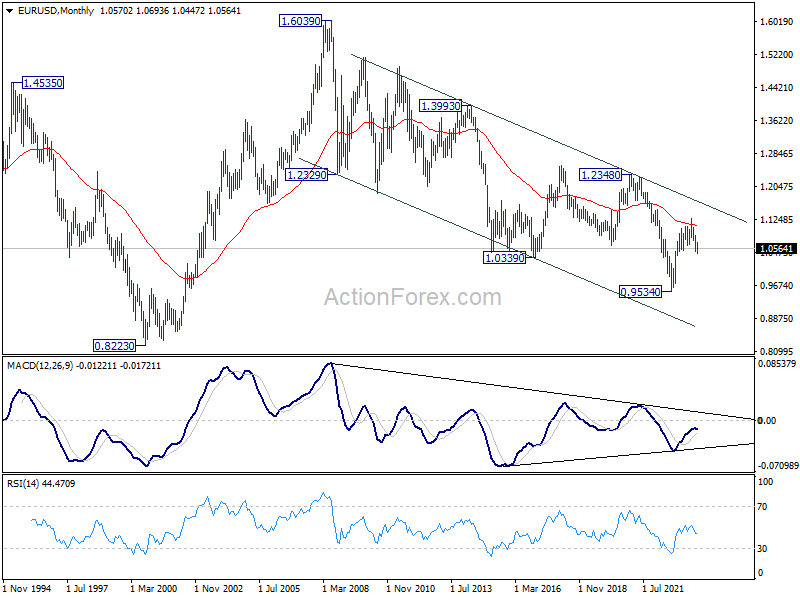
In the long term picture, there is no clear sign of trend reversal yet. That is, down trend from 1.6039 (2008 high) might still be in progress. Rejection by 55 M EMA (now at 1.1087) will retain long term bearishness, for another fall through 0.9534 at a later stage.