

Sample Category Title
USD/CHF Daily Outlook
Daily Pivots: (S1) 0.9044; (P) 0.9060; (R1) 0.9086; More....
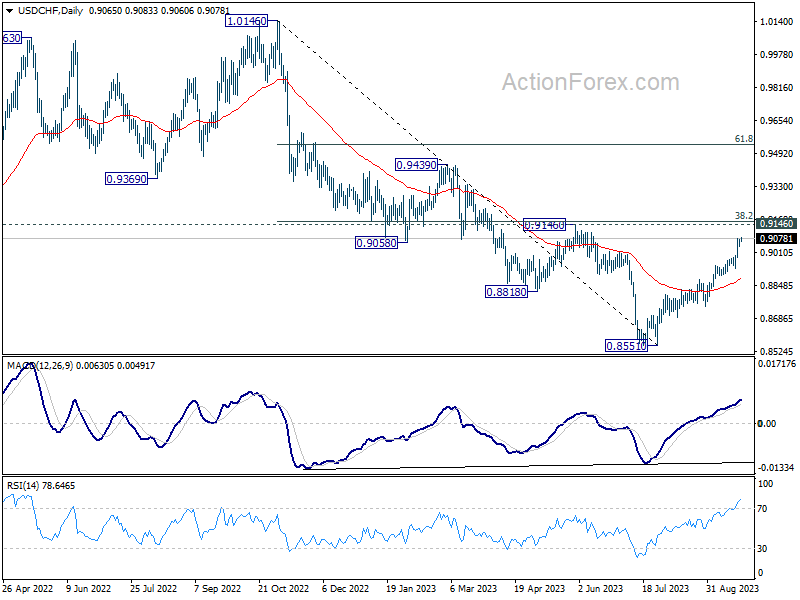
Intraday bias in USD/CHF remains on the upside for the moment. Current rise from 0.8551 is in progress for 0.9146/60 cluster resistance. On the downside, break of 0.9019 minor support will turn intraday bias neutral first. But further rally will remain in favor as long as 0.8874 resistance turned support holds, in case of retreat.
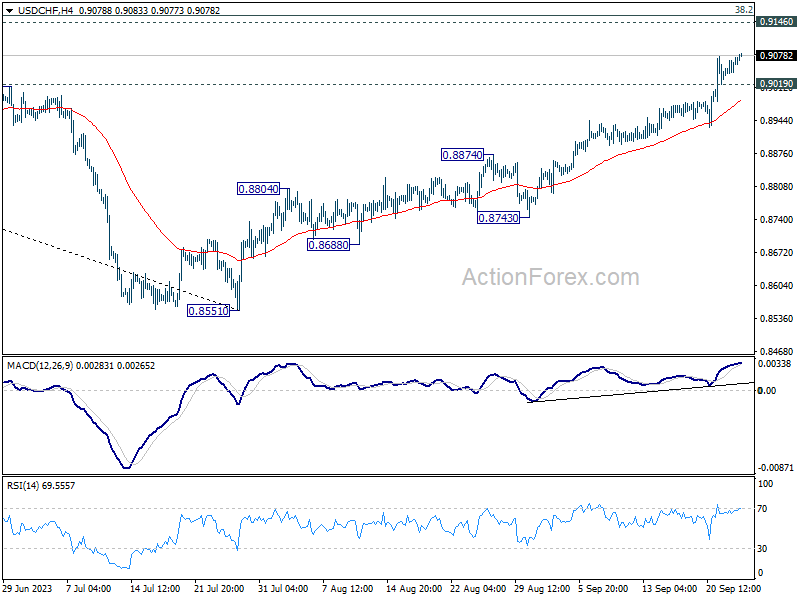
In the bigger picture, rebound from 0.8551 medium term bottom is currently seen as a correction to the downtrend from 1.0146 (2022 high). Further rally would be seen to 0.9146 cluster resistance (38.2% retracement of 1.0146 to 0.8551 at 0.9160). Strong resistance could be seen there to limit upside, at least on first attempt. However, decisive break of 0.9146/60 will indicate trend reversal, and target 61.8% retracement at 0.9537.
USD/CAD Daily Outlook
Daily Pivots: (S1) 1.3441; (P) 1.3466; (R1) 1.3509; More....
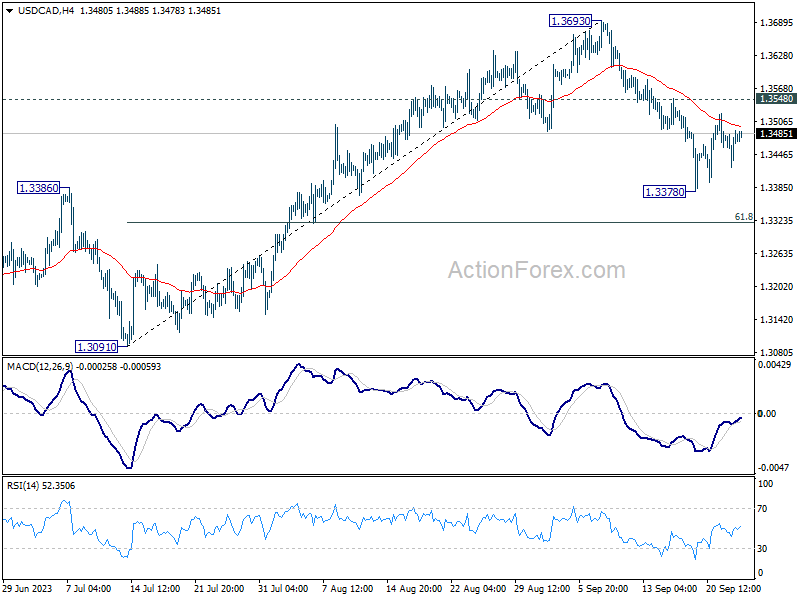
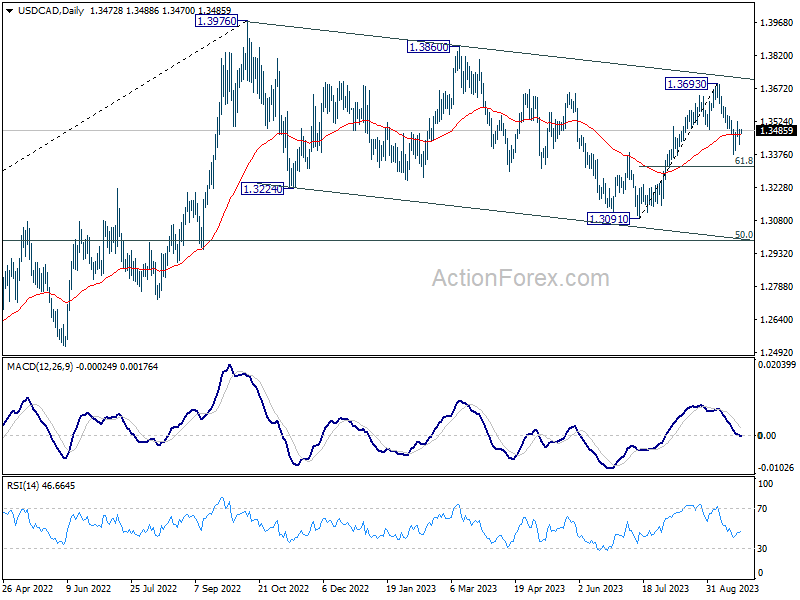
Intraday bias in USD/CAD remains neutral as consolidation from 1.3378 is extending. Risk will stay on the downside as long as 1.3548 resistance holds. Break of 1.3378 will resume the fall from 1.3693, as another leg in the corrective pattern from 1.3976 high, to 61.8% retracement of 1.3091 to 1.3693 at 1.3321.
In the bigger picture, price actions from 1.3976 are viewed as a corrective pattern to the up trend from 1.2005 (2021 low). Deeper decline could be seen as the pattern is now extending. But downside should be contained by 50% retracement of 1.2005 to 1.3796 at 1.2991. Rise from 1.2005 is still expected to resume after the correction completes.
BoJ Ueda highlights shifting dynamics in Japan’s inflation drivers
BoJ Governor Kazuo Ueda, in a speech today, delineated the two forces in play regarding Japan's inflationary pressures: "The first force, led by import prices, has seen its year-on-year rate of increase decelerate," and he anticipates this force will "gradually wane."
As for the second force, Ueda suggested it is tied to changes in firms' wage and price-setting behaviors, with the potential to strengthen as "wage growth accelerates owing to economic improvement, leading to moderate inflation."
However, he cautioned that the spread and permanence of these behaviors are uncertain, adding, "Changes have started to be seen in some aspects of firms' wage- and price-setting behavior, but there are extremely high uncertainties as to whether these changes will become widespread."
Addressing Japan's broader economic outlook, Ueda described the nation as being in a "critical phase" concerning the interplay between wages and prices. Stressing the importance of fostering nascent economic shifts, he emphasized the need "to carefully nurture the buds of change in the economy."
Ueda reiterated BoJ's stance on monetary policy, stating the need "to patiently continue with monetary easing under the framework of yield curve control."
Euro-Dollar at Important Support
The week started on a cautious note as stocks in Asia mostly sold off following a rough week in the US, where the Federal Reserve’s (Fed) hawkish pause triggered a fresh wave of worries that the rates would stay higher for longer. The US 2-year yield bounced lower after hitting 5.20%, yet the US 10-year continues its journey higher and hit 4.50% on Friday. The S&P500 slipped below its ascending base since last October, fell below its 100-DMA, and closed the week at the lowest levels since June, having recorded the worst performance over the week since the banking crisis in March. BoFA said that equity investors are dumping stocks at the fastest level since last December, and Morgan Stanley warned that stocks are now ‘fragile’. Indeed! More fragile than the S&P500 are the rate sensitive technology stocks, and the small cap stocks. The growing divergence between the S&P500 and Russell 2000 index is also flashing ‘recession’, on top of the heavily inverted US yield curve.
Elsewhere, the UAW strikes will broaden to all GM and Stellantis parts plants in the US, which means that 5600 more workers will join the movement (Ford will likely be spared, for now, as some good progress is made on negotiations with the UAW) and the US will shut down by the end of the week if politicians fail to pass a dozen of bills. The latest US GDP update will fall in this chaotic environment, but the expectation is a positive revision from 2.1% to 2.3%.
In the currency markets, the US dollar extends gains. The dollar index entered the bullish consolidation zone after the Fed kept the possibility of another rate hike before the year ends on the table when it met last week, and said that the rates will likely stay higher for longer next year.
The EURUSD tested an important Fibonacci support last week, the major 38.2% retracement level which should distinguish between the positive trend building since last year, and a slide into the bearish consolidation zone. There is a stronger case for further euro weakness than the contrary. Released last Friday, the preliminary September PMI figures were mixed; the Eurozone manufacturing further slowed but German numbers hinted at some improvement. This week, we will see how the recent slowdown impacted the inflation dynamics in September. Headline inflation in the euro area is expected to have slowed from 5.2% to 4.5% this month, a slowdown that would defy the rising energy prices and the euro depreciation. Core inflation is seen softening from 5.3% to 4.8%. Any softness in inflation figures should give further support to the euro bears, while higher than expected numbers, which I believe could be the surprise of this week could revive the European Central Bank (ECB) hawks, but will hardly prevent the euro from seeking into a deeper depression, as further ECB action would also mean a bigger hit on economies. That’s a fear that will likely keep euro bulls away from the market for now.
On the corporate calendar, Micron Technology and Nike will be releasing their latest quarterly results, and TotalEnergies Investor Day Event will gather happy industry players as US crude consolidates gains above $91pb with no big sign of a significant downside correction.
Modest Movements in Global Market Monday Morning
Market movers today
This week starts off with thin calendar in terms of data releases. In Germany, we receive the Ifo indicator for September. The assessment of the current climate has declined continuously since March and it will likely tick lower again. Expectations have stabilised in recent months, and it will be interesting to see if they actually increase a bit, which is what consensus is looking for.
The 60 second overview
We have seen modest moves in the global bond and equity markets this morning. US Treasury yields rose very modestly from the long end of the curve. There have also been modest declines in the Asian equity markets this morning where the Chinese equity market is under pressure given the uncertainty surrounding the Chinese property market.
The main event today is the release of the German IFO indicator for September. We also get PPI from Finland and Spain and there are several ECB speeches from Villeroy, Schabel and Lagarde.
The main event this week will be the inflation data from US and Euroland released on Friday. A downside surprise will be supportive for the bond market as the market will again speculate in faster rate cuts than is currently priced in after last week's central bank meetings where especially the Federal Reserve indicated "higher for longer" and the market priced out rate cuts and Treasury yields rose. However, with 2Y yields higher than 5%, short-dated bonds look attractive from the outright perspective.
Equities: Global equities were lower on Friday and hence failed to recover the lost ground from Thursday. Hence last week equities were lower 5 out of 5 days and the higher for longer narrative was dominating. This picture was confirmed by the style rotation with value and Min Vol doing good and VIX creeping higher. Higher-for-longer was driven by central banks and not least the updated summary of economic projections from Fed members. Inflation numbers were benign last week and oil prices were lower. Higher-for-longer is not just a drag on the economy but is also leading to new discussions on the level of discounting factor and leading to long duration small caps underperforming. On Friday in the US, Dow -0.3%, S&P 500 -0.2%, Nasdaq -0.1% and Russell 2000 -0.3%. Asian markets are mixed this morning with Japan outperforming once again. European futures are lower while US futures are higher.
FI: Last week was busy with several central bank meetings. One common theme was "higher for longer" as rate cuts are not coming in as fast as previously expected especially in the US, and 10Y US Treasury yields have risen some 19bp during the week before declining 6bp on Friday. If the inflation data published on Friday surprises on the downside it should lead to a decline in yields and rates.
FX: After a hectic central bank week, EUR/USD consolidates around 1.0650 following the Fed-induced one-figure drop. GBP/USD continues its downward trajectory following the dovish surprise from BoE. The JPY remains under pressure after BoJ left ultra-easy monetary policy unchanged. Both SEK and NOK are modestly stronger vs EUR after the Riksbank's marginally dovish rate path was effectively balanced by the decision to start hedging the FX reserves and Norges Bank left a hawkish surprise in its rate trajectory. This week has a lot to offer as well including US and EA inflation numbers and interesting central bank speeches.
Credit: The credit markets ended the week on a marginally stronger footing with iTraxx main tightening 0.2bp to 77.3bp and Xover tightening 2.4bp to 416.7bp. We expect a revival of the primary markets in the coming weeks with the central bank rate decisions now out of the way and ahead of the black-out periods.
Nordic macro
This week, August data in the form of PPI, trade balance, household lending and retail sales will be released and the implications for Q3 GDP assessed. Selling price expectations will be in focus what concerns the September confidence survey. Riksbank's Jansson and Flodén will be talking about current monetary policy.
Technical Outlook and Review
DXY:
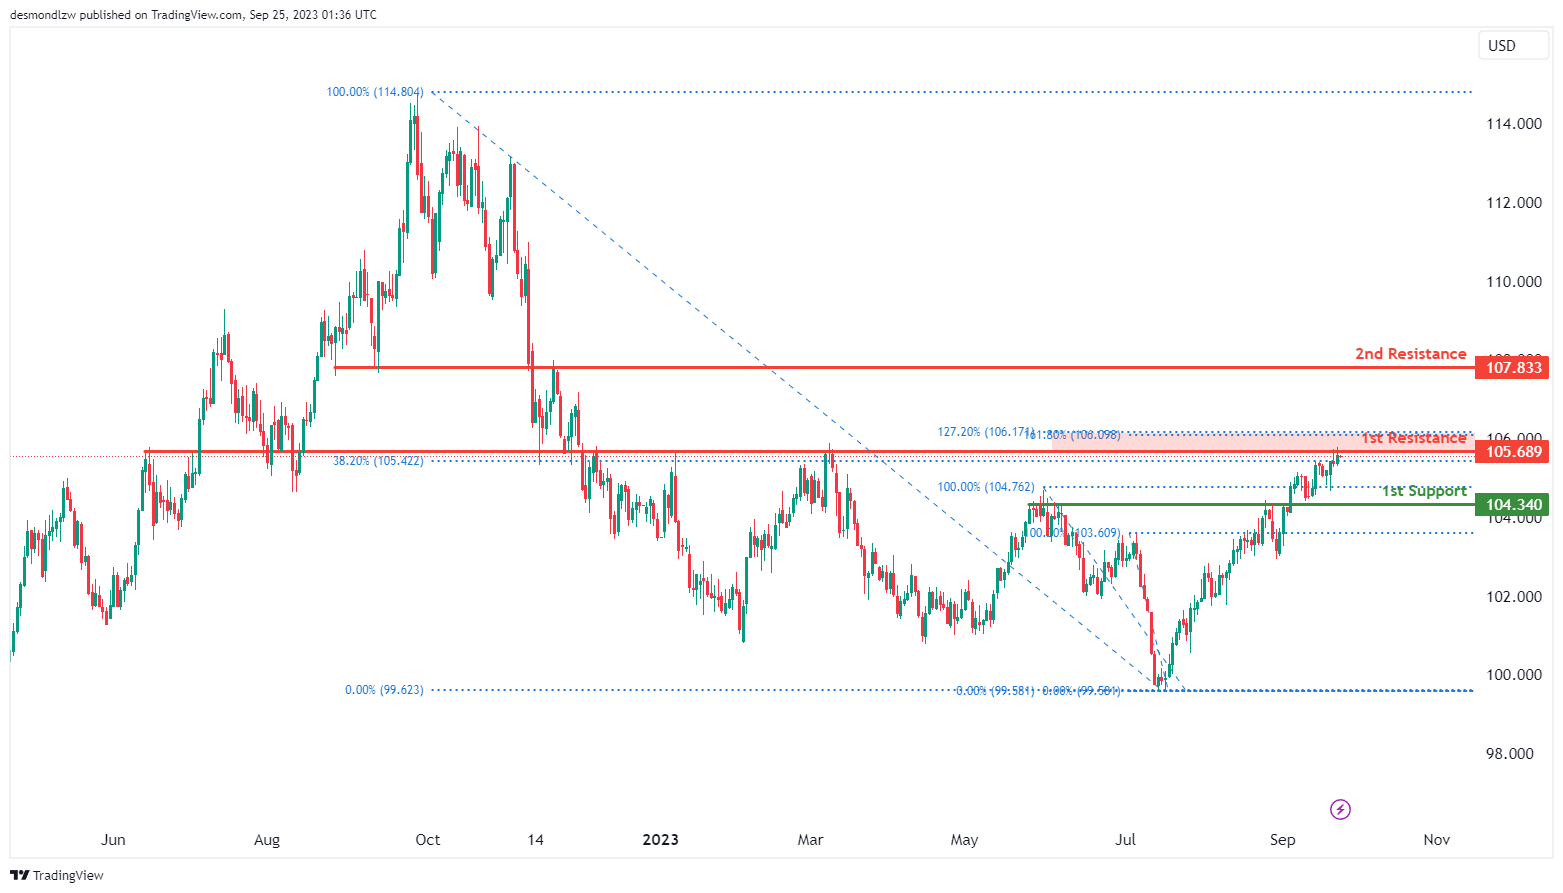
The chart for DXY (US Dollar Index) currently exhibits a bearish overall momentum. In this context, there’s a potential scenario where the price could encounter a bearish reaction upon reaching the 1st resistance level at 105.68, possibly leading to a decline towards the 1st support level at 104.34.
The 1st support level at 104.34 is identified as an overlap support level, suggesting that it may serve as a critical support zone where buyers could potentially step in to prevent further downward movement.
On the resistance side, the 1st resistance level at 105.68 is characterized as an overlap resistance level. Additionally, it coincides with the 127.20% Fibonacci Extension, making it a significant potential barrier for any bullish attempts.
Furthermore, the 2nd resistance level at 107.83 is marked as another overlap resistance level, further reinforcing its potential importance as a point of resistance.
EUR/USD:
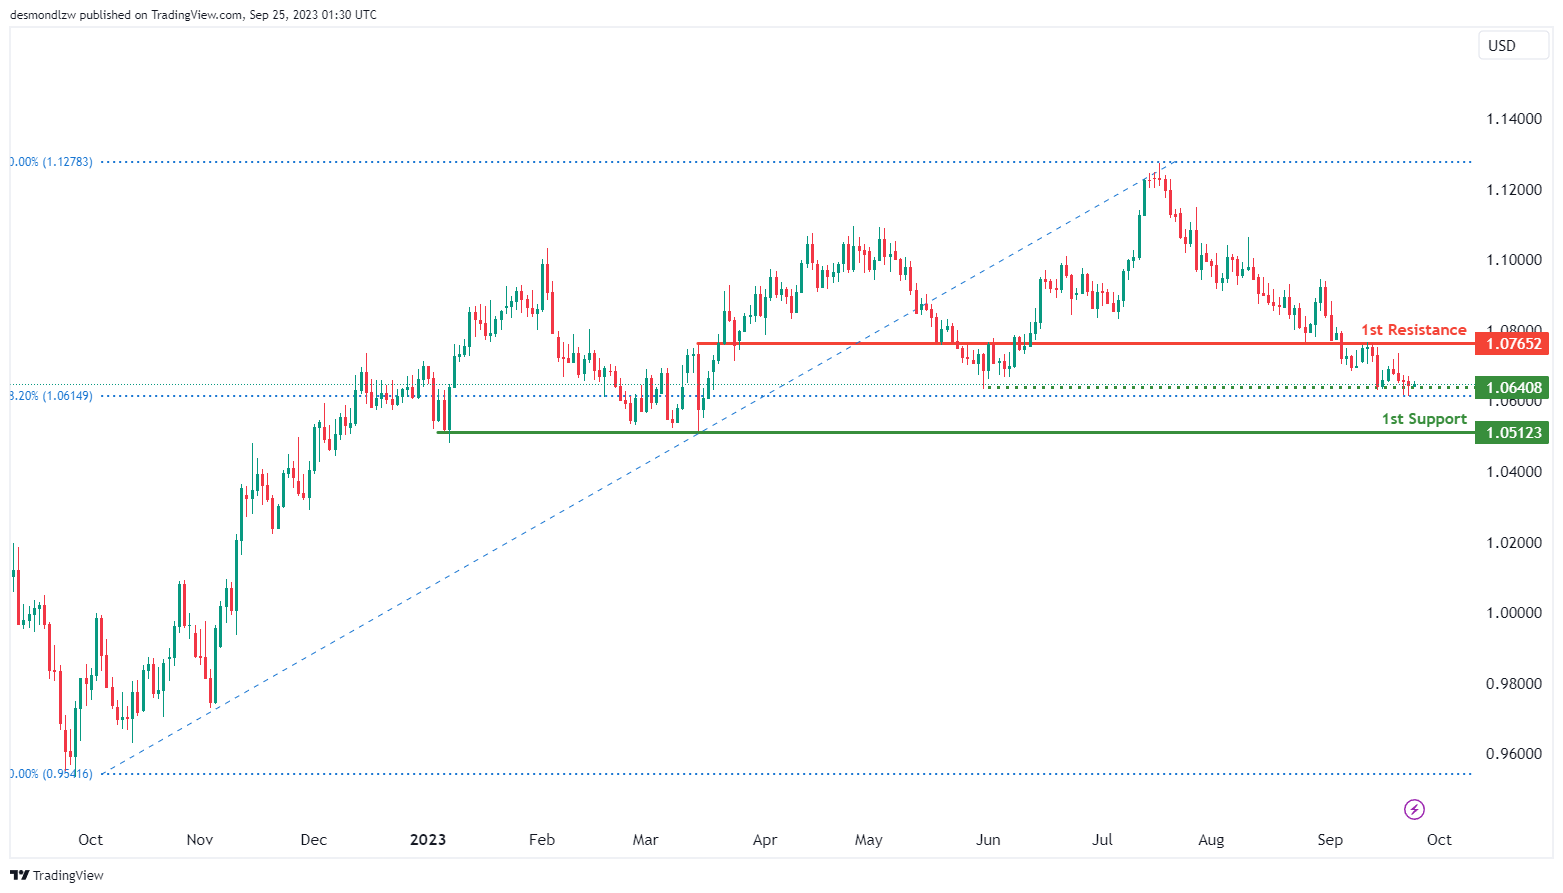
The EUR/USD chart is currently exhibiting a bullish overall momentum. In this context, there is a potential scenario where the price may experience a short-term drop towards the 1st support level at 1.0512 before potentially bouncing from this level and rising towards the 1st resistance at 1.0765.
The 1st support level at 1.0512 holds significance as it is identified as a multi-swing low support. This suggests that it could potentially act as a strong support zone where buying interest may emerge, preventing further downside movement.
Additionally, there is an intermediate support level at 1.0640, which is characterized by the 38.20% Fibonacci Retracement. While this level is not the primary support, it may come into play if the price retraces and provides an additional potential support zone.
On the resistance side, the 1st resistance level at 1.0765 is marked as an overlap resistance. This level could serve as a point of interest for potential bullish movements
EUR/JPY:
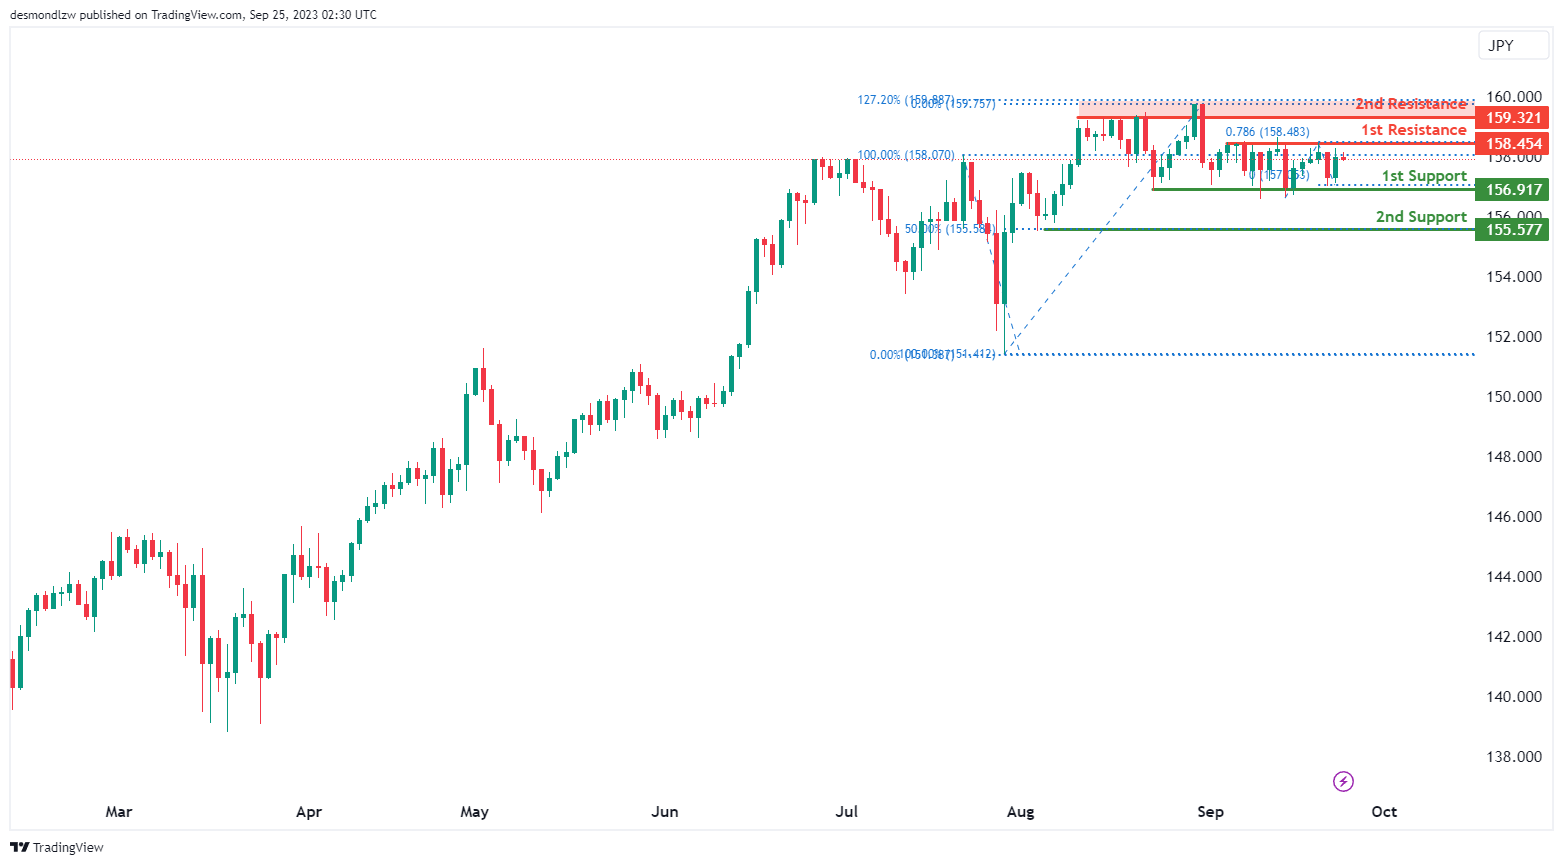
The instrument EUR/JPY currently shows a bearish overall momentum on the chart. There’s potential for a short-term rise towards the 1st resistance before reversing off it and dropping towards the 1st support.
The 1st support at 156.91 is considered good due to its nature as a multi-swing low support.
The 2nd support at 155.57 is also notable as it acts as a swing low support and is associated with the 50% Fibonacci Retracement, offering an additional layer of potential support.
On the resistance side, we have the 1st resistance at 158.45, which is significant because it represents a multi-swing high resistance and is linked to the 78.60% Fibonacci Projection.
Meanwhile, the 2nd resistance at 159.32 is noteworthy as it functions as a pullback resistance and is associated with the 127.20% Fibonacci Extension, suggesting a potential point where the price may reverse its short-term rise and start to drop.
EUR/GBP:
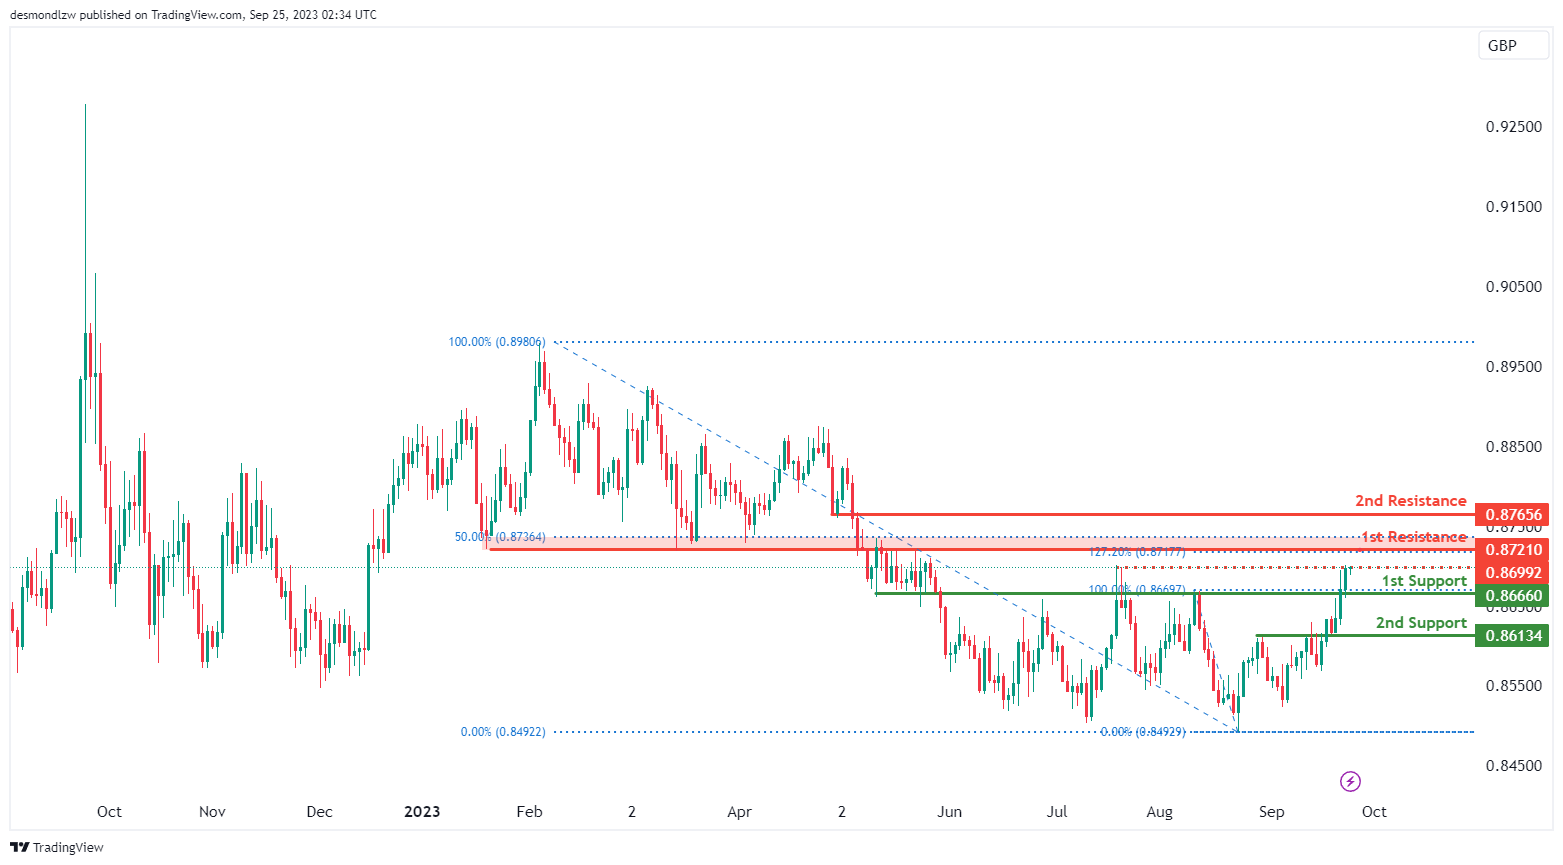
The instrument EUR/GBP currently indicates a bullish overall momentum on the chart, and there’s potential for a bullish continuation towards the 1st resistance.
The 1st support at 0.8666 is considered good due to its nature as a pullback support.
The 2nd support at 0.8613 is also notable as it acts as an overlap support.
On the resistance side, we have the 1st resistance at 0.8721, which is significant because it represents an overlap resistance and is associated with the 127.20% Fibonacci Extension.
The 2nd resistance at 0.8765 is also considered good as it functions as a pullback resistance.
Additionally, there’s an intermediate resistance at 0.8699, which is noteworthy because it acts as a swing high resistance, potentially contributing to the overall resistance levels as the price moves towards the 1st resistance.
GBP/USD:
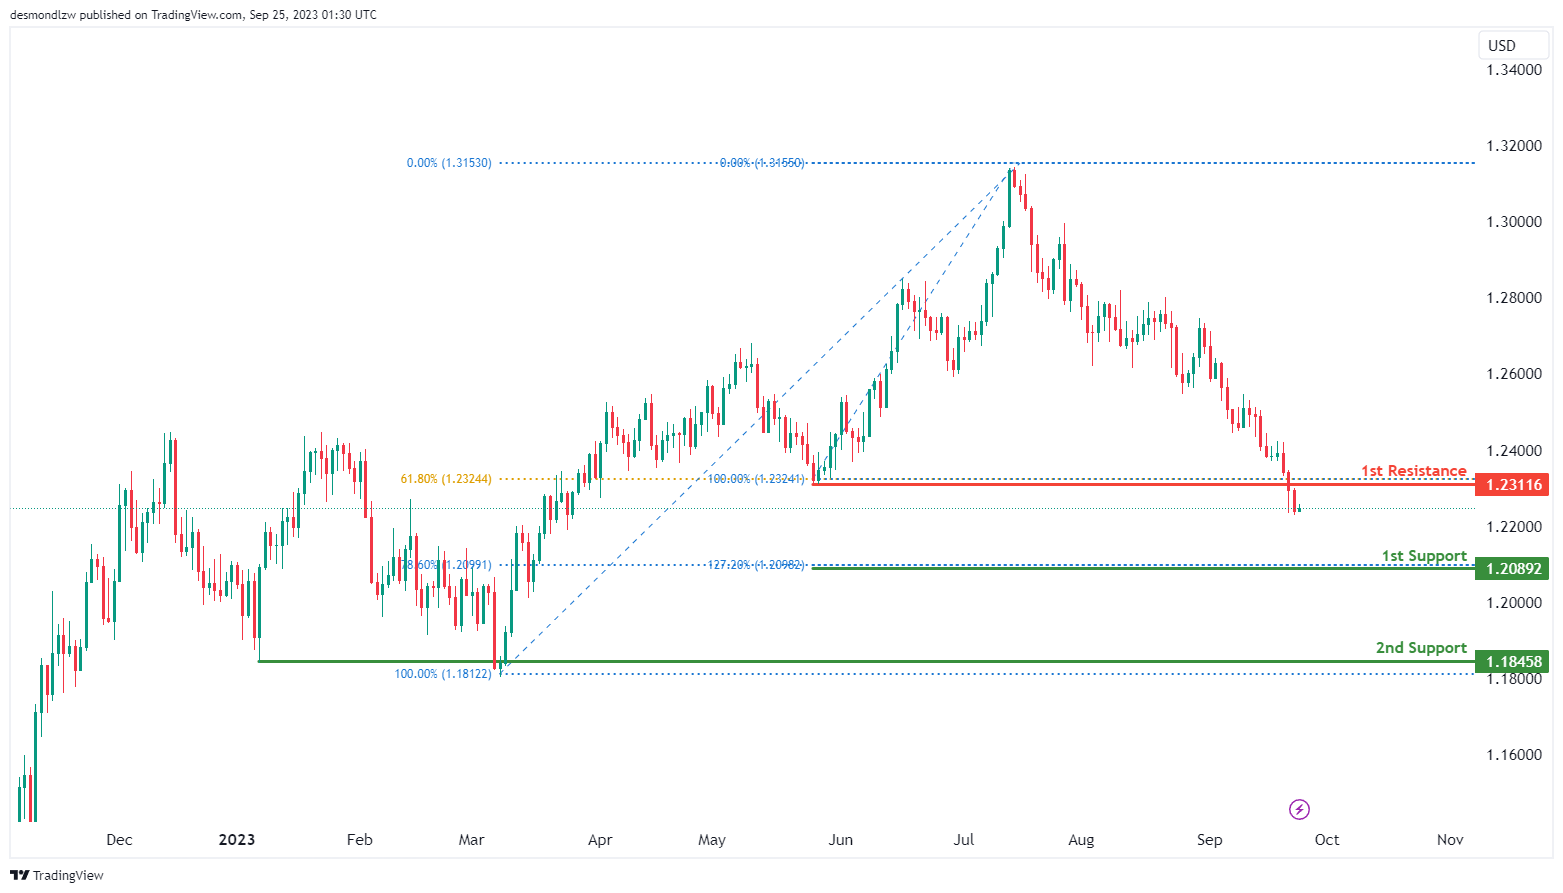
The GBP/USD chart currently reflects a bearish overall momentum. Given this scenario, there is potential for a bearish continuation with a focus on the 1st support level.
The 1st support level at 1.2089 holds particular significance. It is a critical support level due to the confluence of two technical factors: the 127.20% Fibonacci Extension and the 78.60% Fibonacci Retracement. This convergence suggests that 1.2089 could act as a strong support zone where price may find buying interest.
Additionally, the 2nd support level at 1.1845 is another notable area, characterized as a swing low. It signifies a historical level where price has found support in the past.
On the resistance side, the 1st resistance level at 1.2311 stands out as a significant barrier. This level is marked by pullback resistance, indicating a historical point where price retracements have encountered selling pressure. Furthermore, it coincides with the presence of the 61.80% Fibonacci Retracement, adding to its technical significance as a potential resistance zone.
GBP/JPY:
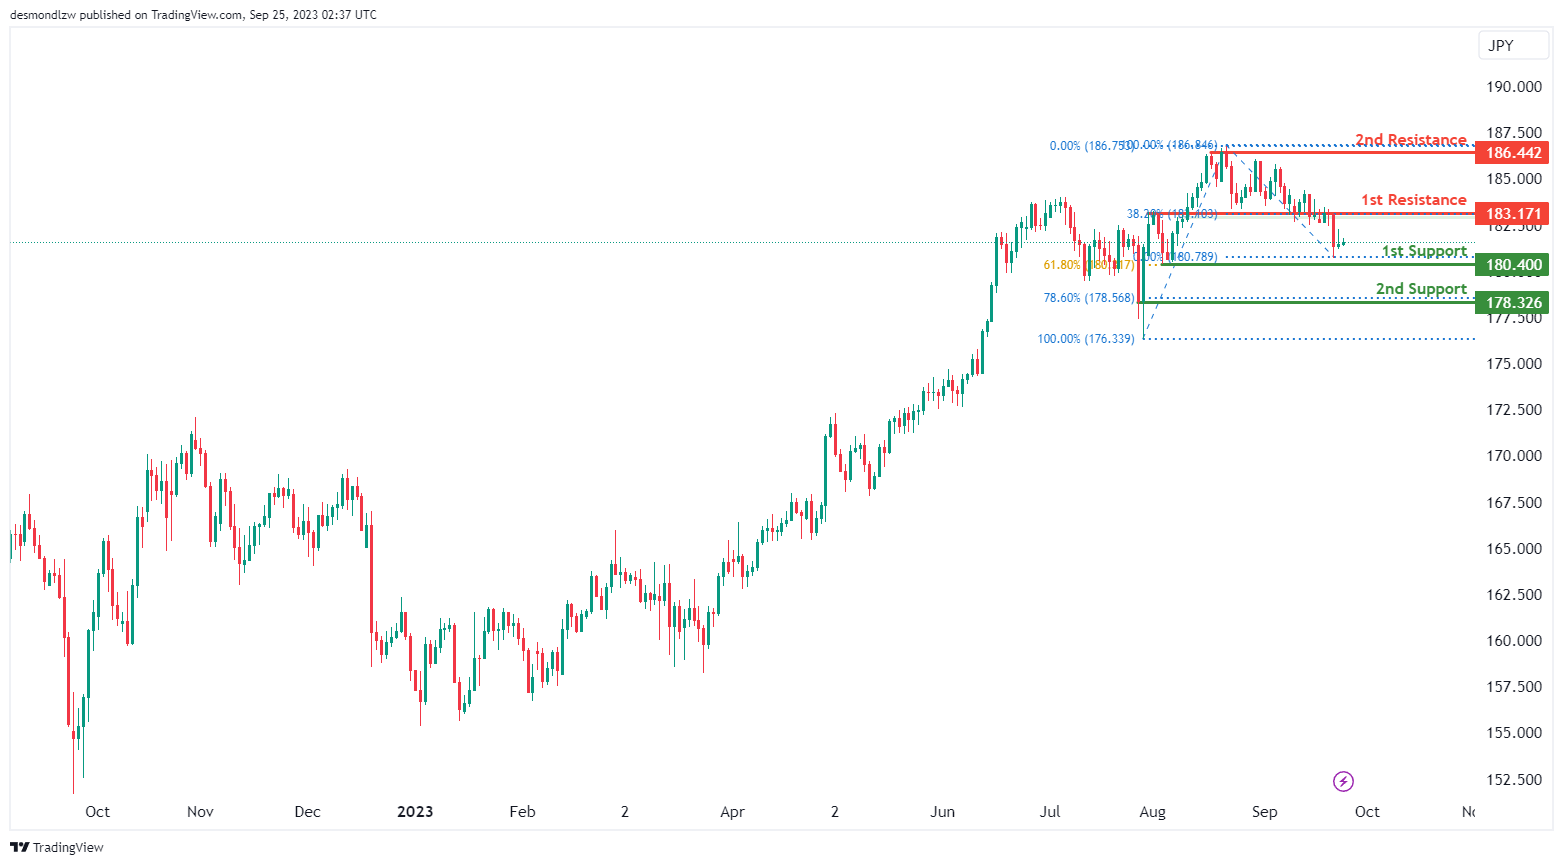
The instrument GBP/JPY currently indicates a bullish overall momentum on the chart, and there’s potential for a bullish continuation towards the 1st resistance.
The 1st support at 180.40 is considered good due to its nature as a swing low support and its association with the 61.80% Fibonacci Retracement.
The 2nd support at 178.32 is also notable as it acts as a swing low support and is associated with the 78.60% Fibonacci Retracement, offering an additional layer of potential support.
On the resistance side, we have the 1st resistance at 183.17, which is significant because it represents an overlap resistance and is linked to the 38.20% Fibonacci Retracement.
Similarly, the 2nd resistance at 186.44 is noteworthy as it functions as a swing high resistance, suggesting potential barriers to further bullish movement at these levels.
USD/CHF:
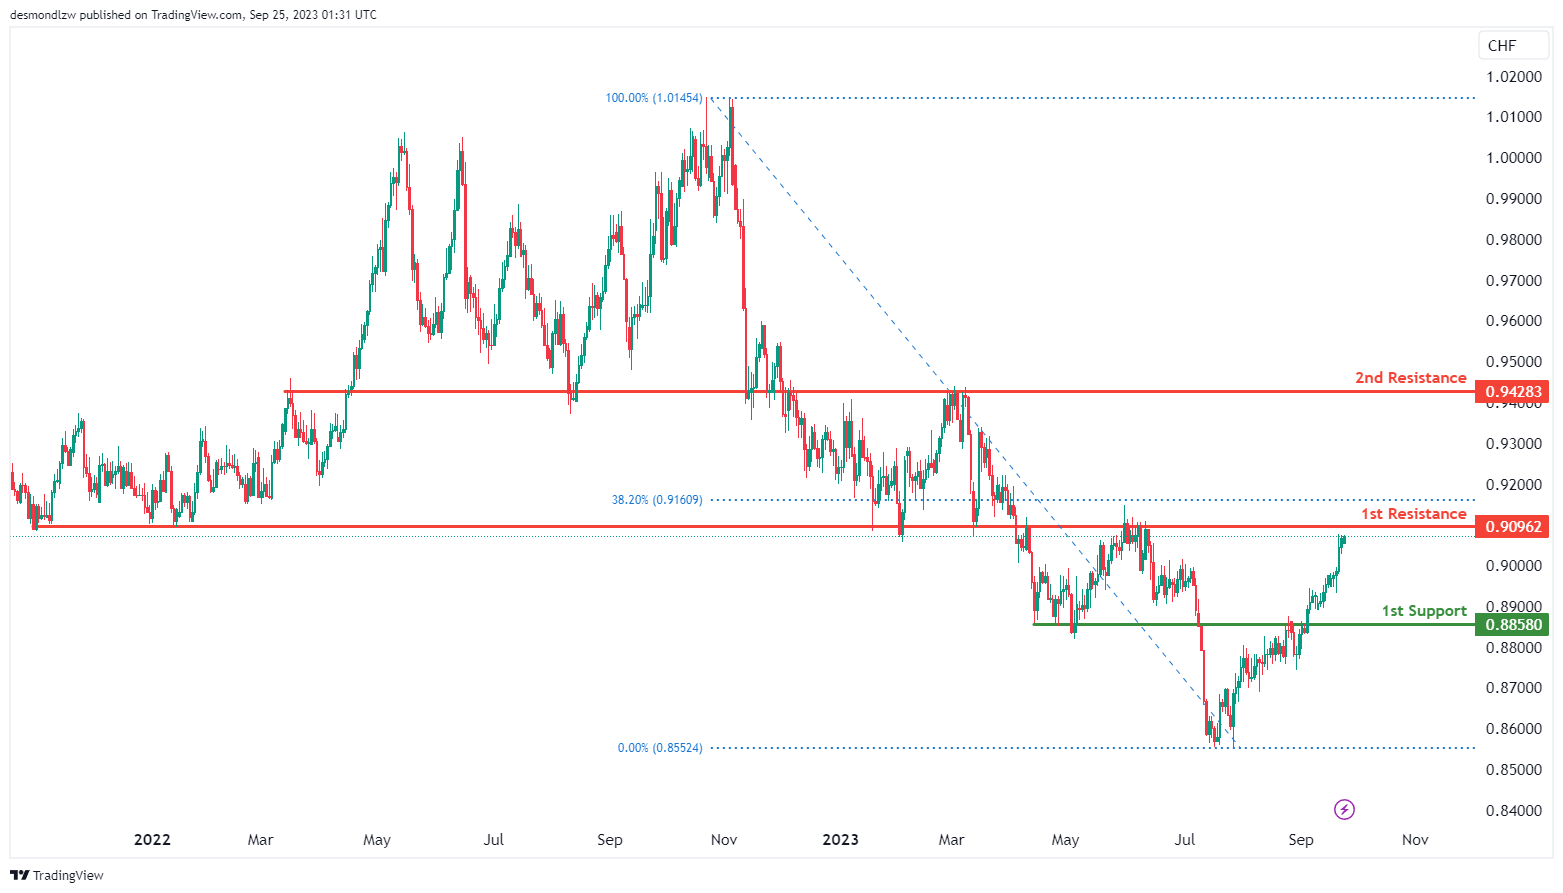
The USD/CHF chart presently indicates a bearish overall momentum. In this context, potential price developments may entail a bearish response upon approaching the 1st resistance level.
The 1st support level at 0.8858 is a crucial support level, characterized as a pullback support. This level could play a significant role in providing support to the price in the event of a bearish move.
On the resistance side, the 1st resistance level at 0.9096 stands out as a notable resistance point. It is marked by the presence of an overlap resistance, which often carries significance in technical analysis. Additionally, this level coincides with the 38.20% Fibonacci Retracement, adding to its potential importance as a barrier to further upward price movement.
Furthermore, the 2nd resistance level at 0.9424 is another noteworthy resistance level, characterized by an overlap resistance.
USD/JPY:
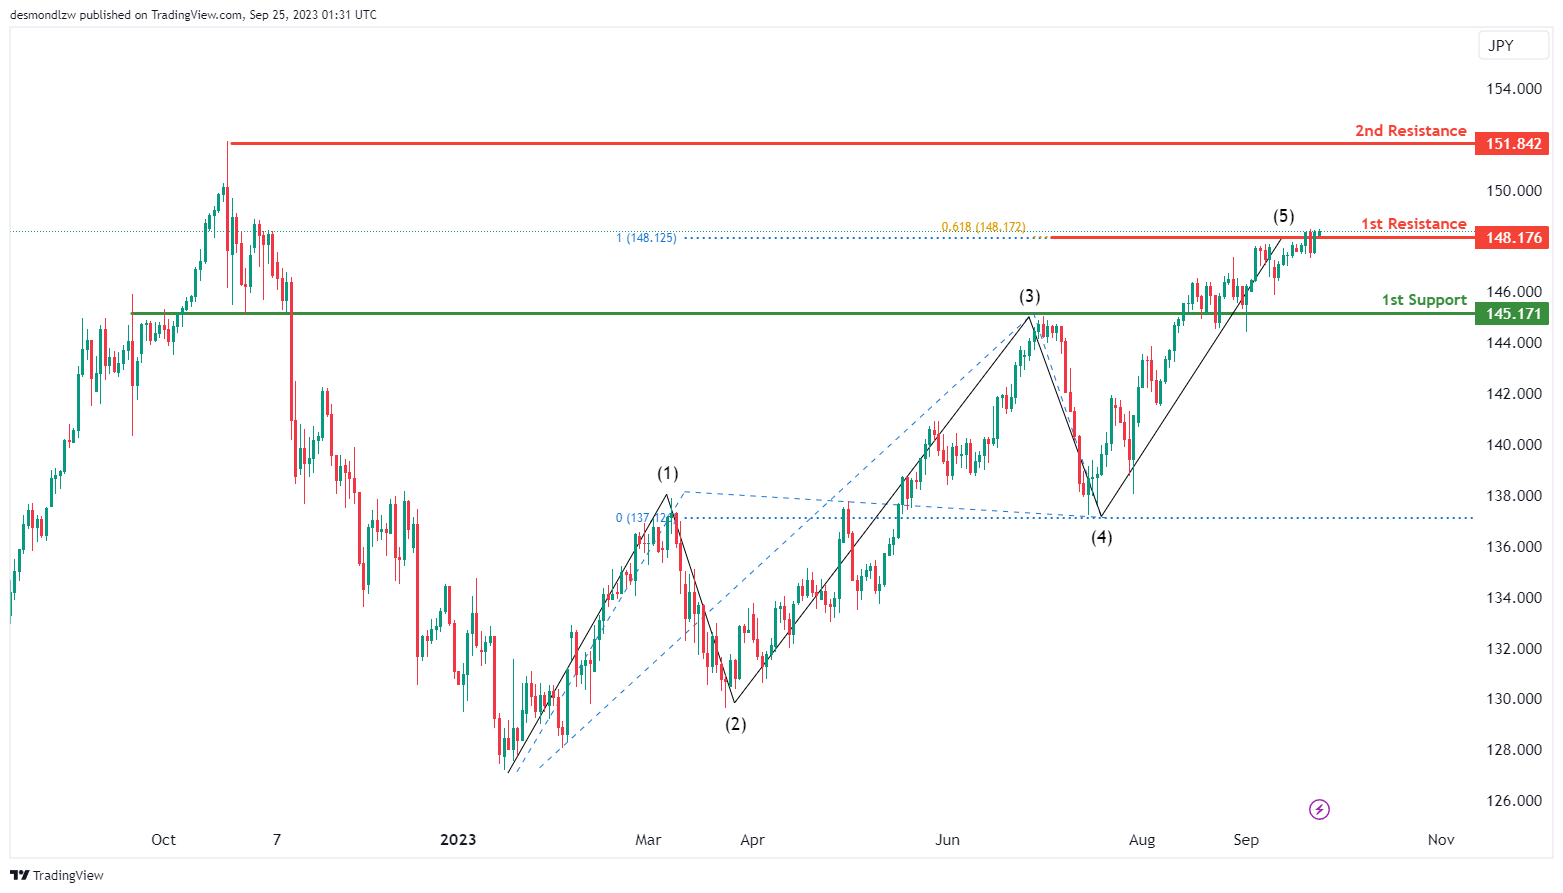
The USD/JPY chart currently reflects a bearish overall momentum. In this bearish scenario, the potential price action suggests a bearish reaction as it approaches the 1st resistance level.
The 1st support level at 145.17 holds significant importance, characterized as an overlap support. This level may play a crucial role in providing support to the price in case of a bearish move.
On the resistance side, the 1st resistance at 148.17 is a notable level to watch. It is marked by the presence of swing high resistance, and it also exhibits a confluence of technical factors, including the 100% Fibonacci Projection and the 61.80% Fibonacci Projection. This suggests that the 148.17 level may act as a strong barrier to further upward price movements.
Additionally, the 2nd resistance level at 151.84 represents another notable resistance point, characterized by swing high resistance.
USD/CAD:
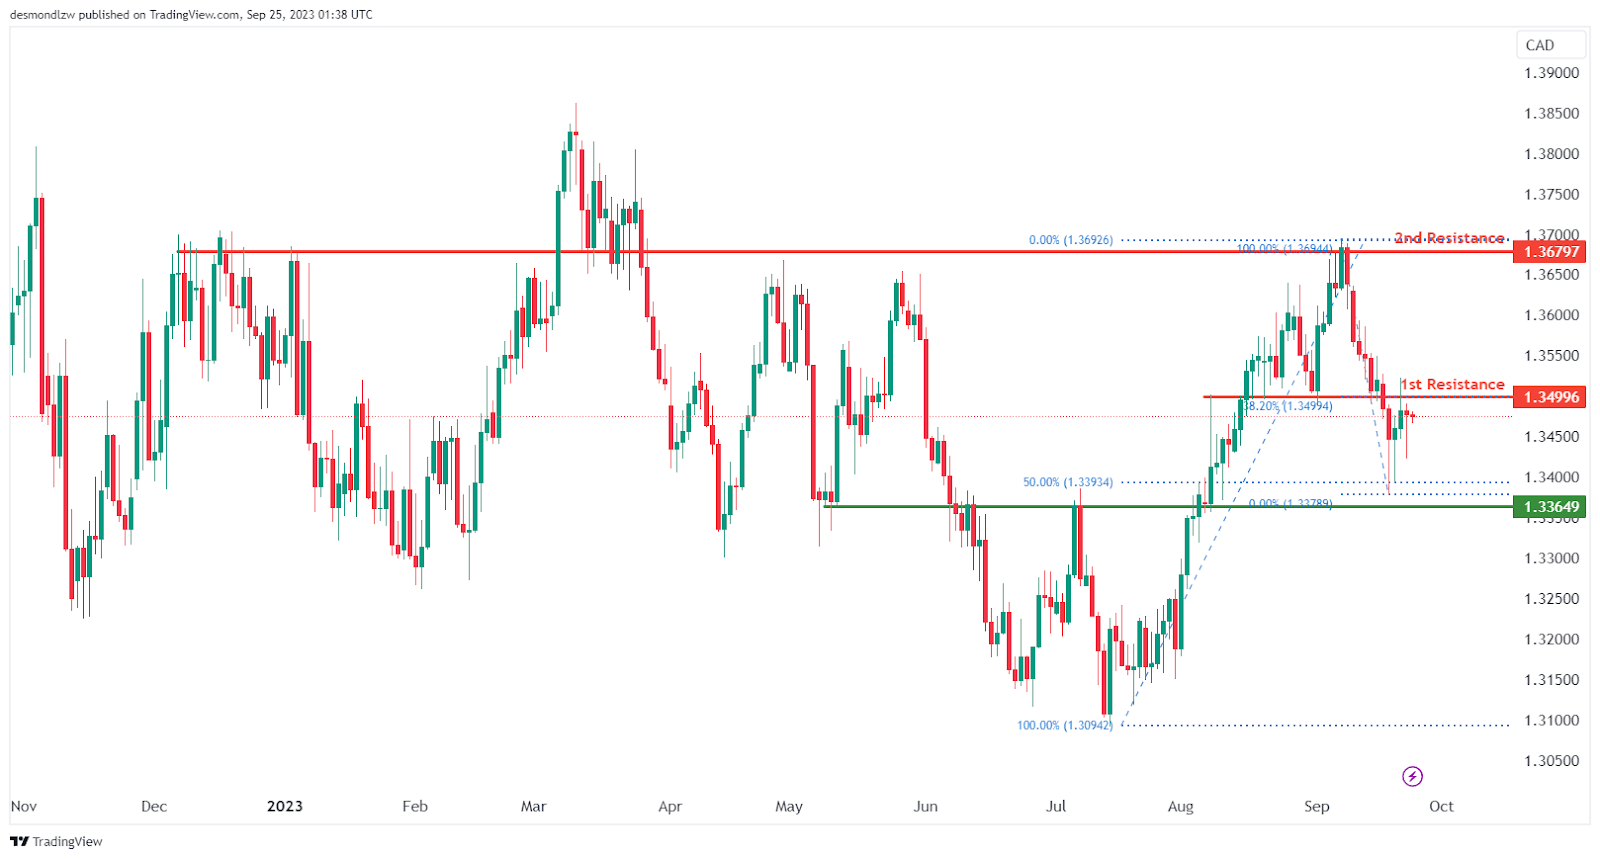
The chart for USD/CAD is currently indicating an overall bearish momentum. In this scenario, there is a potential setup for a bearish reaction off the 1st resistance level and drop towards the 1st support level.
The 1st resistance level at 1.3499 is identified as an overlap resistance that aligns with the 38.20% Fibonacci retracement level. Further up, the 2nd resistance level at 1.3679 is also marked as an overlap resistance level, further indicating its potential significance as a point of resistance.
To the downside, the 1st support level at 1.3365 is identified as an overlap support that coincides with the 50.00% Fibonacci Retracement level, offering a strong level of potential support.
AUD/USD:
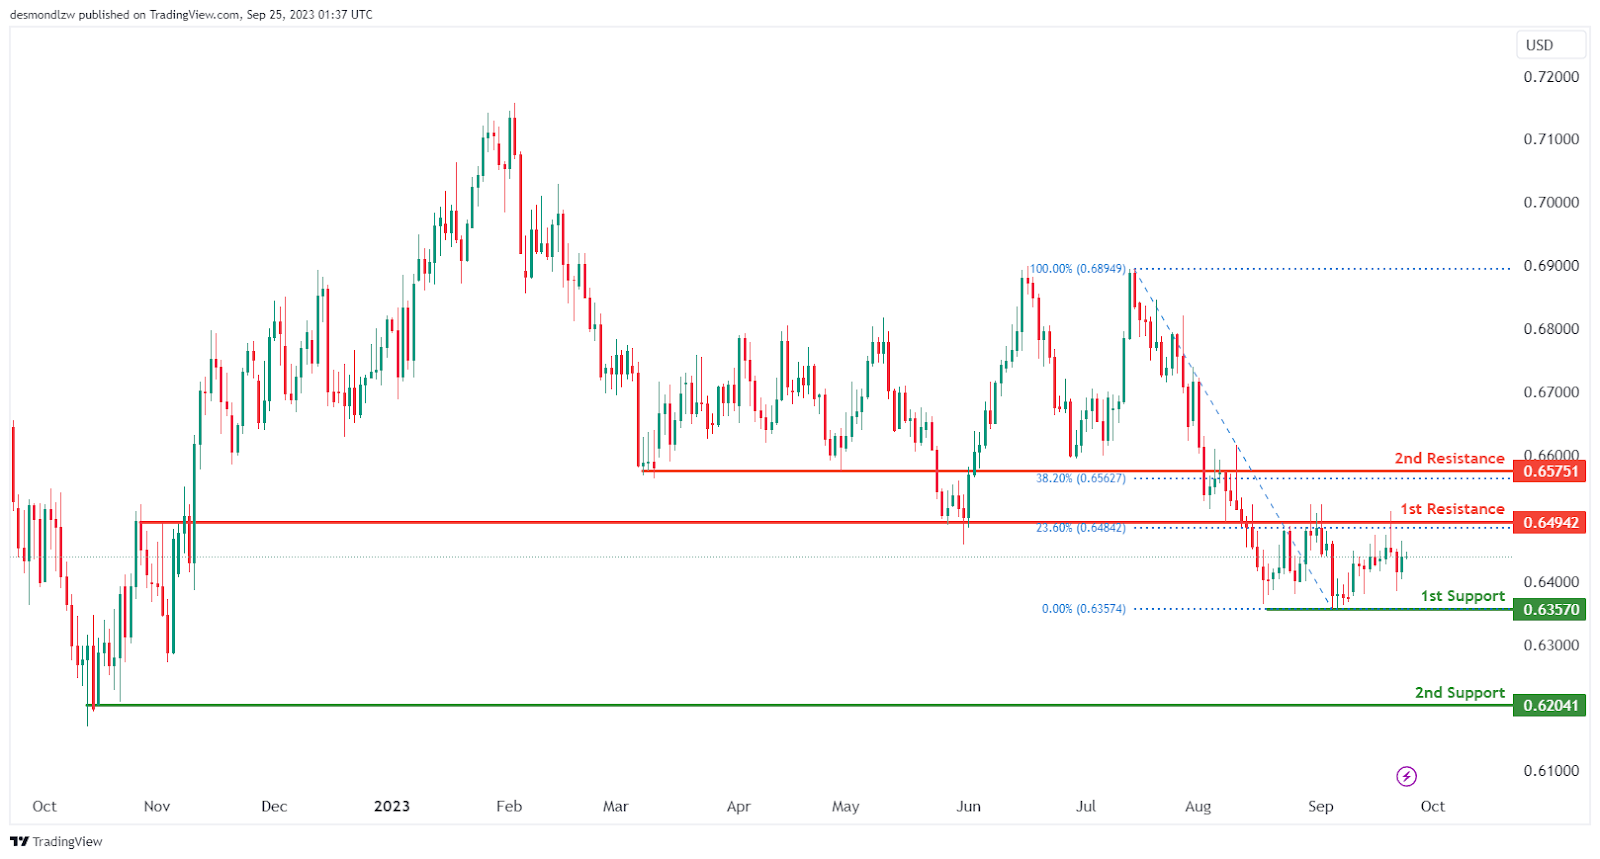
The AUD/USD chart is currently displaying an overall neutral momentum, suggesting that price may range-bound or oscillate between the 1st support and the1st resistance levels.
The 1st support level at 0.6357 is identified as a pullback support while the 2nd support level at 0.6204 is noted as a swing-low support, suggesting a potential strong support level in the past.
To the upside, the 1st resistance level at 0.6494 is identified as an overlap resistance that aligns with the 23.60% Fibonacci retracement level. Further up, the 2nd resistance level at 0.6575 is also marked as an overlap resistance that coincides with the 38.20% Fibonacci retracement level.
NZD/USD
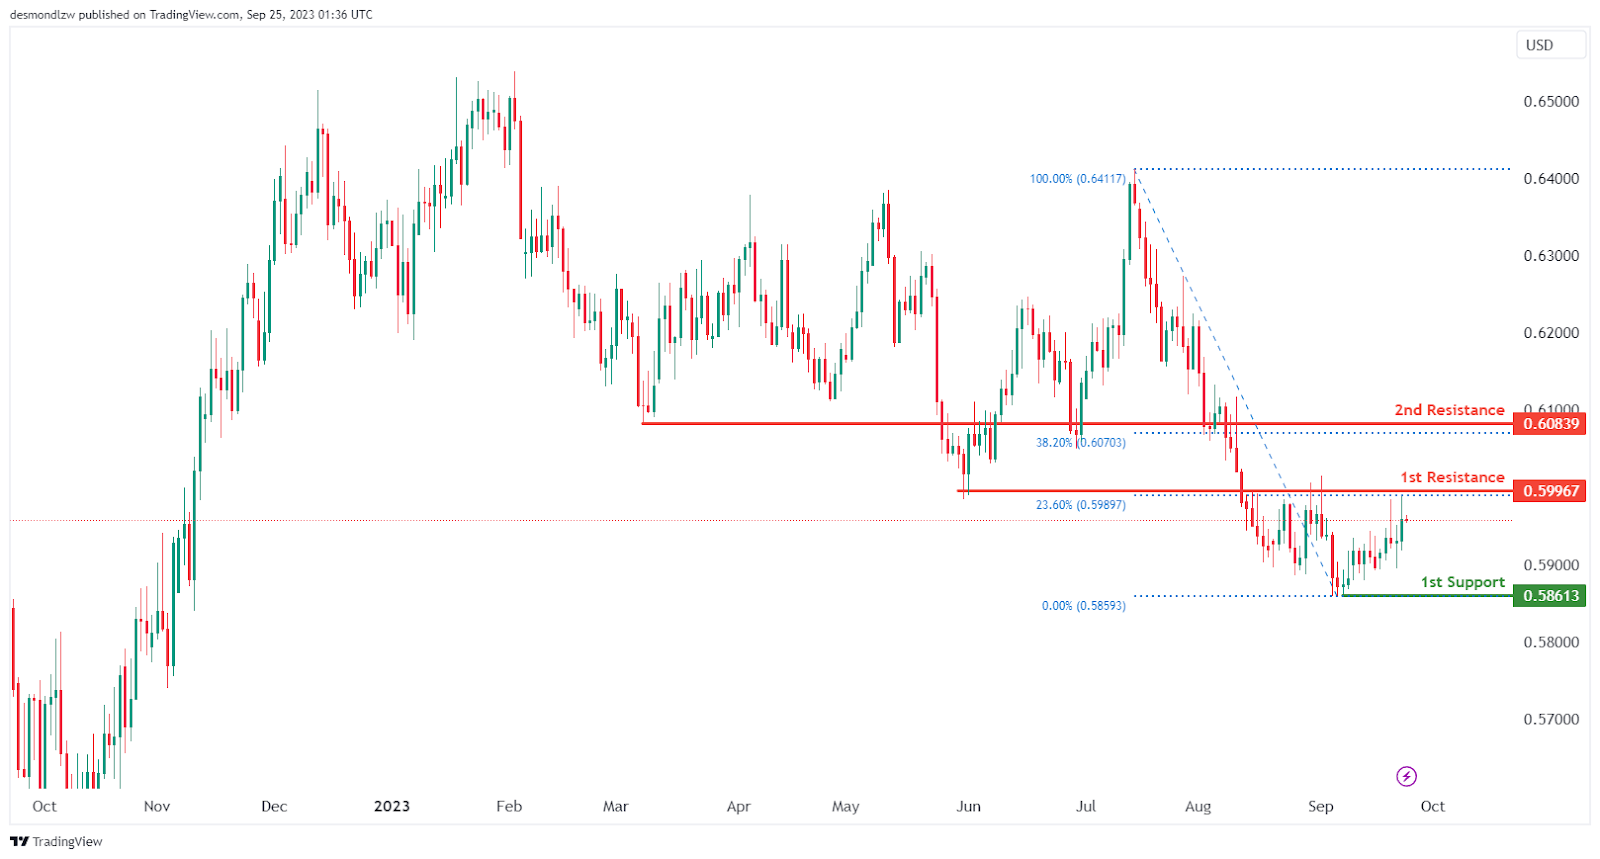
The NZD/USD chart is currently showing an overall neutral momentum, suggesting that the price may consolidate or move within the 1st support and the 1st resistance levels.
The 1st support level at 0.5861 is identified as a pullback support, where price found strong support in early September.
To the upside, the 1st resistance level at 0.5997 is identified as an overlap resistance that aligns with the 23.60% Fibonacci retracement level. Further up, the 2nd resistance level at 0.6084 is also marked as an overlap resistance that coincides with the 38.20% Fibonacci retracement level.
DJ30:
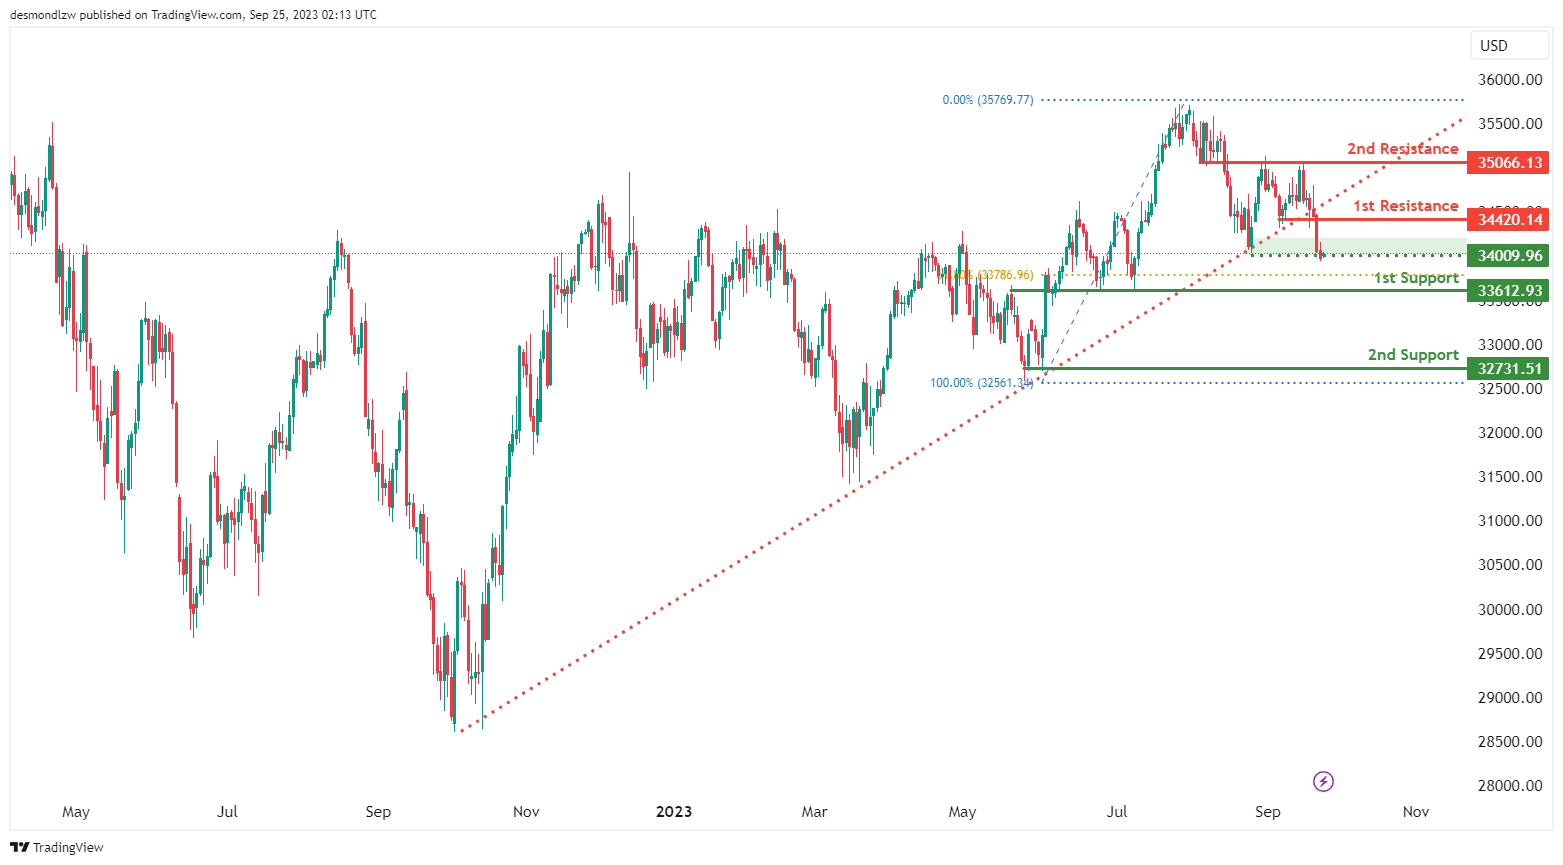
The instrument DJ30 currently exhibits a bearish overall momentum on the chart, and this bearish momentum has been triggered by the price breaking below an ascending support line. There’s potential for a bearish continuation towards the 1st support at 33612.93.
The 1st support at 33612.93 is considered strong due to its nature as an overlap support, and it’s associated with the 61.80% Fibonacci Retracement, indicating a robust level of potential support.
The 2nd support at 32731.51 is also notable as it acts as a multi-swing low support, offering an additional layer of potential support.
On the resistance side, we have the 1st resistance at 34420.14, which is significant because it represents a pullback resistance.
Similarly, the 2nd resistance at 35066.13 is also an overlap resistance, suggesting potential barriers to further bullish movement at these levels.
GER30:
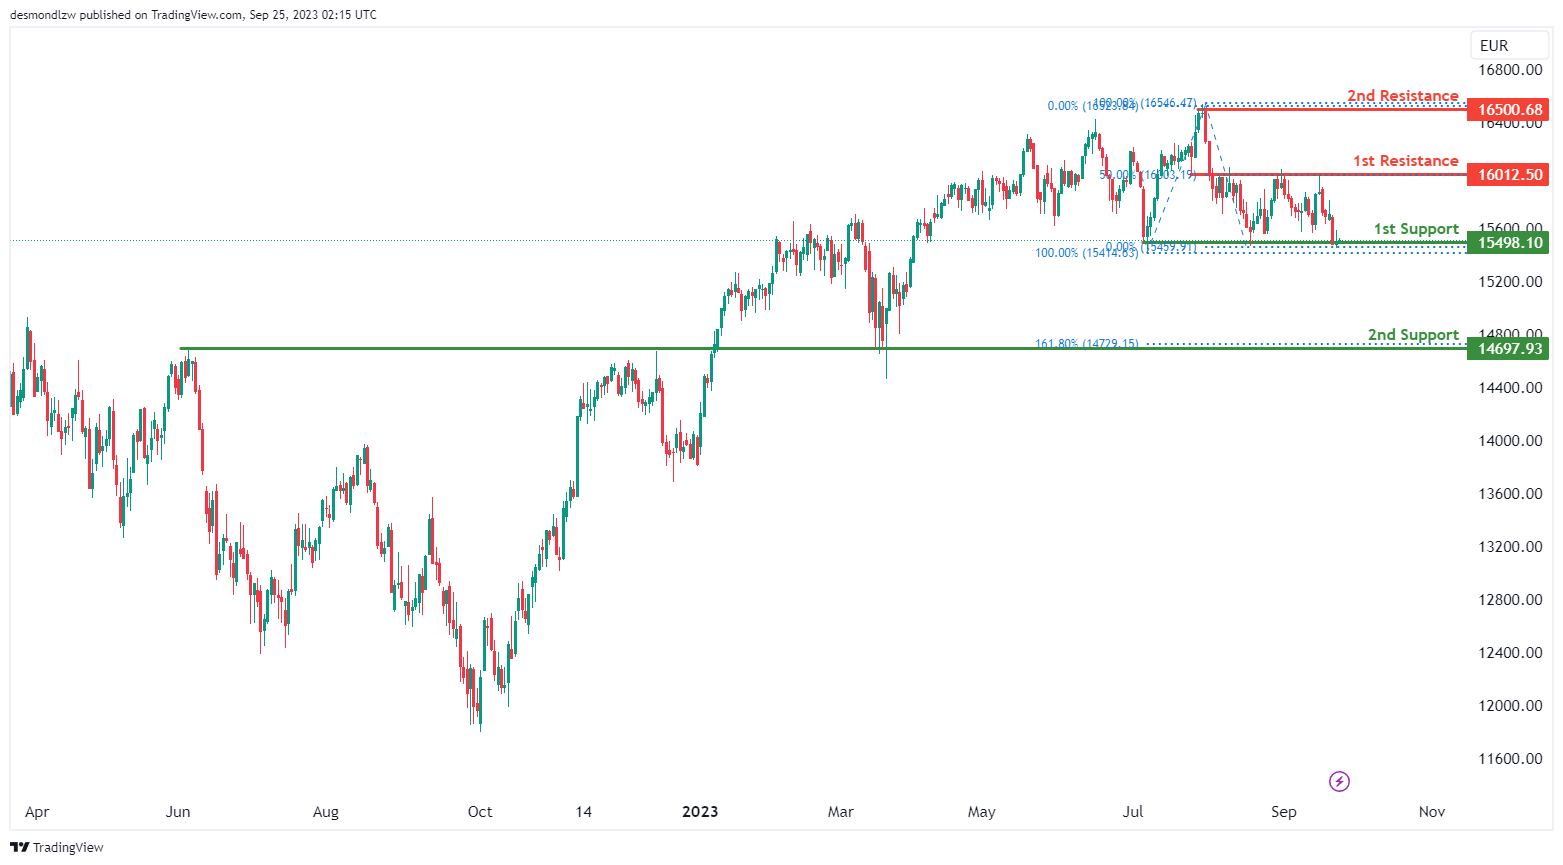
The instrument GER30 currently suggests a bullish overall momentum on the chart. There’s potential for a bullish bounce off the 1st support at 15498.10 and a move towards the 1st resistance.
The 1st support at 15498.10 is considered strong due to its nature as a multi-swing low support.
The 2nd support at 14697.93 is also notable as it acts as an overlap support and is associated with the 161.80% Fibonacci Extension, providing another layer of potential support.
On the resistance side, we have the 1st resistance at 16012.50, which is significant because it represents an overlap resistance and is linked to the 50% Fibonacci Retracement.
Similarly, the 2nd resistance at 16500.68 is noteworthy as it functions as a swing high resistance, suggesting potential barriers to further bullish movement at these levels.
US500
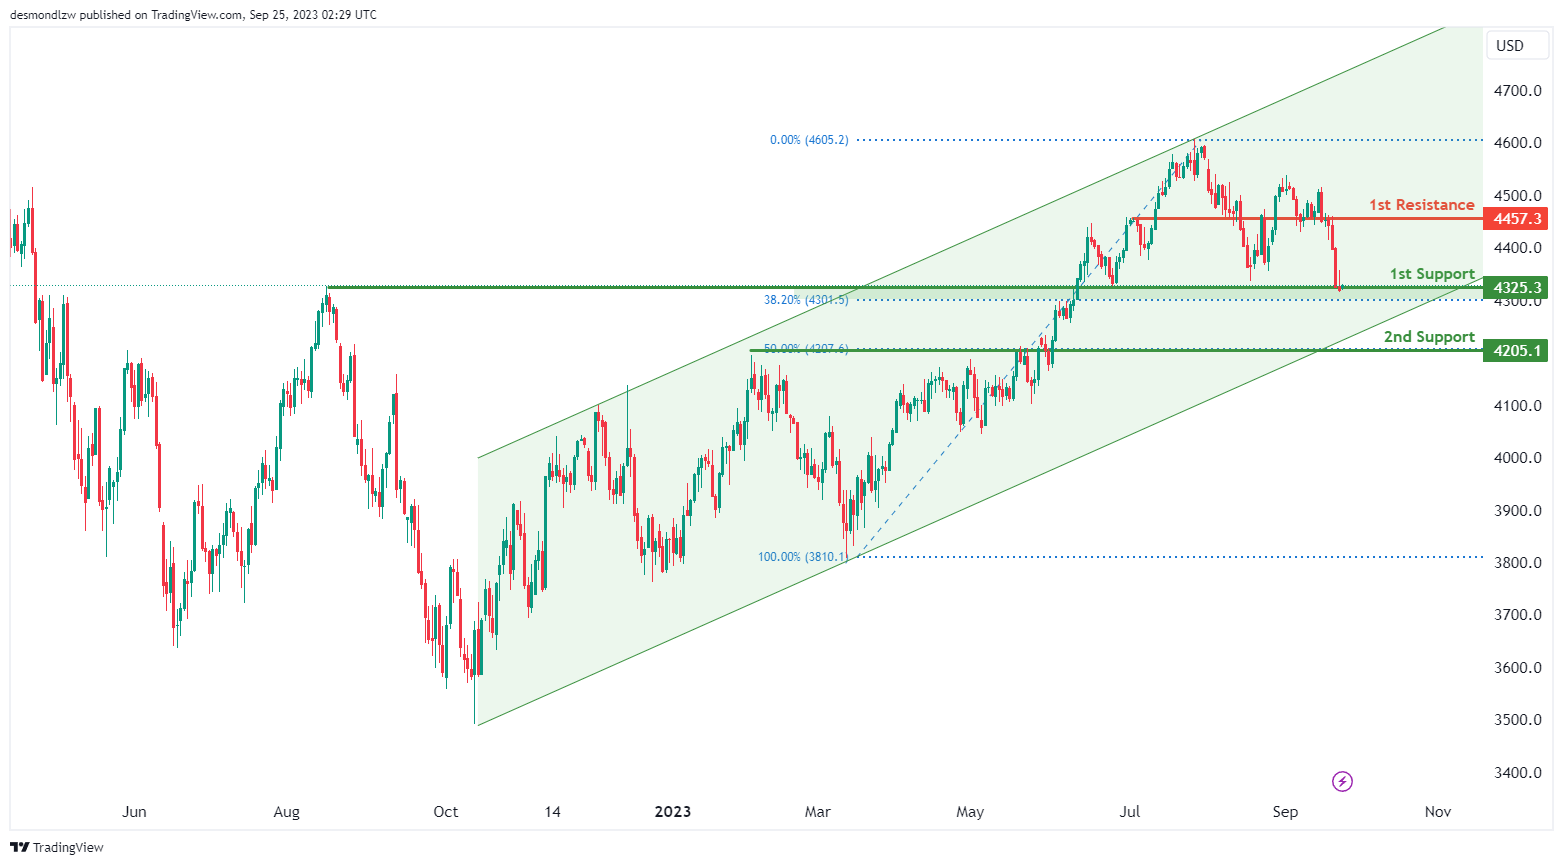
The instrument US500 currently indicates a bullish overall momentum on the chart, and this momentum is supported by the fact that the price is in a bullish ascending channel. There’s potential for a bullish bounce off the 1st support at 4325.3 and a move towards the 1st resistance.
The 1st support at 4325.3 is considered strong due to its nature as an overlap support and its association with the 38.20% Fibonacci Retracement.
The 2nd support at 4205.1 is also notable as it acts as a pullback support and is associated with the 50% Fibonacci Retracement, providing an additional layer of potential support.
On the resistance side, we have the 1st resistance at 4457.3, which is significant because it represents a pullback resistance, suggesting a potential barrier to further bullish movement at this level.
BTC/USD:
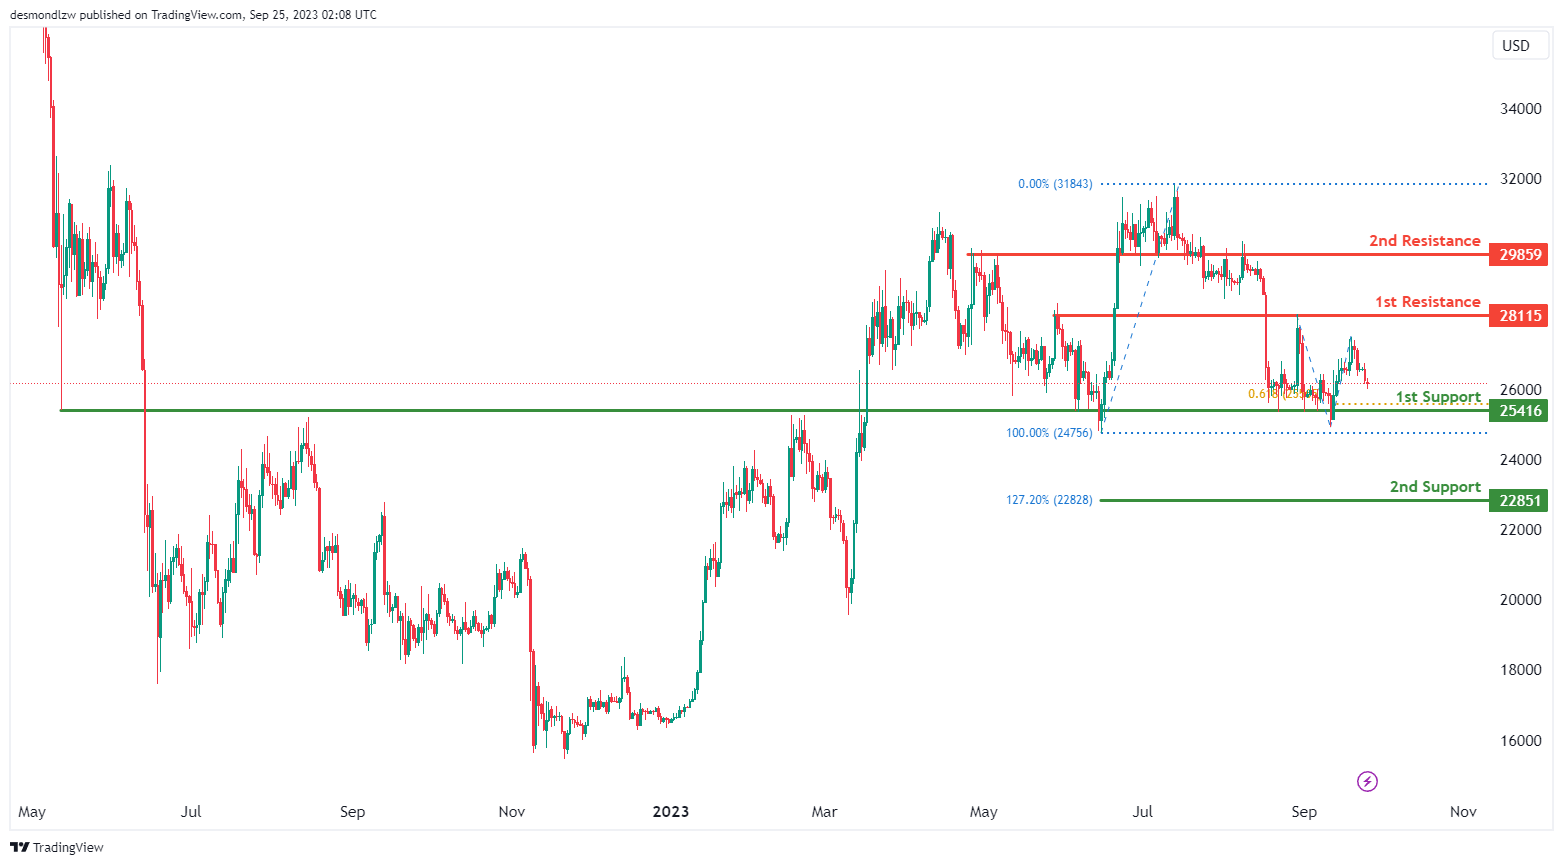
The instrument BTC/USD currently has a bearish overall momentum on the chart, and factors contributing to this bearish momentum include the potential for a bearish continuation towards the 1st support at 25416.
The 1st support at 25416 is considered strong due to its nature as an overlap support and its association with the 61.80% Fibonacci Projection, indicating a solid level of potential support.
The 2nd support at 22851 is also noteworthy as it is associated with the 127.20% Fibonacci Extension, providing another layer of potential support.
On the resistance side, we have the 1st resistance at 28115, which is significant because it represents an overlap resistance.
Similarly, the 2nd resistance at 29859 is also an overlap resistance, suggesting potential barriers to further bullish movement at these levels.
ETH/USD:
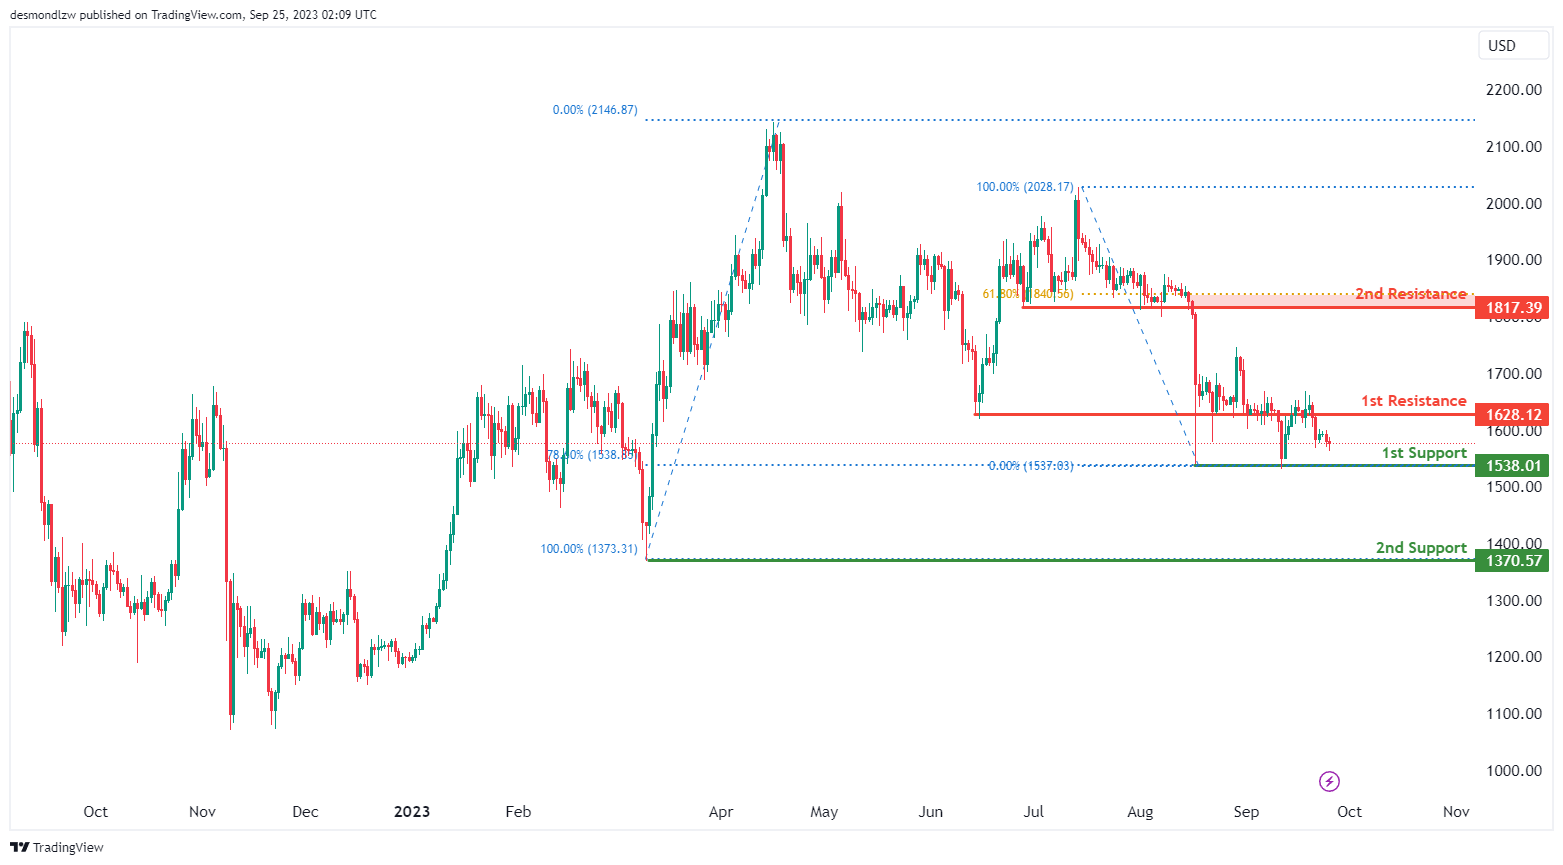
The instrument ETH/USD currently exhibits a bearish overall momentum on the chart, and there’s potential for a bearish continuation towards the 1st support at 1538.01.
The 1st support at 1538.01 is considered strong due to its nature as a multi-swing low support, and it’s associated with the 78.60% Fibonacci Retracement, indicating a robust level of potential support.
The 2nd support at 1370.57 is also notable as it acts as a swing low support, offering an additional layer of potential support.
On the resistance side, we have the 1st resistance at 1628.12, which is significant because it represents an overlap resistance.
Meanwhile, the 2nd resistance at 1817.39 is noteworthy as it functions as a pullback resistance and is associated with the 61.80% Fibonacci Retracement, suggesting potential barriers to further bullish movement at this level.
WTI/USD:
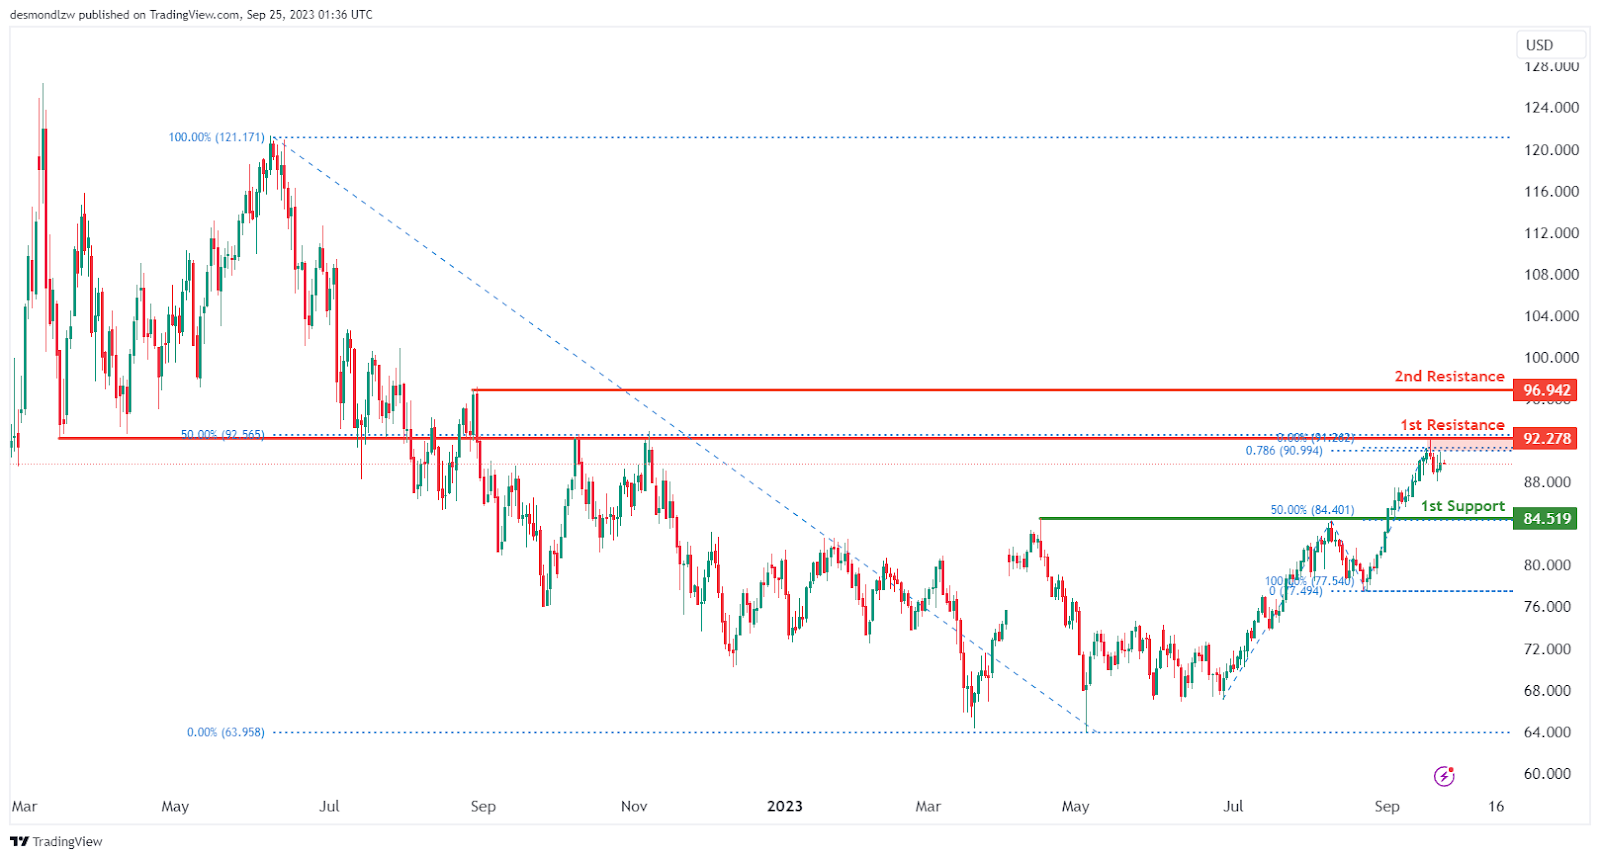
The WTI (West Texas Intermediate) chart currently exhibits a weak bearish momentum with low confidence with price potentially making a bearish reaction off the 1st resistance level.
The 1st resistance level at 92.28 is identified as an overlap resistance that aligns with the 78.60% Fibonacci projection level while the 2nd resistance level at 96.94 is marked as a pullback resistance; this level may act as a significant barrier to any potential upward movements.
To the downside, the 1st support level at 84.52 is identified as a pullback support that coincides with the 50.0% Fibonacci retracement level, a level where price could potentially find strong support.
XAU/USD (GOLD):
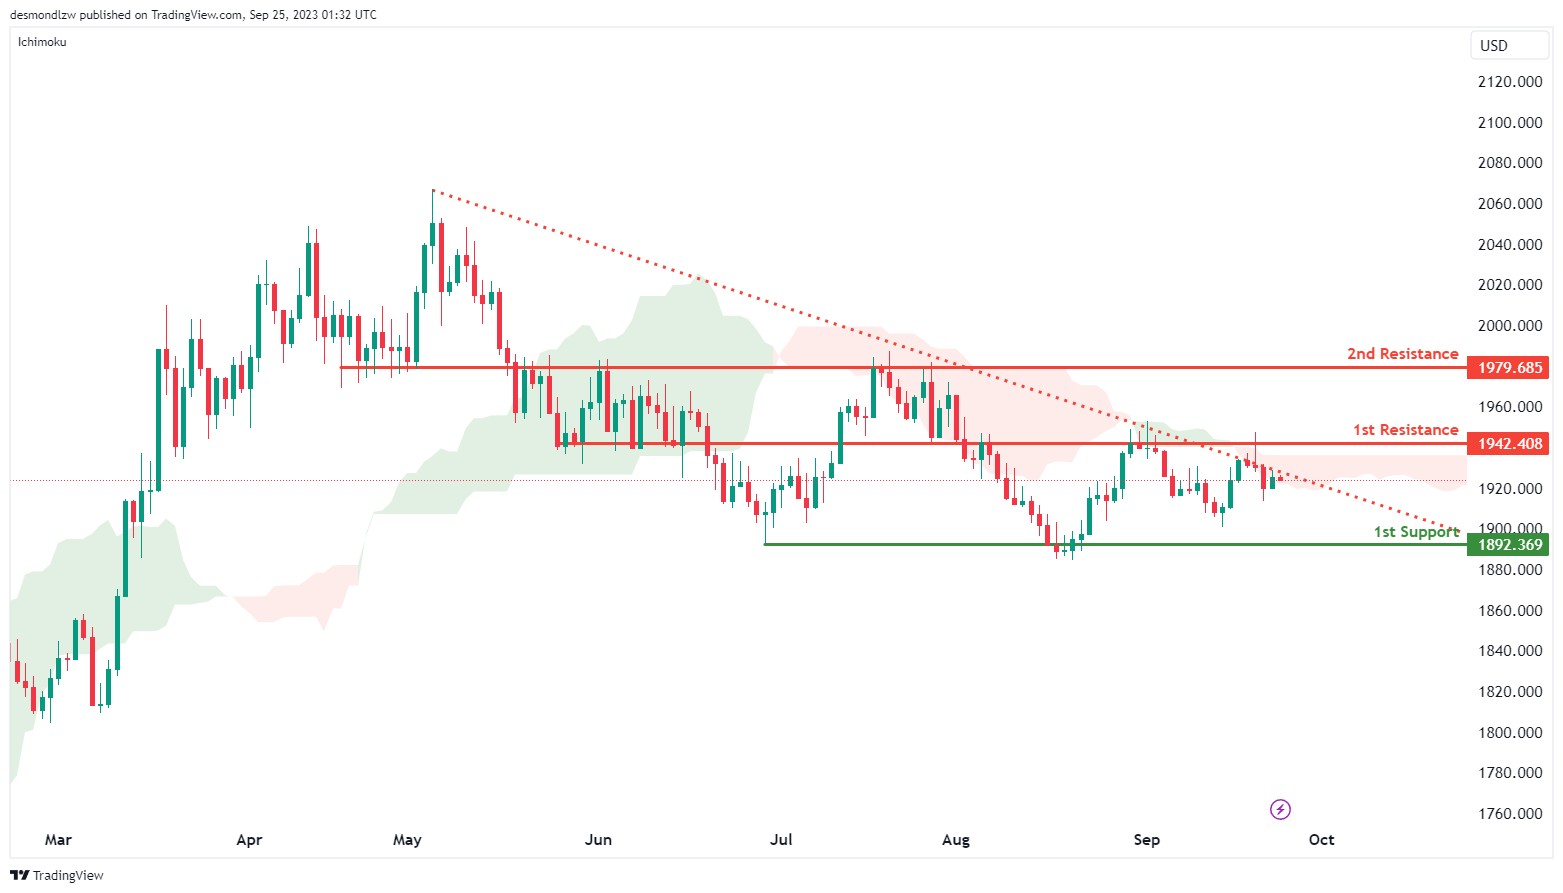
The XAU/USD chart is currently showing a bearish overall momentum. This bearish sentiment is influenced by the fact that the price is below the bearish Ichimoku cloud and is also trading beneath a major descending trend line, indicating a prevailing bearish trend.
Looking ahead, there is a potential scenario where the price could experience a short-term rise towards the 1st resistance level before eventually reversing and moving towards the 1st support.
The 1st support level at 1892.36 is significant and can be described as an overlap support. It is an important level to watch for potential bullish reversals or increased buying interest.
On the resistance side, the 1st resistance at 1942.40 is noteworthy due to its characterization as an overlap resistance. This level may act as a barrier to further price increases.
Additionally, the 2nd resistance at 1979.68 is another notable resistance level, also marked as an overlap resistance.
AUD/USD Daily Report
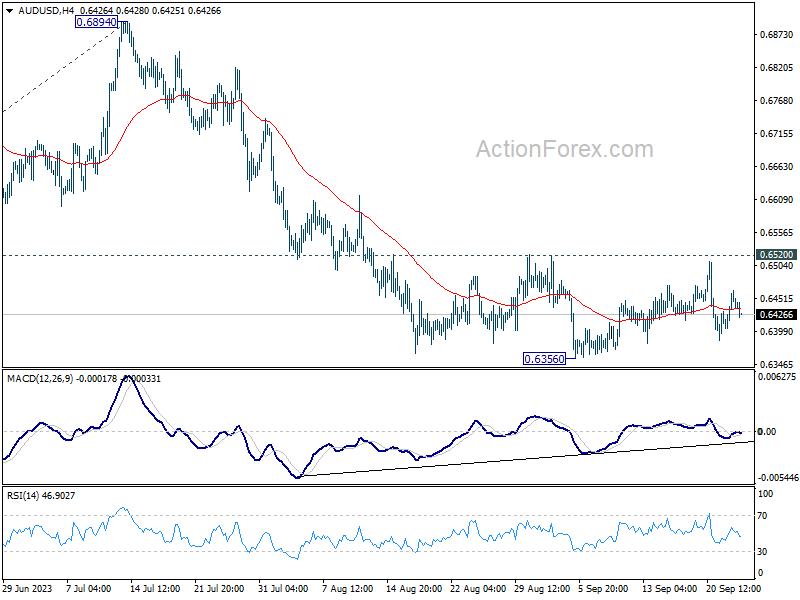
Daily Pivots: (S1) 0.6408; (P) 0.6437; (R1) 0.6469; More...
AUD/USD is staying in consolidation from 0.6356 and outlook is unchanged. Intraday bias remains neutral at this point. Further decline is expected as long as 0.6520 resistance holds. Break of 0.6356 will resume larger down trend to 100% projection of 0.7156 to 0.6457 from 0.6894 at 0.6195.
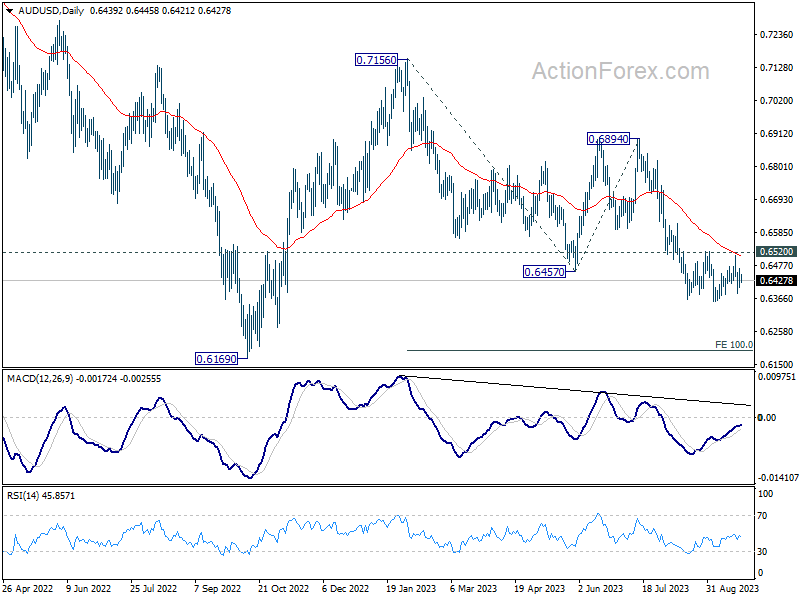
In the bigger picture, down trend from 0.8006 (2021 high) is possibly still in progress. Decisive break of 0.6169 will target 61.8% projection of 0.8006 to 0.6169 to 0.7156 at 0.6021. This will now remain the favored case as long as 0.6894, in case of strong rebound.
Aussie Dips as Evergrande Concerns Resurface; More Global Inflation Data Ahead
Asian stock markets commenced the week with divergent performances. While Japan's Nikkei showed resilience, bouncing back after enduring its most challenging week this year, Hong Kong's stocks weren't as fortunate. The uncertainty surrounding China Evergrande Group's protracted debt restructuring initiative ignited a fresh wave of selling, impacting not just Evergrande but also its contemporaries. Consequently, apprehensions around the beleaguered property sector have once again come to the fore.
In the currency markets, mixed market sentiments have cast a shadow Australian and New Zealand Dollar, making them a tad softer. Swiss Franc seems eager to further its selloff from last week. Meanwhile, both Dollar and Euro, along with Canadian Dollar, show signs of firmness. British Pound is making an attempt at a comeback, but the momentum remains tepid. Meanwhile, the Yen is leaning on the softer end of the spectrum. As the week progresses, eyes will be keenly set on inflation data releases from Australia, Eurozone, and US, potentially guiding the subsequent moves in currency markets.
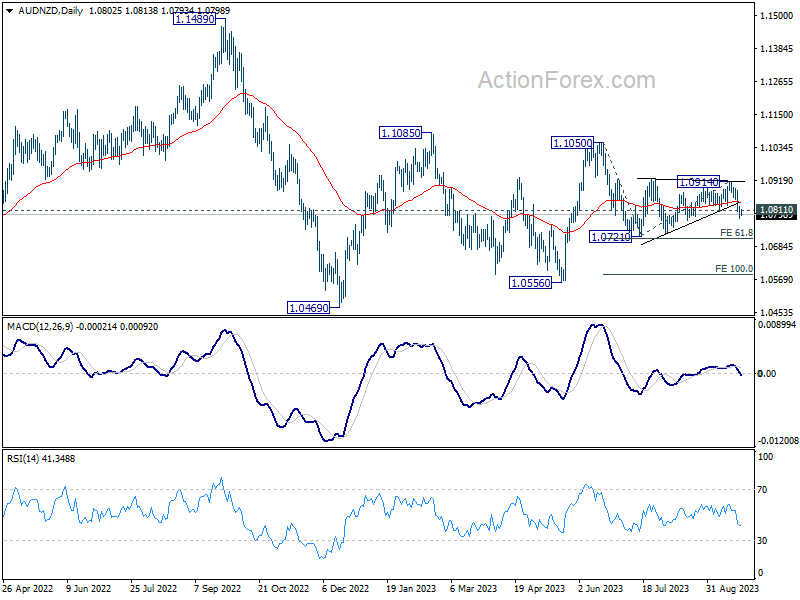
On the technical front, AUD/NZD's break of 1.0811 support last week argues that the consolidation pattern from 1.0721 has completed at 1.0914. That is fall from 1.1050 is ready to resume. Near term risk will stay on the downside as long as 55 D EMA (now at 1.0839) holds. Next target is 61.8% projection of 1.1050 to 1.0721 from 1.0914 at 1.0711.
In Asia, at the time of writing, Nikkei is up 0.84%. Hong Kong HSI is down -1.24%. China Shanghai SSE is down -0.39% Singapore Strait Times is up 0.22%. Japan 10-year JGB yield is down -0.0142 at 0.735.
ECB's Villeroy: Patience is more important now
ECB Governing Council member Francois Villeroy de Galhau spoke about the current monetary policy outlook in an interview with France Inter radio on Saturday. Emphasizing the need for a patient approach, Villeroy stated, "From today's perspective, patience is more important than raising rates further."
He highlighted the current deposit rate, which stands at a record 4%. According to Villeroy, this level should be held steady as it plays a crucial role in controlling inflation within Eurozone.
Amid concerns over the potential inflationary impact of rising oil prices on the global economy, Villeroy remained steadfast in the ECB's commitment to its objectives.
"The recent increase in oil prices won't derail the European Central Bank's fight to tame inflation," he asserted. Elaborating further on this, he said, "We're very attentive, but [this] doesn't put into doubt the underlying disinflation."
Villeroy reiterated ECB's target: "Our outlook and engagement is to bring inflation to around 2% in 2025."
Oil's ascension pauses as momentum exhausted, but 100 still a possibility
The financial world was abuzz last week with discussions of oil potentially breaking the 100 mark. While some pundits deem this as a stretch, the consensus is that no one can entirely dismiss the possibility.
The recent spike in oil prices brings with it a myriad of concerns, particularly about its ripple effect on the broader economy. As central banks globally grapple to suppress rising inflation, the surge in energy costs, with gasoline taking the lead, is becoming a pressing issue. Notably, August's inflation readings surpassed expectations in several countries, with energy prices being the main instigator.
Tracing back to late June, energy prices have witnessed a consistent rise. This surge can be attributed to crude output reductions by major oil producers in OPEC+, coupled with additional cuts from Saudi Arabia. These decisions have propelled crude futures by approximately 30% over the past quarter.
With the possibility of OPEC+ announcing another surprise cut, bullish momentum could very well drive oil prices beyond 100. Contrarily, some anticipate that if prices climb above 95 per barrel, there might be a significant dip in demand, causing oil price to recalibrate and settle within a more balanced range.
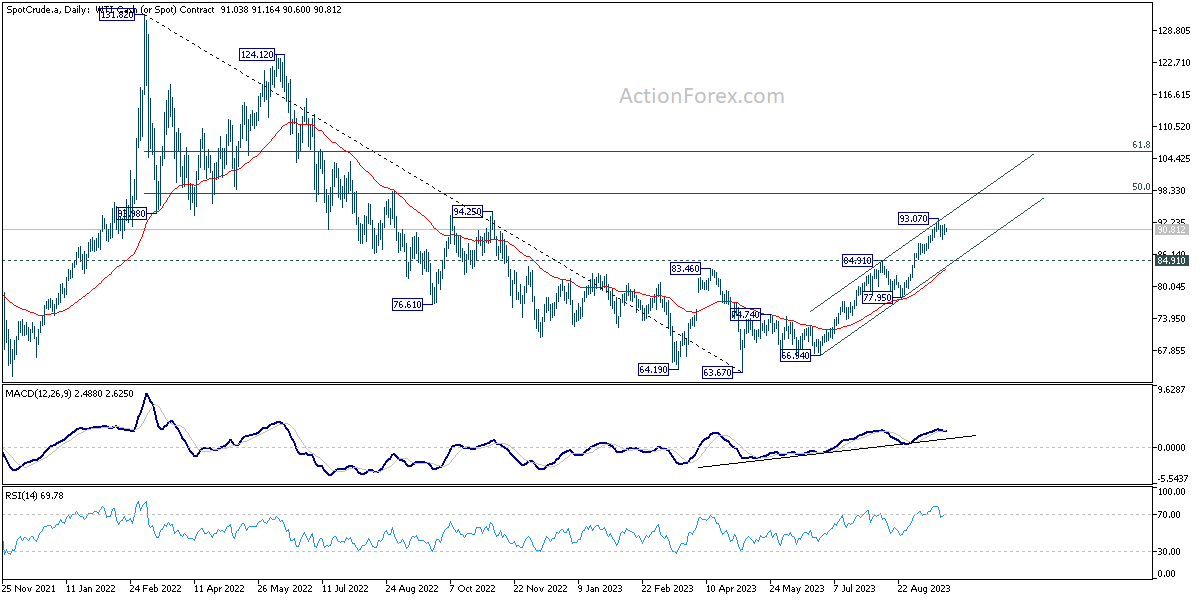
From a technical perspective, WTI crude seems to have hit a near-term ceiling at 93.07 last week. Given that D MACD has already slid beneath the signal line, the prevailing bullish momentum may have been exhausted for the near term.
Nevertheless, decisive drop below 84.91 resistance turned support is essential to counteract the uptrend that began at 66.94. If this doesn't materialize, the prospects of a continued rally remain. Break of 93.07 will put key resistance level at 50% retracement of 131.82 to 63.67 at 97.74 into focus.
Inflation data to stay in the global spotlight
Inflation continues to be the talk of global markets, as expectations and actual data often seem to dance around each other. Upcoming data from Australia, Eurozone, and US are poised to play a pivotal role in the evolving narrative.
Australia's upcoming monthly CPI is projected to ascend from 4.9% yoy to 5.2% yoy in August. While this monthly figure doesn't encompass the full spectrum of the CPI - given that a significant chunk of the data is disseminated quarterly - it does offer vital cues for market players to recalibrate their anticipations. Present consensus leans toward RBA maintaining its current policy in October, especially as Q3 figures will remain undisclosed. The November decision, however, remains contentious. A Bloomberg poll depicts a divide among experts, with 18 forecasting another hike by the year's end and 17 foreseeing the status quo.
Moving to Europe, Eurozone's CPI flash is anticipated to register a deceleration, coming in at 4.5% yoy in September, a dip from the previous 5.2%. Core CPI might also reflect a decline from 5.3% yoy to 4.8%. Following ECB recent 25bps rate increase, the bank is inclined toward a sustained pause. Philip Lane, the bank's Chief Economist, underscored the adequacy of the current 4% deposit rate to realign inflation with 2% target within the projection horizon. This week's figures could fortify this perspective.
Across the Atlantic, US core PCE inflation is projected to taper off to 3.9% yoy in August from the previous 4.2% yoy. Despite market skepticism, Fed's recent communiqué underscored the possibility of another rate hike this year. With the subsequent FOMC meet slated for November 1, a slew of pertinent data remains to be assessed prior to policy determinations.
In addition to the above, markets will be tuned into several other key indicators this week, including US durable goods orders and consumer confidence, Germany's Ifo business climate, Canada's GDP, and Australia's retail sales.
Here are some highlights for the week:
- Monday: Germany Ifo business climate.
- Tuesday: Japan corporate service prices; US house prices, new homes sales, consumer confidence.
- Wednesday: BoJ minutes; Australia CPI; Germany Gfk consumer sentiment; Eurozone M3; US durable goods orders.
- Thursday: New Zealand ANZ business confidence; Australia retail sales; Germany CPI flash; ECB bulletin; US Q2 GDP final, jobless claims, pending home sales.
- Friday: Japan Tokyo CPI, unemployment rate, industrial production, retail sales, consumer confidence, housing starts; Germany import prices, retail sales, unemployment; UK Q2 GDP final, M4 money supply, mortgage supply; France consumer spending; Swiss KOF economic barometer; Eurozone CPI flash; Canada GDP; US goods trade balance, personal income and spending, PCE inflation; Chicago PMI.
AUD/USD Daily Report
Daily Pivots: (S1) 0.6408; (P) 0.6437; (R1) 0.6469; More...
AUD/USD is staying in consolidation from 0.6356 and outlook is unchanged. Intraday bias remains neutral at this point. Further decline is expected as long as 0.6520 resistance holds. Break of 0.6356 will resume larger down trend to 100% projection of 0.7156 to 0.6457 from 0.6894 at 0.6195.
In the bigger picture, down trend from 0.8006 (2021 high) is possibly still in progress. Decisive break of 0.6169 will target 61.8% projection of 0.8006 to 0.6169 to 0.7156 at 0.6021. This will now remain the favored case as long as 0.6894, in case of strong rebound.
Economic Indicators Update
| GMT | Ccy | Events | Actual | Forecast | Previous | Revised |
|---|---|---|---|---|---|---|
| 08:00 | EUR | Germany IFO Business Climate Sep | 85.2 | 85.7 | ||
| 08:00 | EUR | Germany IFO Current Assessment Sep | 88.0 | 89.0 | ||
| 08:00 | EUR | Germany IFO Expectations Sep | 82.8 | 82.6 |
Oil’s ascension pauses as momentum exhausted, but 100 still a possibility
The financial world was abuzz last week with discussions of oil potentially breaking the 100 mark. While some pundits deem this as a stretch, the consensus is that no one can entirely dismiss the possibility.
The recent spike in oil prices brings with it a myriad of concerns, particularly about its ripple effect on the broader economy. As central banks globally grapple to suppress rising inflation, the surge in energy costs, with gasoline taking the lead, is becoming a pressing issue. Notably, August's inflation readings surpassed expectations in several countries, with energy prices being the main instigator.
Tracing back to late June, energy prices have witnessed a consistent rise. This surge can be attributed to crude output reductions by major oil producers in OPEC+, coupled with additional cuts from Saudi Arabia. These decisions have propelled crude futures by approximately 30% over the past quarter.
With the possibility of OPEC+ announcing another surprise cut, bullish momentum could very well drive oil prices beyond 100. Contrarily, some anticipate that if prices climb above 95 per barrel, there might be a significant dip in demand, causing oil price to recalibrate and settle within a more balanced range.
From a technical perspective, WTI crude seems to have hit a near-term ceiling at 93.07 last week. Given that D MACD has already slid beneath the signal line, the prevailing bullish momentum may have been exhausted for the near term.
Nevertheless, decisive drop below 84.91 resistance turned support is essential to counteract the uptrend that began at 66.94. If this doesn't materialize, the prospects of a continued rally remain. Break of 93.07 will put key resistance level at 50% retracement of 131.82 to 63.67 at 97.74 into focus.
EUR/USD At Risk of Drop Toward 1.0550
Key Highlights
- EUR/USD extended losses and traded below 1.0650.
- A key bearish trend line is forming with resistance near 1.0700 on the 4-hour chart.
- GBP/USD is diving and trading below the 1.2350 level.
- USD/JPY is eyeing more gains above the 148.50 level.
EUR/USD Technical Analysis
The Euro started a fresh decline after it failed to clear 1.0750 against the US Dollar. EUR/USD dropped below 1.0700 and 1.0650 to move further into a bearish zone.
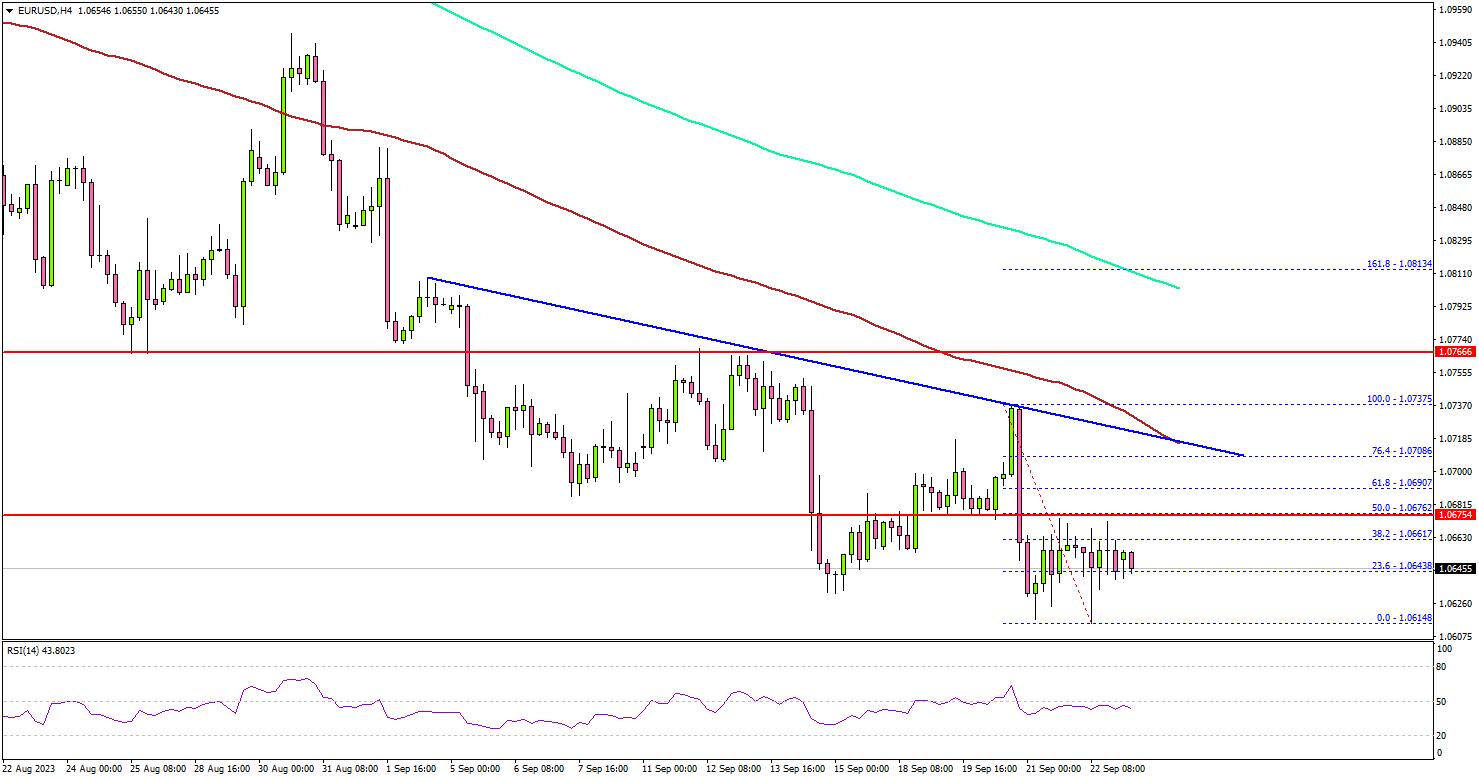
Looking at the 4-hour chart, the pair settled below the 1.0700 level, the 100 simple moving average (red, 4 hours), and the 200 simple moving average (green, 4 hours).
A new multi-week low was formed near 1.0614 and the pair is now consolidating losses. It is now facing resistance near the 1.0675 level. It is close to the 50% Fib retracement level of the recent decline from the 1.0737 swing high to the 1.0614 low.
The next major resistance is near the 1.0700 zone. There is also a key bearish trend line forming with resistance near 1.0700 on the same chart.
A close above 1.0700 could start a steady increase toward 1.0750. Any more gains might send EUR/USD toward the 1.0820 resistance. On the downside, initial support is near the 1.0610 level. The next key support is seen near the 1.0550 level, below which it could test 1.0500.
If there is a move below 1.0500, the pair could dive toward 1.0440. Any more losses might send the pair toward the 1.0350 level.
Looking at GBP/USD, there were strong bearish moves and the pair even declined below the 1.2350 support zone.
Economic Releases
- German IFO Business Climate Index for Sep 2023 – Forecast 85.2, versus 85.7 previous.
- German IFO Current Assessment Index for Sep 2023 - Forecast 88.0, versus 89.0 previous.
- German IFO Expectations Index for Sep 2023 – Forecast 82.8, versus 82.6 previous.