Sample Category Title
GBP/JPY Technical: At the Risk of Multi-Week Bearish Mean Reversion
- The current major uptrend phase of GBP/JPY has almost reached a key inflection/resistance level of 187.30.
- The weekly RSI momentum indicator has flashed out bearish conditions that advocate a potential multi-week bearish mean reversion/counter-trend movement.
- 50 is the key short-term resistance to watch with intermediate supports coming in at 180.60 and 179.20.
Bulls may have hit a major roadblock
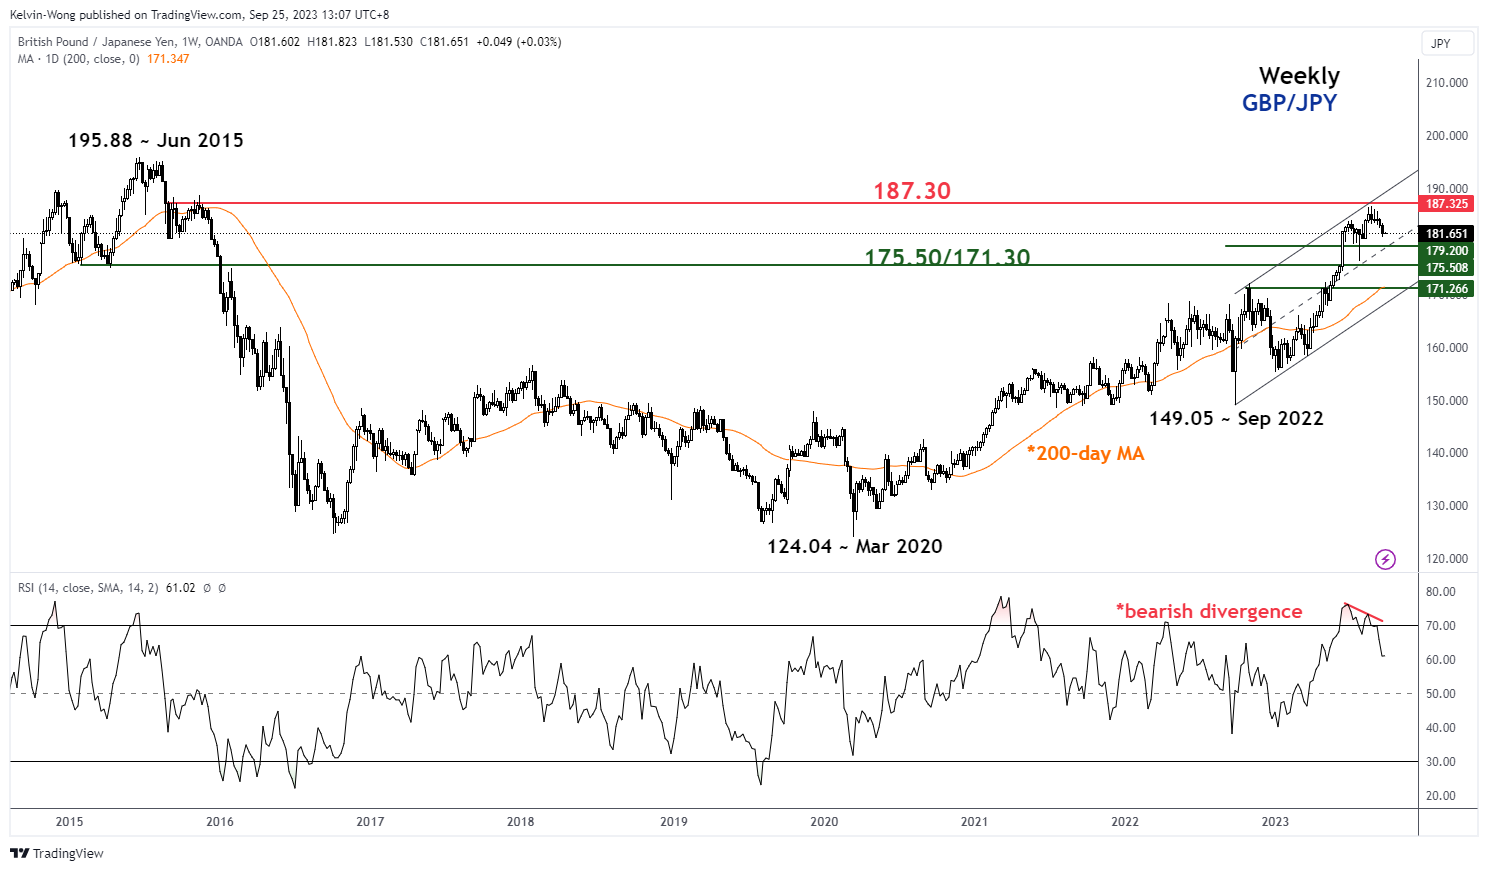
Fig 1: GBP/JPY major trend as of 25 Sep 2023 (Source: TradingView, click to enlarge chart)
The multi-month major uptrend phase of GBP/JPY in place since its September 2022 low of 149.05 has almost reached a key inflection/resistance level of 187.30 (printed an intraday high of 186.77 on 22 August 2023) which is defined by the September/November 2015 swing highs, upper boundary of the major ascending channel from September 2022 low, and a cluster of Fibonacci extension levels projected from various swing lows within the major uptrend.
In addition, the weekly RSI momentum indicator has flashed a bearish divergence condition at its overbought region, suggesting that the upside momentum of the major uptrend phase has eased off. These observations in turn increase the odds of a multi-week bearish mean reversion/counter-trend movement at this juncture.
Oscillating within a steeper minor descending channel
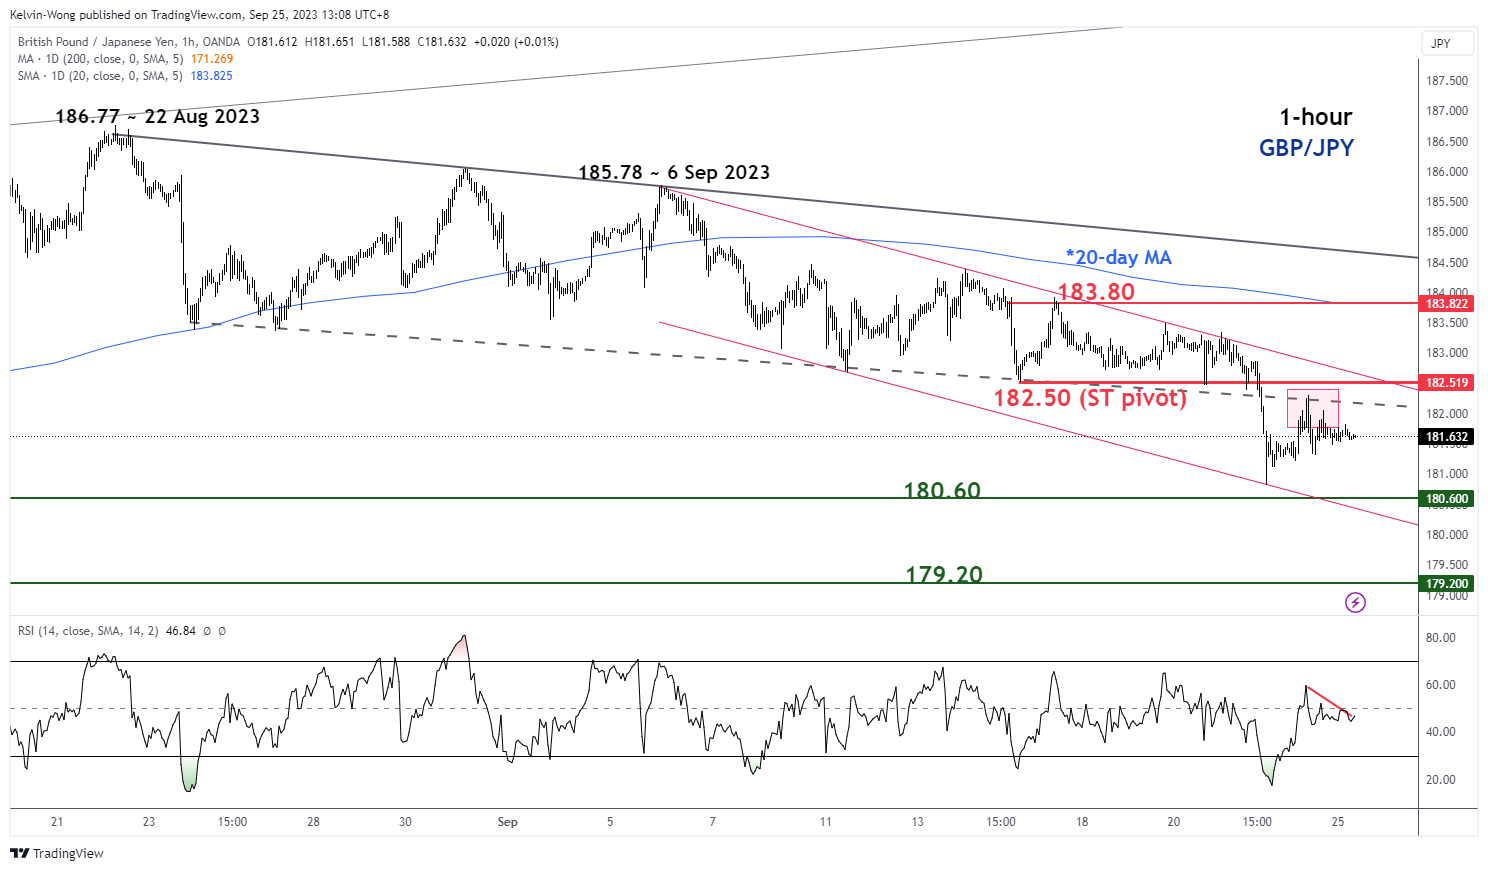
Fig 2: GBP/JPY minor short-term trend as of 25 Sep 2023 (Source: TradingView, click to enlarge chart)
In the shorter term as seen in the 1-hour chart, the price actions of GBP/JPY have started to oscillate within a steeper descending channel in place since the 6 September 2023 high of 185.78. Also, it has accelerated on the downside ex-post Bank of England’s monetary policy decision to keep its policy interest rate unchanged at 5.25% on last Thursday, 21 September.
Interestingly, the minor snap-back in price actions seen last Friday, 22 September after the prior day’s 205 pips intraday plunge has managed to stall at the pull-back resistance of the former broken-down ascending channel support from the 23 August 2023 low and the 61.8% Fibonacci retracement of last Thursday, 21 September intraday plunge from 182.86 high to 180.81 low.
In addition, the hourly RSI has shaped a “lower low” and started to inch lower right below the 50 level, suggesting short-term bearish momentum has resurfaced.
Watch the 182.50 key short-term pivotal resistance to maintain the bearish bias for another potential down leg to test the intermediate supports of 180.60 and 179.20.
However, a clearance above 182.50 negates the bearish tone to see the next resistance coming in at 183.80 (also the downward-sloping 20-day moving average).
GBP/USD Nosedives While USD/CAD Aims Higher
GBP/USD is gaining pace below 1.2300. USD/CAD is rising and might aim for a move above the 1.3520 resistance zone.
Important Takeaways for GBP/USD and USD/CAD Analysis Today
- The British Pound started a fresh decline below the 1.2500 support zone.
- There is a key bearish trend line forming with resistance near 1.2260 on the hourly chart of GBP/USD at FXOpen.
- USD/CAD is showing positive signs above the 1.3400 support zone.
- There is a major bullish trend line forming with support near 1.3450 on the hourly chart at FXOpen.
GBP/USD Technical Analysis
On the hourly chart of GBP/USD at FXOpen, the pair started a fresh decline from the 1.2500 zone. The British Pound traded below the 1.2325 support to move into further a bearish zone against the US Dollar, as mentioned in the previous analysis.
The pair even traded below 1.2275 and the 50-hour simple moving average. Finally, the bulls appeared near the 1.2230 level. A low was formed near 1.2230 and the pair is now consolidating losses with bearish signs.
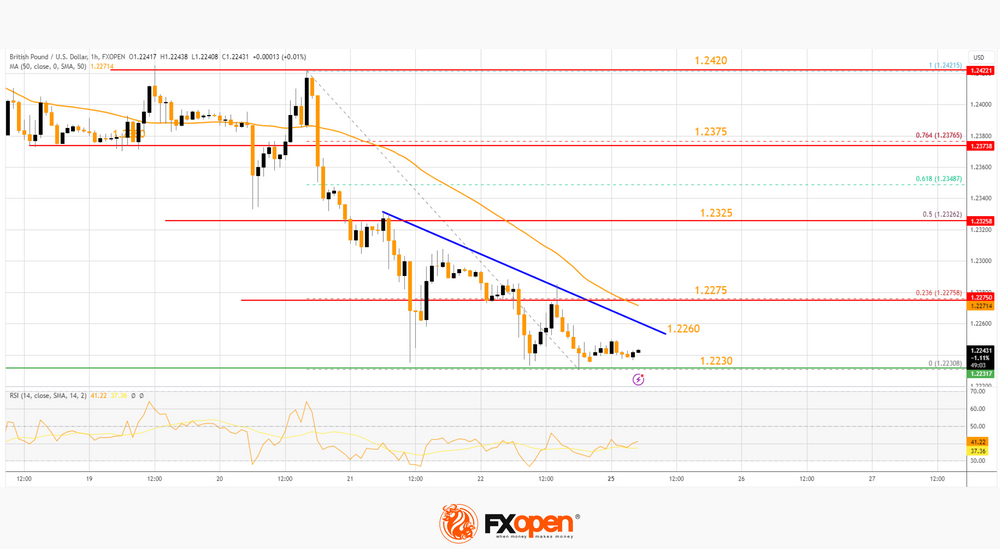
Immediate resistance on the upside is near a key bearish trend line at 1.2260. The first major resistance on the GBP/USD chart is near the 23.6% Fib retracement level of the downward move from the 1.2421 swing high to the 1.2230 low at 1.2275 and the 50-hour simple moving average.
A close above the 1.2275 resistance might spark a decent recovery wave. The next major resistance is near the 50% Fib retracement level of the downward move from the 1.2421 swing high to the 1.2230 low at 1.2325. Any more gains could lead the pair toward the 1.2375 resistance in the near term.
Initial support sits near 1.2230. The next major support sits at 1.2200, below which there is a risk of another sharp decline. In the stated case, the pair could drop toward 1.2120.
USD/CAD Technical Analysis
On the hourly chart of USD/CAD at FXOpen, the pair formed a strong support base above the 1.3400 level. The US Dollar started a fresh increase above the 1.3450 resistance against the Canadian Dollar.
The pair cleared the 50-hour simple moving average and climbed above 1.3500. Finally, it tested the 1.3520 zone. A high was formed near 1.3523 before there was a drop toward 1.3425. The pair traded as low as 1.3423 and it is again moving higher.
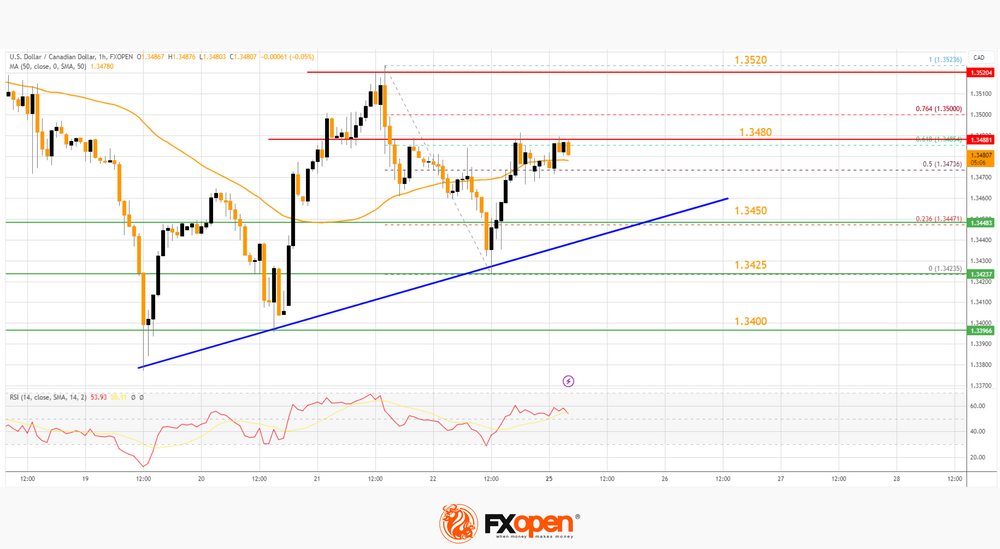
There was a move above the 50% Fib retracement level of the downside correction from the 1.3523 swing high to the 1.3423 low. There is also a major bullish trend line forming with support near 1.3450.
Initial resistance sits near the 61.8% Fib retracement level of the downside correction from the 1.3523 swing high to the 1.3423 low at 1.3480. A clear upside break above 1.3480 could start another steady increase.
The next major resistance is the 1.3520 level. A close above the 1.3520 level might send the pair toward the 1.3580 level. Any more gains could open the doors for a test of the 1.3640 level.
Conversely, the pair could start another decline. Initial support is near the 1.3450 level and a major bullish trend line on the same USD/CAD chart. The next major support is near 1.3425.
The main support sits near 1.3400. A downside break below the 1.3400 level could push the pair further lower. The next major support is near the 1.3365 support zone, below which the pair might visit 1.3320.
This article represents the opinion of the Companies operating under the FXOpen brand only. It is not to be construed as an offer, solicitation, or recommendation with respect to products and services provided by the Companies operating under the FXOpen brand, nor is it to be considered financial advice.
Main Dish Reserved for European CPI numbers
Markets
The European September PMIs of last Friday suggest a 0.4% economic contraction in the running quarter but they came with a minor silver lining. The destocking process in manufacturing could bottom in the next couple of months, paving the way for a recovery in the sector. Services is typically lagging behind and showed new orders and business shrinking at a faster pace but at least companies keep hiring for the time being. Especially important for the ECB is that input price pressures intensified again. European yields whipsawed, driven by diverging national readings from France and Germany at first. German yields eventually closed the day marginally higher between +0.1 (2-y) and 2.3 bps (30-y). US Treasuries outperformed. PMIs in the country showed a similar dynamic: slowing services and tentative bottoming out of the manufacturing sector. After the beating earlier in the week, markets swooped up some Treasuries going into the weekend. Speeches by Fed’s Collins and Bowman capped gains at the shortest end of the curve. The latter revealed her 6-6.25% 2024 rate projection in the dot plot by saying there may be more rate hikes (plural) needed. Yield changes varied between -3.4 (2-y) to -6.3 bps (5-y). The 10-y yield eased after hitting 4.5% intraday for the first time since 2007. With stocks under marginal selling pressure, the dollar gained. DXY rose above 105.38 resistance (closed at 105.58). EUR/USD for a second day straight dropped below the May 1.0635 support before paring losses to 1.0653. USD/JPY closed at the highest level since November last year (148.37) with the yen under pressure from the BoJ’s status quo. UK retail sales and PMIs missed the bar, hurling EUR/GBP towards the 0.87 big figure. GBP/USD (1.2241) extended losses after losing the May support (1.2308) a day earlier.
Last week was jampacked with central bank meetings. Attention this week shifts towards Central-Europe where the Hungarians (Tuesday) and Czechs (Wednesday) decide over monetary policy. It’s their first meeting since Poland’s shocker 75 bps cut. There’s a wide array of economic data including the German Ifo, US consumer confidence and durable goods orders. The main dish, however, is reserved for European CPI numbers on Thursday and Friday. The PCE deflator is due in the US at the end of the week. Given the backloaded nature of the calendar we expect a slow, technical start of the week that gives the dollar a slight edge over peers on the FX market. Yields could consolidate around current levels. They already powered through to new cycle highs in the US, both nominal and real. We’re keen to see whether September CPI numbers will do the trick for Germany. The 10-y real yield is nearing the topside of a (yield) bullish triangle.
News and views
Comments from the Hungarian Economic Development Minister, Marton Nagy, on Friday suggest ongoing tensions between the government and the Hungarian National Bank (MNB) on the execution of monetary policy. According to the Minister, the MNB keeping a focus on having a positive real yield to defend the currency might slow growth and consumption. Boosting domestic demand/consumption via VAT revenues for the government is important to improve the budget balance Nagy indicated. The comments come as the central bank on Tuesday is expected to reduce the overnight deposit rate from 14% to 13% to bringing it in line with the 13% standing policy rate. However, further rate cuts later this year could be slower as the MNB will look for a sustained further decline in inflation. Nagy also suggested that the central bank could consider raising its 3.0% inflation target, allowing it to ease policy further than is the case under current regime.
The Australian government on Friday reported a budget surplus of AUD 22.1 bln for the previous fiscal year. The surplus was equal to 0.9% of GDP. The government cited low unemployment and high commodity prices as important factors behind the budget surprise. The Australian budget showed deficits in the previous 15 year. However, the government doesn’t expect a new budget surplus this year due to a less positive economic environment in China and higher interest rates weighing on domestic growth. Today, the government also is expected propose a paper that will set a new objective for full employment. This broader definition is expected to focus more on underutilization in the labour market rather than on unemployment.
GBP/JPY Daily Outlook
Daily Pivots: (S1) 181.10; (P) 181.71; (R1) 182.20; More...
Intraday bias in GBP/JPY remains neutral for the moment, and some more consolidations could be seen above 180.78. But further decline is expected as long as 183.34 resistance holds. Break of 180.78 will resume the fall from 186.75 to 176.29 support next.
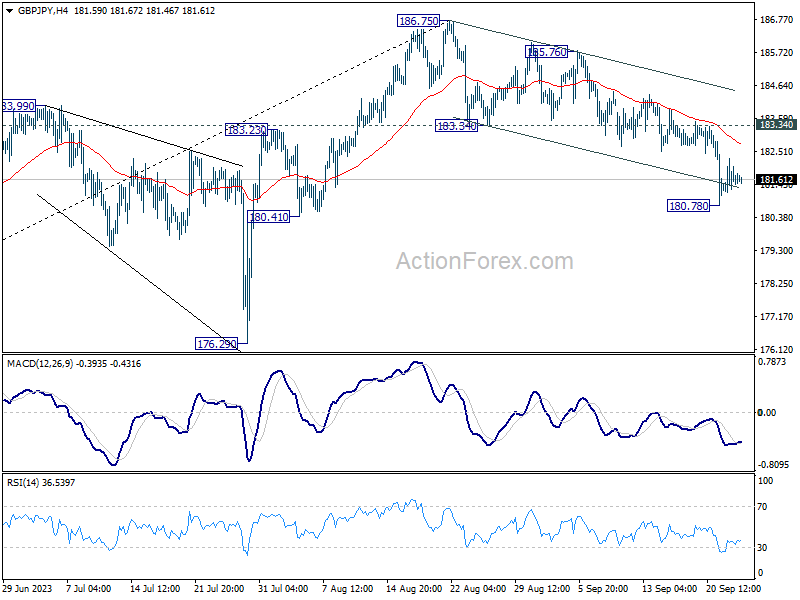
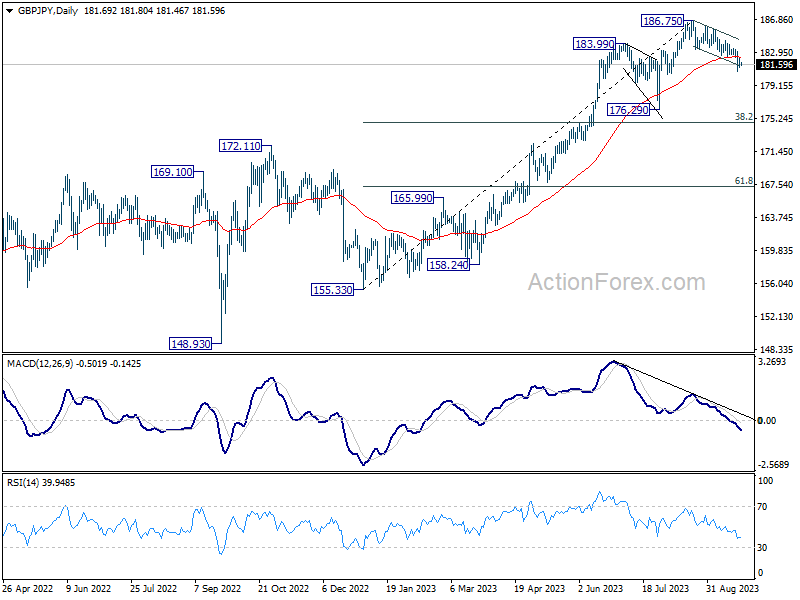
In the bigger picture, fall from 186.75 is currently seen as a corrective move only. As long as 176.29 support holds, larger up trend from 123.94 (202 low) should still be in progress. Break of 186.75 will target 195.86 (2015 high). Nevertheless, firm break of 176.29 will confirm medium term topping, and bring lengthier and deeper consolidations.
EUR/GBP Daily Outlook
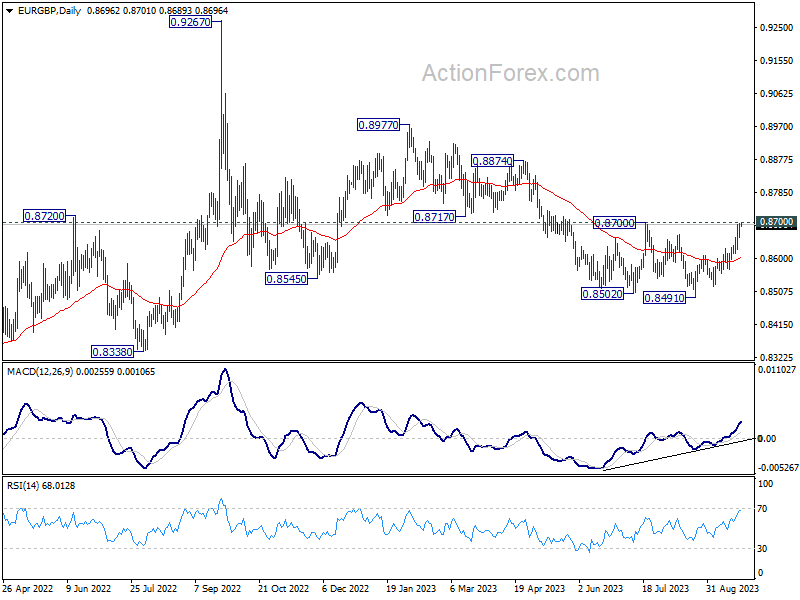
Daily Pivots: (S1) 0.8672; (P) 0.8686; (R1) 0.8711; More....
Intraday bias in EUR/GBP remains on the upside with focus on 0.8700 resistance. Decisive break there carry larger bullish implication and bring stronger rally to 0.8874 resistance next. Nevertheless, rejection by this resistance will maintain bearish outlook that larger down trend is not over. Break of 0.8629 resistance turned support will turn bias back to the downside for 0.8568 support first.
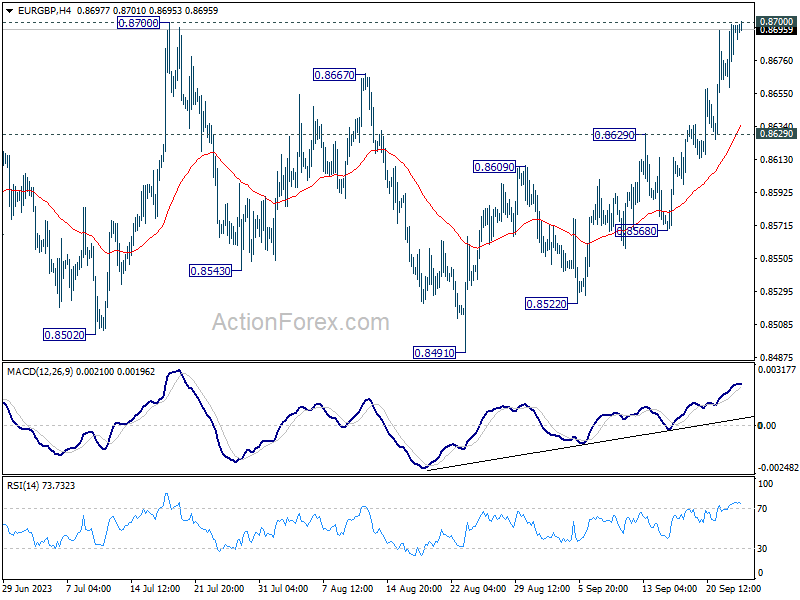
In the bigger picture, the down trend from 0.9267 (2022 high) is seen as part of the long term range pattern from 0.9499 (2020 high). Decisive break there will argue that this decline has completed with three waves down to 0.8491. Rise from 0.8491 could then be another leg inside the pattern that targets 0.8977 and above. However, rejection by 0.8700 will keep the down trend alive for another fall through 0.8491 at a later stage.
EUR/AUD Daily Outlook
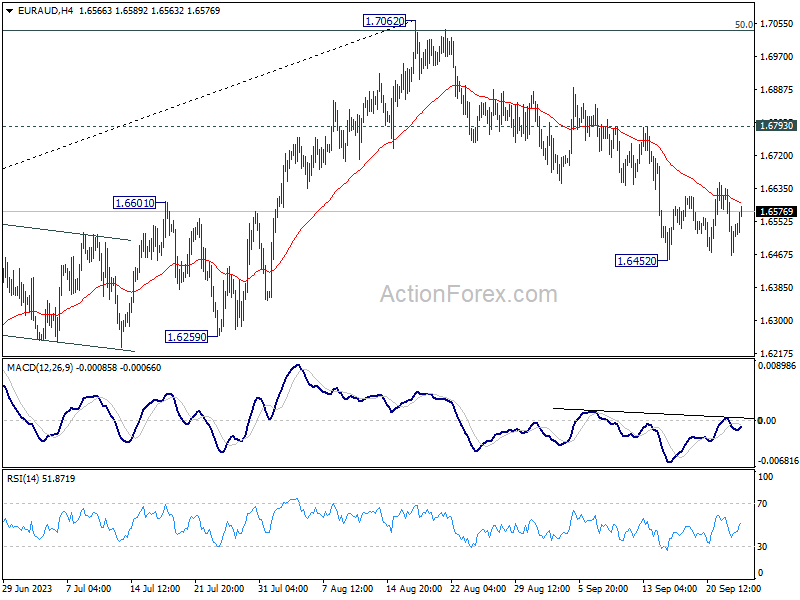
Daily Pivots: (S1) 1.6453; (P) 1.6545; (R1) 1.6622; More...
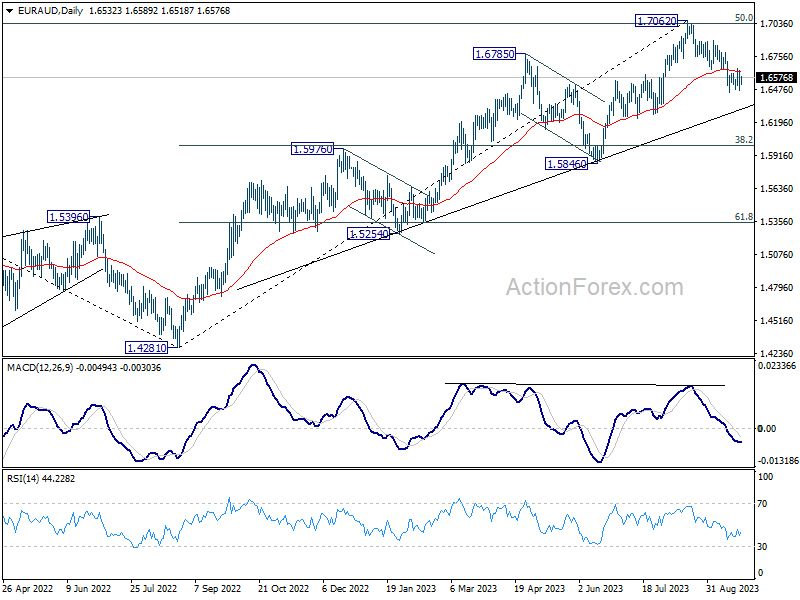
Intraday bias in EUR/AUD remains neutral as sideway trading continues. On the downside, break of 1.6452 will resume the fall from 1.7062, as a larger scale correction, to 1.6000 fibonacci level. Nevertheless, firm break of 1.6793 will dampen this view and bring retest of 1.7062 instead.
In the bigger picture, fall from 1.7062 is probably correcting whole up trend from 1.4281 (2022 low). Deeper decline would be seen to 38.2% retracement of 1.4281 to 1.7062 at 1.6000. Strong support should be seen there to bring rebound, at least on first attempt.
EUR/CHF Daily Outlook
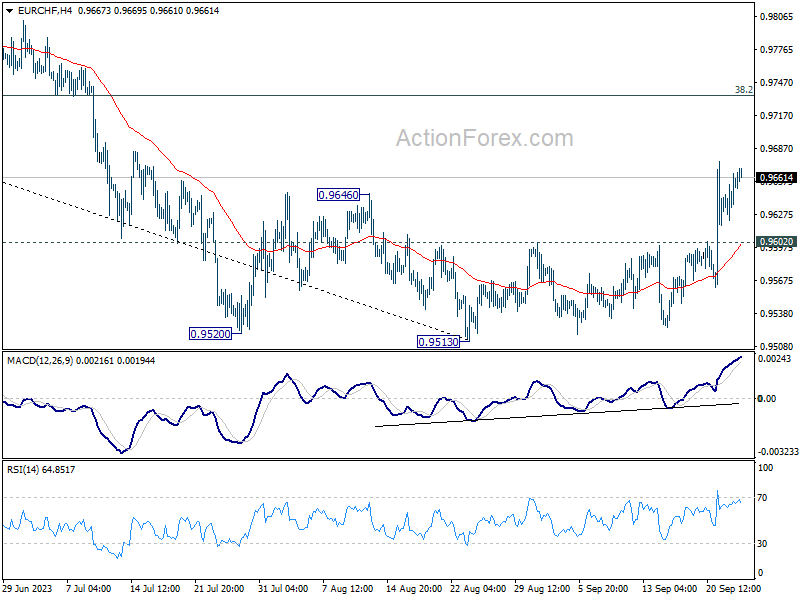
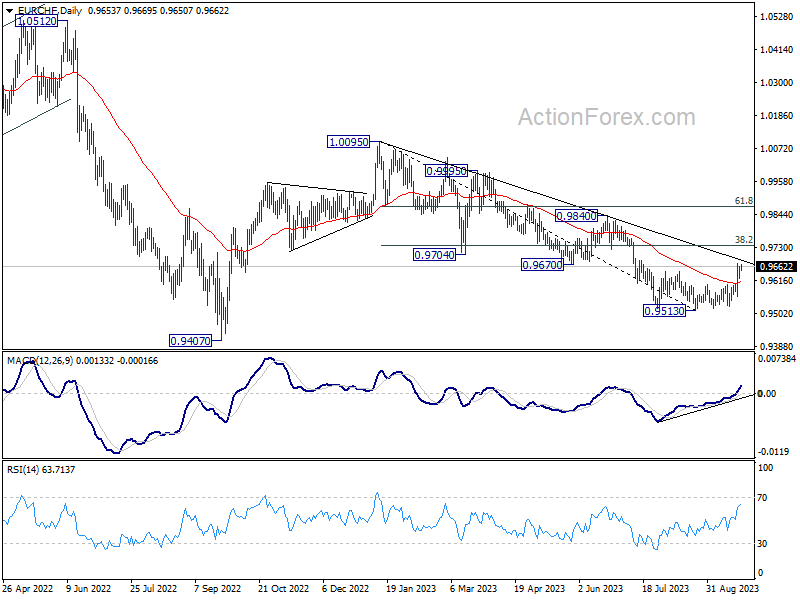
Daily Pivots: (S1) 0.9631; (P) 0.9649; (R1) 0.9673; More...
Intraday bias in EUR/CHF stays on the upside at this point. Rise from 0.9513 should continue to rally to 38.2% retracement of 1.0095 to 0.9513 at 0.9735. Sustained break there will target 61.8% retracement at 0.9873. On the downside, however, below 0.9602 minor support will dampen the bullish case and turn intraday bias neutral first.
In the bigger picture, medium term outlook will stay bearish as long as the cross is capped well below falling 55 W EMA (now at 0.9799). That is, down trend from 1.2004 (2018 high) could still resume through 0.9407 (2022 low). However, sustained trading above the 55 W EMA will raise the chance that 0.9470 is already a long term bottom. Further rise would then be seen to 1.0095 resistance to indicate bullish trend reversal.
EUR/USD Daily Outlook
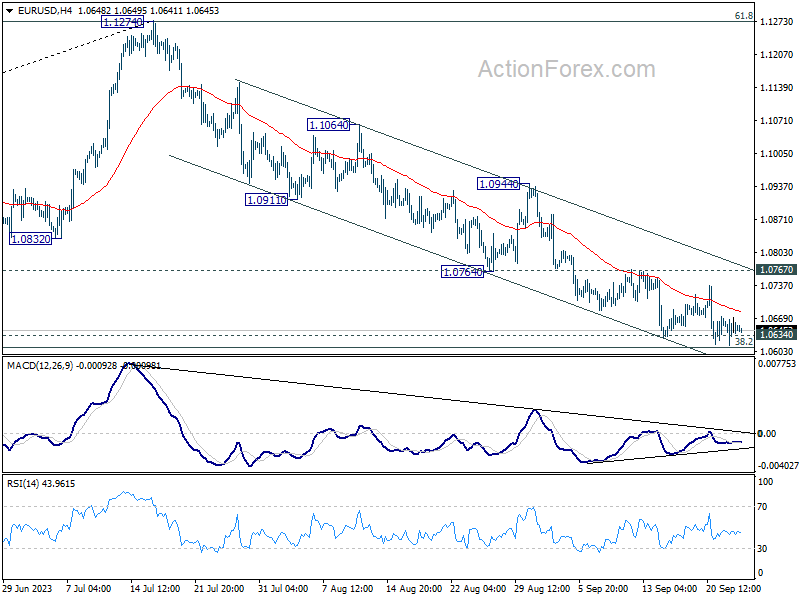
Daily Pivots: (S1) 1.0616; (P) 1.0644; (R1) 1.0673; More...
Intraday bias in EUR/USD remains neutral for the moment. On the downside, sustained break of 1.0609/34 cluster support will carry larger bearish implication. Fall from 1.1274 should then target 1.0515 support next. Nevertheless, strong rebound from current level, followed by break of 1.0767 resistance, should confirm short term bottoming. Intraday bias will be back on the upside for 1.0944 resistance.
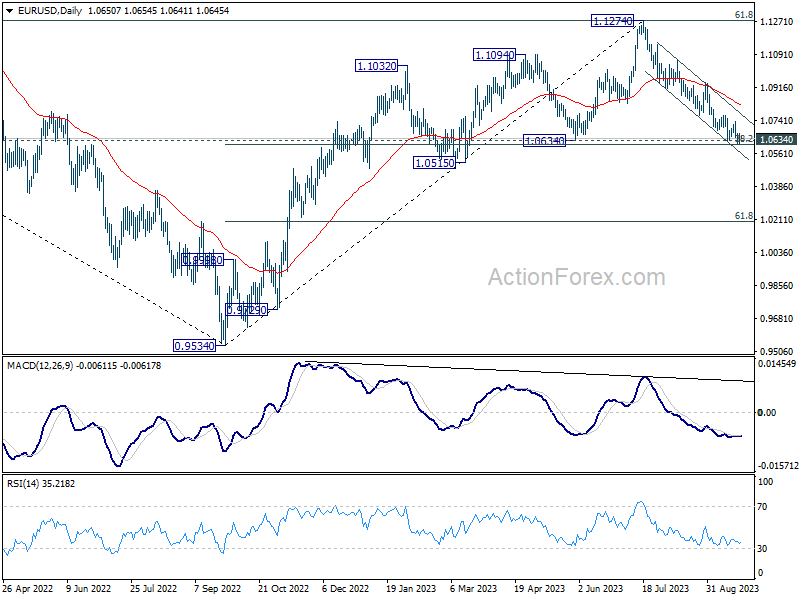
In the bigger picture, fall from 1.1274 medium term top is seen as a correction to up trend from 0.9534 (2022 low). Strong support could be seen from 1.0634 cluster support (38.2% retracement of 0.9534 to 1.1274 at 1.0609) to bring rebound, at least on first attempt. However, sustained break of 1.0609/0634 will raise the chance of bearish trend reversal, and target 61.8% retracement at 1.0199.
GBP/USD Daily Outlook
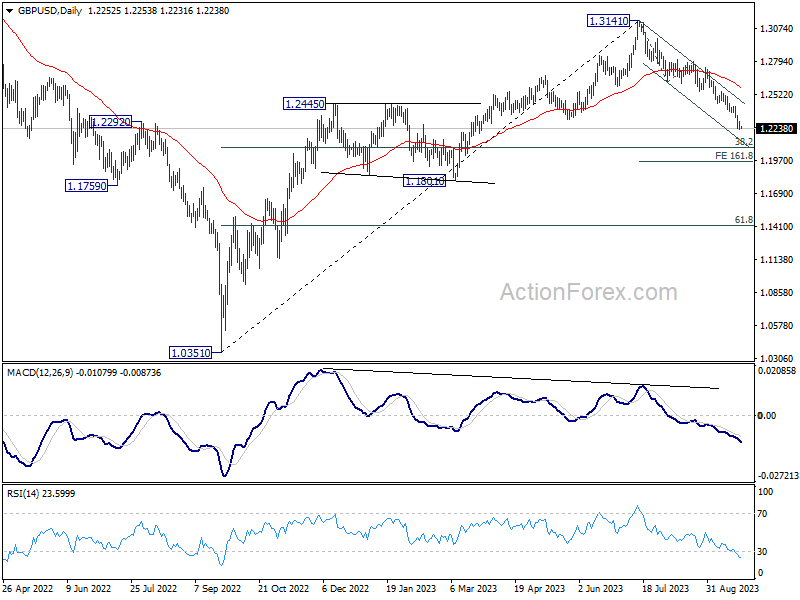
Daily Pivots: (S1) 1.2213; (P) 1.2257; (R1) 1.2284; More...
Intraday bias in GBP/USD remains on the downside for the moment. Current fall from 1.3141 is in progress for 1.2075 fibonacci level. On the upside, above 1.2369 minor resistance will turn intraday bias neutral and bring consolidations. But near term outlook will stay bearish as long as 1.2618 support turned resistance holds, in case of strong recovery.
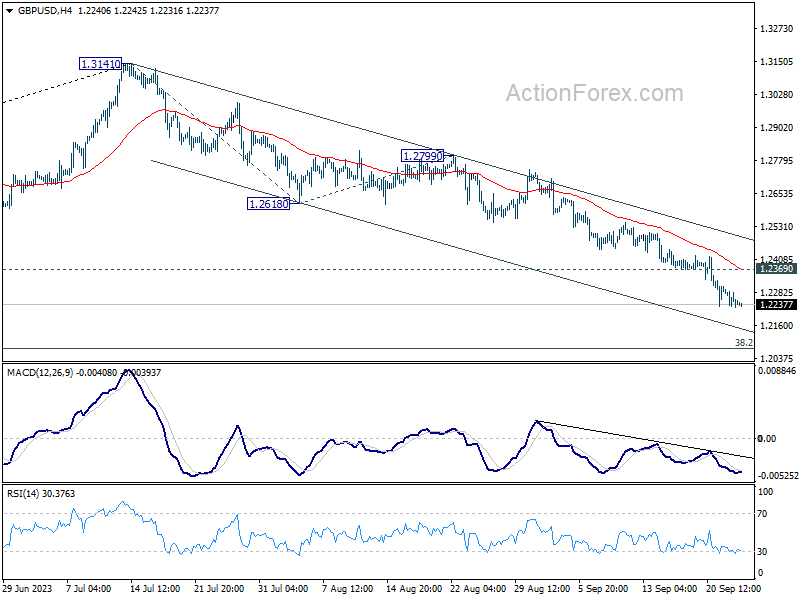
In the bigger picture, fall from 1.3141 medium term top is seen as a correction to up trend from 1.0351 (2022 low). Deeper decline would be seen to 38.2% retracement of 1.0351 to 1.3141 at 1.2075. Strong support would be seen there to bring rebound on first attempt. However, sustained break of 1.2075 will raise the chance of bearish trend reversal and target 1.1801 structural support next.
USD/JPY Daily Outlook
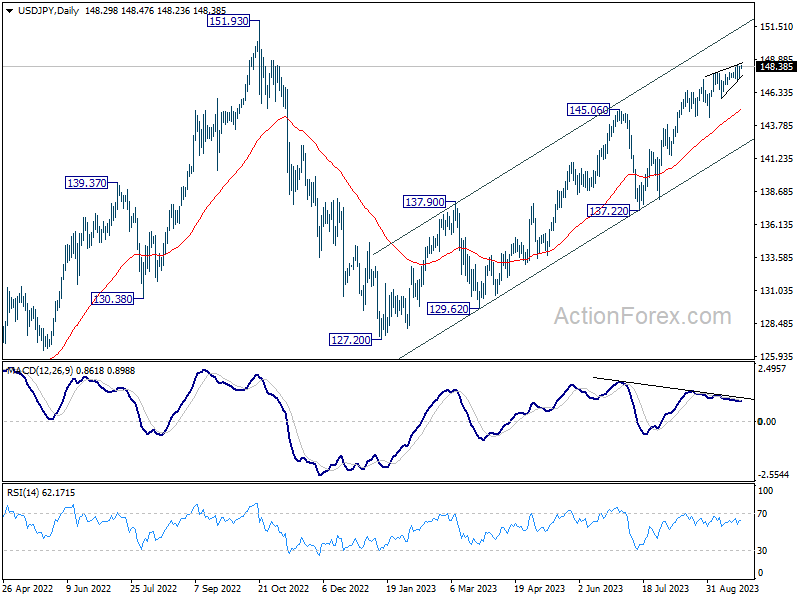
Daily Pivots: (S1) 147.77; (P) 148.10; (R1) 148.70; More...
Intraday bias in USD/JPY is back on the upside a recent rally is trying to resume. Rise from 127.20 should target 151.93 high. However, firm break of 147.31 support will should confirm short term topping, and turn bias to the downside for 145.88 support and below.
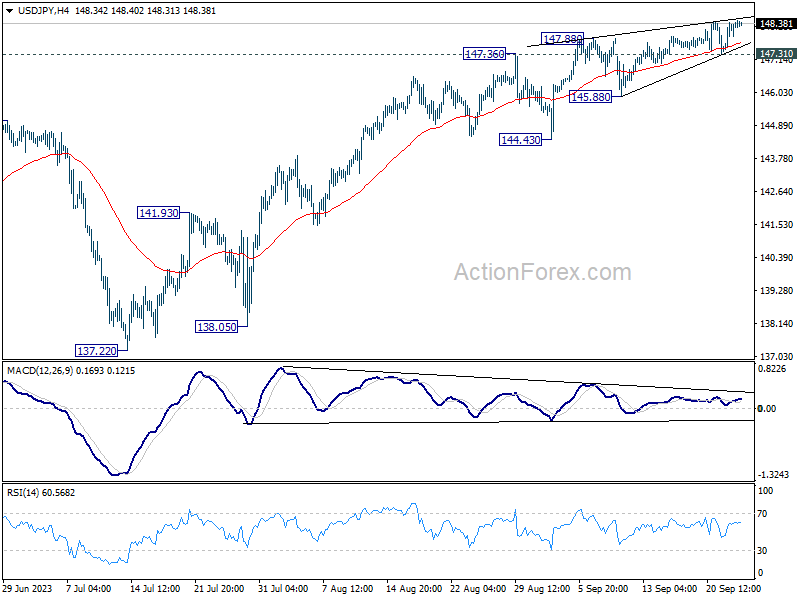
In the bigger picture, while rise from 127.20 is strong, it could still be seen as the second leg of the corrective pattern from 151.93 (2022 high). Rejection by 151.93, followed by break of 137.22 support will indicate that the third leg of the pattern has started. However, sustained break of 151.93 will confirm resumption of long term up trend.