Sample Category Title
EUR/CHF: Swiss Franc Falls Sharply after SNB Surprise to Keep Rates On Hold
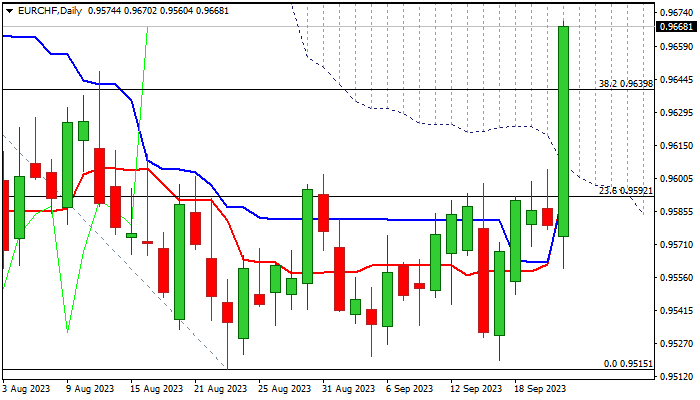
EURCHF surged 0.8% in immediate reaction to decision of the Swiss National Bank to pause its current cycle of interest rate hikes.
In the policy meeting held today, the SNB kept its interest rate unchanged at 1.75%, against widely expected 25 basis points increase, arguing their decision by easing inflation in Switzerland, but left the door open for possible further hikes.
The SNB pulled the break this time, to use the pause to assess the situation and see whether the measures taken until now are sufficient to keep the price stability within desired levels, after the increase by total 250 basis points pushed inflation from 3.5% peak in 2022 to the central bank’s 0%-2% target range.
The price rose to the highest in over two months in strong post-SNB acceleration (the biggest daily advance since Jan 11).
Fresh bulls penetrated thick falling daily Ichimoku cloud and signaled formation of a higher base at 0.9520 zone, targeting key barriers at 0.9678/81 (50% retracement of 0.9841/0.9515 bear-leg / daily cloud top), with firm break here to add to strong bullish signals and open way for further advance.
Significant acceleration of bullish momentum adds to improving conditions on daily chart, however overbought conditions would contribute to headwinds that bears are expected to face on approach to 0.9678/81 pivots.
Broken Fibo 38.2% (0.9639) should contain dips to keep fresh bulls in play and offer better levels to re-enter bullish near-term action, for acceleration above 0.9700 zone.
Only return and close below daily cloud base (0.9600) will neutralize bulls and signal return to a multi-week range.
Res: 0.9681; 0.9716; 0.9764; 0.9780.
Sup: 0.9639; 0.9600; 0.9560; 0.9520.
US 100 Cash Index Lower Again Today; Sell-off Could Have Legs
- The US 100 index is edging lower today, testing the support of the 100-day SMA
- Bears are trying to recover part of their significant losses since the March 2023 lows
- The pullback could continue according to the momentum indicators
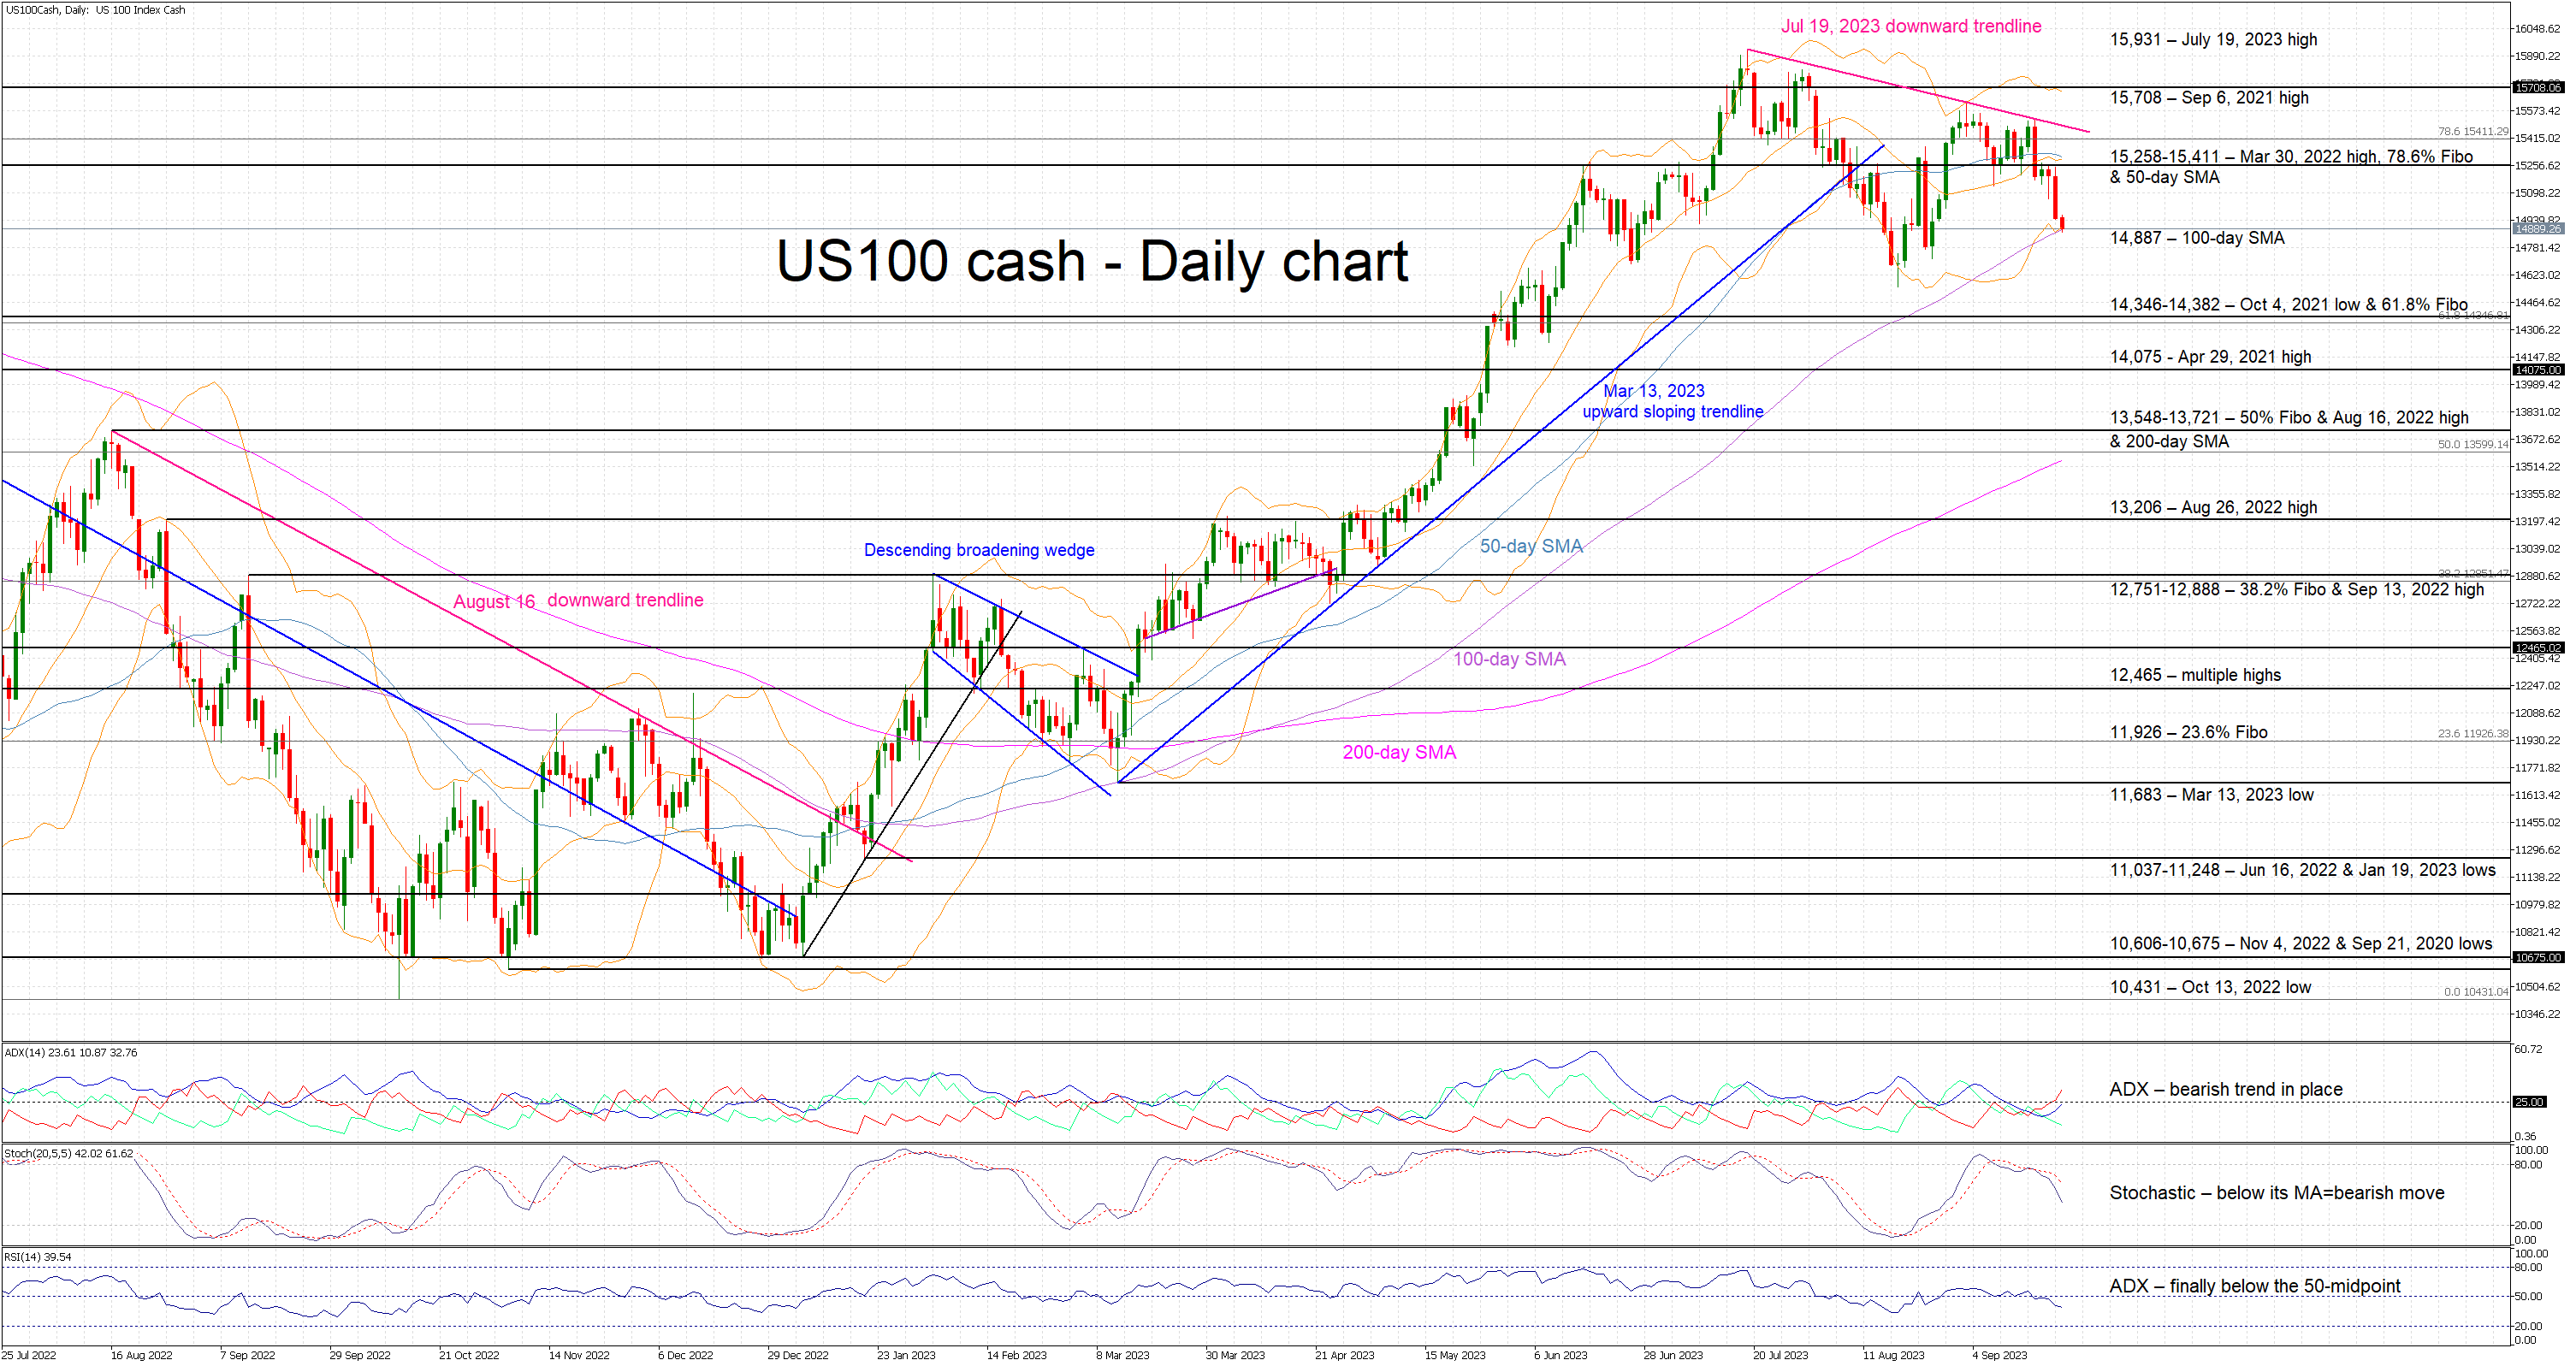
Recent market events have changed the sentiment in the US 100 cash index and the bears appear to have the upper hand at this juncture. The index is recording its third consecutive red candle as the bears are probably aiming to achieve a new lower low, below the August 18 trough at 14,553.
The bears are feeling strong at this stage as the momentum indicators are clearly on their side. The Average Directional Movement Index (ADX) has broken above its 25-threshold, signalling a muted bearish trend in the market, and the RSI has dropped below its 50-midpoint. More importantly, the stochastic oscillator is heading lower, towards its oversold territory, and building a good gap from its moving average.
Should the bears remain confident, they would try to overcome the 100-day simple moving average (SMA) at 14,887. They could then set their eyes on the busier 14,346-14,382 area, which is populated by the October 4, 2021 low and the 61.8% Fibonacci retracement level of the November 22, 2021 – October 13, 2022 downtrend. If successful in breaking this region, the next support area is expected at the April 29, 2021 high at 14,075.
On the flip side, the bulls are probably willing to take back control of the market. They would try to keep the US 100 cash index above the 14,887 level, and then gradually stage a rally towards the busier 15,258-15,411 range that is defined by the March 30, 2022 high, the 50-day SMA and the 78.6% Fibonacci retracement. Even higher, the key September 6, 2021 high at 15,708 will probably test the bulls’ determination.
To sum up, US 100 cash index bears continue their push lower, supported by the momentum indicators. However, the medium-term trend remains bullish and hence the bulls are probably preparing their response.
Oil Analysis: Finally, A Bearish Reversal?
The policy of OPEC+ countries to voluntarily reduce oil production was one of the drivers thanks to which the price of WTI oil increased by approximately 40% from its low in June. In such cases, it is appropriate to use the phrase “correction is overdue.”
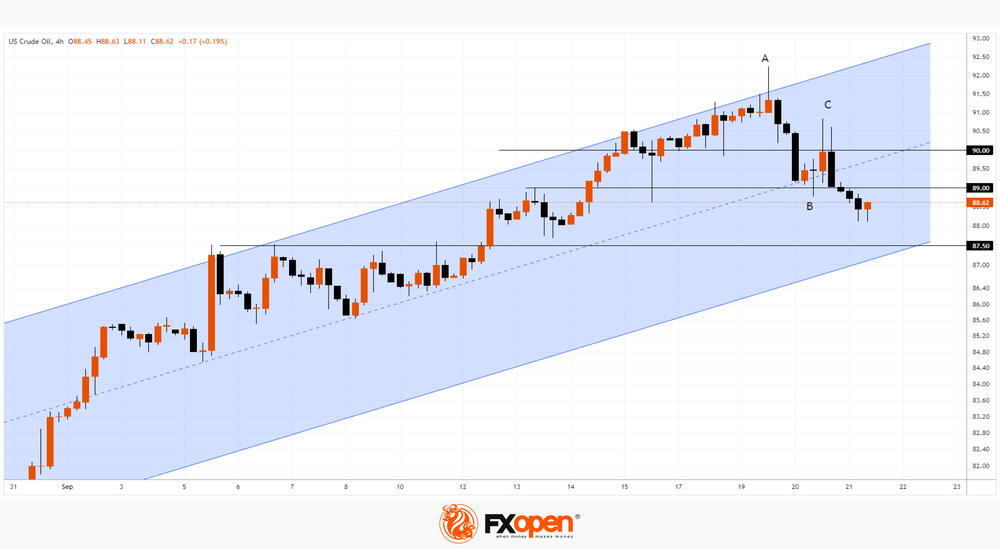
So a decline from the week's high above USD 92 to current levels seems natural. Note that the reversal began with the appearance of extremely high trading volumes in oil futures on the NYMEX exchange on Tuesday — but what if capital associated with governments of countries that do not benefit from high oil prices, which are fueling already high inflation, entered the market? If so, then WTI oil prices above 90-91 can be considered a “red line” for them.
Bearish arguments:
→ the price increase B→C is near the Fibonacci level of 31.8% of the decrease A→B, which is acceptable for a natural rollback;
→ the psychological level of USD 90 (above which the rate of price growth has slowed down) can now act as resistance;
→ the price has broken through the median line of the uptrend — now resistance can be expected from it;
→ the level of USD 89 has also been broken by the bears — it is possible that it, in turn, will slow down the bulls’ attempts to win back, if any, occur. The rate of decline is being recorded too rapidly this week.
Bulls can expect the market to find support around USD 87.5 per barrel — there is a support line (former resistance that restrained price growth at the beginning of the month), supported by the lower channel line.
Hope for a resumption of the upward trend can be given by an article in the FT that hedge funds are aiming for the price to reach USD 100 per barrel, but given the sharp change in sentiment, which is indicated by volumes and the assessment of impulse movements, they cast doubt on the achievement of this goal.
This article represents the opinion of the Companies operating under the FXOpen brand only. It is not to be construed as an offer, solicitation, or recommendation with respect to products and services provided by the Companies operating under the FXOpen brand, nor is it to be considered financial advice.
Central Bank Week Shakes Up Gold Market
Yesterday, the main event of the week took place — the Federal Reserve meeting, which had a noticeable impact on the market of assets denominated in US dollars. But besides the Fed meeting, there are a number of other events this week related to central banks:
→ today at 10:30, a meeting of the Swiss National Bank took place. The interest rate remained at 1.75%, although there was a significant possibility of its increase to 2%.
→ today at 14:00 GMT+3, a decision on the Bank of England interest rate is expected;
→ news from the Central Bank of Japan is planned for tomorrow morning — there may be surprises.
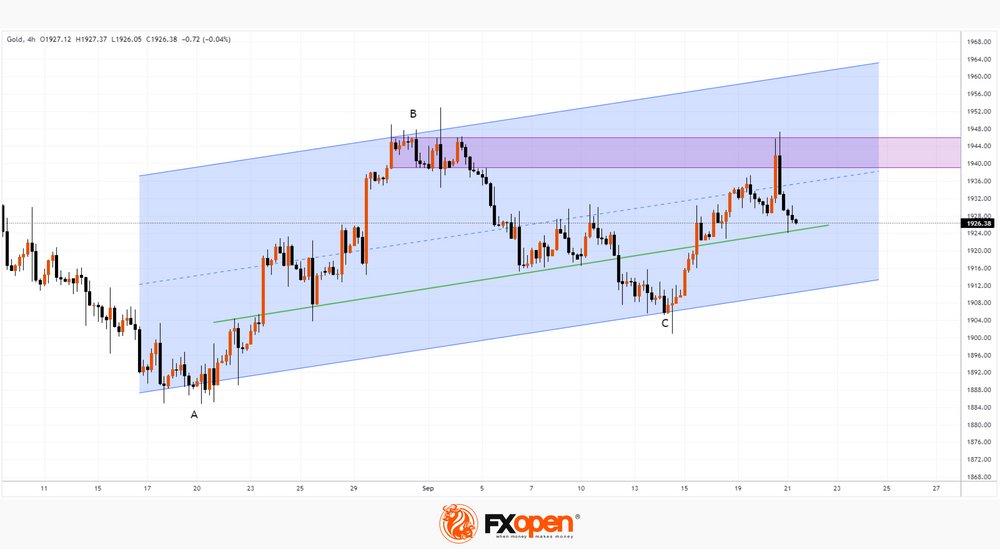
An important asset that is affected by the decisions of central banks is gold. And it is not surprising that the XAU/USD chart showed a surge in volatility yesterday; moreover, new impulses may appear before the end of the week.
Bearish arguments:
→ the price tested the 1,939-1,946 area, which formed in late August - early September. Sellers asserted their dominance in that area, and yesterday the price sharply turned down, attempting to rise into this area;
→ the median line of the ascending channel can now provide resistance to the rise in gold price.
Bullish arguments:
→ rising A and C peaks are a sign of an uptrend, and the lower border of the channel can resist the onslaught of bears;
→ there is a psychological basis to expect support at USD 1,900.
So far, the bulls are holding the line near the trend line, shown in green. And if a weak rebound occurs from it, which does not exceed 50% of the downward momentum that began at yesterday's high, the bears can gain even more confidence in their superiority.
This article represents the opinion of the Companies operating under the FXOpen brand only. It is not to be construed as an offer, solicitation, or recommendation with respect to products and services provided by the Companies operating under the FXOpen brand, nor is it to be considered financial advice.
EUR/CHF Daily Outlook
Daily Pivots: (S1) 0.9572; (P) 0.9588; (R1) 0.9597; More...
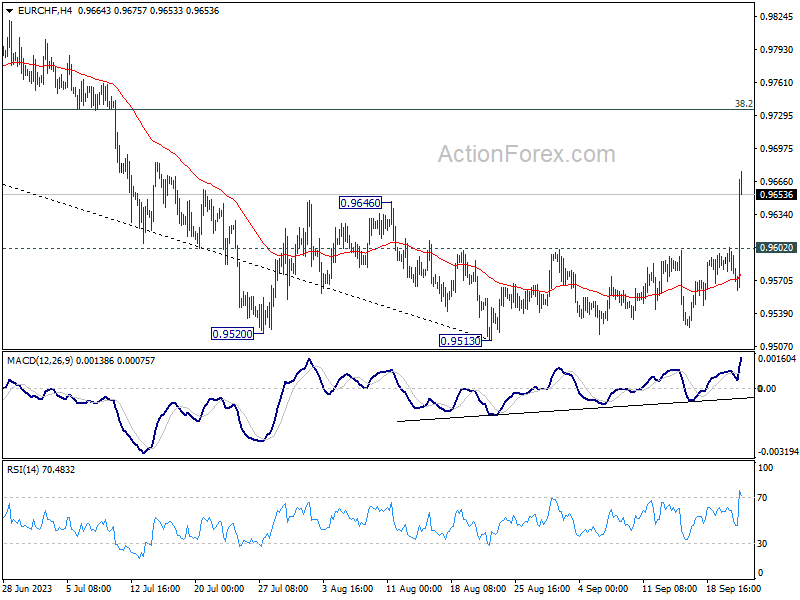
EUR/CHF's strong rally today and break of 0.9646 resistance confirms short term bottoming at 0.9513. Considering bullish convergence conditiom in D MACD, the down trend from 1.0095 might have completed too. Intraday bias is back on the upside for 38.2% retracement of 1.0095 to 0.9513 at 0.9735. Sustained break there will affirm this bullish case and target 61.8% retracement at 0.9873. On the downside, below 0.9602 minor support will turn intraday bias neutral first.
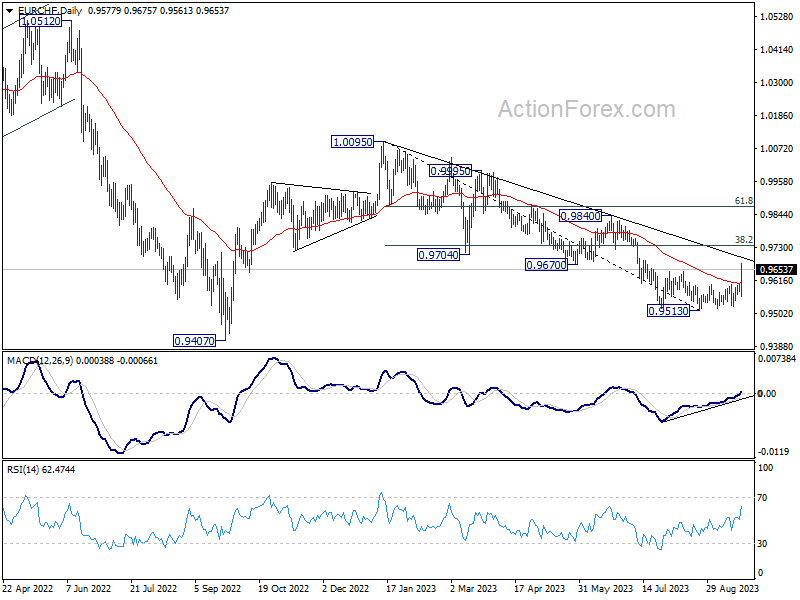
In the bigger picture, medium term outlook is staying bearish as the cross is capped well below falling 55 W EMA (now at 0.9804). Down trend from 1.2004 (2018 high) could still resume through 0.9407 (2022 low). However, sustained trading above the 55 W EMA will raise the chance that 0.9470 is already a long term bottom. Further rise would then be seen to 1.0095 resistance to confirm bullish trend reversal.
EUR/GBP Daily Outlook
Daily Pivots: (S1) 0.8615; (P) 0.8637; (R1) 0.8659; More....
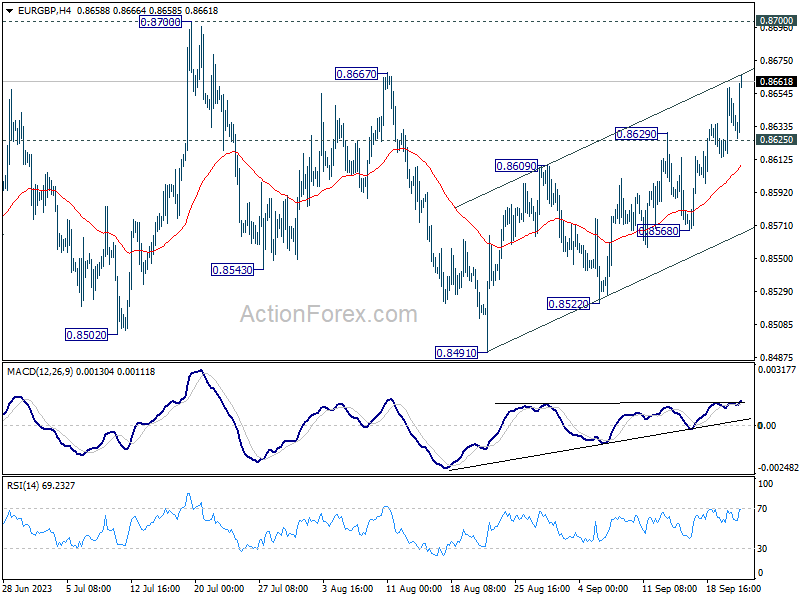
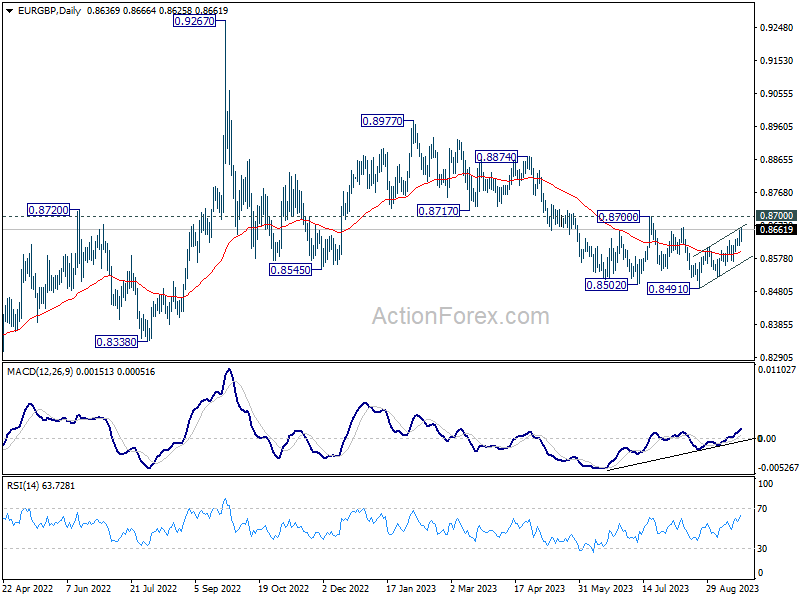
EUR/GBP's rise from 0.8491 is continuing today and intraday bias stays on the upside. As noted before, this rise is seen as the third leg of the corrective pattern from 0.8502. Upside should be limited by 0.8667/8700 resistance zone. On the downside, below 0.8625 minor support will turn intraday bias neutral first. Further break of 0.8568 support will turn bias back to the downside for retesting 0.8491 low.
In the bigger picture, the down trend from 0.9267 (2022 high) is seen as part of the long term range pattern from 0.9499 (2020 high). Fall from 0.8977 is seen as the third leg. As long as 0.8700 resistance holds, further decline is still expected. Break of 0.8491 will resume the fall towards 0.8201 (2022 low). Nevertheless, firm break of 0.8700 will now be a sign of bullish reversal.
EUR/AUD Daily Outlook
Daily Pivots: (S1) 1.6487; (P) 1.6526; (R1) 1.6572; More...
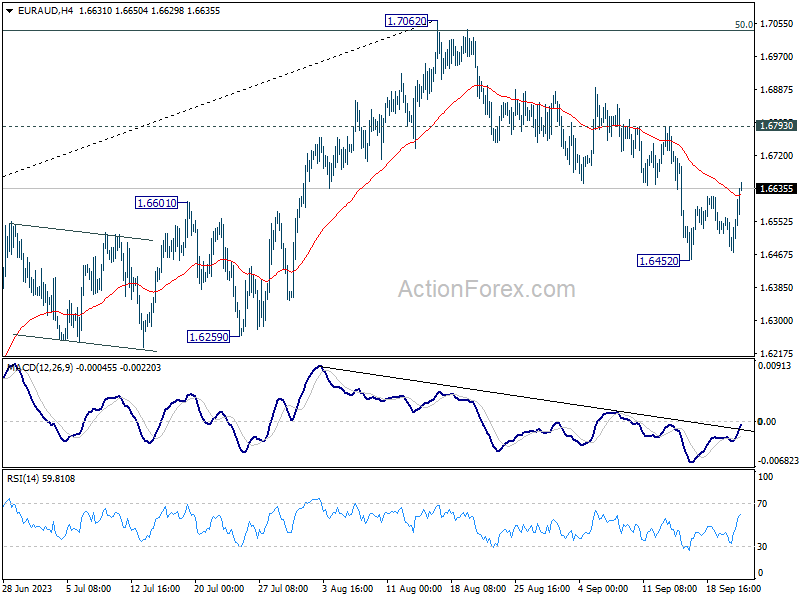
EUR/AUD is extending the consolidation from 1.6452 and intraday bias remains neutral. Further decline is expected with 1.6793 resistance intact. Fall from 1.7062 is seen as a larger scale correction. Below 1.6452 will target 1.6000 fibonacci level. Nevertheless, firm break of 1.6793 will dampen this view and bring retest of 1.7062 instead.
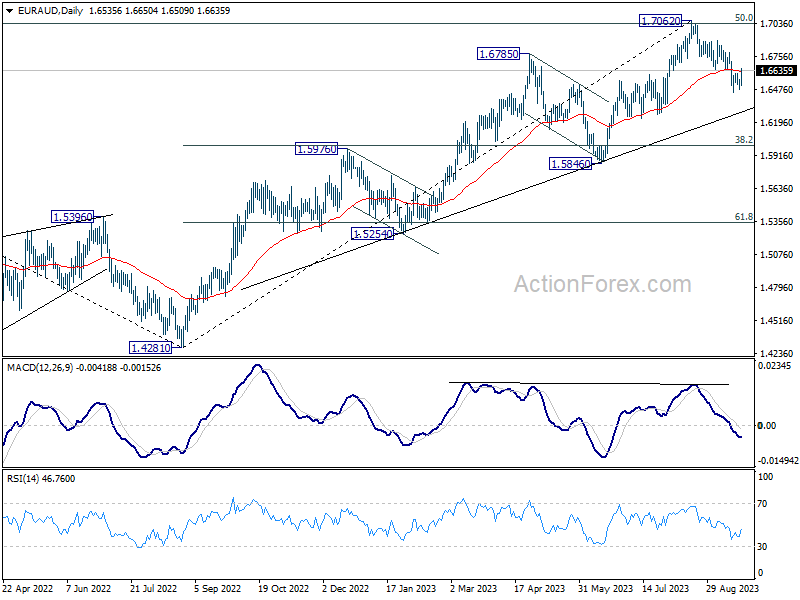
In the bigger picture, current development argues that fall from 1.7062 is probably correcting whole up trend from 1.4281. Deeper decline would be seen to 38.2% retracement of 1.4281 to 1.7062 at 1.6000. Strong support should be seen there to bring rebound, at least on first attempt.
EUR/JPY Daily Outlook
Daily Pivots: (S1) 157.80; (P) 158.12; (R1) 158.48; More....
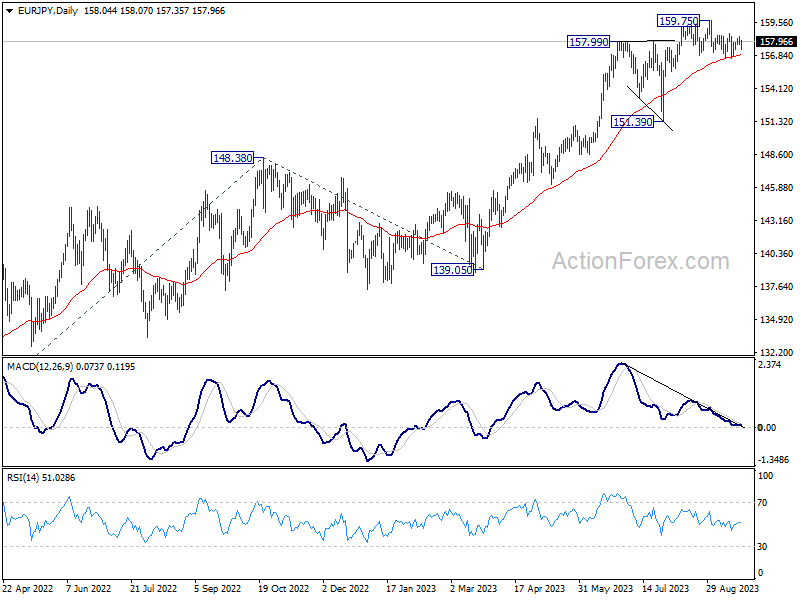
No change in EUR/JPY's outlook as range trading continues. Intraday bias stays neutral. Risk will be mildly on the downside as long as 158.64 resistance holds. Break of 156.57 support, and sustained trading below 55 D EMA (now at 156.80) will argue that fall from 159.75 is a larger scale correction. Deeper decline would be seen back towards 151.39 support. Nevertheless, above 158.64 would bring retest of 159.75 high instead.
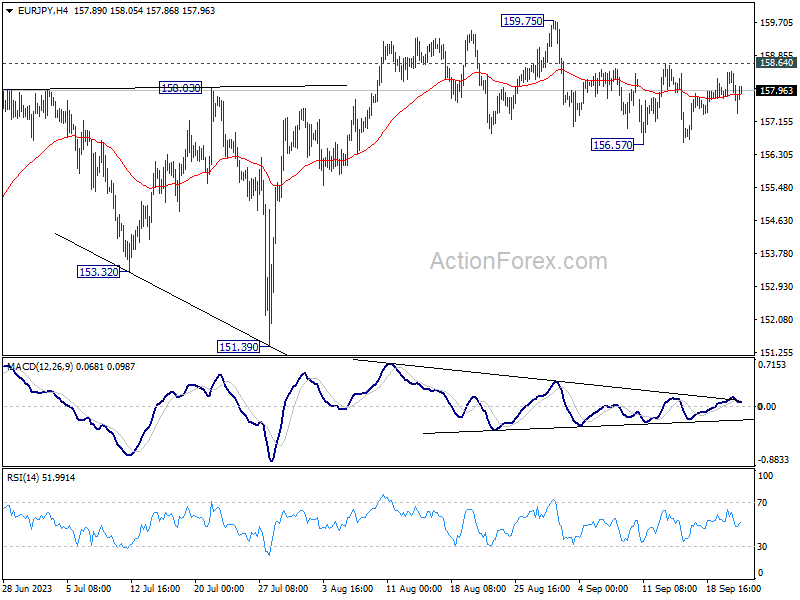
In the bigger picture, as long as 151.39 support holds, rise from 114.42 is still expected to continue. Next target is 100% projection of 124.37 to 148.38 from 139.05 at 163.06. Sustained break there will pave the way to retest long term resistance at 169.96.
GBP/JPY Daily Outlook
Daily Pivots: (S1) 182.62; (P) 182.98; (R1) 183.50; More...
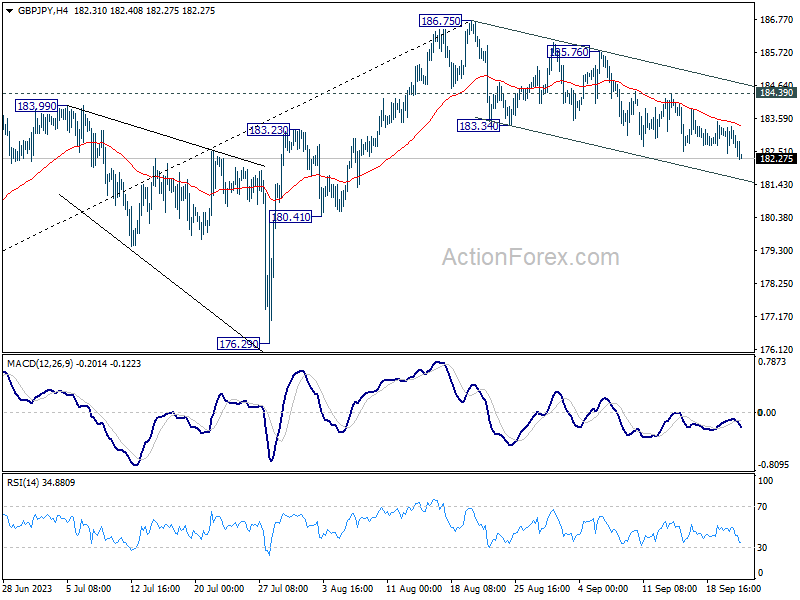
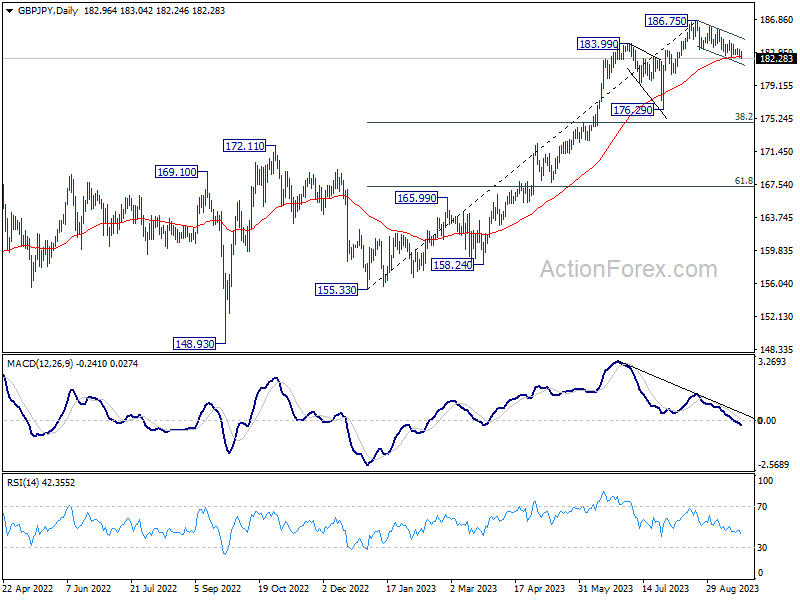
GBP/JPY's fall from 186.75 is in progress and intraday bias stays on the downside. Sustained trading below 55 D EMA (now at 182.49) will argue that it's already in a larger scale correction and target 176.29 support next. On the upside, break of 184.39 resistance will argue that the pull back from 186.75 has completed. Intraday bias will be turned back to the upside for 185.76 resistance next.
In the bigger picture, as long as 176.29 support holds, larger up trend from 123.94 (202 low) should still be in progress. Break of 186.75 will target 195.86 (2015 high). Nevertheless, firm break of 176.29 will confirm medium term topping, and turn outlook neutral for lengthier and deeper consolidations.
USD/CAD Daily Outlook
Daily Pivots: (S1) 1.3412; (P) 1.3446; (R1) 1.3495; More....
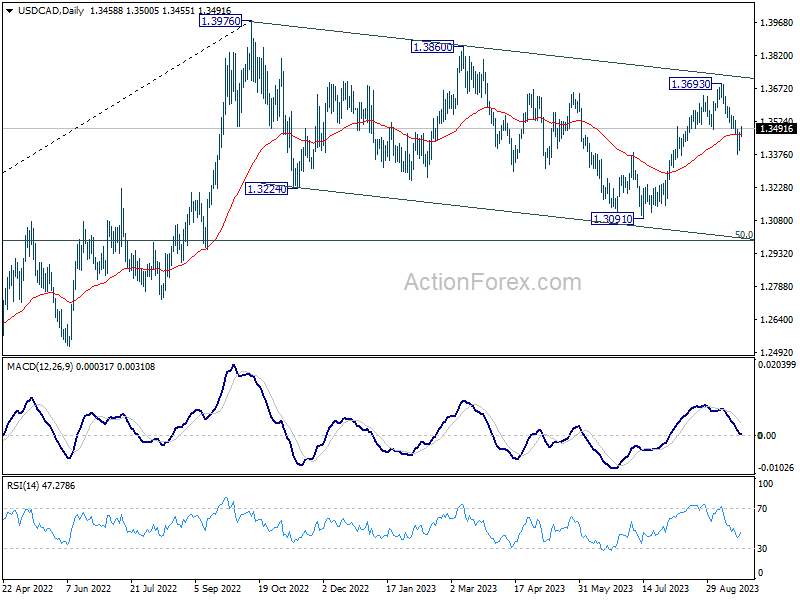
Intraday bias in USD/CAD is turned neutral for now, as it recovered after dipping to 1.3378. Some consolidations are expected by another fall is in favor. Below 1.3378 will target 61.8% retracement of 1.3091 to 1.3693 at 1.3321. Sustained break there will target 1.3091 support next. Nevertheless, break of 1.3548 resistance will turn bias back to the upside for 1.3693 resistance instead.
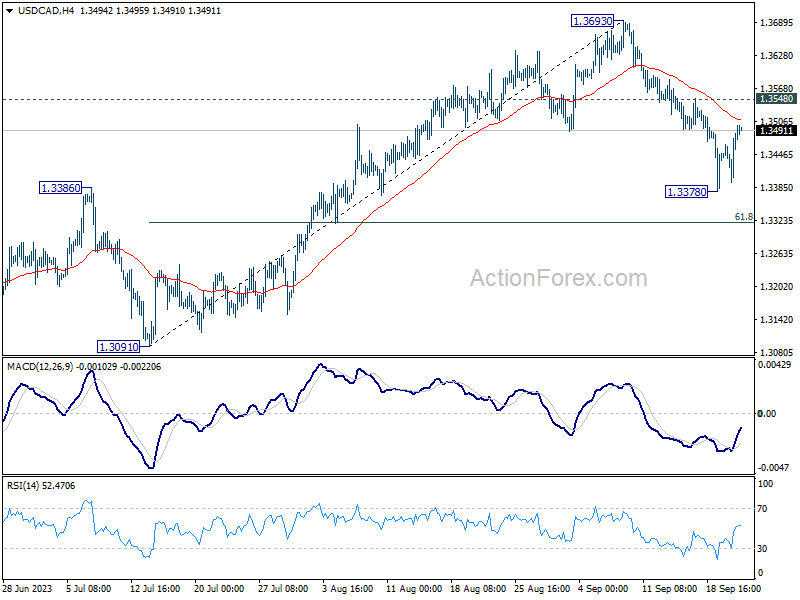
In the bigger picture, price actions from 1.3976 are viewed as a corrective pattern to the up trend from 1.2005 (2021 low). Deeper decline could be seen as the pattern is now extending. But downside should be contained by 50% retracement of 1.2005 to 1.3796 at 1.2991. Rise from 1.2005 is still expected to resume after the correction completes.