Sample Category Title
Cliff Notes: Policy Takes Effect, But Global Risks Remain
Key insights from the week that was.
The September RBA meeting minutes presented a detailed account of the Board’s deliberations and their assessment of risks. In recent months, the Board has stopped describing its considerations for policy – the choice between remaining on hold and a rate hike – as “finely balanced”. Rather, it has become increasingly clear that the Board view the case for remaining on hold as the “stronger” argument, in step with their growing confidence in navigating a soft landing. While the Board still conclude that “some further tightening in policy may be required should inflation prove more persistent than expected”, the hurdle for the Q3 CPI report or interim Monthly CPI Indicators to raise alarm is high. Westpac remains of the view that the RBA will remain on hold until August 2024 when we see the next rate cutting cycle begin, to restore balance to demand conditions and support growth’s return towards trend.
The Q3 Westpac-ACCI Survey of Industrial Trends demonstrated that the RBA’s rapid tightening cycle is having a material impact on Australian industry. At 51.3, the Westpac-ACCI Actual Composite signals conditions are approaching stall speed. Indeed, that new orders growth held flat for a second consecutive quarter and is now the number one concern of manufacturers is consistent with the marked slowing of the Australian economy. Within this context, firms report there is little incentive to grow their workforce or lift their investment intentions despite an easing in labour and material shortages. Overall, the tone of the survey remains broadly downbeat, with expectations for future activity in the sector subdued – adding to the case for the RBA to remain on hold.
Central bank meetings dominated the news offshore.
The FOMC kept the fed funds rate at 5.375%; however, the dot plot suggests most members expect the data to justify one last hike before the end of the year. During Q&A, Chair Jerome Powell said 'we need to see more progress' when speaking to why they felt a further hike could be on the cards. On balance, the FOMC expects the upside surprise to growth currently being experienced in 2023 to persist into 2024, the GDP forecast for next year revised up from 1.1% to 1.5%. The unemployment rate is also only expected to lift at the margin from now to end-2024, from 3.8% to 4.1%, while PCE inflation is expected to only slowly trend down to 2.5% at end-2024. Consequently, the FOMC now expects only 50bps of cuts in 2024 from 5.625% at end-2023.
While they do anticipate a further reduction in inflation and the fed funds rate in 2025 and 2026, it is again expected to be slow going and still leaves the fed funds rate above their longer run estimate of neutral, 2.5%. We see the US economy disappointing the FOMC’s expectations in coming months and so anticipate an earlier and larger start to the cutting cycle, pencilling in 100bps of rate cuts in 2024 versus the FOMC's 50bps. However, we also perceive greater inflation risks in the out years and so, at 3.375%, our end-2025 fed funds forecast is also materially above the FOMC’s 2.5% ‘longer run’ figure. In our view, these inflation risks are likely to primarily be structural rather than cyclical, limiting the effectiveness of policy and, at the margin, creating greater risk for activity growth and the labour market. Highlighting this, through 2025, we see the unemployment rate holding around 5.0% and GDP growth remaining below trend.
Overnight, the Bank of England paused for the first time since they started hiking in 2021 in a divided vote -- five voted to remain on hold, while four voted to hike. The pause came as a surprise to economists, but market pricing had drawn much closer to the final result after the last CPI release. In August, annual inflation growth fell to 6.7%yr as the monthly gain only partially made up for July’s fall, bringing the three-month average to flat. The contribution from services nudged down to 3.2% -- just under half of total CPI. Goods also decelerated further, much to the surprise of the BoE. August was the second month that headline CPI undershot the BoE's forecast of 6.93% for Q3 (July's print was an undershoot at the second decimal place). Higher fuel costs have been observed in inflation prints in US and Europe, but they did not add as much pressure to the headline print for the UK in monthly terms and were a dampening influence in the annual print. Reports suggest this may be a result of a more delayed response to the spike in oil prices. Overall, the percentage of the CPI basket running above the BoE's 2% target has trickled down to 81% over July and August.
In addition to the weaker-than-expected CPI, the Committee was concerned about the growth outlook following a 0.5%mth decline in GDP in July. This followed other indicators which suggest weaker growth can be expected in the near term. Strong wages growth had seen economists anticipate further hikes. However, while the Average Weekly Earnings figures continue to overshoot the Bank's forecasts, they were characterised as “difficult to reconcile with other indicators of pay growth”. The Decision Maker Panel data, frequently referenced by Governor Andrew Bailey, suggests wages growth has been stable at 5%. As such, the Committee will be looking at broader measures of wages ahead.
The statement noted that the current stance was “restrictive” and that “Further tightening in monetary policy would be required if there were evidence of more persistent inflationary pressures”. Before the November meeting, we will get two CPI prints and another wages read which may allay or fuel the hawks' fears. Hawk Sir Jon Cunliffe will also be leaving and BoE internal Sarah Breeden arriving. Breeden has said she will have a more 'balanced' approach to monetary policy.
Across the Tasman, New Zealand's Q2 GDP rose 0.9%qtr, materially above the market’s and RBNZ’s expectation but in line with our New Zealand team’s view. The technical recession through December and March quarters was also revised away and puts the economy 0.5% larger than the RBNZ expected in August. Given the revisions and Q2 GDP print, we continue to expect the RBNZ to hike once more by year end. The market is also coming to this view, although it is currently priced for this last hike to occur in early-2024.
Technical Outlook and Review
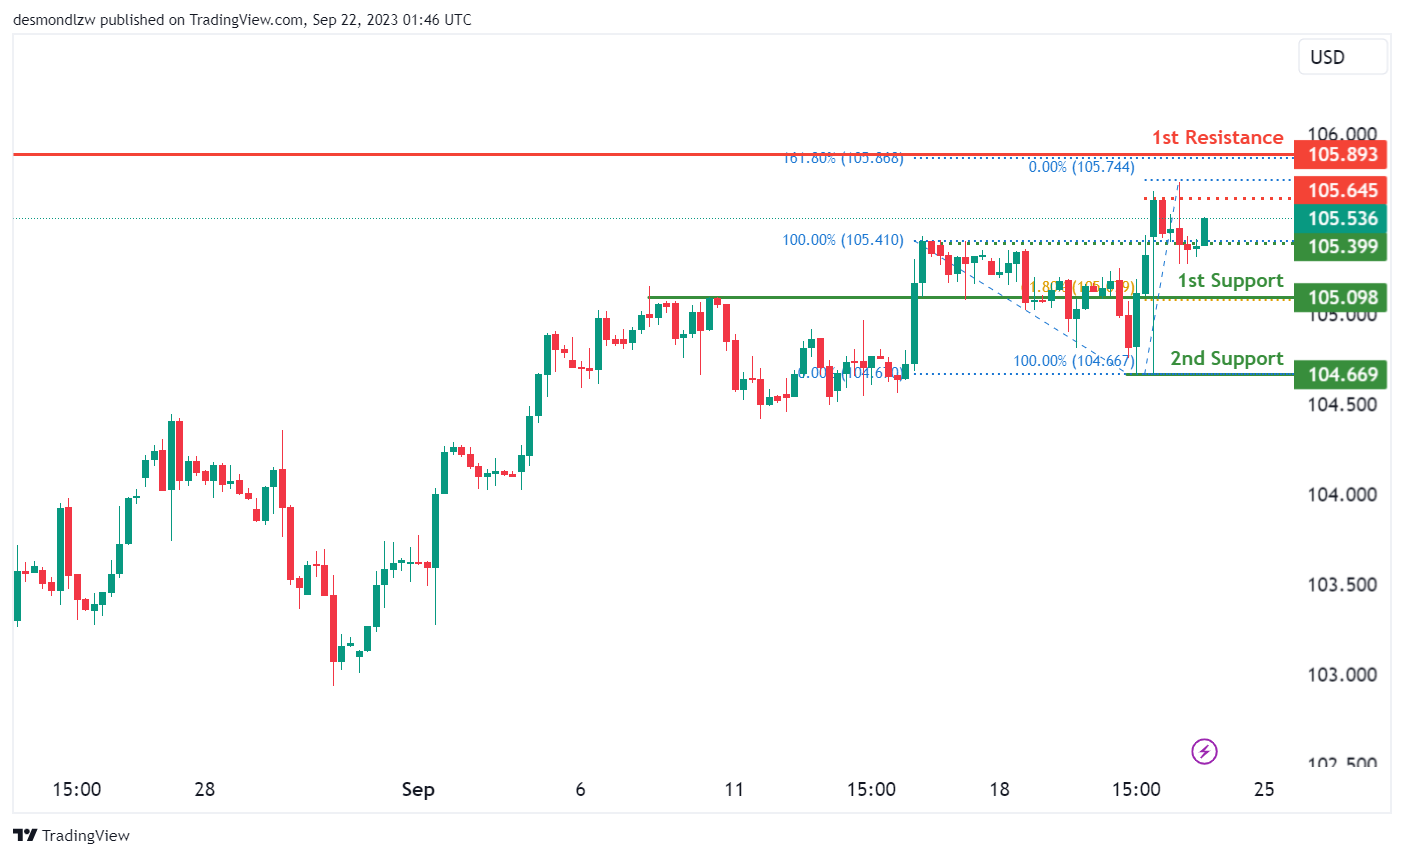
DXY:
The DXY (US Dollar Index) chart currently shows a bullish overall momentum, supported by several technical factors. This bullish sentiment indicates a potential scenario where the price could continue its upward movement towards the 1st resistance level.
The 1st support level at 105.09 is considered a strong potential support zone, with an overlapping support and the presence of the 61.80% Fibonacci Retracement, suggesting its significance as a potential area where price might find support. Additionally, the 2nd support at 104.66 is identified as a swing low support, further reinforcing its importance as a potential support level.
On the resistance side, the 1st resistance level at 105.89 is characterized as a swing high resistance. Traders and investors should closely monitor this level, as it may act as a point of resistance in the ongoing bullish trend. Furthermore, the intermediate resistance at 105.64 is marked as a swing high resistance, emphasizing its potential significance.
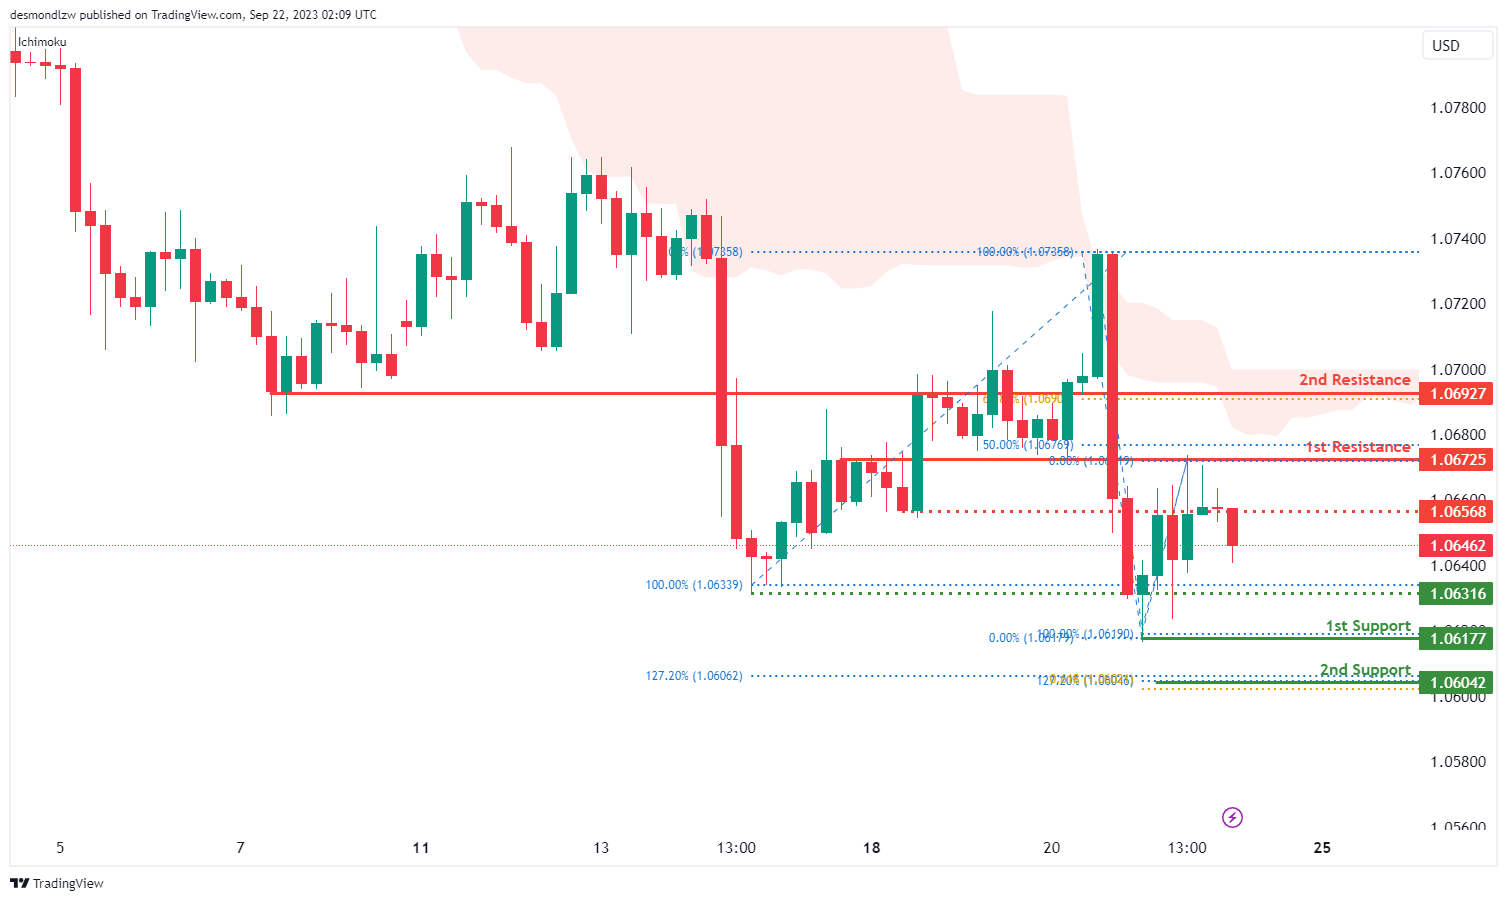
EUR/USD:
The EUR/USD chart currently exhibits a bearish overall momentum, and several factors contribute to this bearish sentiment. Price is notably below the bearish Ichimoku cloud, indicating a strong bearish bias. In this context, there is a potential scenario where the price could continue its bearish movement towards the 1st support level.
The 1st support at 1.0617 is considered a significant support zone, marked as a swing low support. This level is reinforced by the presence of the 127.20% Fibonacci Extension and the 61.80% Fibonacci Projection, indicating Fibonacci confluence and further highlighting its potential importance.
The 2nd support at 1.0604 is another notable level, as it coincides with the 127.20% Fibonacci Extension and the 61.80% Fibonacci Projection, suggesting additional confluence and potential support.
On the resistance side, the 1st resistance at 1.0672 is characterized as an overlap resistance with the presence of the 50% Fibonacci Retracement, signifying its potential significance. The 2nd resistance at 1.0692 is identified as a pullback resistance, with the 61.80% Fibonacci Retracement, further reinforcing its potential as a resistance point. Additionally, the intermediate resistance at 1.0656 is marked as an overlap resistance.
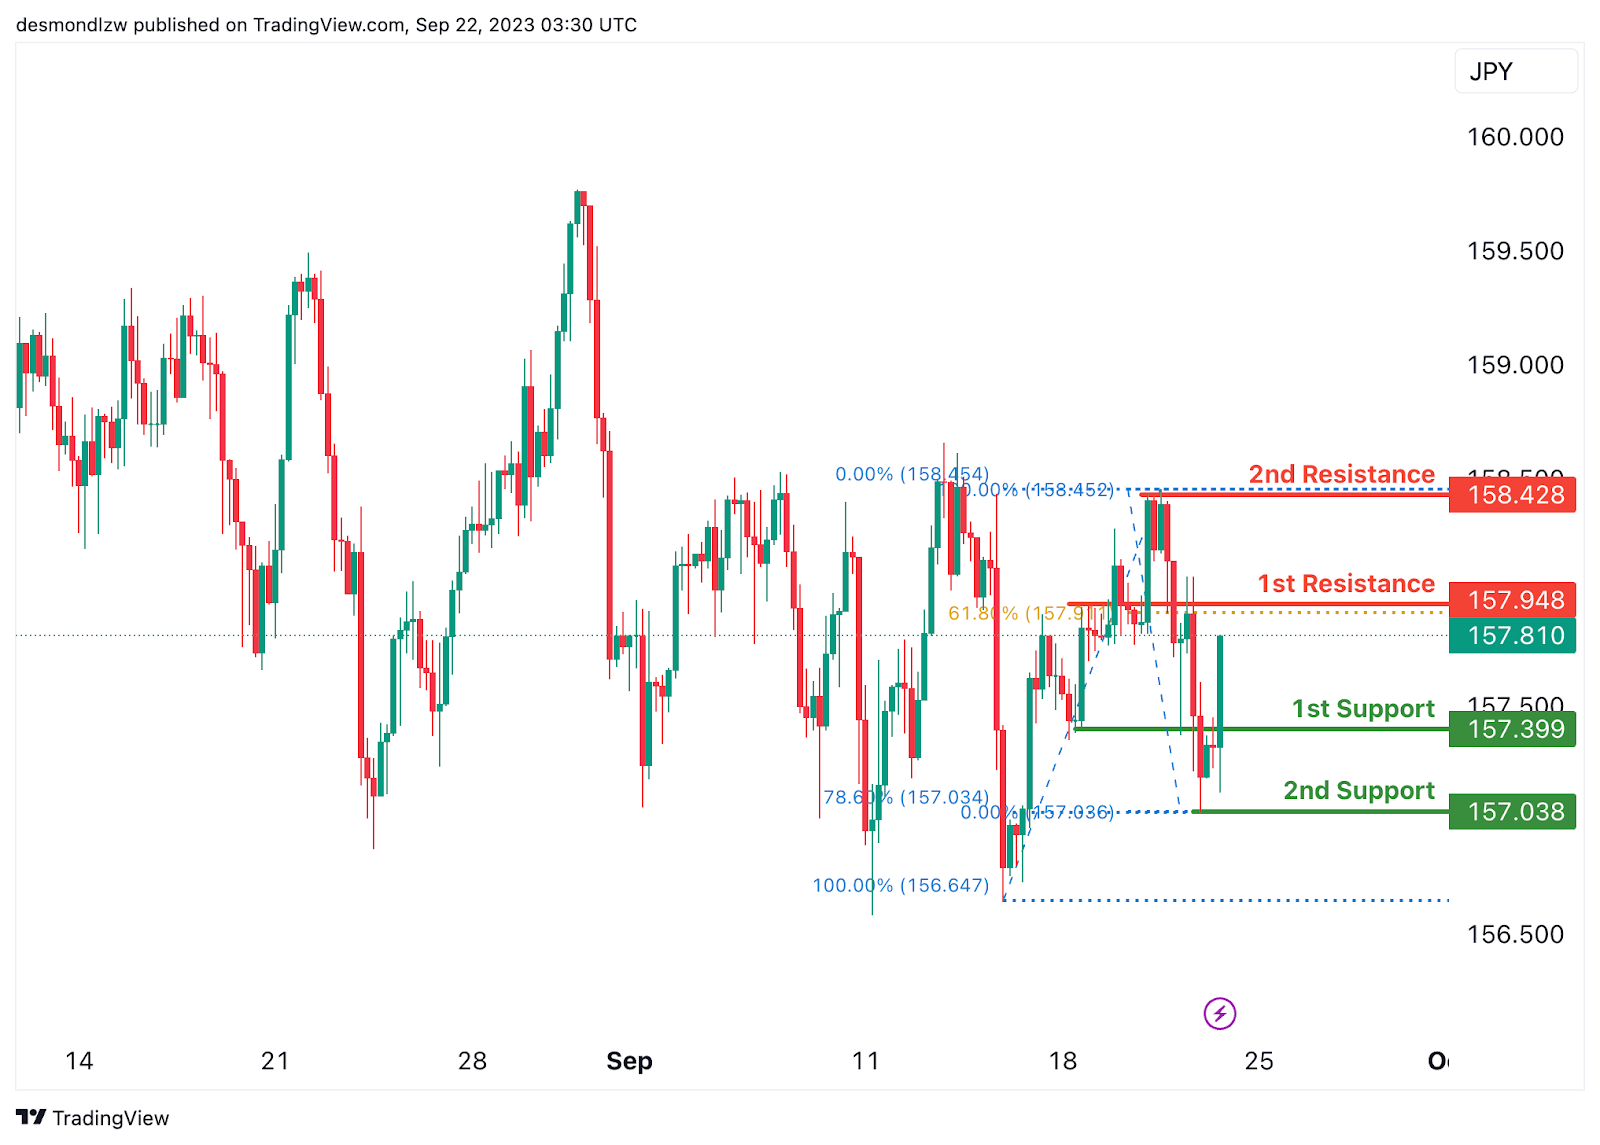
EUR/JPY:
The instrument EUR/JPY currently suggests a bearish overall momentum on the chart, and there’s potential for a short-term rise towards the 1st resistance before reversing off it and dropping towards the 1st support.
The 1st support at 157.39 is considered good due to its nature as a pullback support.
The 2nd support at 157.03 is also notable as it acts as a swing low support and is associated with the 78.60% Fibonacci Retracement, providing an additional layer of potential support.
On the resistance side, we have the 1st resistance at 157.94, which is significant because it represents an overlap resistance and is linked to the 61.80% Fibonacci Retracement.
Meanwhile, the 2nd resistance at 158.42 is noteworthy as it functions as a swing high resistance, suggesting a potential point where the price may reverse its short-term rise and start to drop.
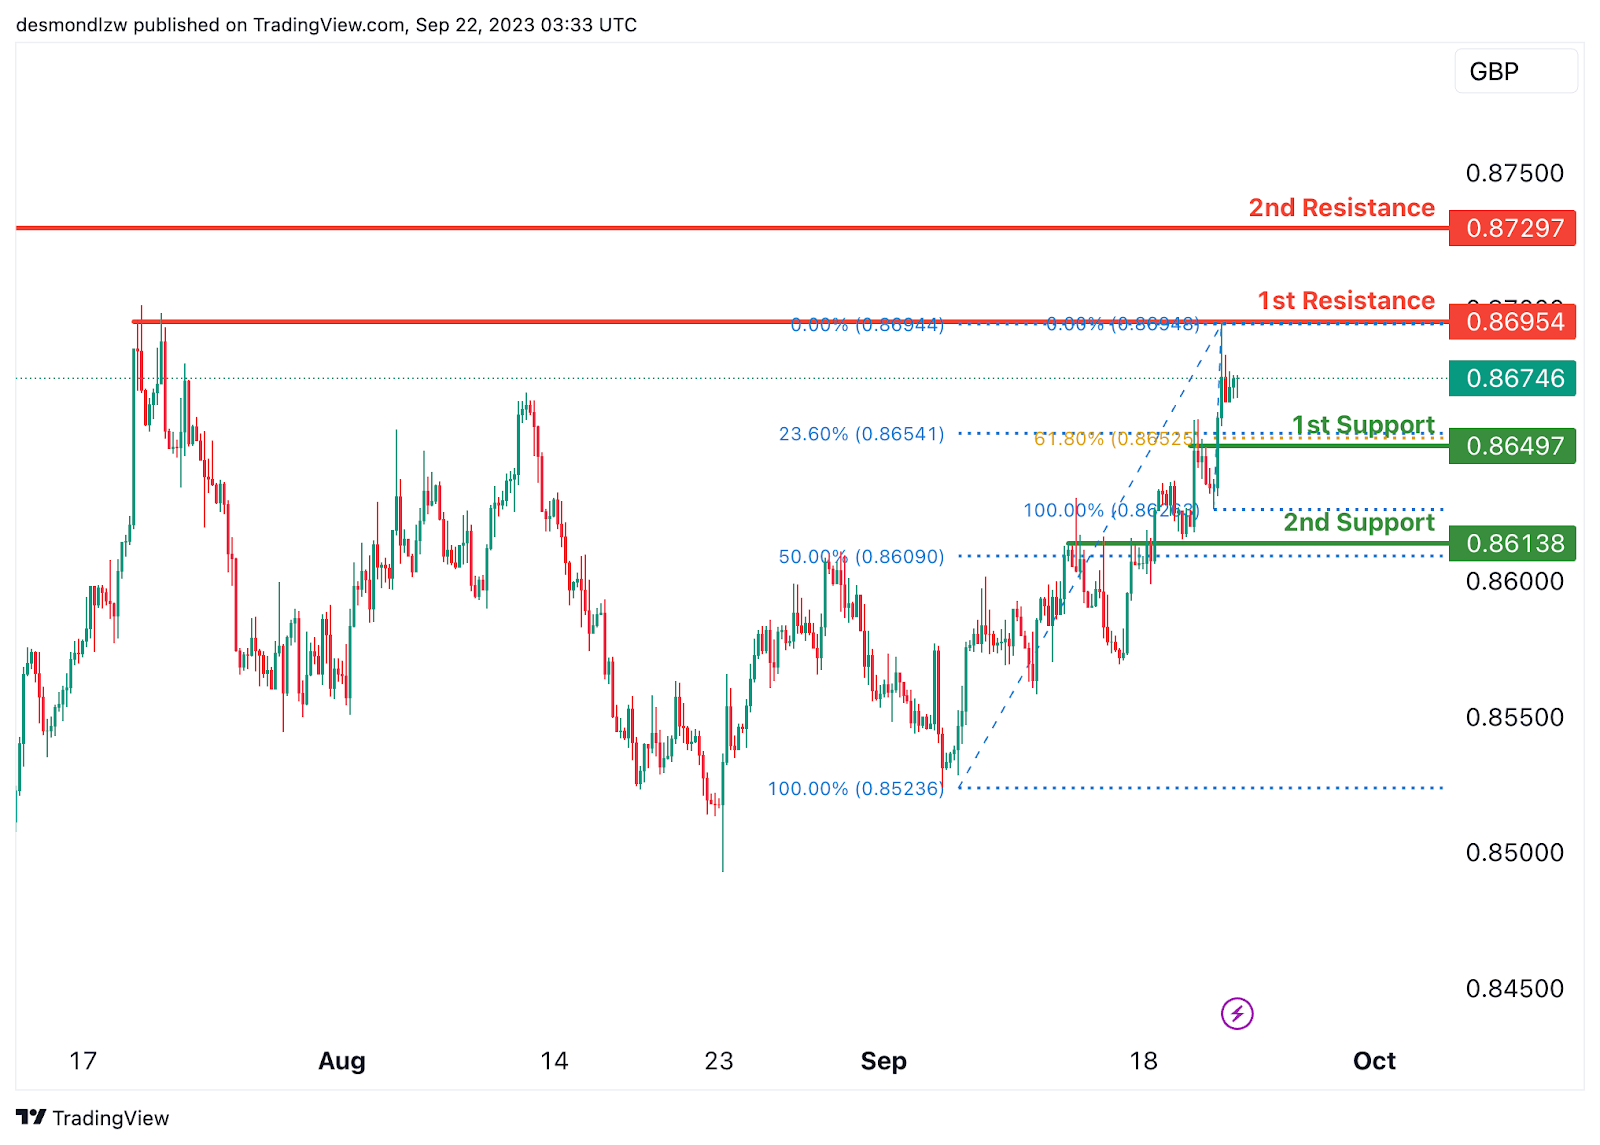
EUR/GBP:
The instrument EUR/GBP currently indicates a bullish overall momentum on the chart, and there’s potential for a bullish continuation towards the 1st resistance at 0.8695.
The 1st support at 0.8649 is considered strong due to its nature as a pullback support, and it’s associated with both the 61.80% Fibonacci Retracement and the 23.60% Fibonacci Retracement, indicating a Fibonacci confluence. This makes it a robust level of potential support.
The 2nd support at 0.8613 is also notable as it acts as another pullback support, and it’s linked to the 50% Fibonacci Retracement, offering an additional layer of potential support.
On the resistance side, we have the 2nd resistance at 0.8729, which is significant because it represents an overlap resistance.
The 1st resistance at 0.8695 is also considered good as it represents a multi-swing high resistance, suggesting potential barriers to further bullish movement at these levels.
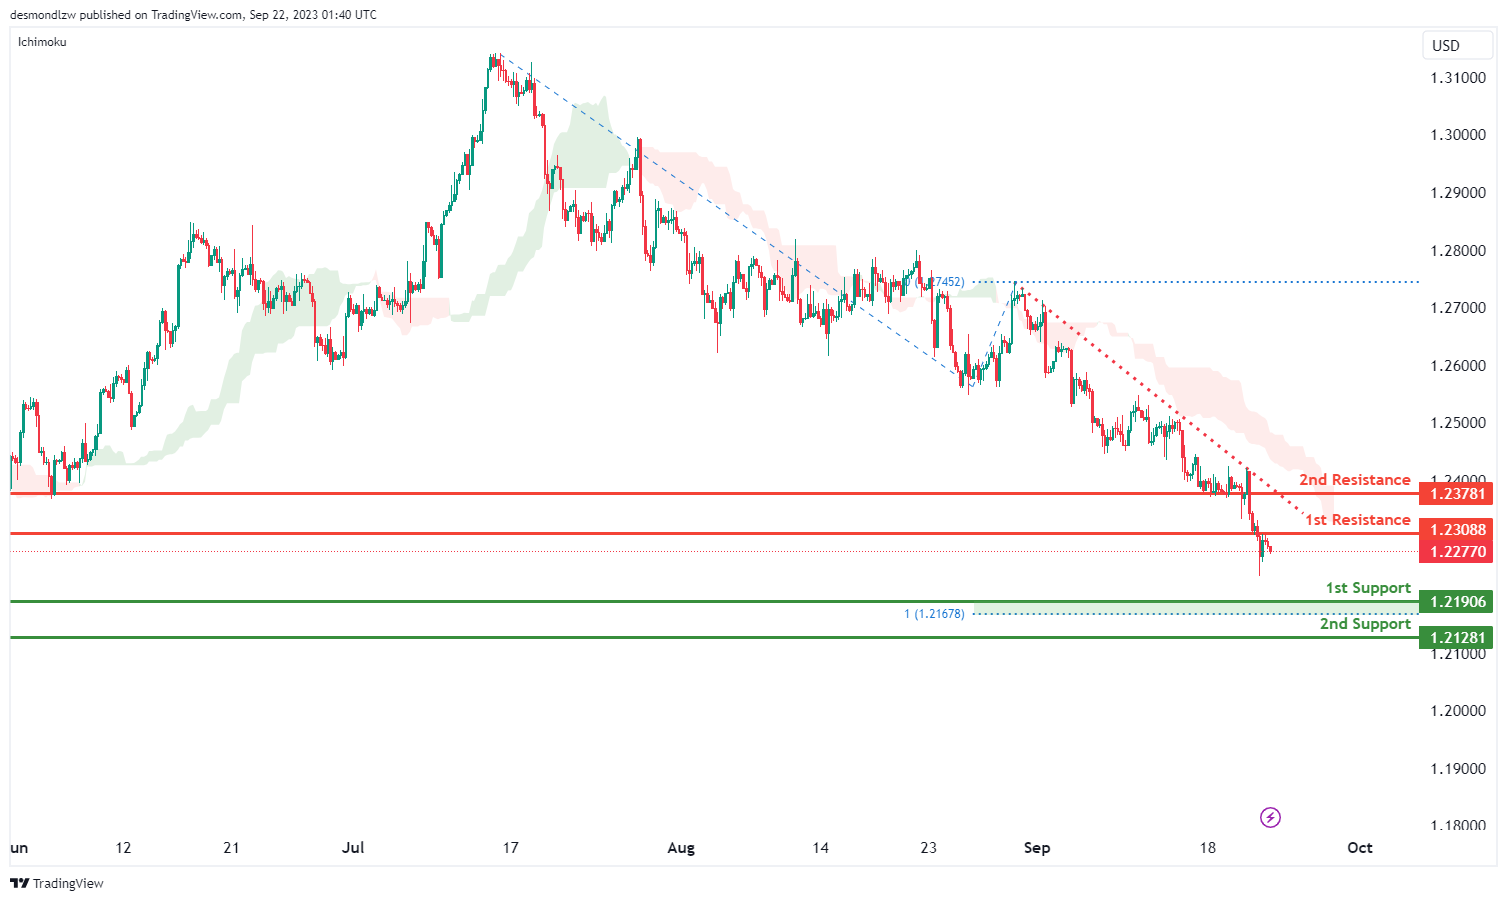
GBP/USD:
The GBP/USD chart currently maintains a bearish overall momentum, with several factors contributing to this bearish sentiment. One significant factor is that the price is trading below a major descending trend line, which acts as a resistance level and suggests the presence of bearish momentum.
In this context, there is a potential scenario where the price could continue its bearish movement towards the 1st support level, which is marked at 1.219. This support level is considered significant, as it coincides with the 100% Fibonacci Projection, indicating its potential importance as a support zone.
The 2nd support at 1.2126 is another notable level, marked as an overlap support, further reinforcing its potential as a support zone.
On the resistance side, the 1st resistance at 1.2308 is characterized as an overlap resistance, which may act as a barrier to any potential upward movements. The 2nd resistance at 1.2378 is identified as a pullback resistance, signifying its potential significance as a point of reversal or resistance.
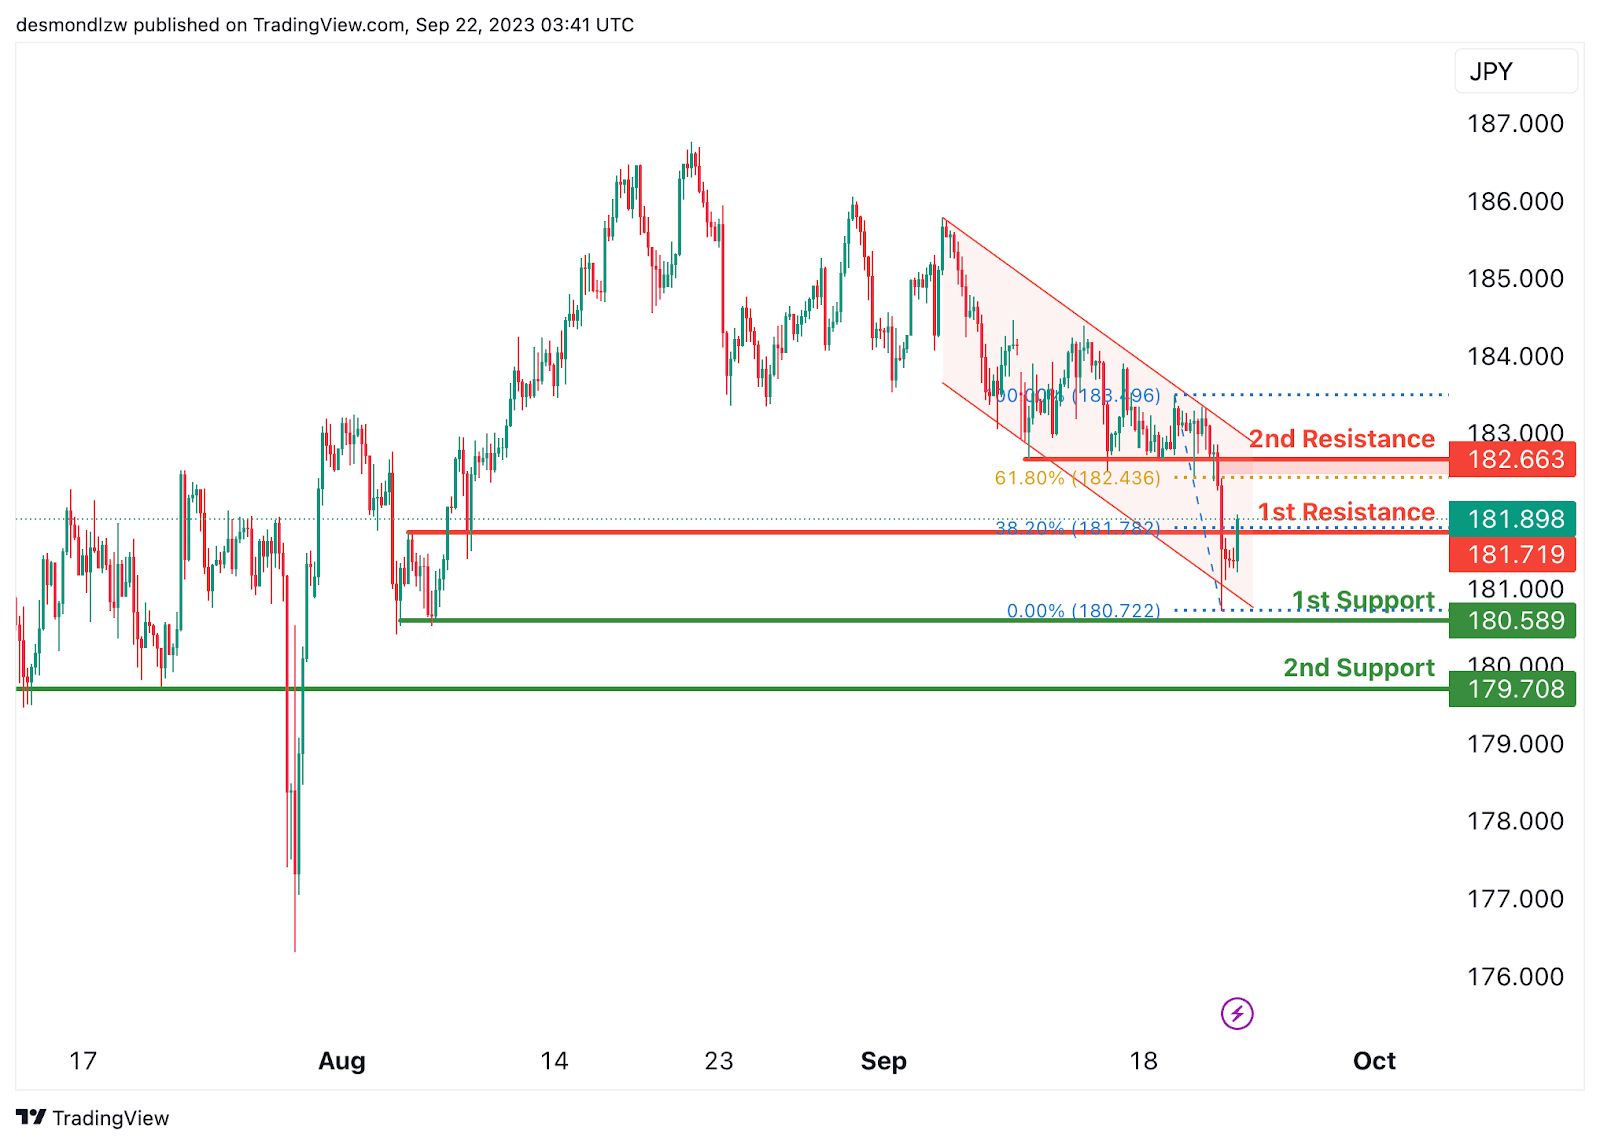
GBP/JPY:
The instrument GBP/JPY currently has a bearish overall momentum on the chart, with the price being in a bearish descending channel. There’s potential for a short-term rise towards the 1st resistance before reversing off it and dropping towards the 1st support.
The 1st support at 180.58 is considered good due to its nature as a multi-swing low support, providing a solid level of potential support.
The 2nd support at 179.70 is also noteworthy as it acts as a pullback support, offering an additional layer of potential support.
On the resistance side, we have the 1st resistance at 181.71, which is significant because it represents a pullback resistance and is associated with the 38.20% Fibonacci Retracement.
Similarly, the 2nd resistance at 182.66 is also a pullback resistance, suggesting potential barriers to further bullish movement at these levels.
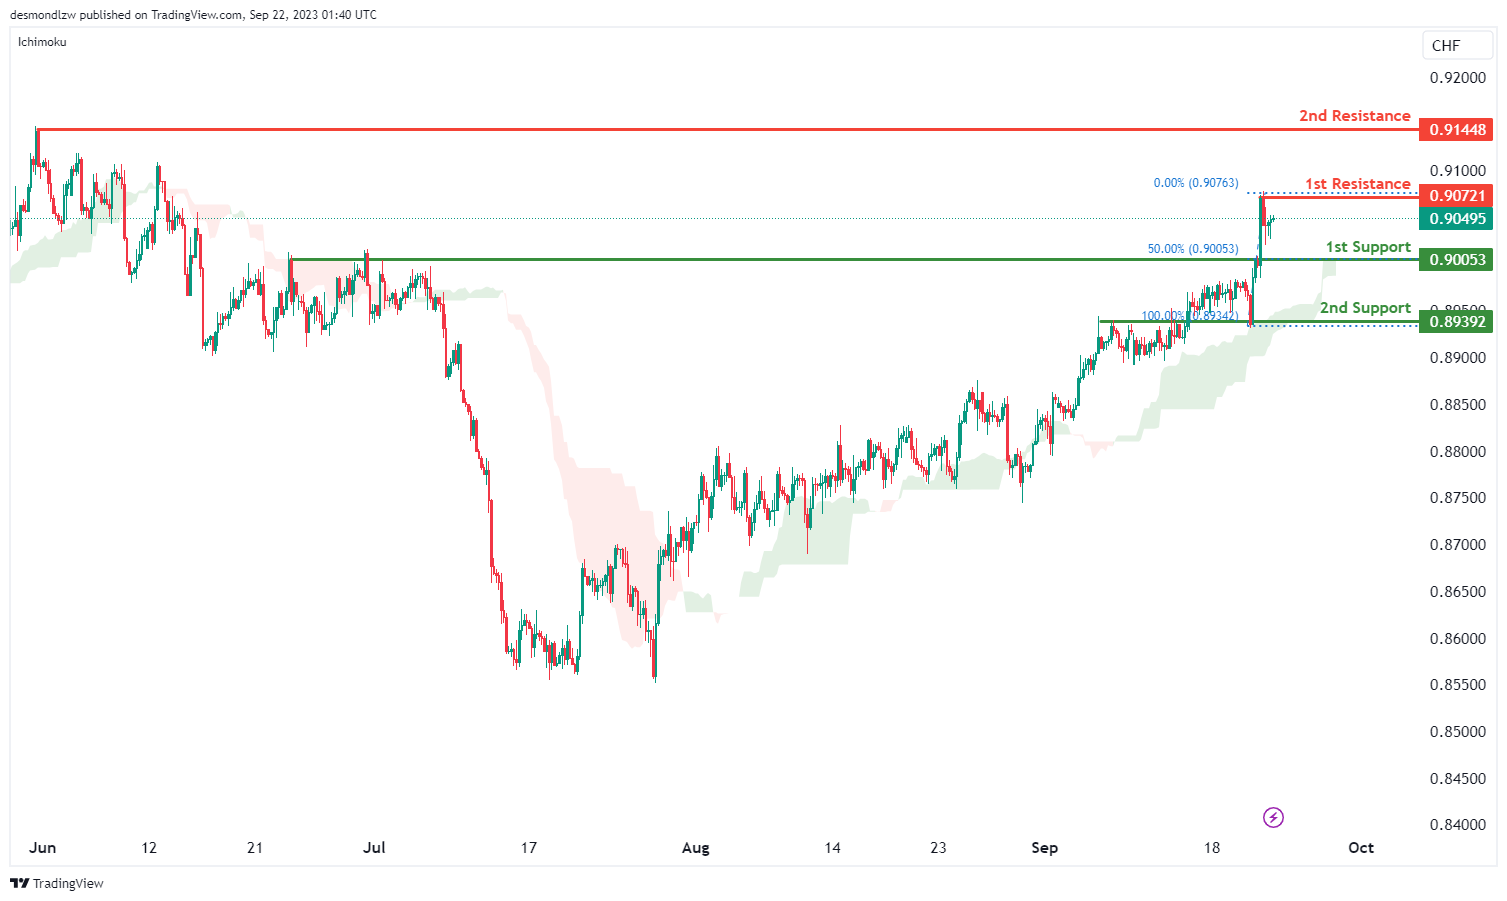
USD/CHF:
The USD/CHF chart currently exhibits a bullish overall momentum, with the following factors contributing to this bullish sentiment: the price is trading above the bullish Ichimoku cloud, suggesting a favorable environment for further bullish movements.
In this context, there is a potential scenario where the price could continue its bullish trajectory towards the 1st resistance level at 0.9072. This resistance level is characterized as a swing high resistance, which may act as a barrier to any potential upward movements.
On the support side, the 1st support at 0.9005 is identified as a pullback support and is marked at the 50% Fibonacci Retracement level, indicating its potential significance as a support zone. The 2nd support at 0.8939 is marked as an overlap support, further reinforcing its importance as a potential support level.
USD/JPY:
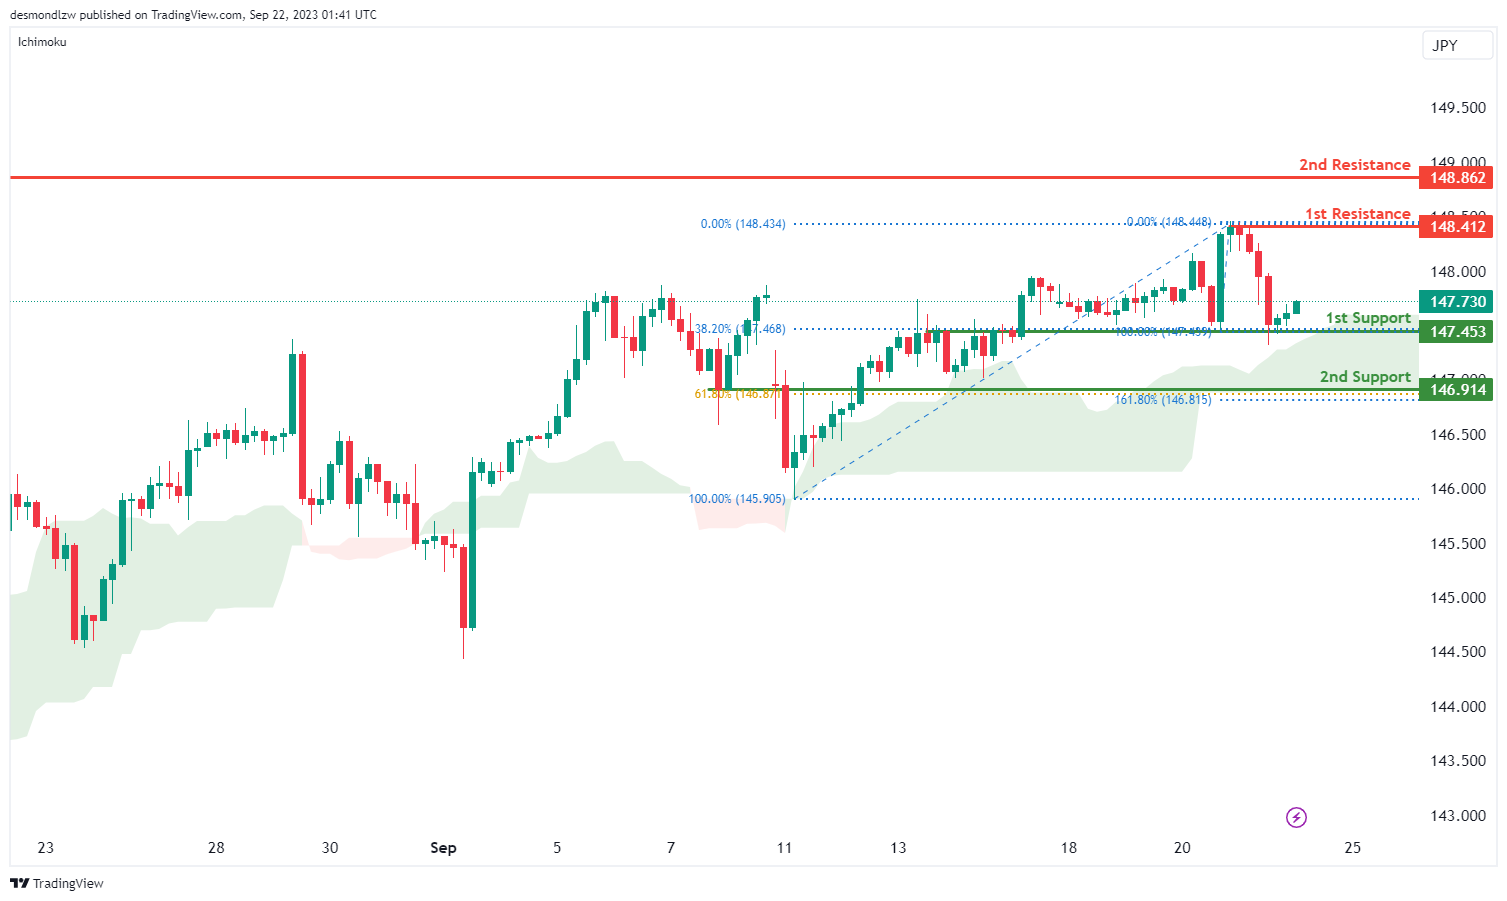
The USD/JPY chart currently exhibits a bullish overall momentum, and this bullish sentiment is attributed to the price trading above a major ascending trend line, suggesting the potential for further bullish movements.
In this context, there’s a potential scenario where the price could continue its bullish trajectory towards the 1st resistance level at 148.41. This resistance level is characterized as a swing high resistance, which may act as a barrier to any potential upward movements.
On the support side, the 1st support at 147.45 is identified as an overlap support and is marked at the 38.20% Fibonacci Retracement level, indicating its potential significance as a support zone. The 2nd support at 146.91 is marked as an overlap support and is significant due to the confluence of the 61.80% Fibonacci Retracement and the 161.80% Fibonacci Extension.
USD/CAD:
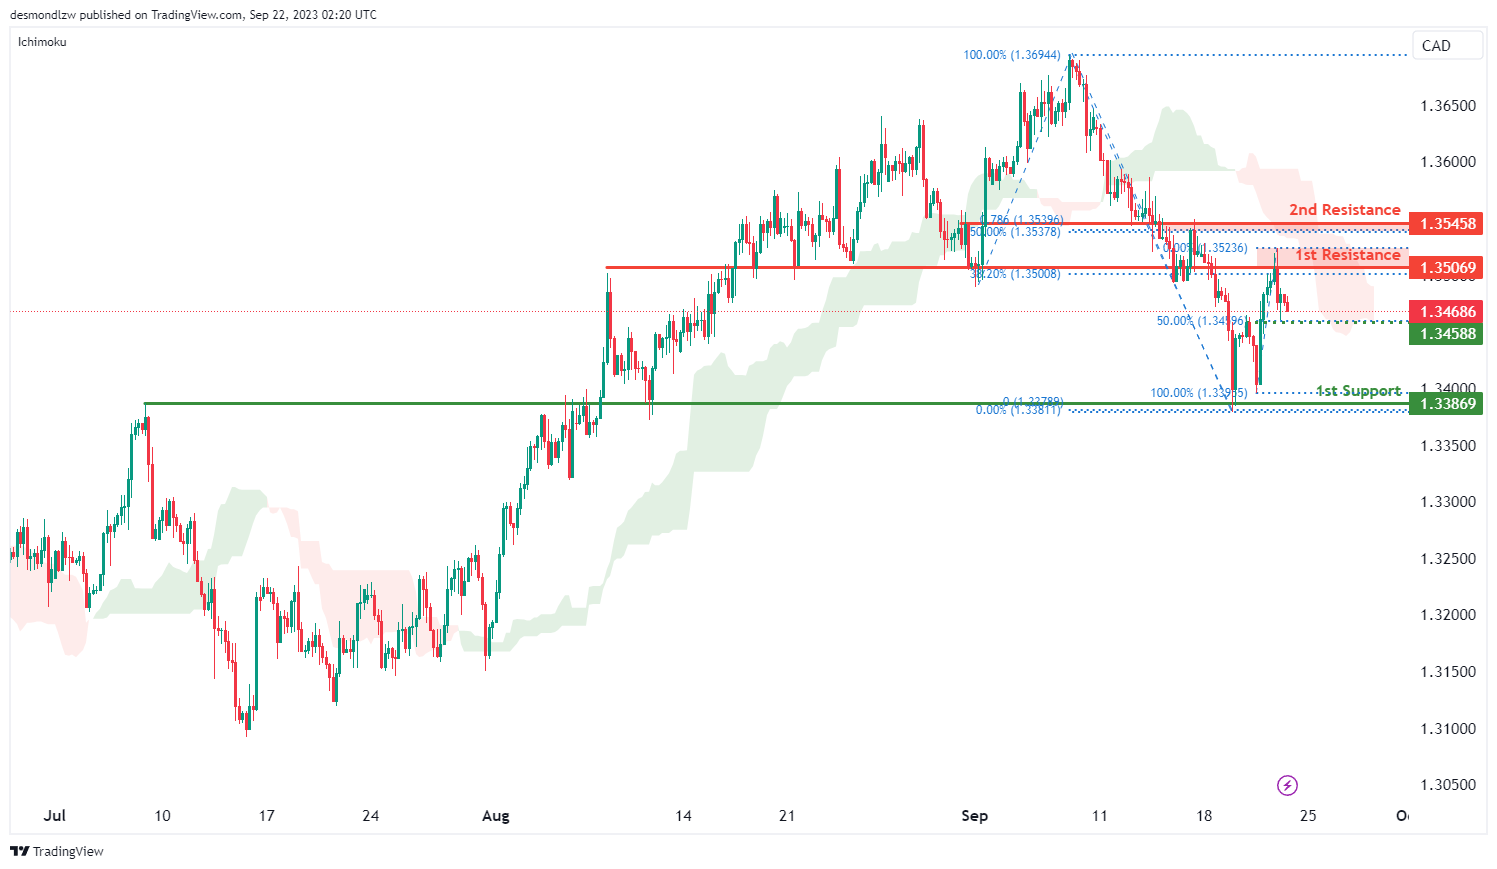
The USD/CAD chart is currently exhibiting an overall bearish momentum, indicating an downward trend with price making a bearish continuation towards the 1st support level should price break below the intermediate support at 1.3459 which is identified as a pullback support that aligns with the 50.00% Fibonacci retracement level.
The 1st support level at 1.3387 is identified as an overlap support, holding significance as a potential support zone.
To the upside, the 1st resistance level at 1.3507 is identified as an overlap resistance that aligns with the 38.20% Fibonacci retracement level. Furthermore, the 2nd resistance level at 1.3549 is marked as a pullback resistance that aligns with a confluence of Fibonacci levels i.e. the 50.00% retracement and the 78.60% projection levels.
AUD/USD:
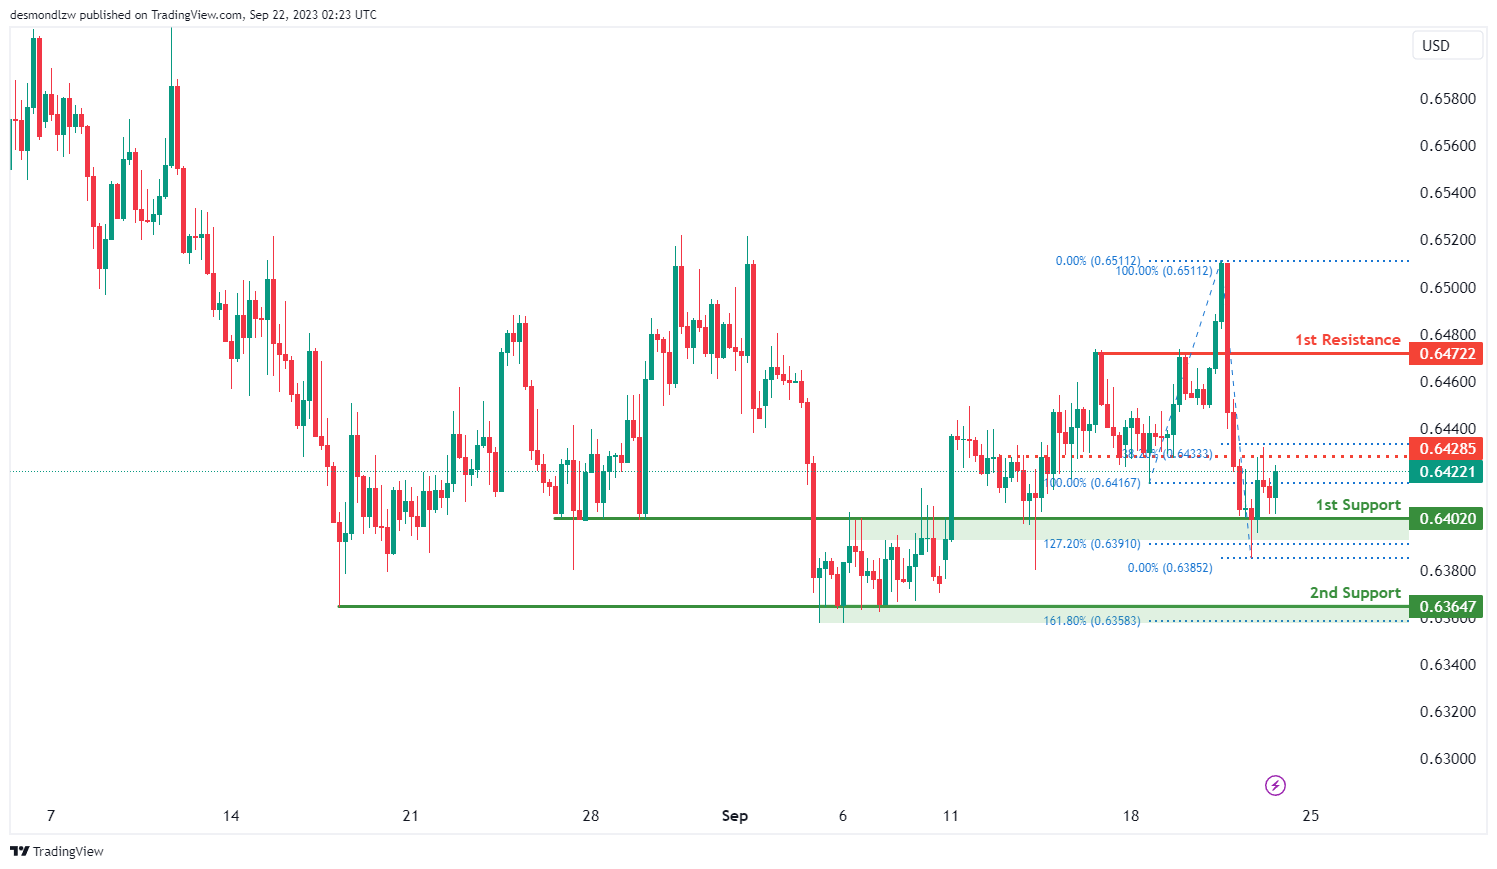
The AUD/USD chart is currently displaying an overall bullish momentum, suggesting a bullish continuation towards the 1st resistance level should price break above the intermediate resistance at 0.6429 which is identified as an overlap resistance that aligns with the 38.20% Fibonacci retracement level.
The 1st resistance level at 0.6472 is noted as a pullback resistance, representing a potential area where price might encounter resistance.
To the downside, the 1st support level at 0.6402 is identified as an overlap support that aligns with the 127.20% Fibonacci extension level. Furthermore, the 2nd support level at 0.6365 is marked as a pullback support that coincides with the 161.80% Fibonacci extension level.
NZD/USD
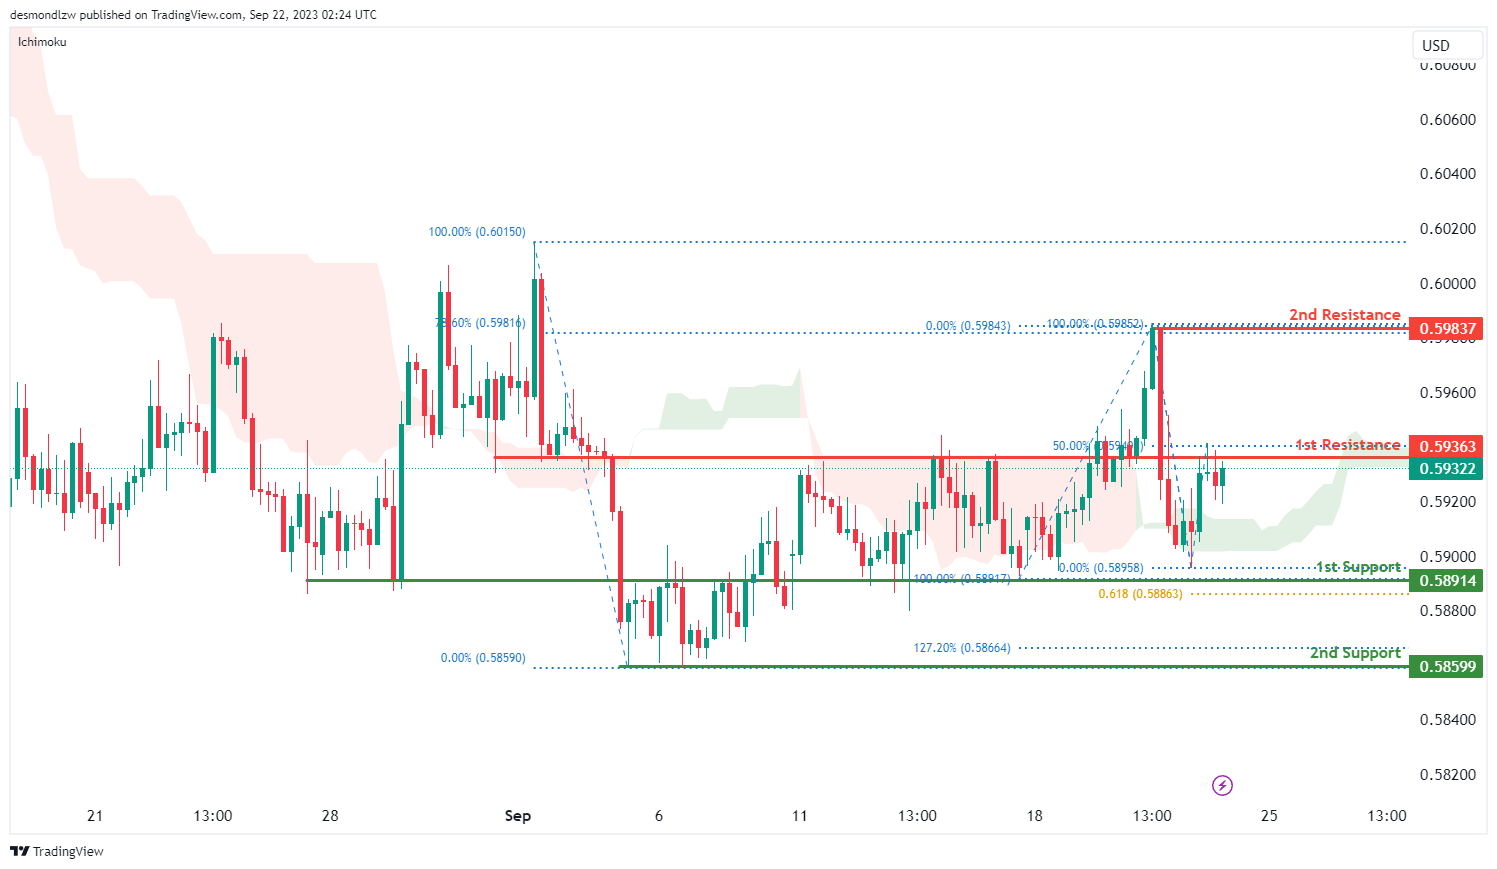
The NZD/USD chart is currently displaying an overall bullish momentum, suggesting a bullish continuation towards the 1st resistance level.
The 1st resistance level at 0.5936 is identified as an overlap resistance that aligns with the 50.00% Fibonacci retracement level while the 2nd resistance level at 0.5984 is marked as a swing-high resistance that aligns with the 78.60% Fibonacci retracement level.
To the downside, the 1st support level at 0.5891 is identified as an overlap support that aligns with the 61.80% Fibonacci projection level. Additionally, the 2nd support level at 0.5859 is noted as a pullback support that coincides with the 127.20% Fibonacci extension level.
DJ30:
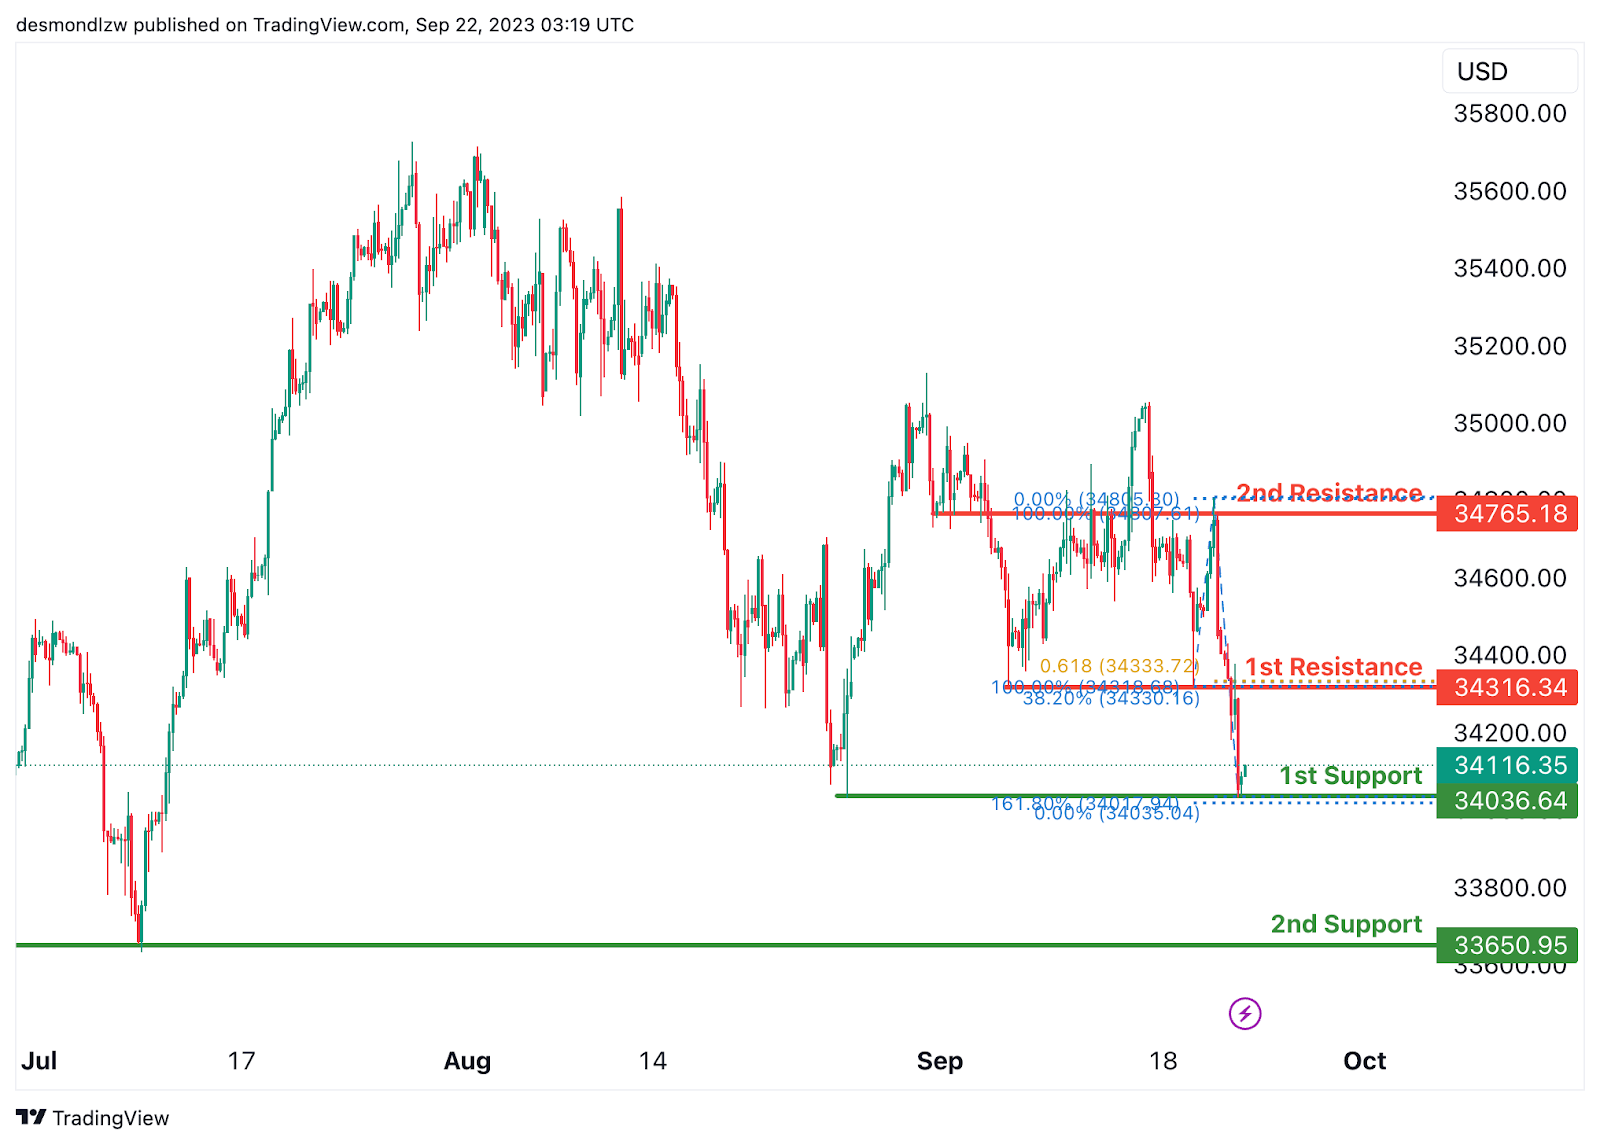
The instrument DJ30 currently shows a bullish overall momentum on the chart, and there’s potential for a bullish continuation towards the 1st resistance at 34316.34. This resistance level is considered strong due to its nature as a pullback resistance and its association with both the 61.80% Fibonacci Projection and the 38.20% Fibonacci Retracement, indicating a Fibonacci confluence.
The 1st support at 34036.64 is also noteworthy as it acts as a multi-swing low support and is associated with the 161.80% Fibonacci Extension, providing a strong level of potential support.
The 2nd support at 33650.95 is considered good as well, as it represents another multi-swing low support, offering an additional layer of potential support.
On the resistance side, we have the 2nd resistance at 34765.18, which is significant because it represents an overlap resistance, indicating a potential barrier to further bullish movement at this level.
GER30:
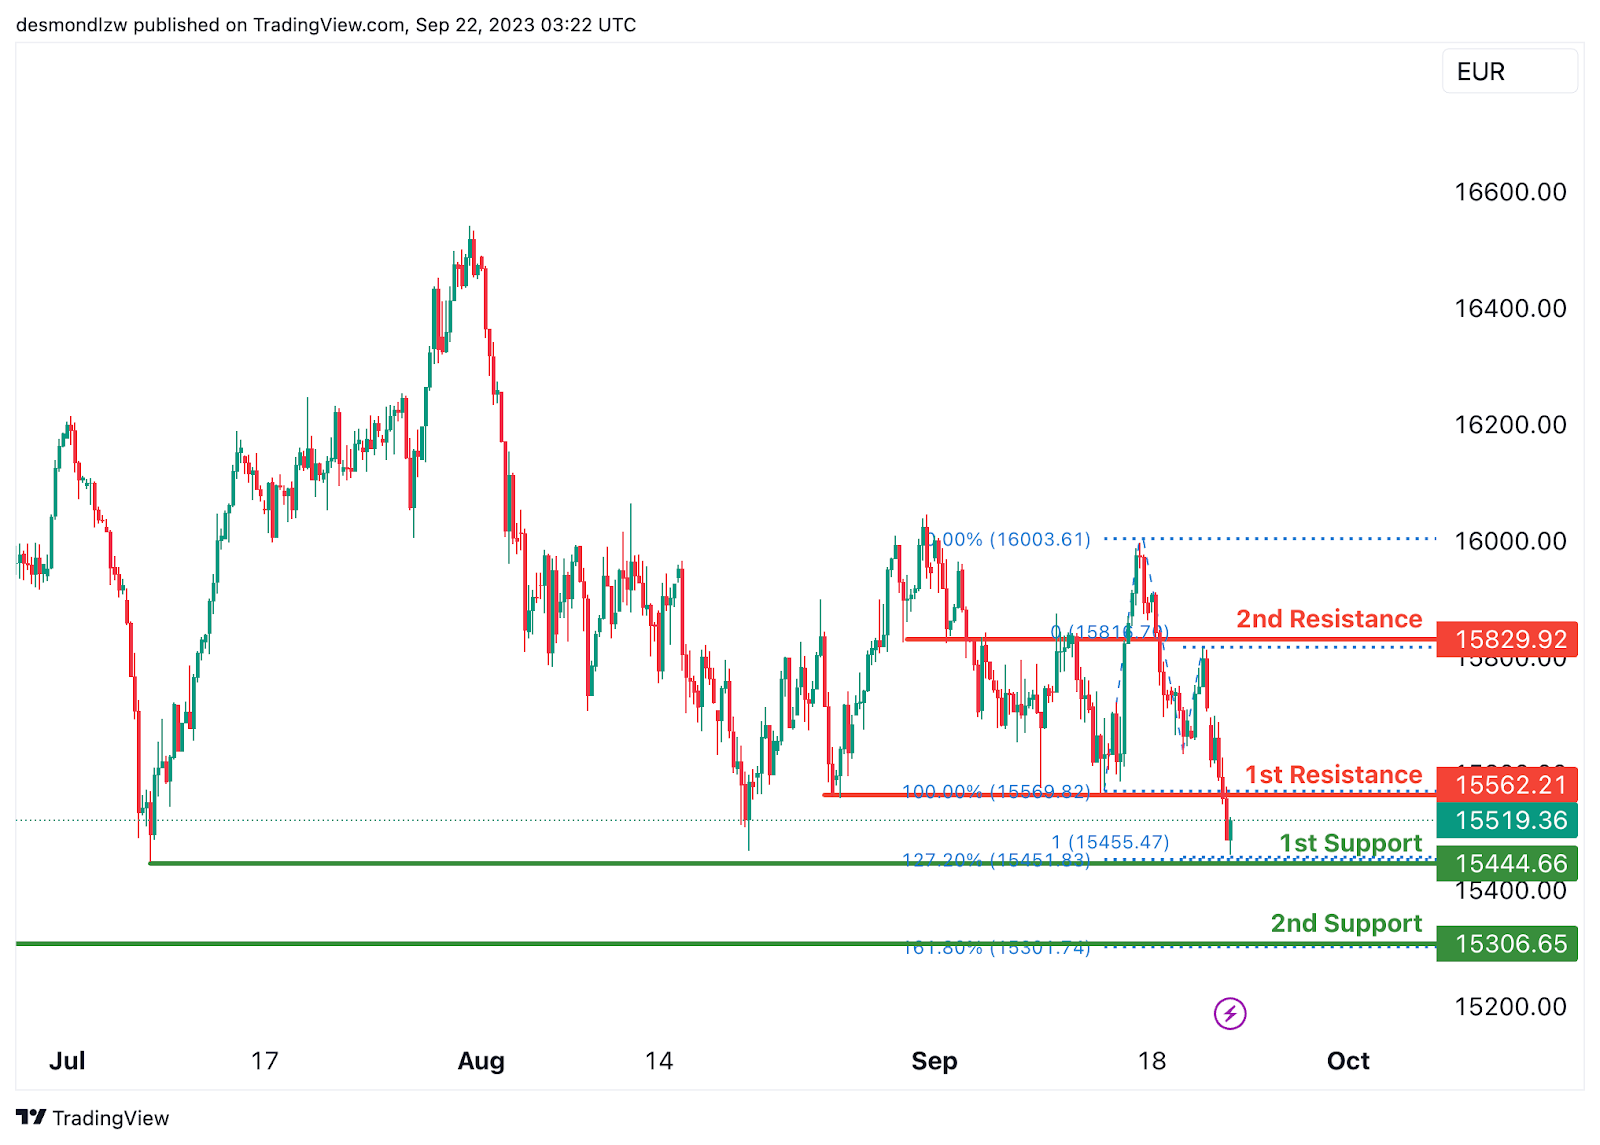
The instrument GER30 currently indicates a bullish overall momentum on the chart, and there’s potential for a bullish continuation towards the 1st resistance at 15562.21.
The 1st support at 15444.66 is considered strong due to its status as a multi-swing low support and its association with the 127.20% Fibonacci Extension, as well as the 100% Fibonacci Projection, indicating a Fibonacci confluence. This makes it a robust level of potential support.
The 2nd support at 15306.65 is also notable as it acts as a pullback support and is associated with the 161.80% Fibonacci Extension, providing an additional layer of potential support.
On the resistance side, we have the 1st resistance at 15562.21, which is significant because it represents a pullback resistance.
Meanwhile, the 2nd resistance at 15829.92 is also a pullback resistance, suggesting potential barriers to further bullish movement at these levels.
US500
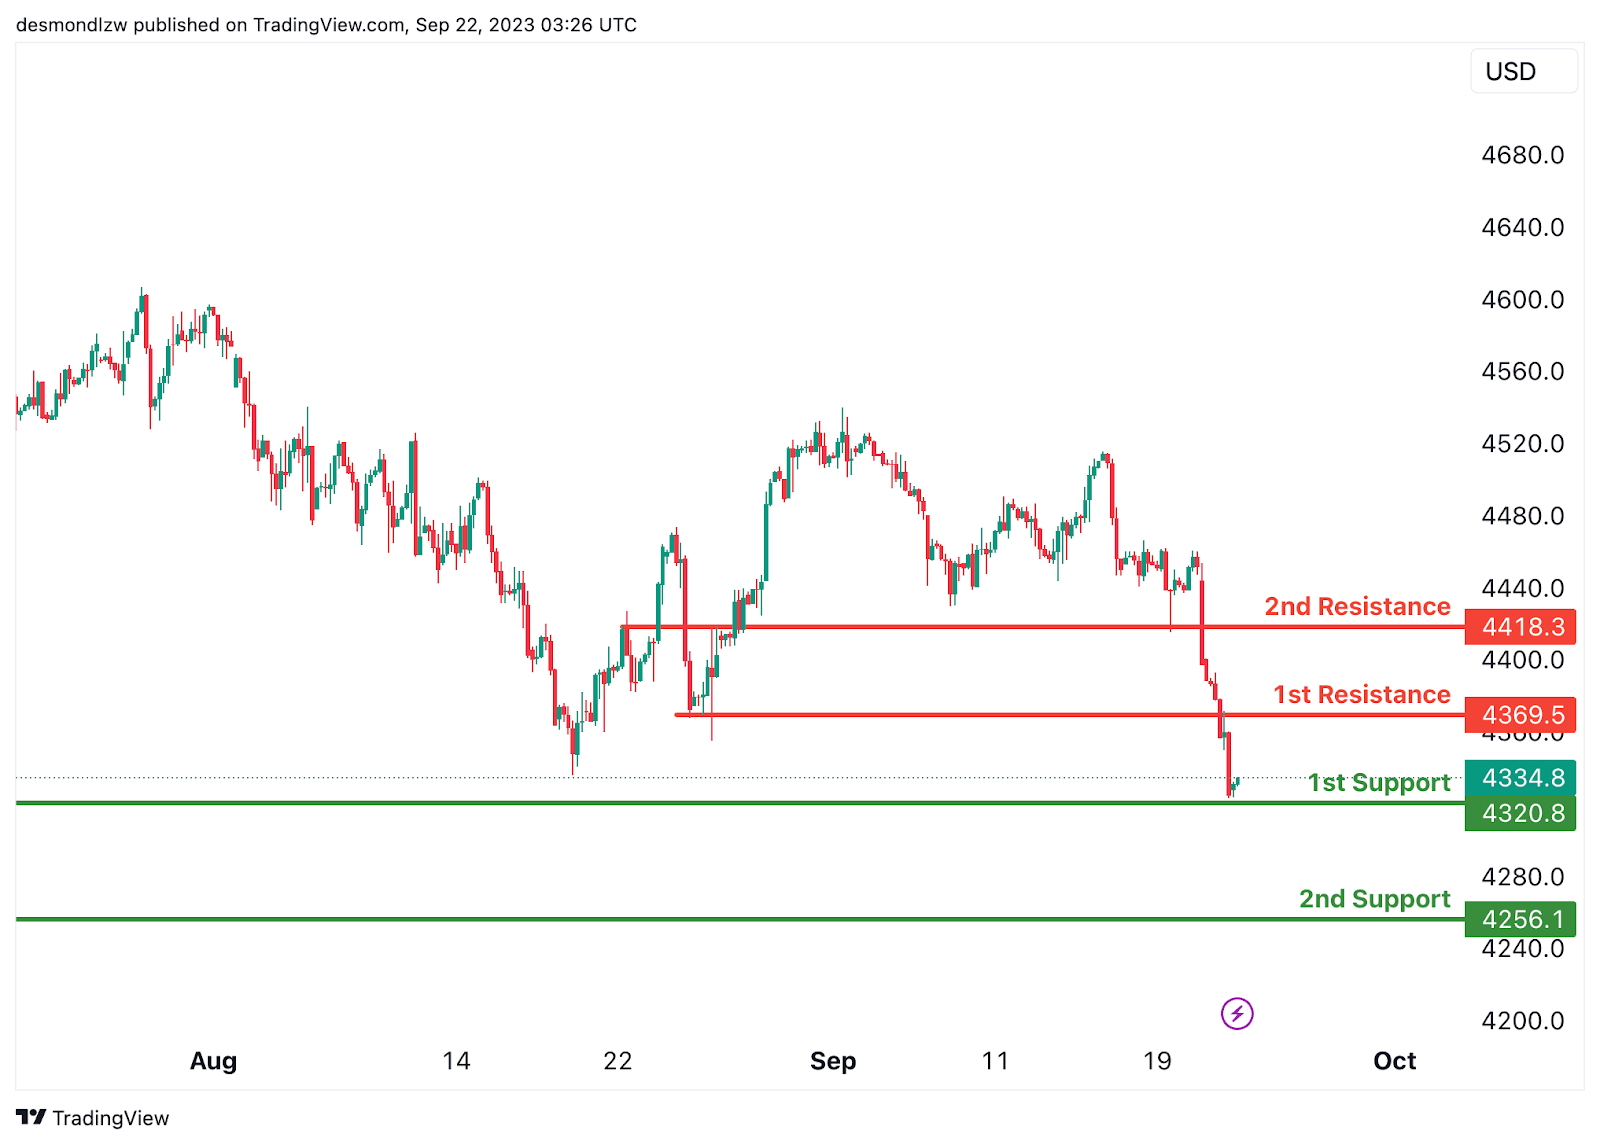
The instrument US500 currently indicates a bullish overall momentum on the chart, and there’s potential for a bullish continuation towards the 1st resistance at 4369.5.
The 1st support at 4320.8 is considered strong due to its status as an overlap support, providing a solid level of potential support.
The 2nd support at 4256.1 is also notable as it acts as a swing low support, offering an additional layer of potential support.
On the resistance side, we have the 1st resistance at 4369.5, which is significant because it represents a pullback resistance.
Similarly, the 2nd resistance at 4418.3 is also a pullback resistance, suggesting potential barriers to further bullish movement at these levels.
BTC/USD:
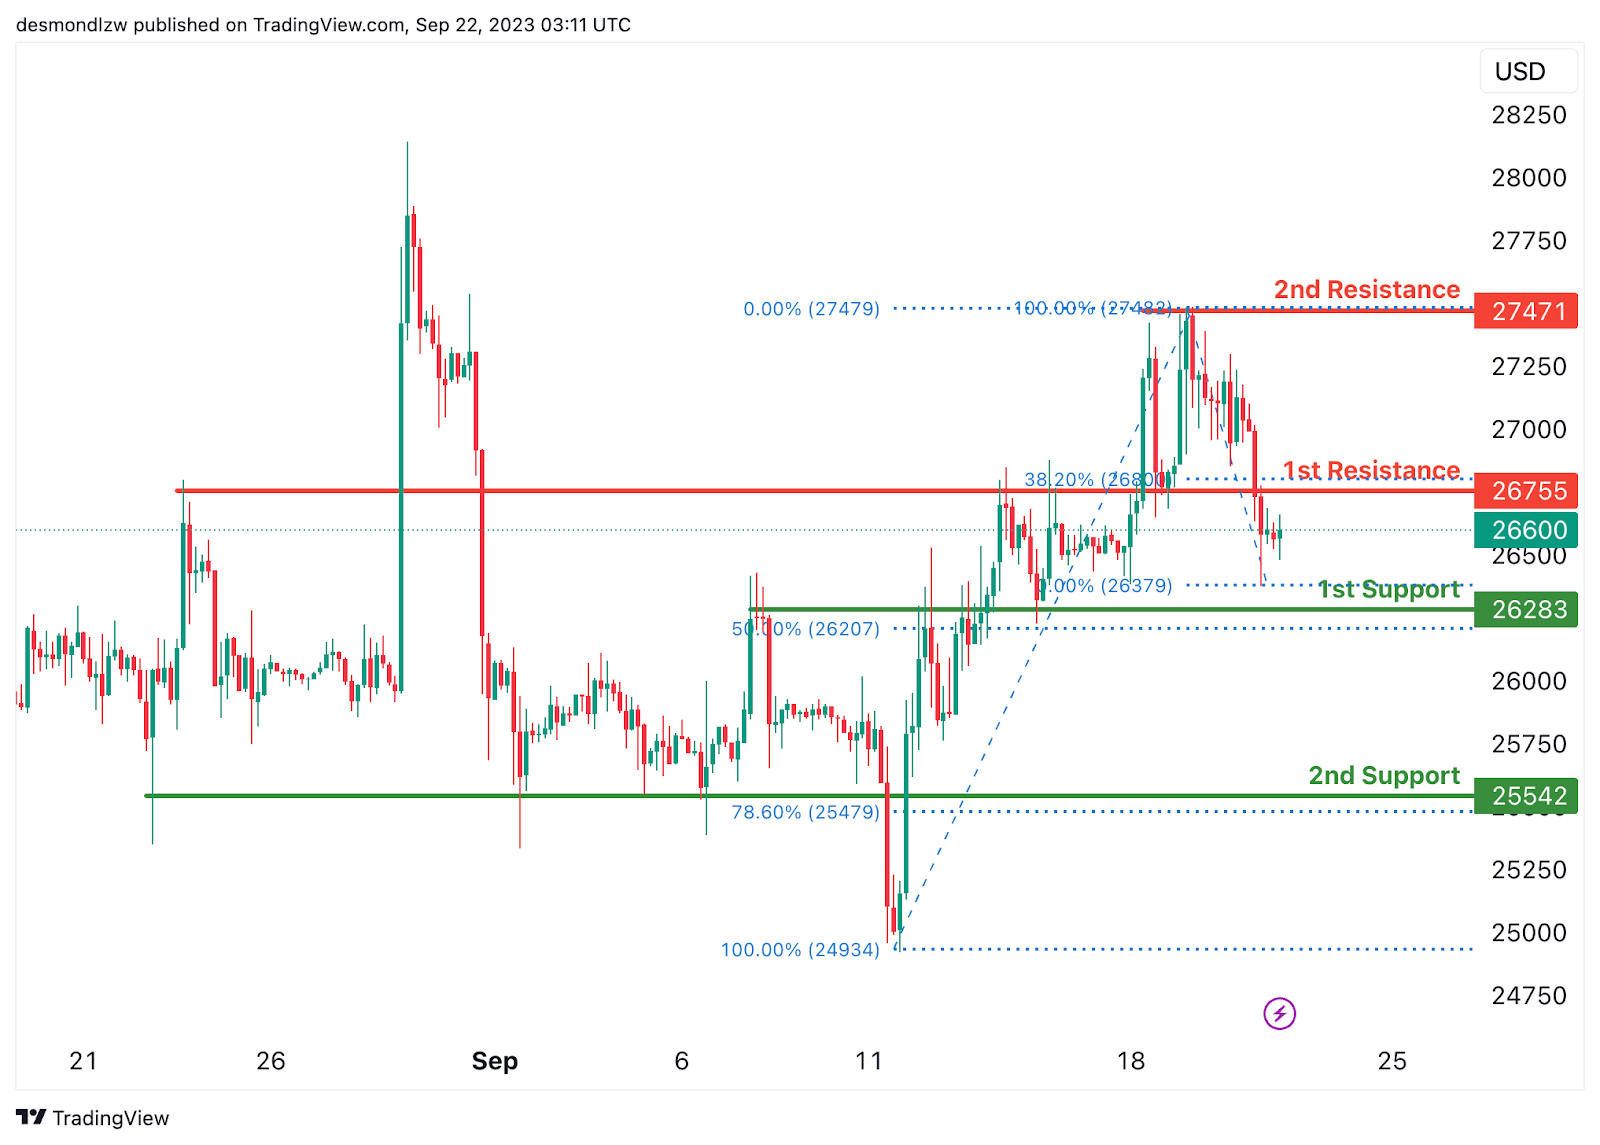
The instrument BTC/USD currently displays a bearish overall momentum on the chart. Factors contributing to this momentum include the expectation that the price could potentially rise towards the 1st resistance in the short term before reversing off it and dropping towards the 1st support.
The 1st support at 26283 is considered a good level of potential support due to its status as an overlap support and its association with the 50% Fibonacci Retracement.
The 2nd support at 25542 is also notable as it acts as a pullback support and is associated with the 78.60% Fibonacci Retracement, indicating another layer of potential support.
On the resistance side, we have the 1st resistance at 26755, which is significant because it represents a pullback resistance and is linked to the 38.20% Fibonacci Retracement.
Meanwhile, the 2nd resistance at 27471 is noteworthy as it functions as a swing high resistance, suggesting a potential point where the price may reverse its short-term rise and start to drop.
ETH/USD:
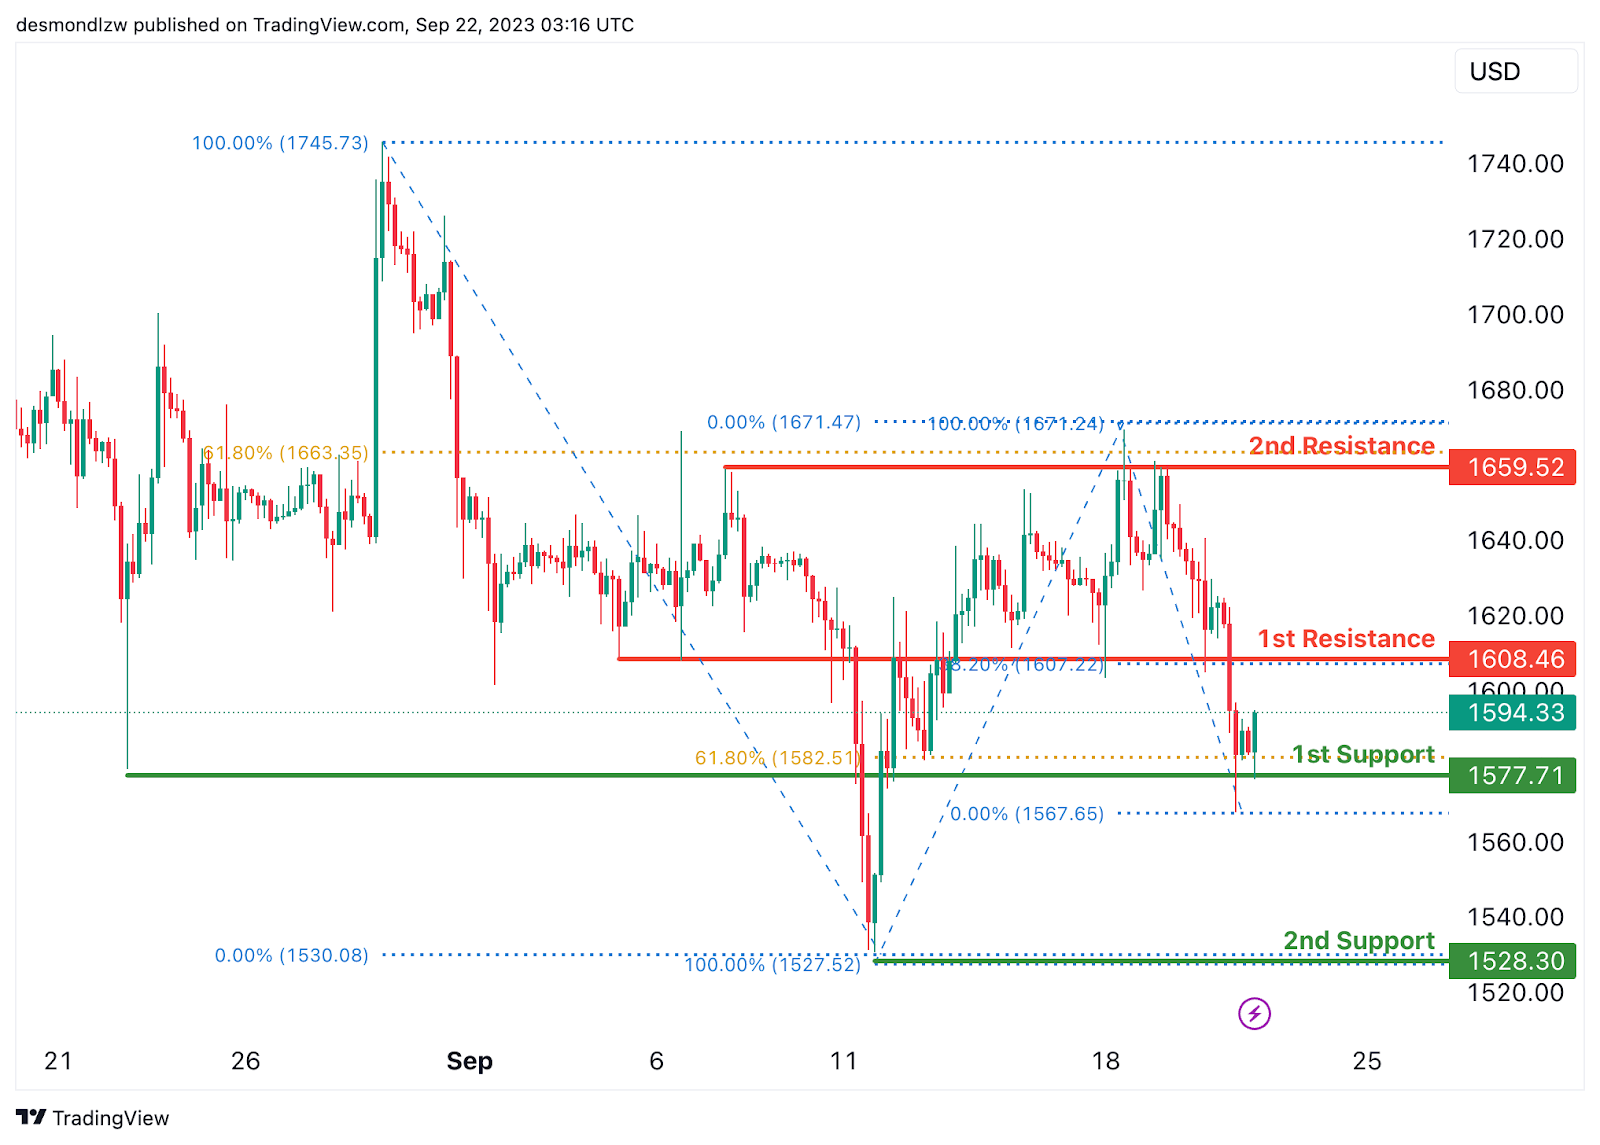
The instrument ETH/USD currently indicates a bullish overall momentum on the chart. There’s potential for a bullish continuation towards the 1st resistance at 1608.46, which is considered good due to its nature as a pullback resistance and its association with the 38.20% Fibonacci Retracement.
The 1st support at 1577.71 is also notable as it acts as an overlap support and is linked to the 61.80% Fibonacci Retracement, providing a strong level of potential support.
The 2nd support at 1528.30 is considered good as well, as it represents a multi-swing low support, offering an additional layer of potential support.
On the resistance side, we have the 2nd resistance at 1659.52, which is significant because it functions as a multi-swing high resistance and is associated with the 61.80% Fibonacci Retracement, indicating a potential barrier to further bullish movement at this level.
WTI/USD:
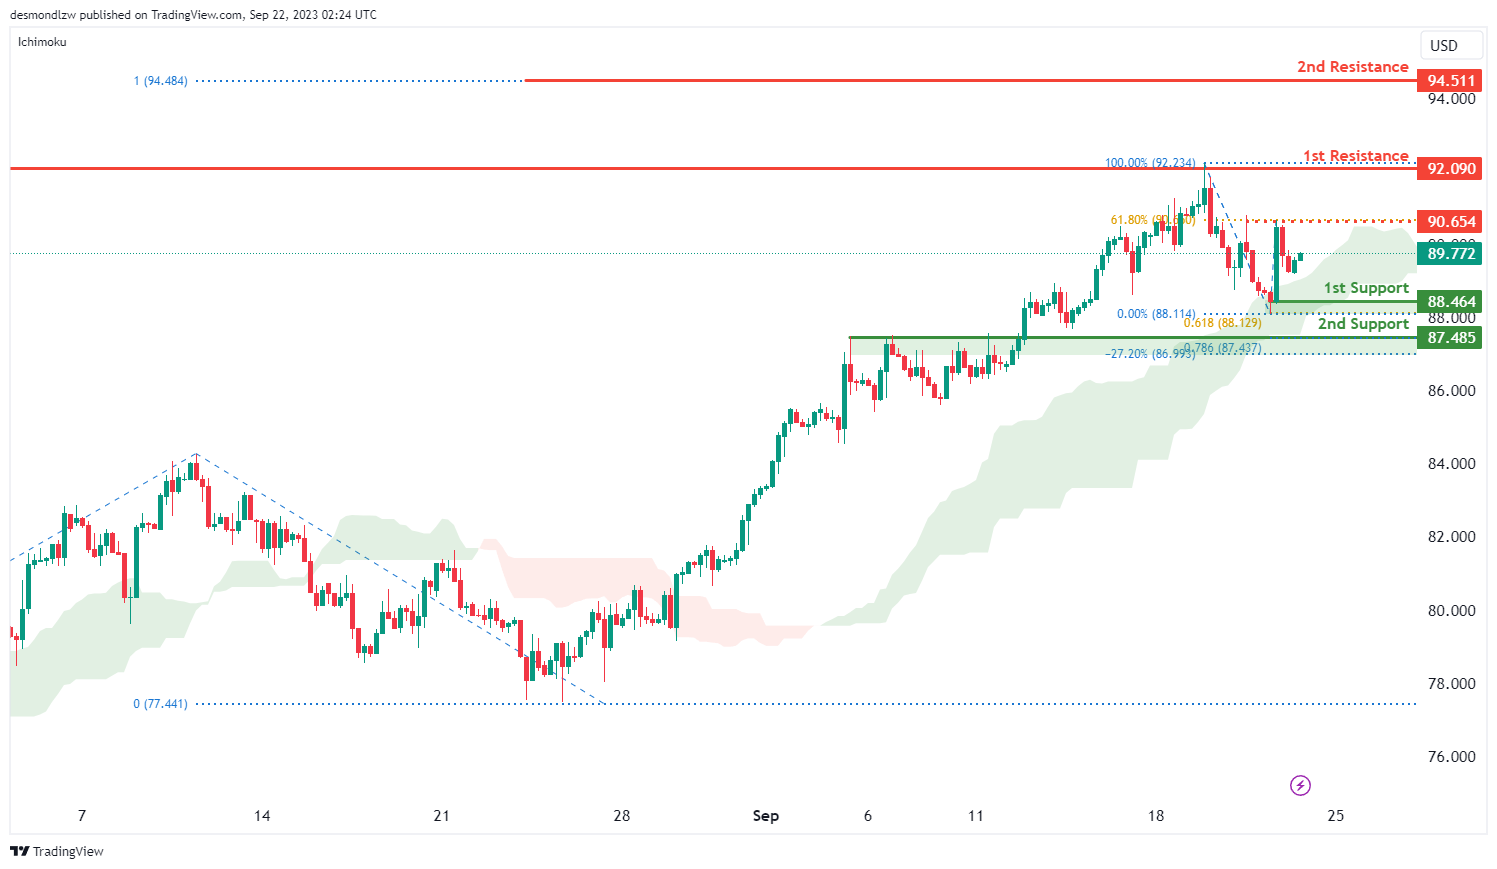
The WTI (West Texas Intermediate) chart currently exhibits an overall bullish momentum, suggesting the potential for a bullish continuation towards the 1st resistance level should price break above the intermediate resistance which is identified as pullback resistance that aligns with the 61.80% Fibonacci retracement level.
The 1st resistance level at 92.09 is identified as a multi-swing-high resistance while the 2nd resistance level at 94.51 is marked as a resistance level that aligns with the 100.00% Fibonacci projection level.
To the downside, the 1st support level at 88.46 is identified as a pullback support that aligns with 61.80% Fibonacci projection level. Additionally, the 2nd support level at 87.49 is also identified as a pullback support that aligns with a confluence of Fibonacci levels i.e. the 78.60% projection and the -27% expansion levels.
BoJ stands pat, drops no hint on future adjustment
BoJ maintains a steady course today and keeps monetary policy unchanged. It also chooses choosing not to make any adjustments in the statement that would suggest a departure from its existing negative interest rate stance or the yield curve control measures. The central bank even retains the pledge that it "will not hesitate to take additional easing measures if necessary."
In unanimous decisions, short-term policy interest rate is held at -0.10%. 10-year JGB yield target is held at 0%, with a band of plus and minus 0.5%. Moreover, the bank's offer to purchase 10-year JGBs at a rate of 1.0% daily through fixed-rate market operations remains unchanged.
BoJ anticipates the Japanese economy to maintain a moderate recovery in the near term. However, it has also flagged concerns, noting that the economy is "under downward pressure stemming from a slowdown in the pace of recovery in overseas economies." Beyond this phase, the central bank is optimistic that the economy will exhibit growth "at a pace above its potential growth rate" due to the strengthening of a "virtuous cycle from income to spending."
Regarding inflation, BoJ foresees the year-on-year core CPI to "decelerate" owing to diminishing import price effects. Nevertheless, in the subsequent period, the CPI is projected to "accelerate again moderately", spurred by an improving output gap, along with rising medium-to-long-term inflation expectations and wage growth.
Release earlier, Japan headline CPI slowed slightly from 3.3% yoy to 3.2% yoy in August. CPI core (ex-food) was unchanged at 3.1% yoy. CPI core-core (ex food and energy) was unchanged at 4.3% yoy.
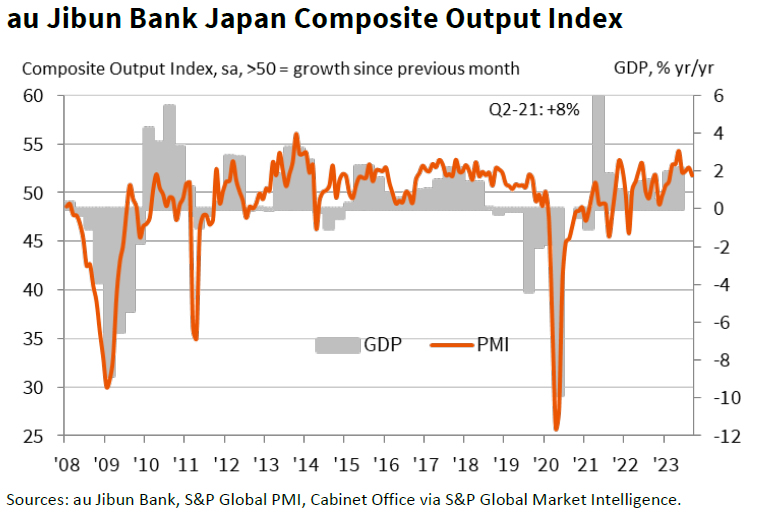
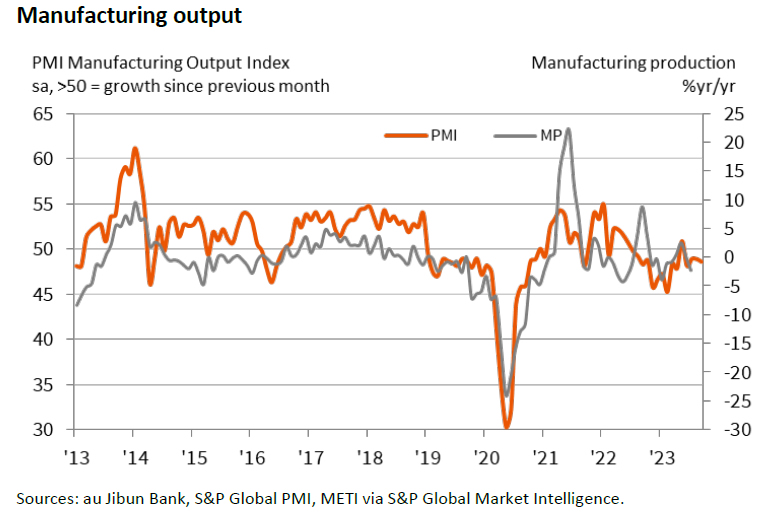
Japan’s PMI manufacturing fell to 48.6, slackening demand and lower employment
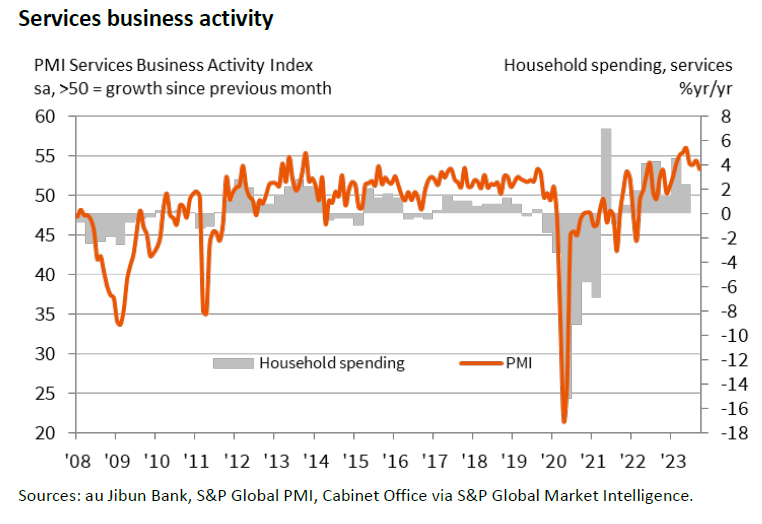
Japan's Manufacturing PMI further declined from 49.6 to 48.6 in September, falling short of the anticipated 49.9, marking the most pronounced contraction since February. PMI Services also receded from 54.3 to 53.3. PMI Composite, which gives a holistic view of the broader economy, tapered off from 52.6 to 51.8.
Usamah Bhatti, an Economist at S&P Global Market Intelligence, noted that the future doesn't seem particularly rosy, with forward-looking indicators hinting at a possible slackening of demand and activity. While service firms did experience a rise, manufacturing segment reported a sharp decline in new orders, the most pronounced in seven months.
Another worrisome development is the reduced employment levels in the privatgesector. Bhatti stated, "As pressure on capacity eased, there was a renewed reduction in employment levels." This trend was "the first since the start of the year and the quickest since August 2020." He attributed this to companies not replacing those who voluntarily exited, often as a strategy "amid elevated cost burdens."
Australia PMI composite back to expansion, risk of “no land” for the economy
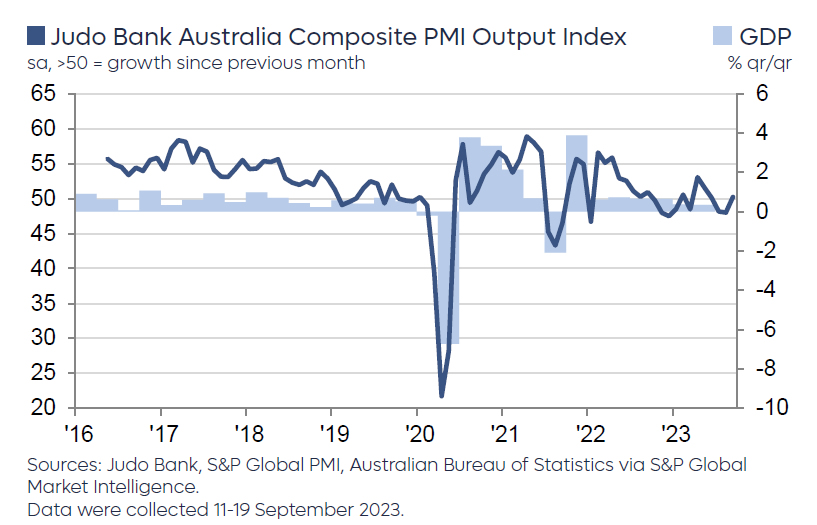
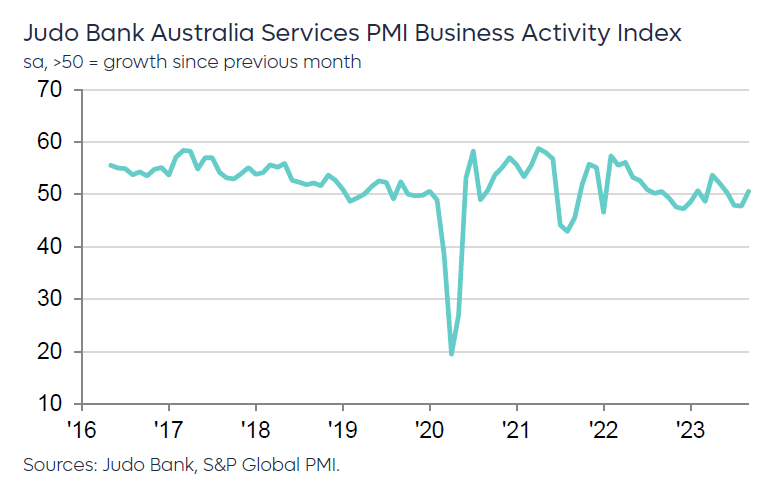
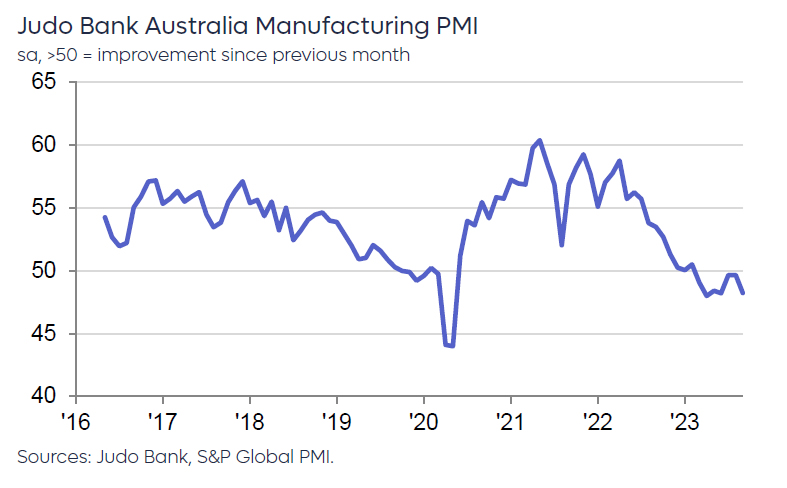
In September, Australia's Manufacturing PMI slipped to a 3-month low, declining from 49.6 to 48.2. In contrast, PMI Services showcased resilience, rising from 47.8 to a 4-month high of 50.5. PMI Composite also surged from 48.0 to 50.2, a 4-month peak, signaling a return to expansion in the broader economy.
Warren Hogan, Chief Economic Advisor at Judo Bank,said that "demand in the economy is holding up, and business activity remains on a sound footing." He further remarked that, contrary to some expectations, the present economic scenario isn't about choosing between a "hard or soft landing." Instead, he proposed that the real risk is of "no landing" for the economy.
Hogan further touched upon the inflation concerns that have been a pivotal discussion in financial circles. "The inflation indicators remain elevated at levels pointing to above-target CPI over the next 6-9 months," he stated. He pointed out that input prices remained unchanged in September, hinting at continued cost pressures. However, the final prices index experienced a slight dip in the September flash report. Despite this marginal decline, Hogan suggested that "inflation over the second half of 2023 could be higher than desired."
This latest PMI data follows a trend of stronger-than-predicted figures emerging from Australia in recent weeks. While this demonstrates economic stamina and persisting inflation, all eyes are on RBA's next steps. Hogan postulates that the RBA Board, under leadership of the new Governor Michele Bullock, will likely adopt a patient stance. However, he doesn't rule out further monetary tightening, possibly "in early November on Melbourne Cup day," should the economic indicators not align with RBA's projections of a slowdown.
USD/JPY Dips But Holds Key Uptrend Support
Key Highlights
- USD/JPY traded to a new multi-week high at 148.45.
- A few key supports are forming near 147.15 and 146.60 on the 4-hour chart.
- Bitcoin price failed to surpass $27,500 and corrected lower.
- The US Manufacturing PMI could rise from 47.9 to 48.0 in Sep 2023 (Preliminary).
USD/JPY Technical Analysis
The US Dollar followed a bullish path above the 147.00 pivot level against the Japanese Yen. USD/JPY even traded above 148.00 and traded to a new multi-week high at 148.45.
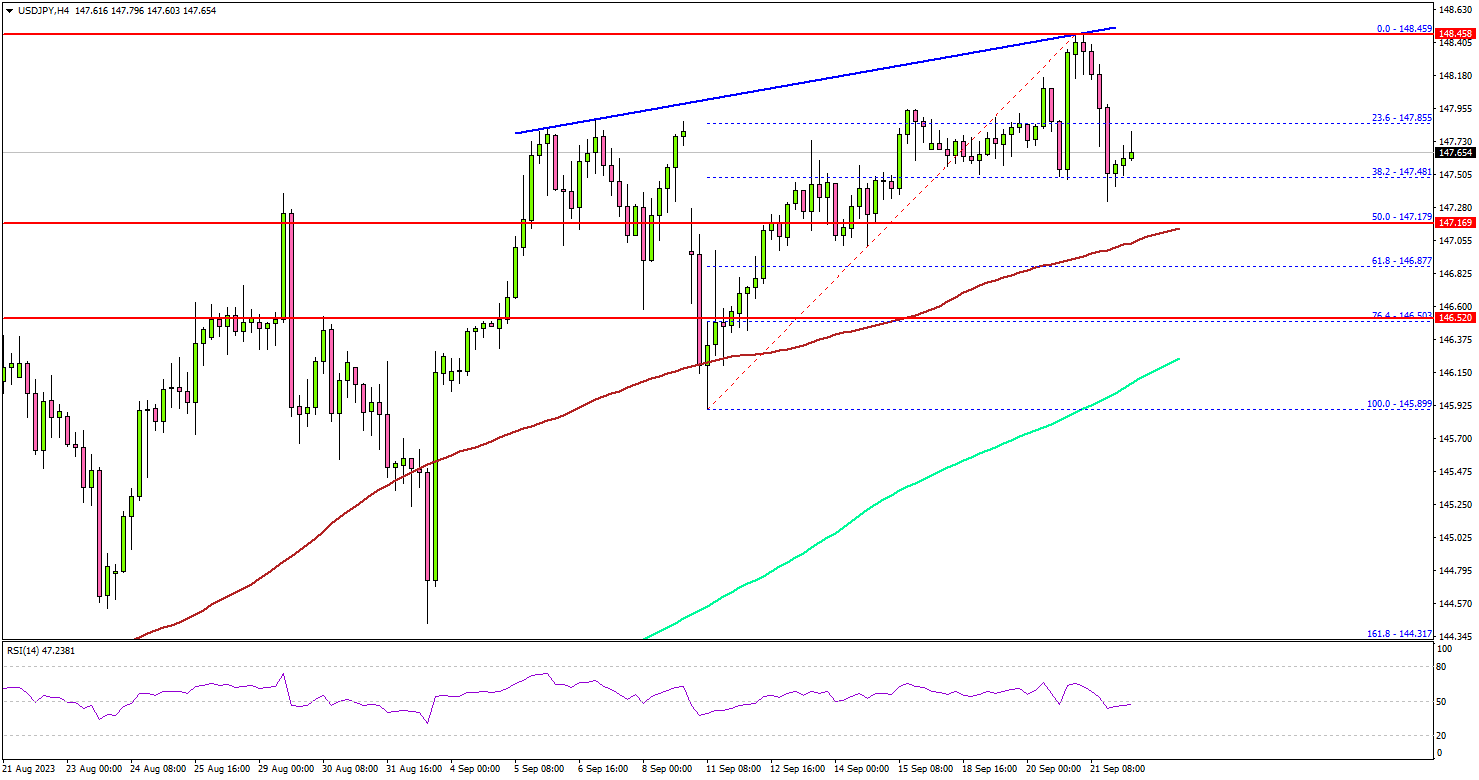
Looking at the 4-hour chart, the pair started a downside correction from 148.45. It is trading well above the 100 simple moving average (red, 4 hours) and the 200 simple moving average (green, 4 hours).
The first major support could be 147.15 or the 50% Fib retracement level of the upward move from the 145.89 swing low to the 148.45 high. It is close to the 100 simple moving average (red, 4 hours).
The next key support is seen near the 146.50 level, below which it could test the 200 simple moving average (green, 4 hours) at 146.15. If there is a move below 146.15, the pair could dive toward 145.20. Any more losses might send the pair toward the 144.50 level.
On the upside, the pair might face resistance near 148.20. The next major resistance is near the 148.50 zone. A close above 148.50 could start a steady increase toward 149.20. Any more gains might send USD/JPY toward the 150.00 handle.
Looking at Bitcoin, the price saw a strong rejection near the $27,500 zone and recently started a downside correction.
Economic Releases
- Germany’s Manufacturing PMI for Sep 2023 (Preliminary) - Forecast 39.5, versus 39.1 previous.
- Germany’s Services PMI for Sep 2023 (Preliminary) - Forecast 47.2, versus 47.3 previous.
- Euro Zone Manufacturing PMI for Sep 2023 (Preliminary) – Forecast 44.0, versus 43.5 previous.
- Euro Zone Services PMI for Sep 2023 (Preliminary) – Forecast 47.7, versus 47.9 previous.
- UK Manufacturing PMI for Sep 2023 (Preliminary) – Forecast 43.0, versus 43.0 previous.
- UK Services PMI for Sep 2023 (Preliminary) – Forecast 49.2, versus 49.5 previous.
- US Manufacturing PMI for Sep 2023 (Preliminary) – Forecast 48.0, versus 47.9 previous.
- US Services PMI for Sep 2023 (Preliminary) – Forecast 50.6, versus 50.5 previous.
New Zealand’s trade data sees China dominates decline in exports and imports
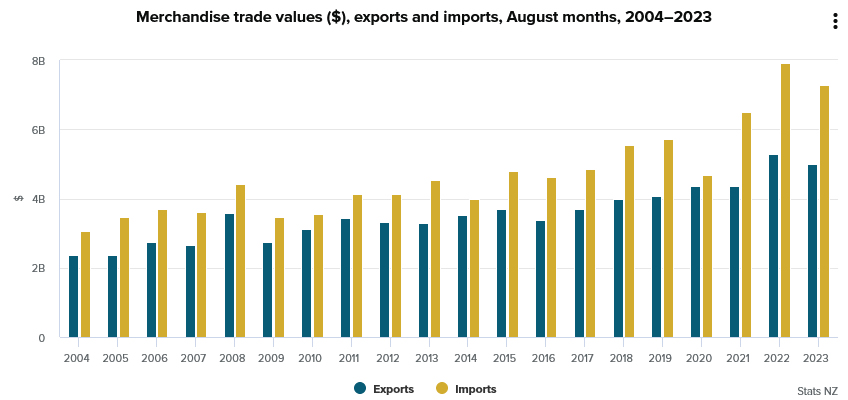
In August, New Zealand observed a dip in both its goods exports and imports compared to the previous year, leading to a monthly trade deficit of NZD -2.3B.
Compared to figures from August 2022, goods exports saw a reduction of NZD -296m, marking a -5.6% yoy drop, settling at NZD 5.0B. On the other hand, goods imports displayed an even steeper decline, shrinking by NZD -639m or -8.1% yoy, amounting to NZD 7.3B.
A deeper dive into the export figures revealed China as the major contributor to the monthly dip. Exports to China fell sharply by NZD -262m, representing an -18% yoy decline. Other notable declines were witnessed in exports to Australia, which dipped by NZD -71m (-9.0% yoy), and Japan, with a decrease of NZD -34m (-11% yoy). However, there was some silver lining with US and EU. Exports to the USA grew by NZD 62m, marking a 9.6% yoy increase, and those to the EU surged by NZD 28m, a 7.7% yoy rise.
China also took the lead in the contraction in imports. Imports from China plummeted by NZD -363m, a stark -19% yoy decline. Other significant reductions in imports were observed from Australia, down by NZD -92m (-9.7% yoy), South Korea with a drop of NZD -74m (-13% yoy), and US decreasing by NZD -36m (-5.4% yoy). In contrast, imports from EU displayed a robust growth, climbing by NZD 120m or 12% yoy.
ECB’s Lane: 4% deposit rate can bring inflation back to target within projection horizon
ECB's Chief Economist, Philip Lane, offered insights into last week's rate hike during a speech overnight. He noted that "the choice between holding at 375 and moving to 400 was finely balanced," referring to the deposit rate. Lane went on to express that opting for an additional hike was a safer decision "at a margin".
He believed that 4% deposit rate should be "consistent with a return of inflation to target within the projection horizon." The condition is that it's to be " maintained for a sufficiently long duration".
Looking to the future, Lane cautioned about the extended phase of uncertainty that looms regarding the disinflation process. Highlighting the intricacies of the present economic climate, Lane pointed to the "initial inflation shock, the lagged nature of wage adjustment in the euro area, [and] the considerable sectoral rebalancing" as contributors to the prolonged period of inflation uncertainty.
USDCHF Wave Analysis
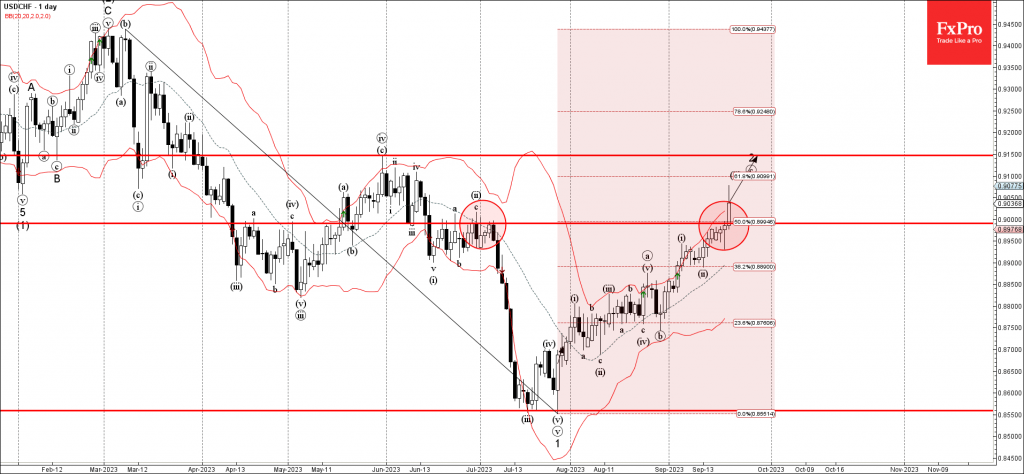
- USDCHF broke resistance level 0.9000
- Likely to rise to resistance level 0.9150
USDCHF recently broke above the round resistance level 0.9000 (which has been reversing the price from June) intersecting with the 50% Fibonacci correction of the downtrend from March.
The breakout of the resistance level 0.9000 should accelerate the active impulse wave c, which belongs to the ABC correction 2 from July.
USDCHF can be expected to rise further toward the next resistance level 0.9150 (target for the completion of the active impulse wave c).
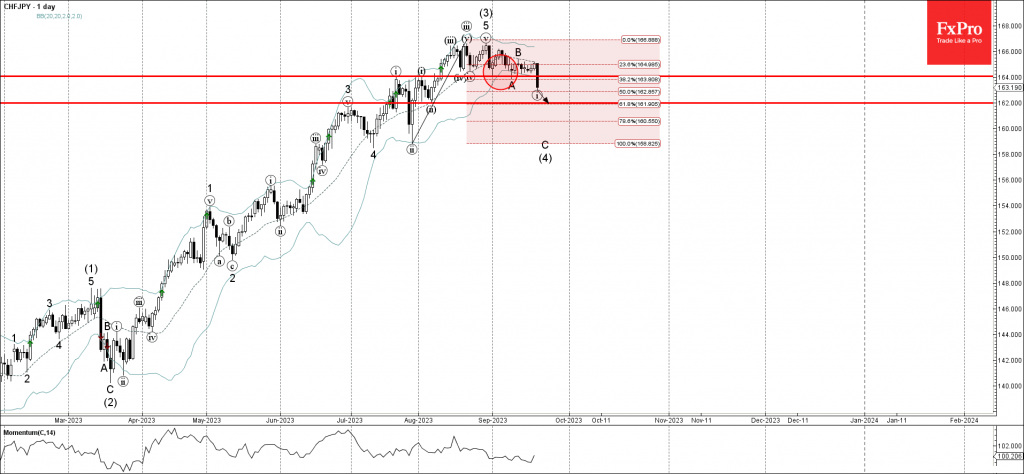
CHFJPY Wave Analysis
- CHFJPY broke support level 164.00
- Likely to fall to support level 162.00
CHFJPY continues to fall inside the minor impulse wave i, which previously broke the support level 164.00 (low of the previous wave A) intersecting with the 38.2% Fibonacci correction of the upward impulse from July.
The breakout of the support level 164.00 should accelerate the active impulse wave i, which belongs to the C-wave of the intermediate ABC wave (4) from the end of August.
CHFJPY can be expected to fall further toward the next support level 162.00 (low of the previous correction ii from August).