Sample Category Title
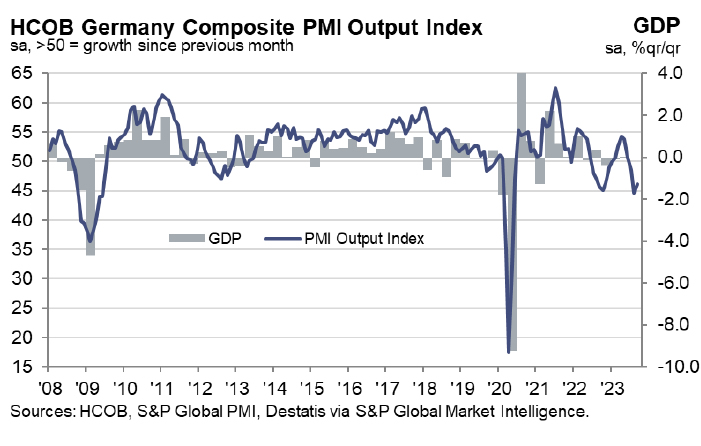
Germany PMIs improve, but points to economic contraction in current quarter
While Germany witnessed a modest improvement in its economic indicators for September, underlying concerns persist. PMI Manufacturing saw a slight climb from 39.1 to 39.8. Similarly, PMI Services edged up from 47.3 to just below the 50 mark at 49.8. Composite PMI experienced an uptick, moving from 44.6 to 46.2.
Cyrus de la Rubia, Chief Economist at Hamburg Commercial Bank, addressed the improvements, particularly noting, "The German services PMI stopped its slump and nudged up near 50 in September." Nonetheless, despite this upward nudge, the service sector remains virtually unchanged following the dip seen in August.
Encouragingly, recent PMI data suggests a deceleration in the decline of new orders and a slowdown in the reduction of purchasing activity in manufacturing. However, a closer look into the data indicates that manufacturing production might experience a drop surpassing 2 percent compared to the preceding quarter.
The broader picture is not particularly optimistic. "Germany has entered once again into contraction during the current quarter." Hamburg Commercial Bank's latest projections anticipate a sharp GDP decline of 1 percent relative to the prior quarter.
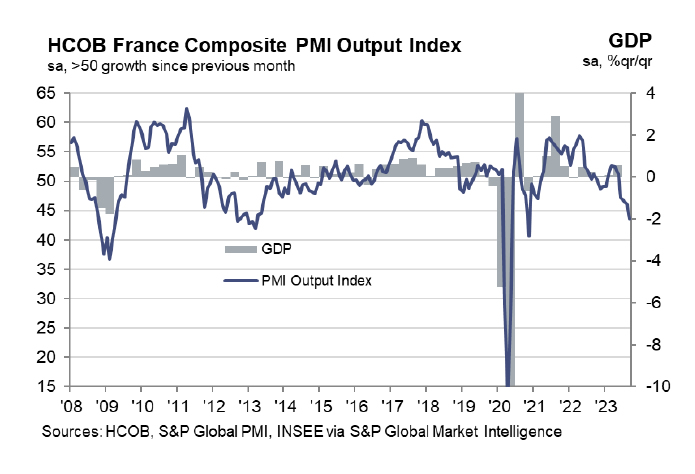
France PMI composite fell to 43.6, 40-mth low
France's economic indicators have signaled alarming trends as the country's PMI Manufacturing slumped to 43.6 in September, marking a 40-month low. PMI Services and Composite figures too painted a grim picture, both plummeting to a 34-month low, with values of 43.9 and 43.5, respectively.
Norman Liebke of Hamburg Commercial Bank expressed concerns regarding the sharp dip in business activity across the service and manufacturing sectors. Liebke's outlook for 2024 suggests an economic growth rate lower than earlier projections. This bleak forecast is mirrored by the manufacturing sector's sentiment, which has turned notably pessimistic. Manufacturers harbor "growth expectations [that] fell to their lowest since May 2020."
For the current quarter, Liebke's predictions are hardly optimistic. He said, "Economic growth for this quarter... points to growth of just 0.2%." Interestingly, he notes that any slight growth will predominantly be propelled by the public service sector, with the private service sector anticipated to contract, reflecting the PMI data.
Furthermore, the decline in unemployment witnessed recently is expected to be short-lived, with rates likely to surge in the upcoming months. On the inflation front, rising input costs and output charges remain a concern. Liebke anticipates a surge in inflation, predicting it "to have risen further in September to a rate of 5.5%" before it begins to taper off.
USD/JPY Technical: 148.40/85 Reached. What’s Next?
- BoJ Governor Ueda’s press conference is likely to be a pivotal moment in guiding market participants’ expectations toward monetary policy normalization away from negative interest rates.
- Bullish exhaustion elements were sighted as the USD/JPY rally hit the 148.40/85 key medium-term resistance.
- The 10-year JGB yield has continued to inch higher to a decade-high of 0.75% and August’s core-core Japan inflation rate remained elevated at 4.3% y/y, a 42-year high.
- The “drumbeat” has increased for a potential bearish reversal in USD/JPY, watch the key short-term support at 147.50.
The USD/JPY has continued to pierce higher despite a string of verbal interventions from Japan’s Ministry of Finance officials to negate the JPY weakness as well as Bank of Japan (BoJ) Governor Ueda’s “quiet exit from ultra-easy monetary policy” comment made earlier this month.
The primary driver of USD/JPY strength has been on the US side of the equation, with relentless upmove in the longer-term 10-year US Treasury yield that broke above a key medium-term resistance of 4.46% and closed yesterday, 21 September US session at 4.50%, its highest level since November 2007 reinforced by a “higher interest rate level for a longer-period” stance undertook by the US Fed after its latest FOMC that concluded on Wednesday.
Even though BoJ has kept its policy interest rate unchanged today at -0.1% which has been widely expected, there is now an increased chance that BoJ Governor Ueda may portray an upbeat view on the inflationary situation in Japan during his press conference later today after a Nikkei Asia news report published yesterday, 21 September that highlighted the potential change of tide in Japan’s more than a decade long of deflation battle as recent comments from BoJ and government officials have hinted that the Japanese economy has hit an inflection point where it can declare victory over sticky deflation.
In addition, the latest Japan’s core-core inflation rate (excluding fresh food and energy) for August came in at an elevated level of 4.3% y/y, unchanged from July, a 42-year high. Also, BoJ has allowed the 10-year Japanese Government Bond (JGB) yield to inch higher towards its implied upper limit of 1% after its new “flexible yield curve control” policy was introduced during July’s monetary policy meeting. So far, the 10-year JGB yield has rallied to 7.6% yesterday, a 10-year high.
All in all, these observations have drummed up the beat for a potential JPY floor to negate its current medium-term bearish trend since January 2023.
Let’s now look at the USD/JPY from a technical analysis perspective.
Bullish exhaustion sighted right at 148.40/85 key medium-term resistance
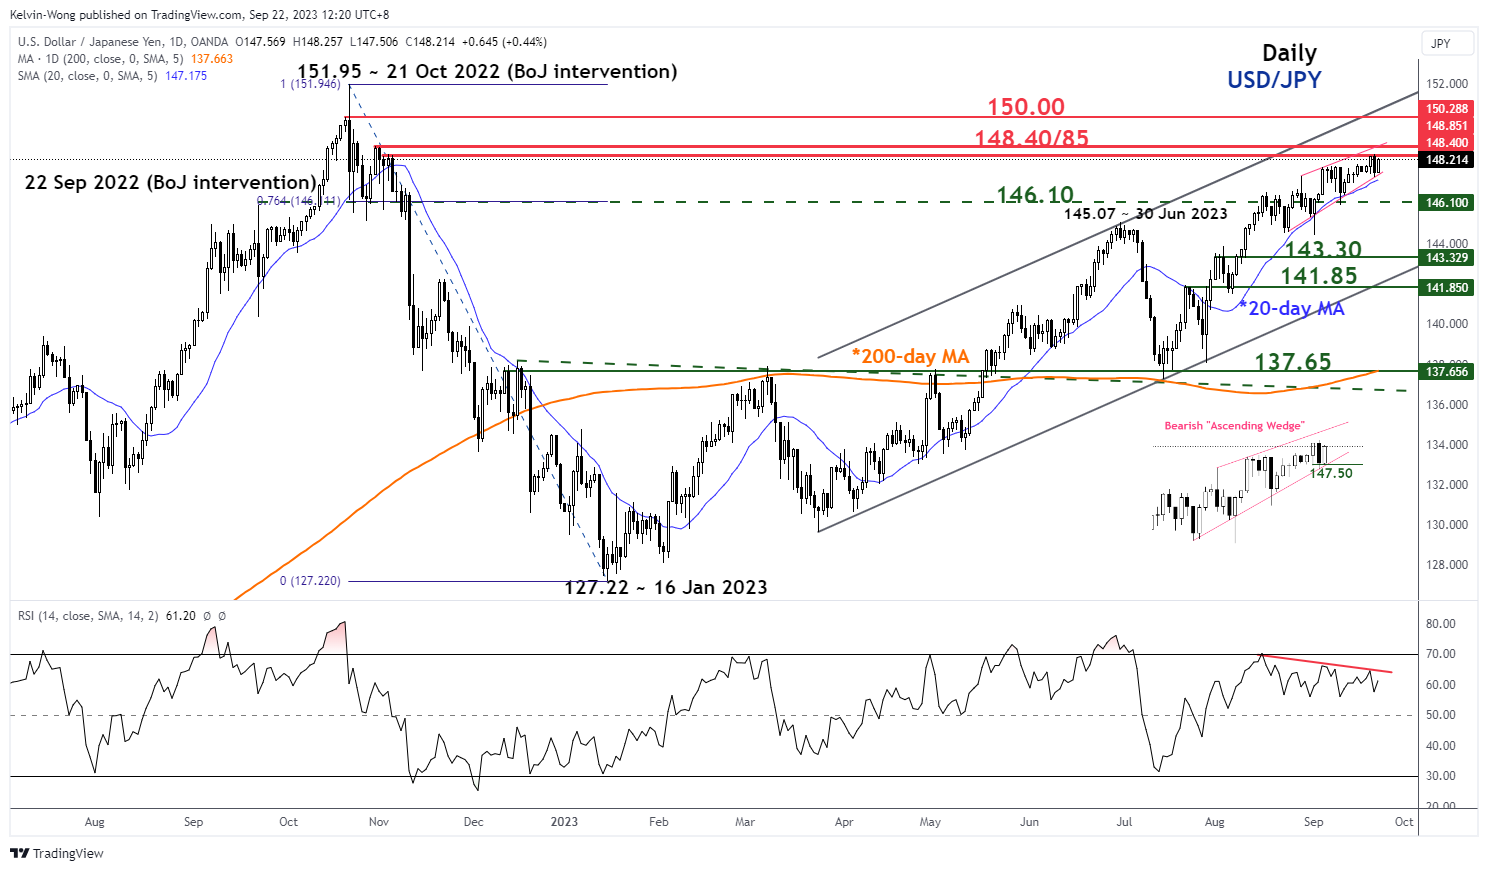
Fig 1: USD/JPY medium-term trend as of 22 Sep 2023 (Source: TradingView, click to enlarge chart)
Since its 23 August 2023 low of 144.54, the USD/JPY has been oscillating within an impending bearish “Ascending Wedge” configuration where its upper limit also coincides with the 148.85 key medium-term resistance (the highest level reached so far this week for USD/JPY was at 148.46 on Thursday, 21 September).
The “Ascending Wedge” is considered a potential bearish reversal configuration because the “higher highs” in price actions have a lesser magnitude than the “lower lows” as indicated by the slopes of the upper and lower limits of the “Ascending Wedge”.
In conjunction, the daily RSI in parallel since the start of the formation of the Ascending Wedge” on 23 August 2023 has traced out a bearish divergence condition after it hit its overbought region on 16 August 2023. These observations suggest that the medium-term upside momentum is waning which in turn supports the potential bearish reversal scenario in USD/JPY.
Watch the 147.50 key short-term support
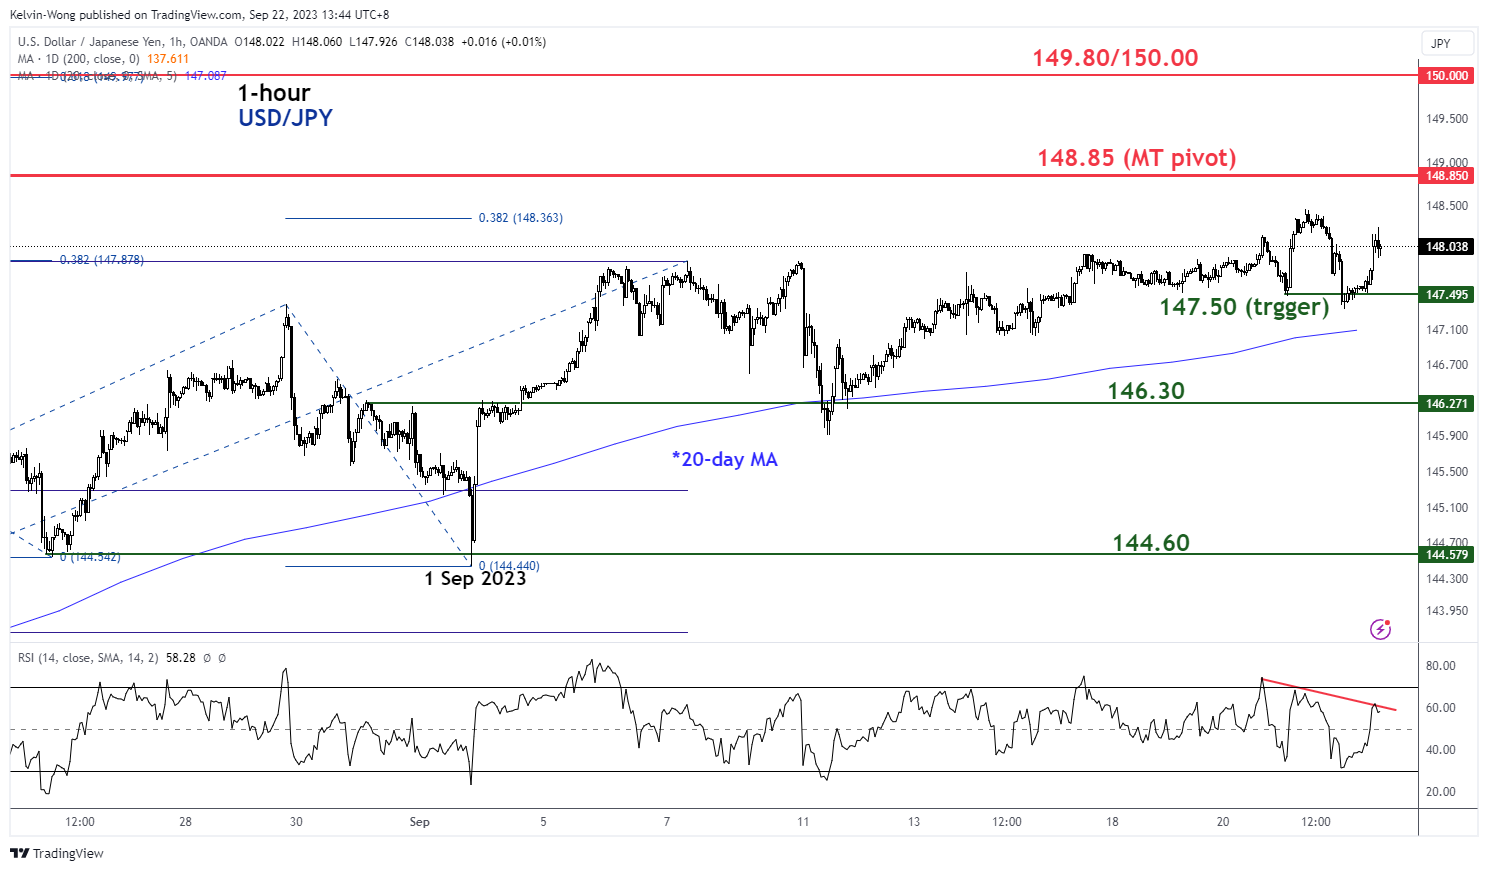
Fig 2: USD/JPY minor short-term trend as of 22 Sep 2023 (Source: TradingView, click to enlarge chart)
In the shorter term as seen on the 1-hour chart, the key support to watch will be at 147.50 which is defined by the lower limit of the bearish “Ascending Wedge” and close to the 20-day moving average.
A break below 147.50 is likely to trigger the potential bearish reversal to expose the next intermediate supports at 146.30 followed by 144.60 (minor swing lows 24 August/1 September 2023) in the first step.
On the flip side, a clearance above 148.85 invalidates the bearish reversal scenario for a squeeze up toward the major resistance of 149.80/150.00 (21 October 2022 swing high area & psychological).
Short Term S&P 500 ($SPX) Bearish Target
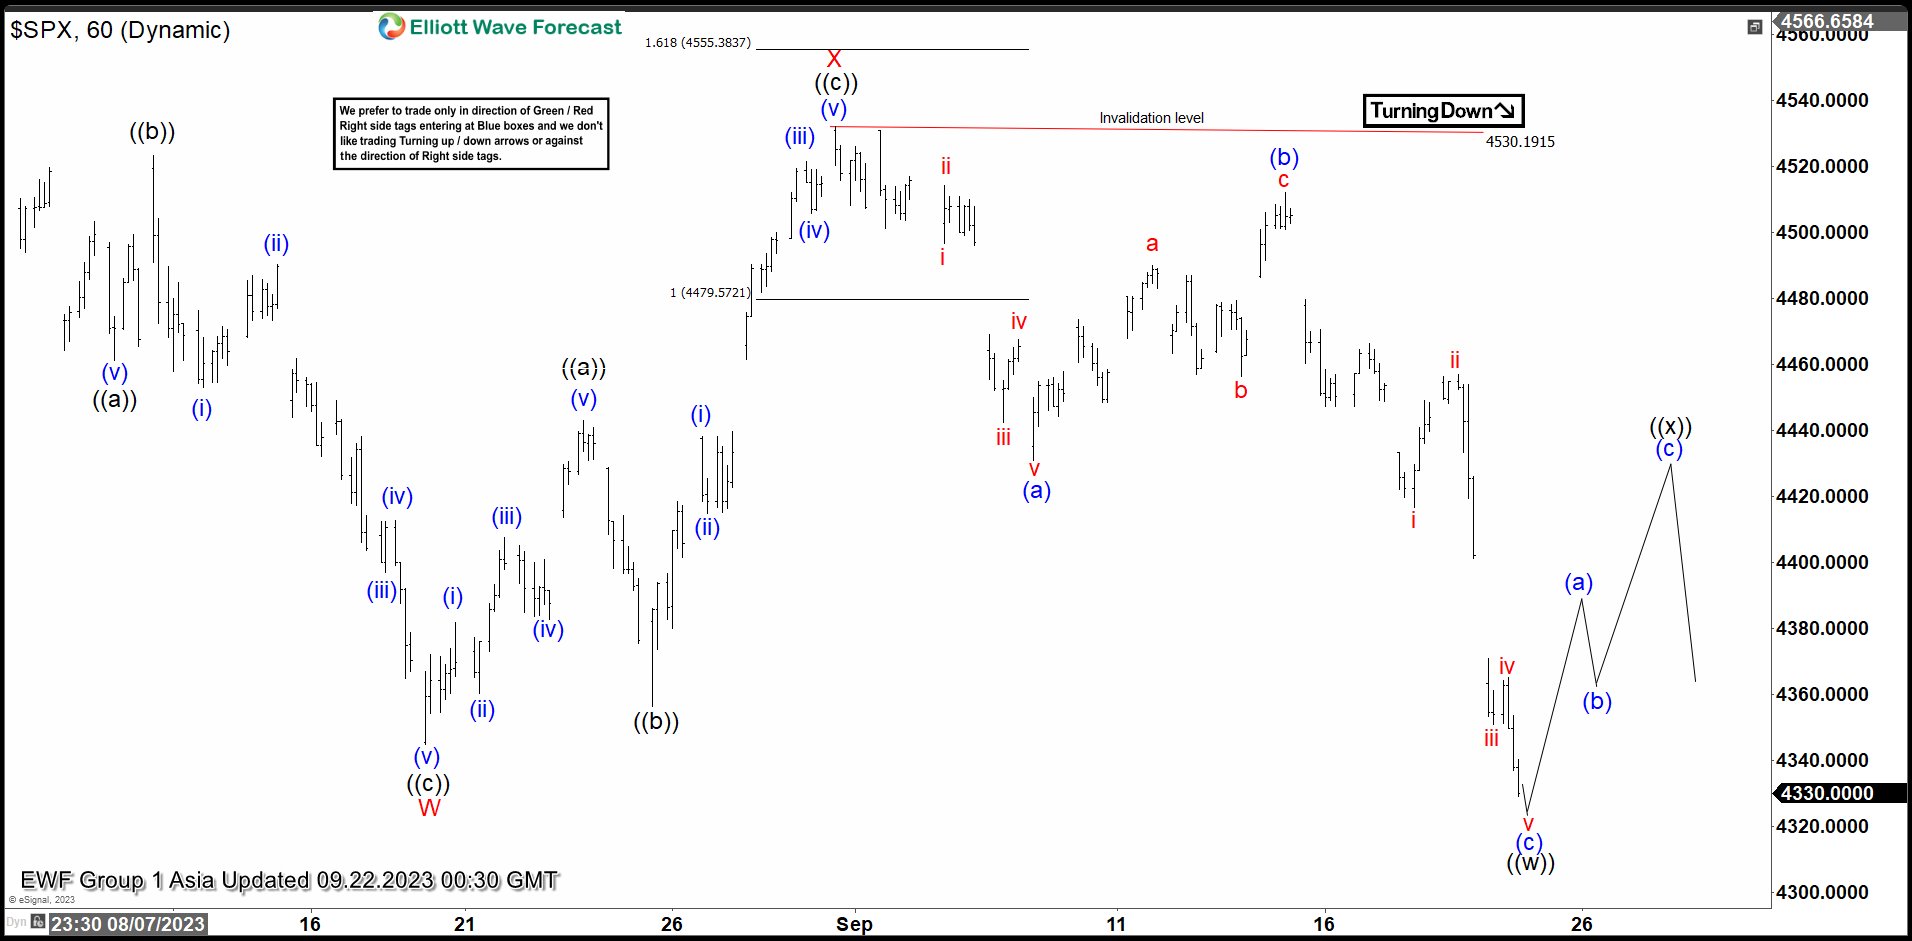
SPX shows a 5 swing sequence from July 27, 2023 high favoring further downside. 5 swing is an incomplete bearish sequence and the Index therefore likely extends lower. The drop from July 27 high unfolded as a double correction Elliott Wave structure. Down from July 27 high, wave ((a)) ended at 4461.33 and pullback in wave ((b)) ended at 4523.34 The Index extended lower again in wave ((c)) towards 4344.75 to complete wave W of the double correction. Wave X connector took the form of a zigzag. Up from wave W, wave ((a)) ended at 4443.18 and wave ((b)) correction ended at 4346.29. Wave ((c)) higher ended at 4532.26 which completed wave X.
The Index turned lower and broke below wave W, confirming the fifth swing lower is in progress. Down from wave X, wave (a) ended at 4430.83 and wave (b) ended at 4511.99 The index dropped further in wave (c) that should be near to end which completed wave ((w)). Once wave ((w)) is finished, the market should begin a wave ((x)) corrective rally in 3, 7 or 11 swing before it resumes to the downside. Near term, as far as pivot at 4532.26 high stays intact, expect further bearish movement in the index to find support in 3, 7, or 11 swing for further upside. Potential short term bearish target lower is 100% – 161.8% Fibonacci extension of wave W. This area comes at 4100 – 4269.
SPX 60 Minutes Elliott Wave Chart
SPX Elliott Wave Video
https://www.youtube.com/watch?v=PcMBCOMrekk
USD/JPY Returns to the 148 Area
Markets
The Bank of England’s ‘intrinsically dovish hold’ sharply contrasted with broader market trends since the Fed’s message that interest rates will be ‘higher for (very much) longer’. In the close 5-4 vote, governor Bailey’s MPC after kept the policy rate unchanged at 5.25%. Softer than expected August CPI data published on Wednesday (headline 6.7%, core 6.2%) convinced the majority for MPC members that enough policy tightening has been put in place to further facilitate the disinflationary process. Slower than expected growth can amplify early signs of some cooling in the labour market. The BoE maintained its conditional commitment that ‘further tightening in monetary policy would be required if there were evidence of more persistent inflationary pressures’. However a comment from BoE governor Bailey after the meeting (“cutting interest rates would be very, very premature”) was a better implicit pointer of the direction the BoE is contemplating from now. UK yields already made most of the dovish repositioning on Wednesday after the CPI data. After some intraday volatility around the BoE decision, UK yields mostly followed the broader trends rising between 2.5 bps (2-y) and 9 bps (10-y). Sterling evidently paid the price. EUR/GBP briefly spiked to just below the 0.87 barrier (close 0.867). On other markets, the higher for (much) longer repositioning continued, with especially the long end of the curve hard hit. The 2-y US yield eased slightly (3.2 bps) but the 10-y (6.75 bps) surpassed the 4.5% barrier for the first time since 2007, mainly driven by a further rise in the real yield (10-y + 6.6 bps at 2,11%). The 30-y even jumped an astonishing 12.8 bps. Yield rises in Europe/Germany remained more modest (10-y + 3.5 bps). Given the widening interest rate differential and the rise in the US real yield, gains in the dollar could have been bigger. At 105.39, DXY closed well off the intraday top. EUR/USD temporary dropped below the 1.0635 support area but also closed at 1.066. USD/JPY even closed at 147.6 after touching 148.45 earlier in the session. Some squaring of positions ahead of today’s BOJ meeting was in play. Higher (real) yields caused big damage on equity markets (S&P -1.64%, Nasdaq -1.82%, Euro Stoxx 50 -1.48%). At 4330, the S&P is testing key support (4335/4328) as do many other indices.
The BoJ left its policy unchanged this morning even as national inflation data suggested persistent above target inflation (CPI ex fresh food 3.1%, core 4.3%). The 10-y Japanese government bond yield (0.75%) is holding near its recent top. USD/JPY returns to the 148 area. Regional equities are holding up rather well given the WS sell-off. Later today, US and EMU PMI’s will give a new update on regional activity. The EMU composite PMI is seen bottoming (46.5) after a protracted decline. For the US, markets will look for confirmation on recent eco resilience. We don’t expect the data to provide much of a trigger to reverse the strong uptrend in yields. Yesterday’s USD performance was a bit disappointing, but we still see more upside with a sustained break of EUR/USD below the 1.0635/17 area.
News and views
UK-based Growth for Knowledge’s (GfK) consumer confidence indicator jumped from -25 to -21, its best level since January 2021 whereas consensus expected a slight deterioration to -26 in September. UK consumers turned less pessimistic on both the economic situation (-24 from -30) and their personal finances (-2 from -3) in the next 12 months. They also believe that the climate for major purchases has improved (-20 from -24). Saving intentions were unchanged (27) at the best level since April 2008. GfK added that this month’s improved headline score is good news, but it’s important to note many households are still struggling with the cost-of-living crisis and that economic conditions are tough. The financial mood of the nation is still negative.
The Turkish central bank raised its policy rate yesterday as expected by 500 bps, from 25% to 30%. Monetary tightening will be further strengthened as much as needed in a timely and gradual manner until a significant improvement in the inflation outlook is achieved. Higher-than-expected inflation readings in July and August (59% Y/Y) imply that year-end inflation will be close to the upper bound of the CBRT’s forecasts (>60%) with additional upside inflation risks coming from strong domestic demand, sticky services inflation, higher oil prices and the ongoing deterioration in inflation expectations. The Turkish lire holds steady just below EUR/TRY 29.
GBP/JPY Daily Outlook
Daily Pivots: (S1) 180.43; (P) 181.80; (R1) 182.79; More...
Intraday bias in GBP/JPY is turned neutral first as it recovered after dipping to 180.78. Further decline is expected as long as 183.34 support turned resistance holds. Below 180.78 will resume the fall from 186.75, as a larger scale correction, to 176.29 support next.
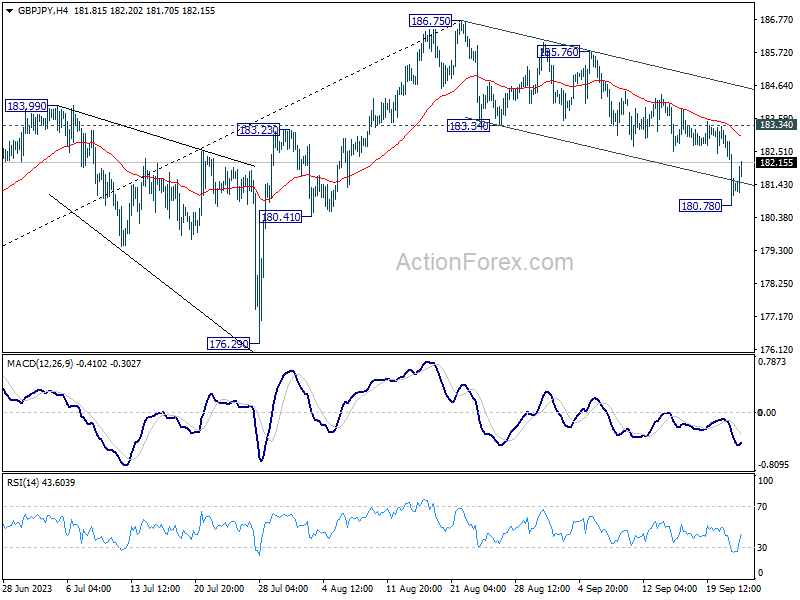
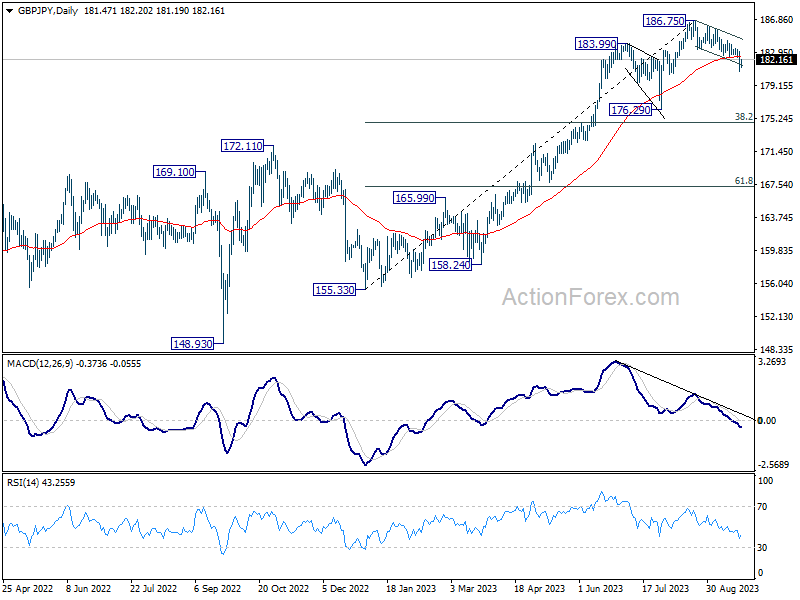
In the bigger picture, as long as 176.29 support holds, larger up trend from 123.94 (202 low) should still be in progress. Break of 186.75 will target 195.86 (2015 high). Nevertheless, firm break of 176.29 will confirm medium term topping, and turn outlook neutral for lengthier and deeper consolidations.
EUR/JPY Daily Outlook
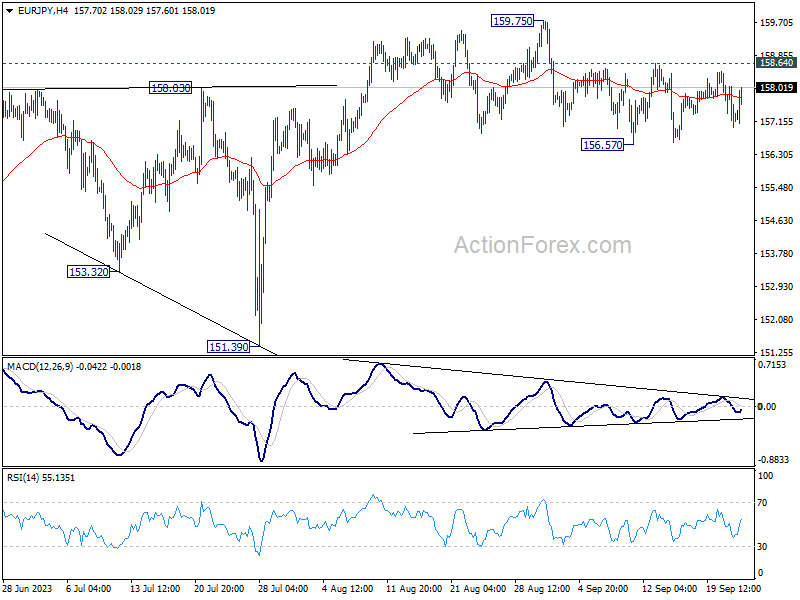
Daily Pivots: (S1) 156.86; (P) 157.50; (R1) 157.96; More....
Intraday bias in EUR/JPY stays neutral for the moment. Risk will be mildly on the downside as long as 158.64 resistance holds. Break of 156.57 support, and sustained trading below 55 D EMA (now at 156.80) will argue that fall from 159.75 is a larger scale correction. Deeper decline would be seen back towards 151.39 support. Nevertheless, above 158.64 would bring retest of 159.75 high instead.
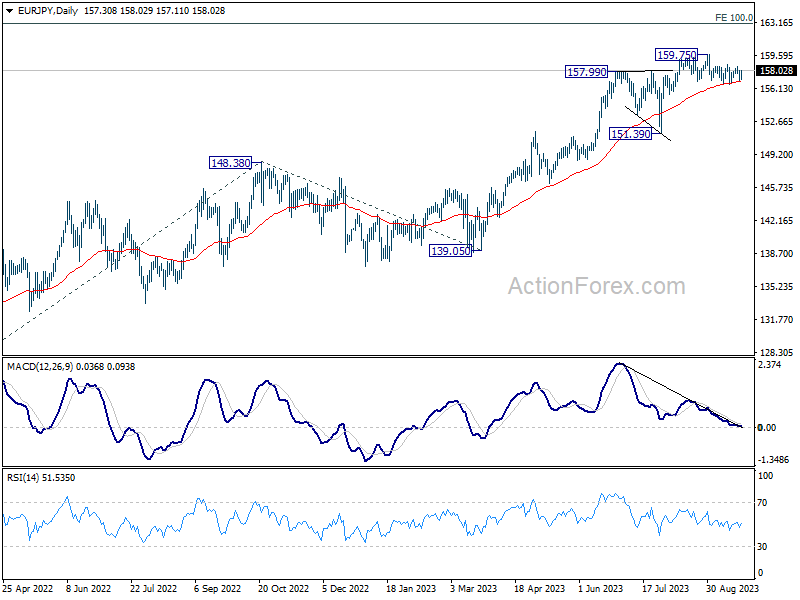
In the bigger picture, as long as 151.39 support holds, rise from 114.42 is still expected to continue. Next target is 100% projection of 124.37 to 148.38 from 139.05 at 163.06. Sustained break there will pave the way to retest long term resistance at 169.96.
EUR/GBP Daily Outlook
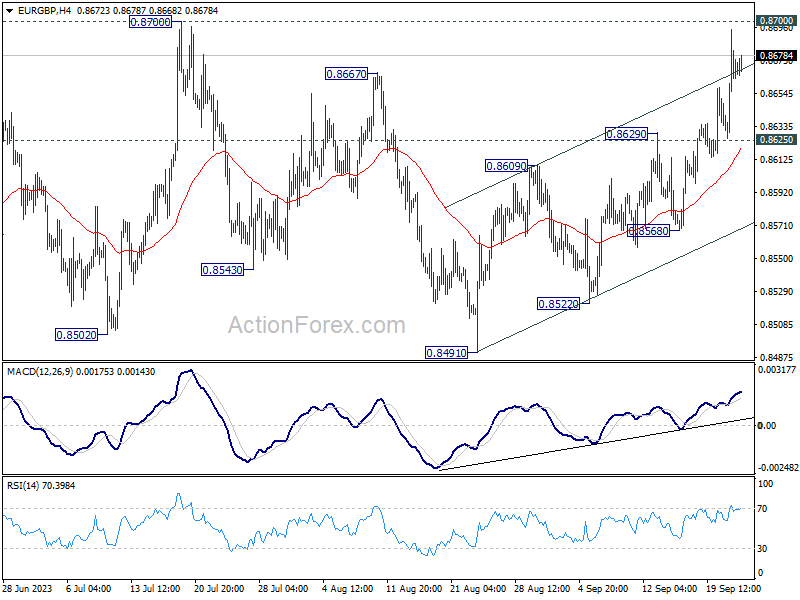
Daily Pivots: (S1) 0.8634; (P) 0.8665; (R1) 0.8703; More....
Immediate focus is now on 0.8700 resistance in EUR/GBP. Rejection by this resistance will maintain bearish outlook that larger down trend is not over. Break of 0.8625 minor support will turn bias back to the downside for 0.8568 support first. However, sustained break of 0.8700 will carry larger bullish implication and bring stronger rally.
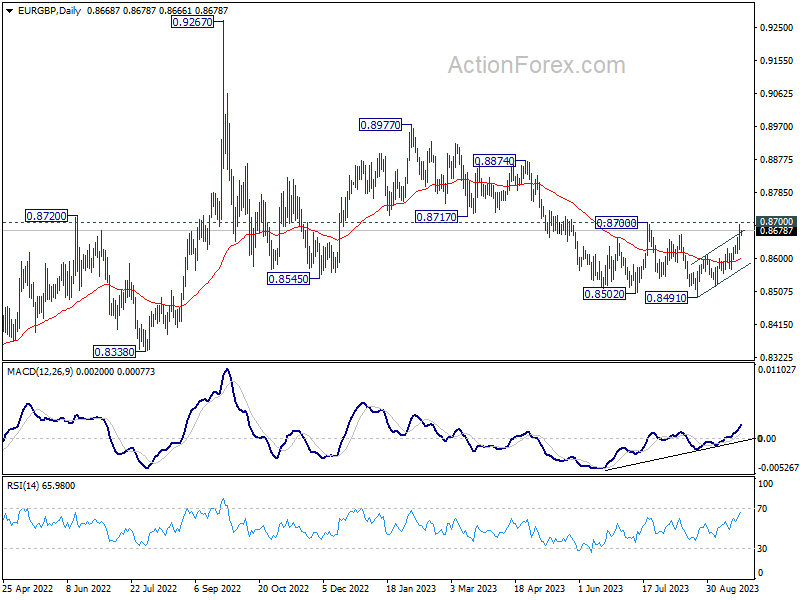
In the bigger picture, the down trend from 0.9267 (2022 high) is seen as part of the long term range pattern from 0.9499 (2020 high). Fall from 0.8977 is seen as the third leg. As long as 0.8700 resistance holds, further decline is still expected. Break of 0.8491 will resume the fall towards 0.8201 (2022 low). Nevertheless, firm break of 0.8700 will now be a sign of bullish reversal.
EUR/AUD Daily Outlook
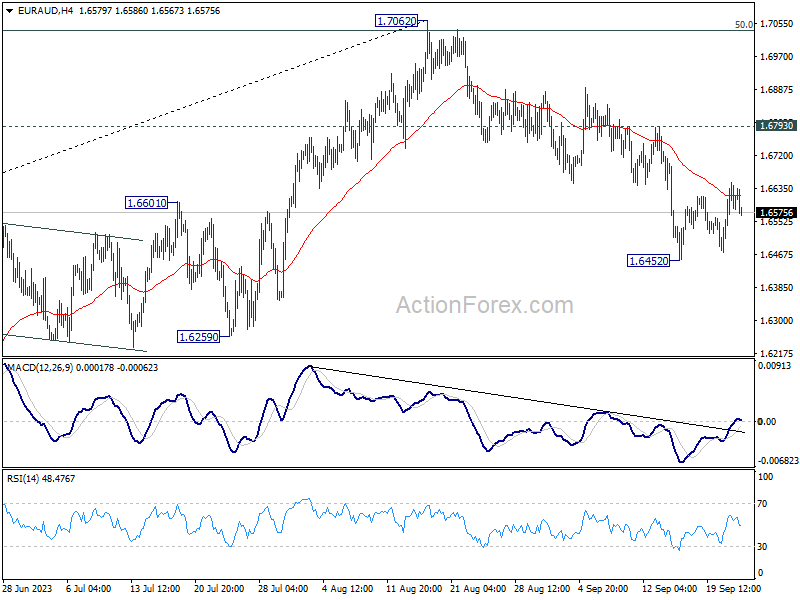
Daily Pivots: (S1) 1.6536; (P) 1.6594; (R1) 1.6677; More...
Intraday bias in EUR/AUD stays neutral for the moment and consolidation from 1.6452 could extend further. But further decline is expected with 1.6793 resistance intact. Fall from 1.7062 is seen as a larger scale correction. Below 1.6452 will target 1.6000 fibonacci level. Nevertheless, firm break of 1.6793 will dampen this view and bring retest of 1.7062 instead.
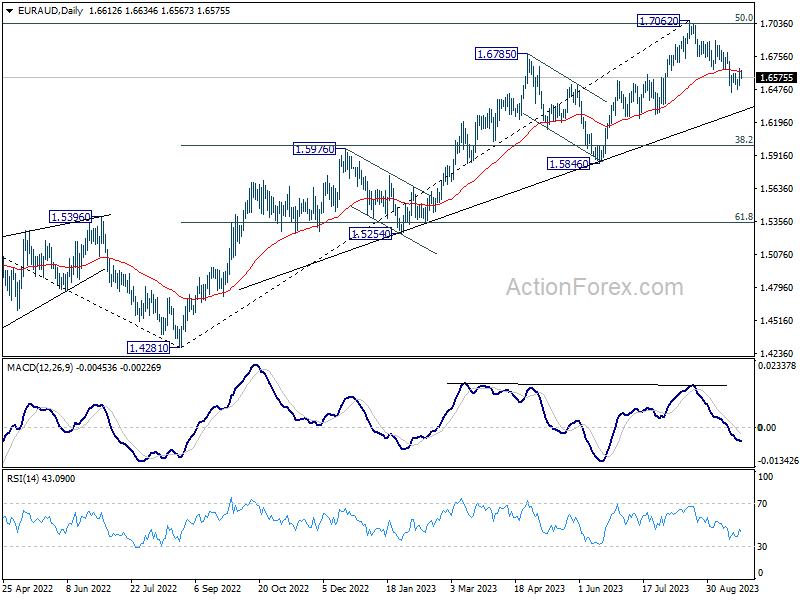
In the bigger picture, current development argues that fall from 1.7062 is probably correcting whole up trend from 1.4281. Deeper decline would be seen to 38.2% retracement of 1.4281 to 1.7062 at 1.6000. Strong support should be seen there to bring rebound, at least on first attempt.
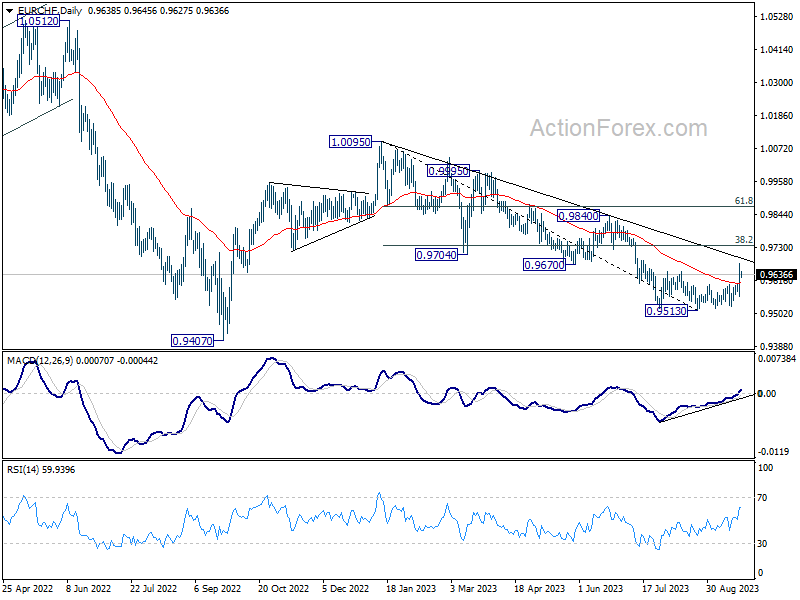
EUR/CHF Daily Outlook
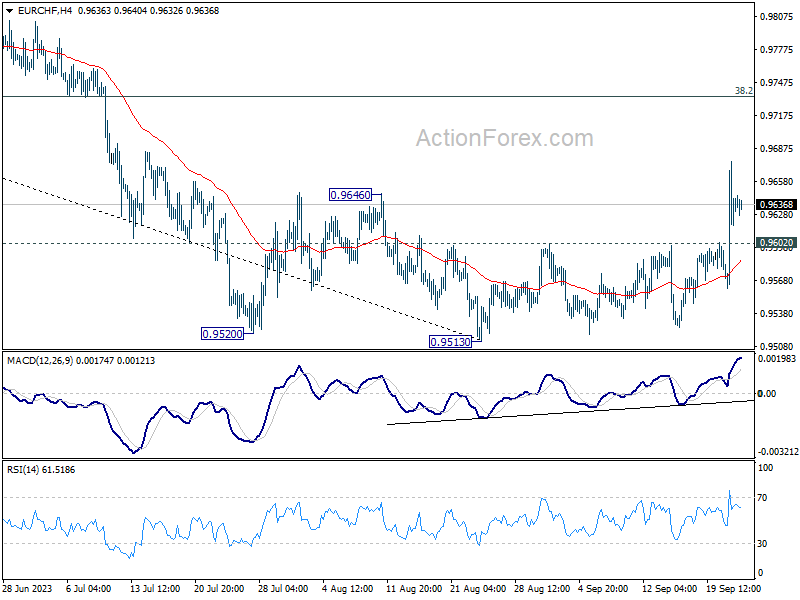
Daily Pivots: (S1) 0.9579; (P) 0.9628; (R1) 0.9693; More...
Intraday bias in EUR/CHF stays on the upside for the moment. Rise form 0.9513 short term bottom would target 38.2% retracement of 1.0095 to 0.9513 at 0.9735. Sustained break there will target 61.8% retracement at 0.9873. On the downside, below 0.9602 minor support will turn intraday bias neutral first.
In the bigger picture, medium term outlook is staying bearish as the cross is capped well below falling 55 W EMA (now at 0.9804). Down trend from 1.2004 (2018 high) could still resume through 0.9407 (2022 low). However, sustained trading above the 55 W EMA will raise the chance that 0.9470 is already a long term bottom. Further rise would then be seen to 1.0095 resistance to confirm bullish trend reversal.