Sample Category Title
Japanese Yen Soars as Ueda Says BoJ Could Raise Rates
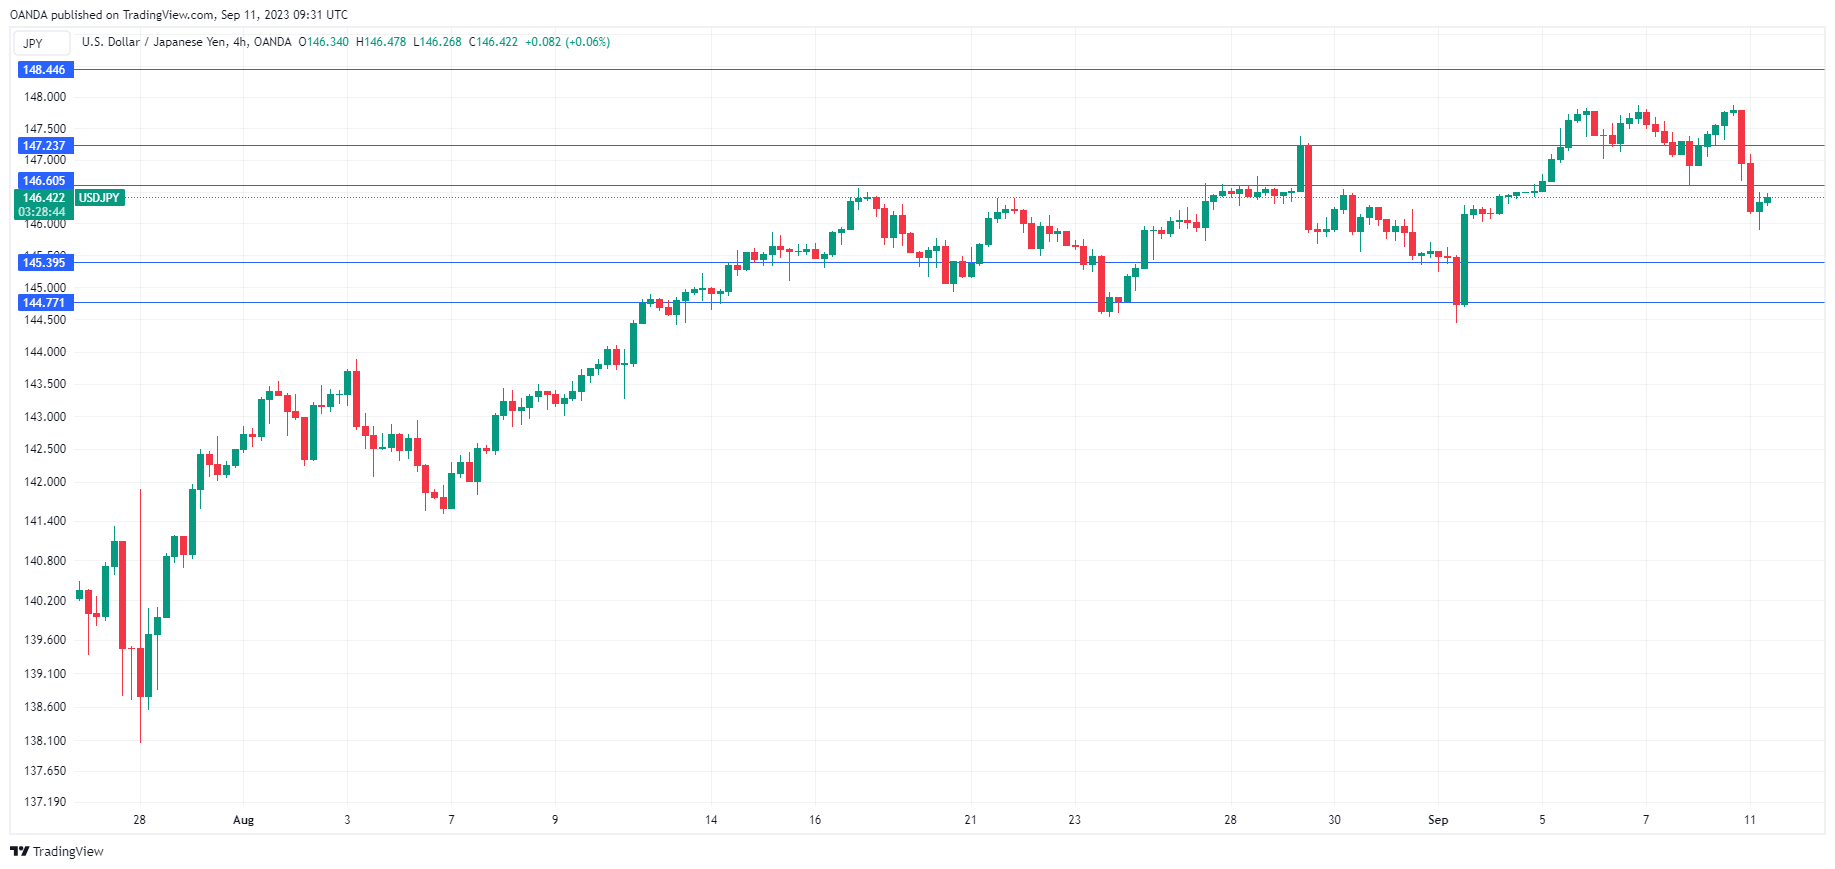
The Japanese yen has roared out of the gates on Monday and gained 1% against the US dollar. In the European session, USD/JPY is trading at 146.34.
Ueda says negative rates could end
The yen has been on a dreadful slide and dropped close to the 148 line last week. USD/JPY rose 1.07% last week and the greenback appeared to have momentum on its side. That upswing to a rude crash as the yen regained almost all of last week’s losses on Monday, following comments from Bank of Japan Governor Ueda over the weekend.
Ueda said in a newspaper interview that the BoJ could have enough data on wage growth by the end of the year to determine whether it can end negative rates. This was not a signal that Ueda was changing policy, as the Governor reiterated in the interview that the BoJ would “patiently” maintain its ultra-loose policy. Still, the fact that Ueda said that the BoJ could eventually raise rates was enough to send the yen flying higher on Monday.
Ueda’s remarks came after a series of hawkish comments by BoJ members in recent weeks, suggesting that the central bank is preparing the markets for a policy shift. Inflation has consistently been higher than the BoJ’s target of 2% and put into question the BoJ’s stance that inflation is not sustainable.
Ueda may have also intended to take a swipe at the strong US dollar, which has pummeled the yen. Last week, Vice Finance Minister Kanda, who is Japan’s currency diplomat, warned that the authorities “will not rule out any options on currencies if speculative moves persist” and Ueda’s remarks can also be viewed as verbal intervention to prop up the Japanese currency. Tokyo resorted to currency interventions late last year and could step in again if the yen keeps losing ground.
USD/JPY Technical
- USD/JPY has pushed below support at 147.24 and 146.61. Below, there is support at 145.40
- 148.45 and 149.08 are the next resistance lines
Gold Finds Support at 200-day SMA
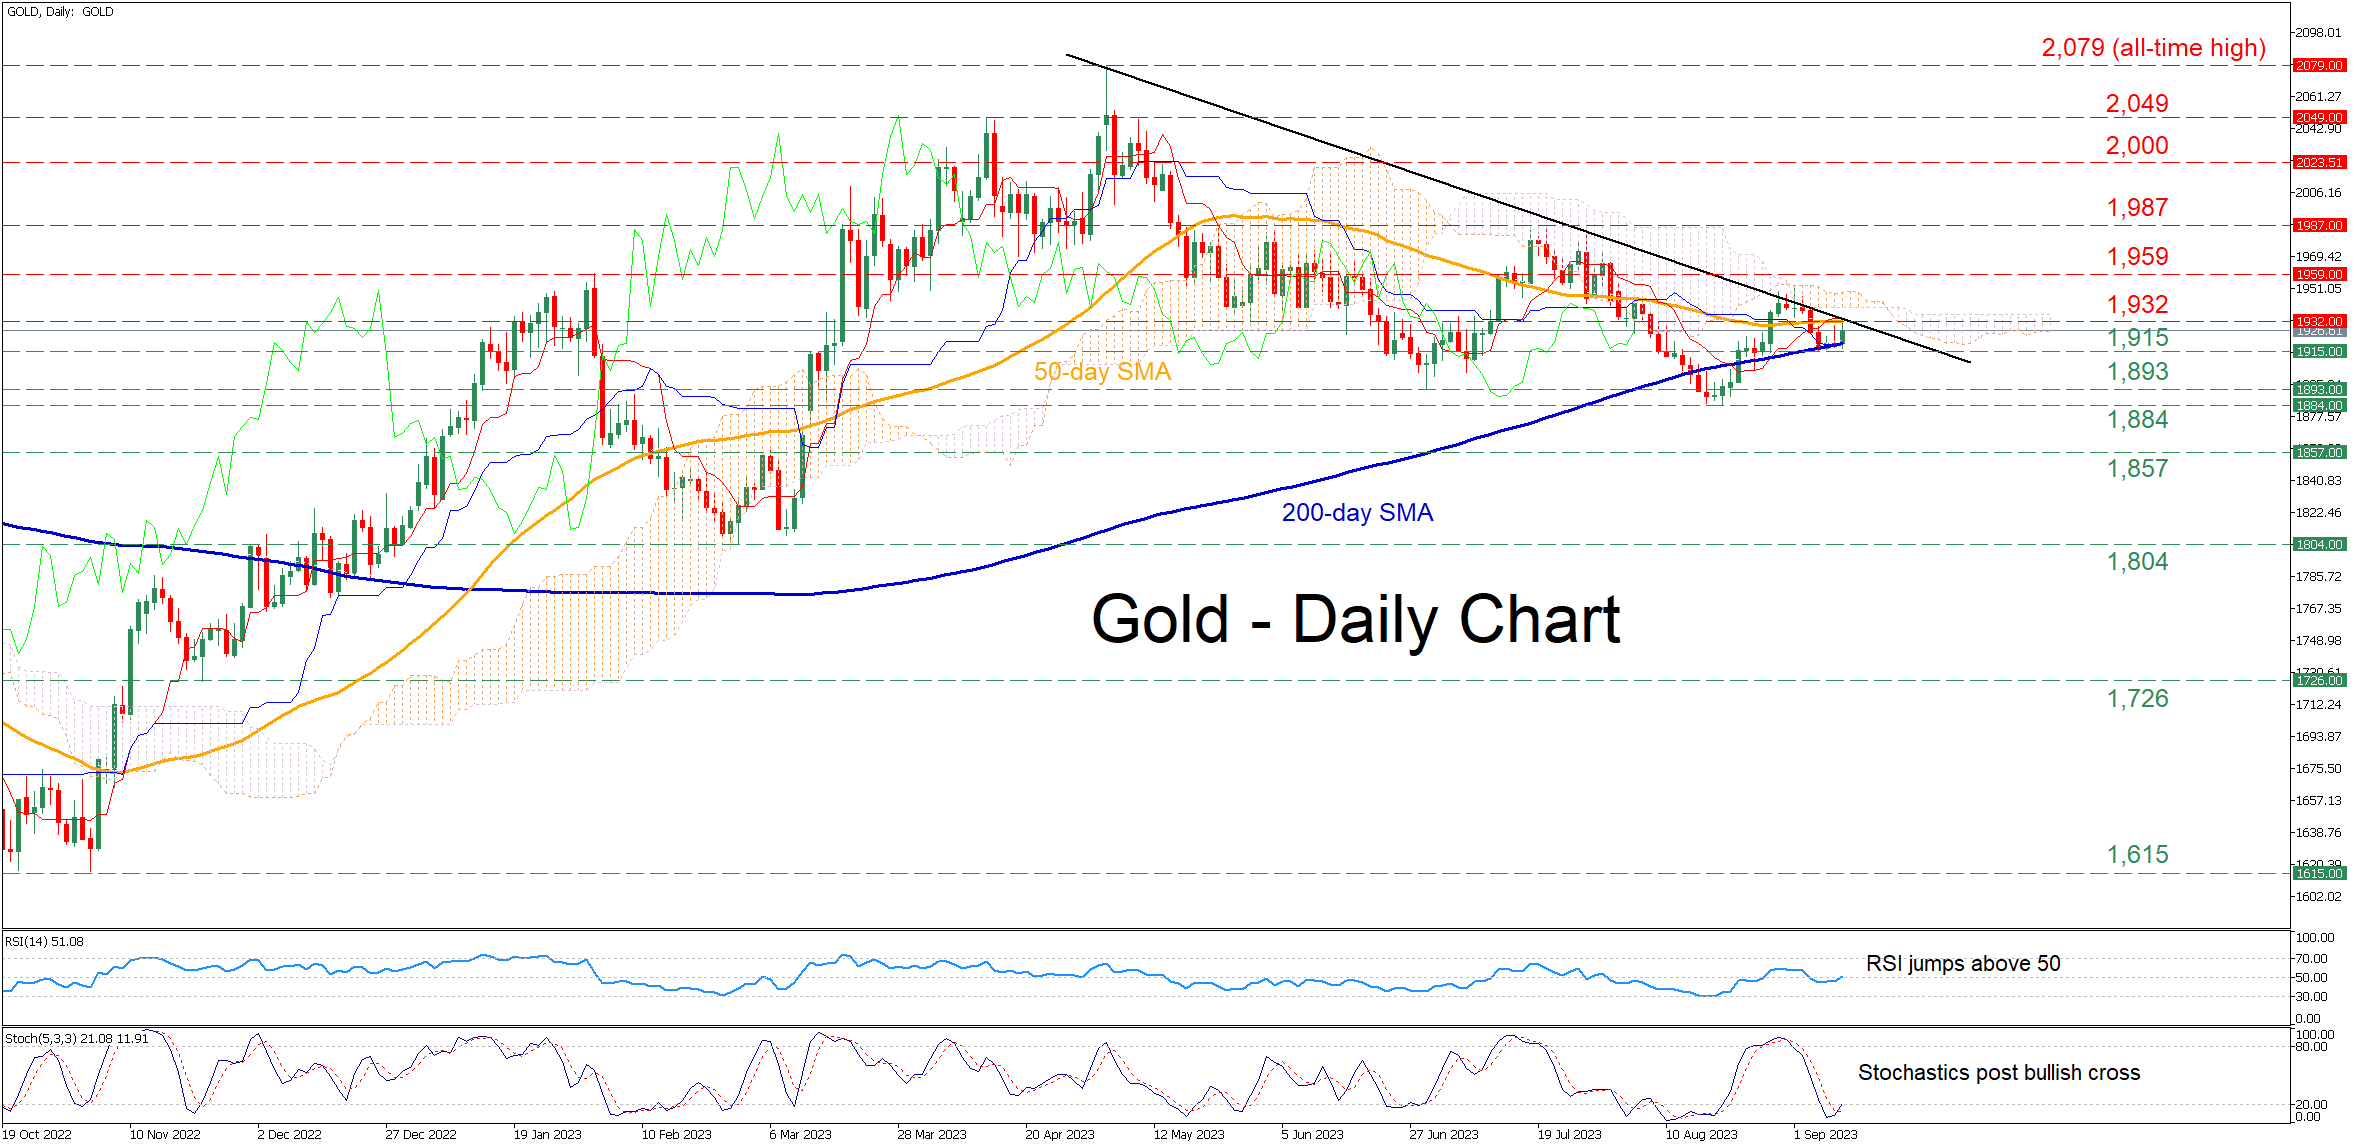
- Gold fails to pierce descending trendline
- Encounters strong support at 200-day SMA
- Is bullion headed for a re-test of the crucial barrier?
Gold experienced some losses after its advance got rejected at the downward sloping line that connects its recent lower highs. However, the 200-day simple moving average (SMA) capped the pair’s decline, with the short-term oscillators pointing to more gains in the near term.
If the price attempts to move higher, immediate resistance could be found at the May low of 1,932, which overlaps with the 50-day SMA. Conquering this barricade, the bulls could propel the price above the descending trendline before the February peak of 1,959 gets tested. Further advances may then cease at the July high of 1,987.
Alternatively, should bullion reverse back lower, the recent support of 1,915 could act as the first line of defense. A break below that zone might pave the way for the June low of 1,893. Even lower, the five-month bottom of 1,884 may provide downside protection.
In brief, gold appears to be regaining traction after bouncing off strongly from its 200-day SMA. However, a break above the downward sloping trendline is needed for the short-term picture to turn back to bullish.
Could This Week’s Data Prints Cement Next Week’s BoE Rate Hike?
- Important data releases coming up as the market is looking ahead to next week’s key events
- Average earnings figures are expected to remain elevated, sounding an alarm at the BoE halls
- The main part of this week’s data will be released on Tuesday (06:00 GMT)
The Bank of England prepares for next week’s meeting
Central banks have put the summer break behind them and are preparing for a frantic period ahead. The BoE is hosting its meeting next week, on September 21, a day after the Fed’s respective meeting. In the meantime, central bankers continue to evaluate Fed Chairman Powell’s message at the Jackson Hole gathering and strategize their own monetary policy actions after a very strong rate hiking cycle.
The BoE is making dovish noises again, but this looks like an attempt to control the ballooning market expectations. In particular, market participants assign a 75% probability for a 25bps rate hike at next week’s gathering and a decent 35% probability for similarly sized move at the November meeting. With inflation still elevated – the highest among the key developed economies – there is little leeway for BoE members not to react, especially considering the fact that the core inflation indicator - excluding energy, food, alcohol and tobacco - remains just 0.2% below its May 2023 peak. The market is anxious for some further comments this week, starting with Mann on Monday, just ahead of the usual blackout period.
Busy calendar; Average earnings data stand out
Ahead of the crucial BoE meeting though, we have a plethora of economic data releases scheduled. On Tuesday, we will get employment data and crucial information on average earnings for the month of July. In terms of the former, unemployment is expected to record another small increase, rising to 4.3%, the highest level since October 2011.
Since unemployment is a lagging indicator, the market is expected to be all over the average earnings data. As noted last month, the June print marked the first time that the annual rate of earnings surpassed the annual inflation rate. This means that since November 2011 the real disposable income for UK citizens has been negative, gravely affecting consumer sentiment.
Another strong print on Tuesday morning would prove helpful for consumers amidst the current cost-of-life crisis but the BoE members are unlikely to be as happy. The continued higher earnings prints substantially increase the possibility of second and third round effects manifesting as the higher inflation rate could become part of the public’s mindset. The latter was mentioned in the August 3 meeting’s minutes and will most likely be a part of the discussion at the next meeting.
Production data painting a brighter picture but the housing sector is feeling the pain
Amidst the current muted growth environment, the recent industrial and manufacturing production data have been improving. Both indicators managed to record their first annual positive prints since June 2022. On Wednesday, the July 2023 figures will be published and are expected to show further improvement, increasing the possibility for a strong GDP print for the third quarter of 2023.
On the flip side, the housing sector is feeling the impact of the higher mortgage rates. Mortgage approvals have dropped considerably with the actual lending figures tumbling. House prices are recording negative annual moves, for example the most recent Halifax house price index showed a 4.6% annual drop for the month of August. Consequently, the RICS house price index is expected to dive even further to negative territory.
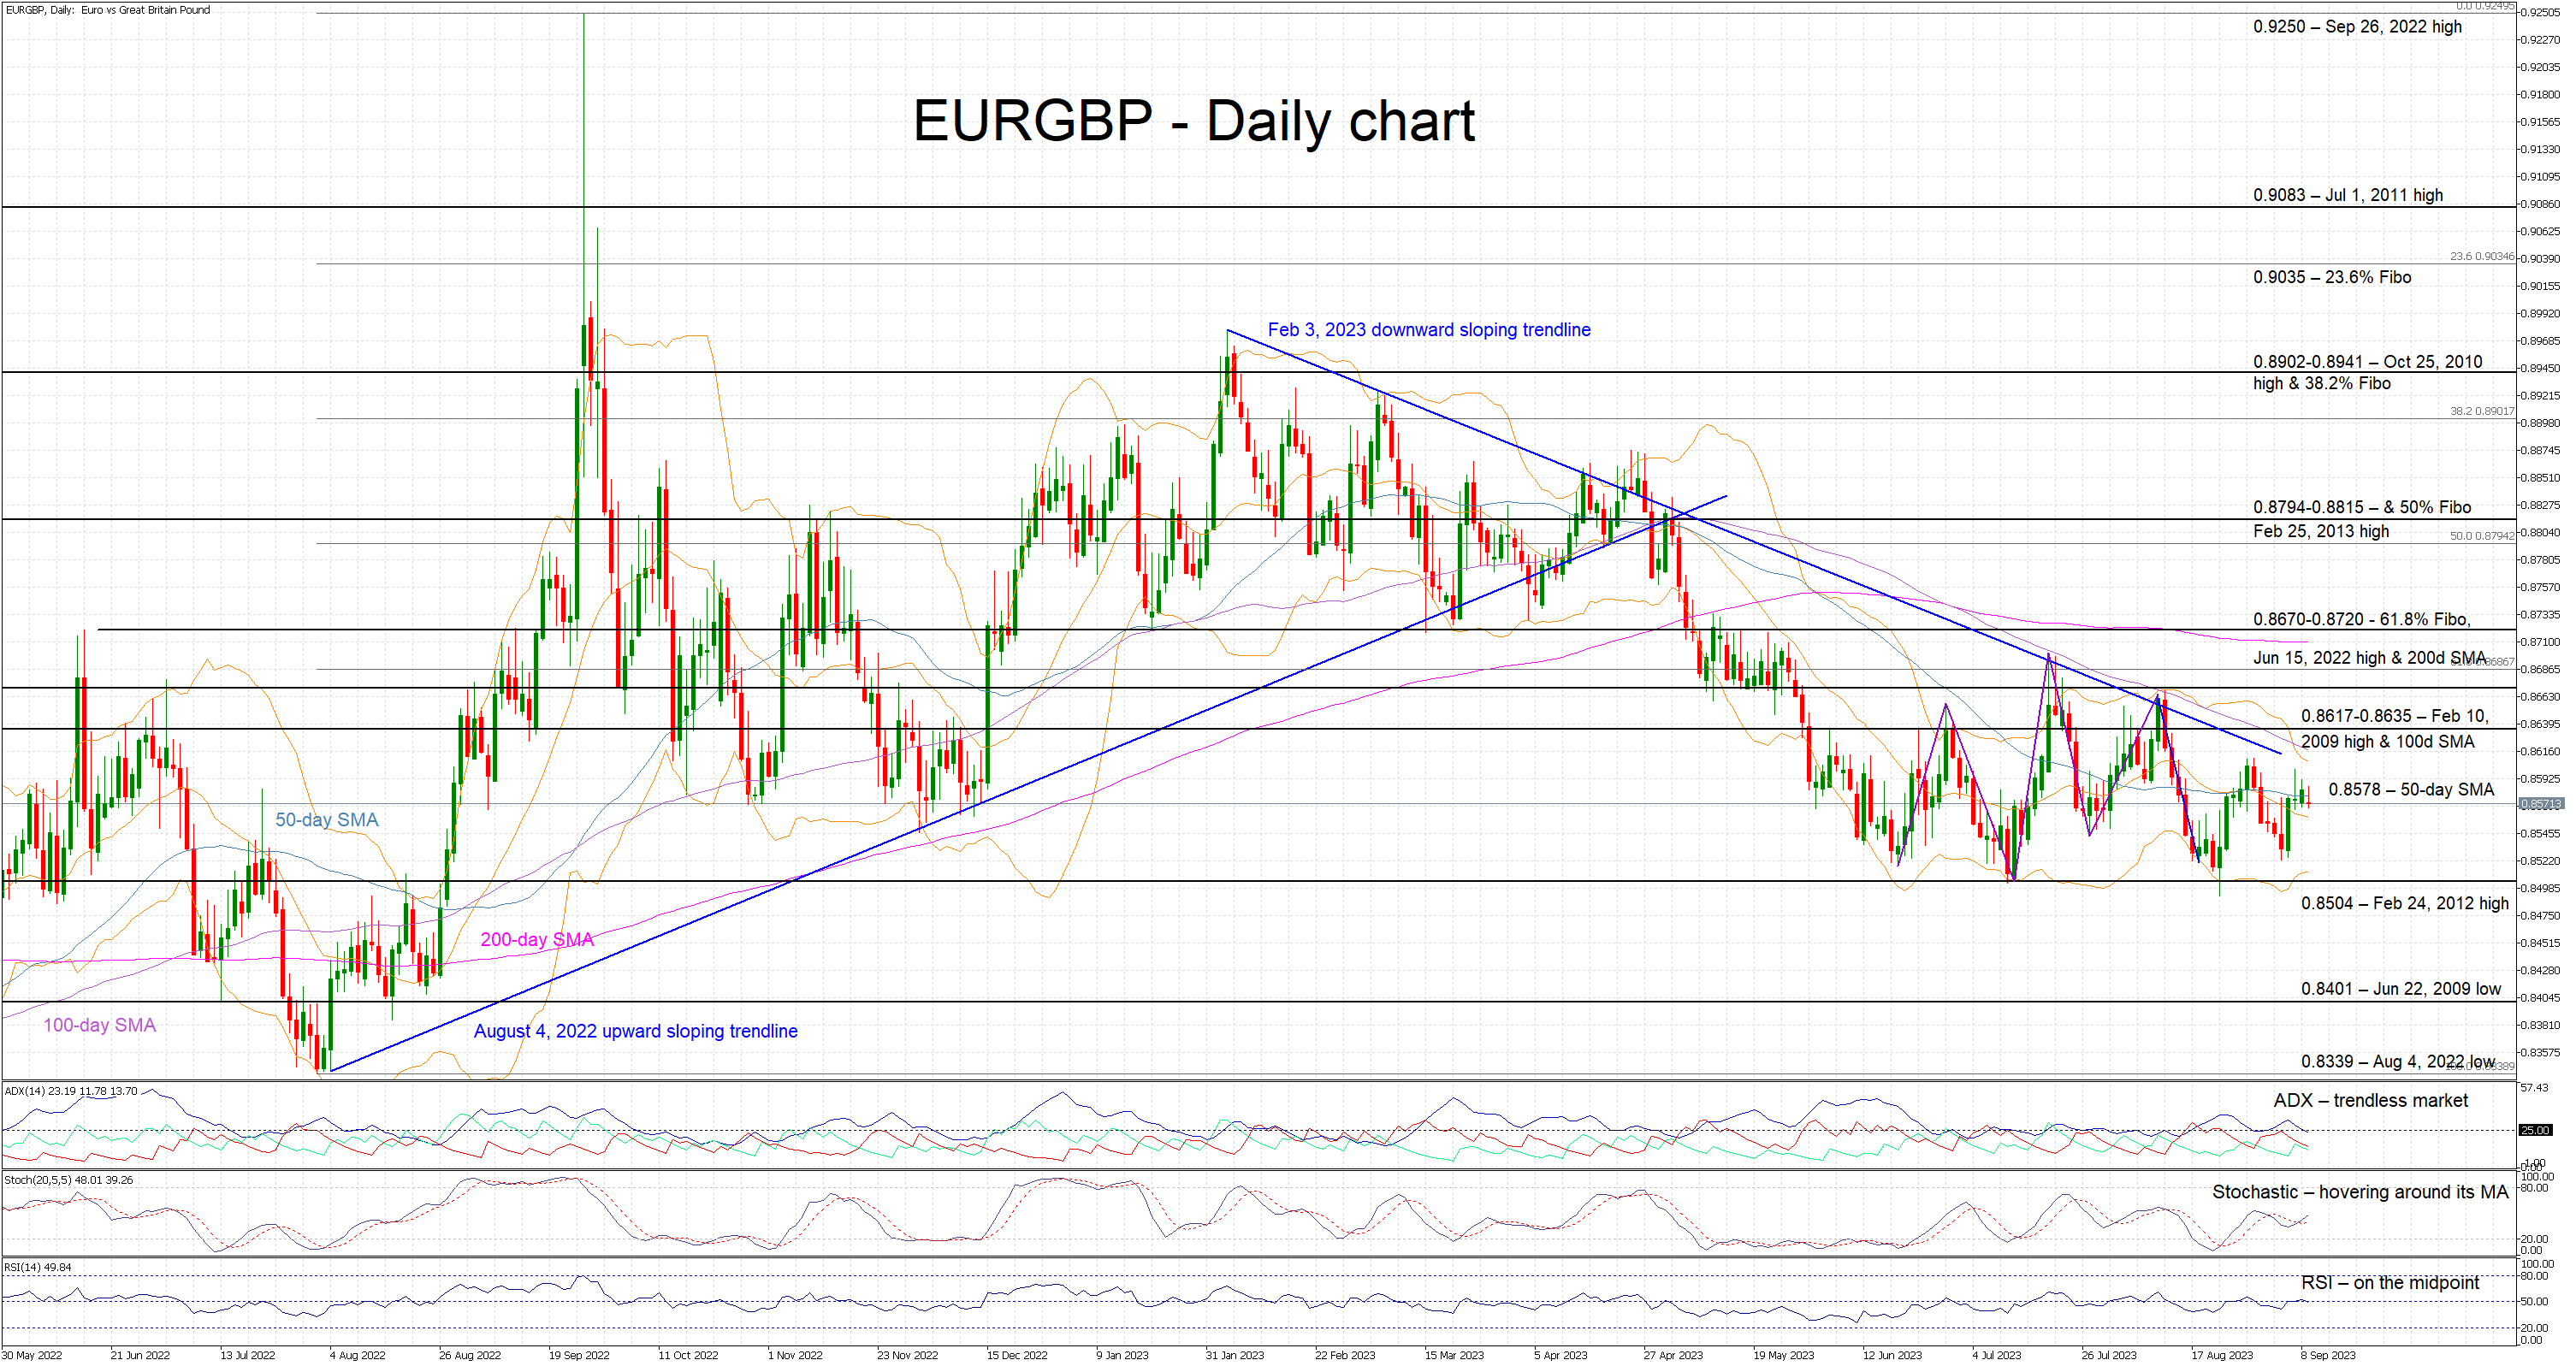
Euro-pound close to 2023 lows
Contrary to the US dollar, the pound has failed to record any gains against the euro over the past 40 days. However, this pair continues to hover at the lower end of its 2023 trading range with the market appearing to be in waiting mode. A positive set of data this week, especially strong average earnings figures, would most likely confirm the strong rate hike expectations. Consequently, the pound could get the necessary boost to record a new 2023 below the key 0.8504 level.
GBP/USD Could Recover While USD/CAD Trims Gains
GBP/USD retested the 1.2450 support and is now correcting losses. USD/CAD is correcting gains and trading below the 1.3655 support.
Important Takeaways for GBP/USD and USD/CAD Analysis Today
- The British Pound is eyeing a fresh increase above the 1.2580 resistance.
- There is a key bearish trend line forming with resistance near 1.2550 on the hourly chart of GBP/USD at FXOpen.
- USD/CAD declined below the 1.3655 and 1.3615 support levels.
- A connecting bearish trend line is forming with resistance near 1.3615 on the hourly chart at FXOpen.
GBP/USD Technical Analysis
On the hourly chart of GBP/USD at FXOpen, the pair started a fresh decline from the 1.2700 resistance zone. The British Pound traded below the 1.2550 support to enter a bearish zone against the US Dollar, as discussed in the previous analysis.
Finally, the bulls appeared near the 1.2450 zone. The pair is now attempting a recovery wave above the 50-hour simple moving average and 1.2480. There was a break above the 23.6% Fib retracement level of the downward move from the 1.2642 swing high to the 1.2447 low.
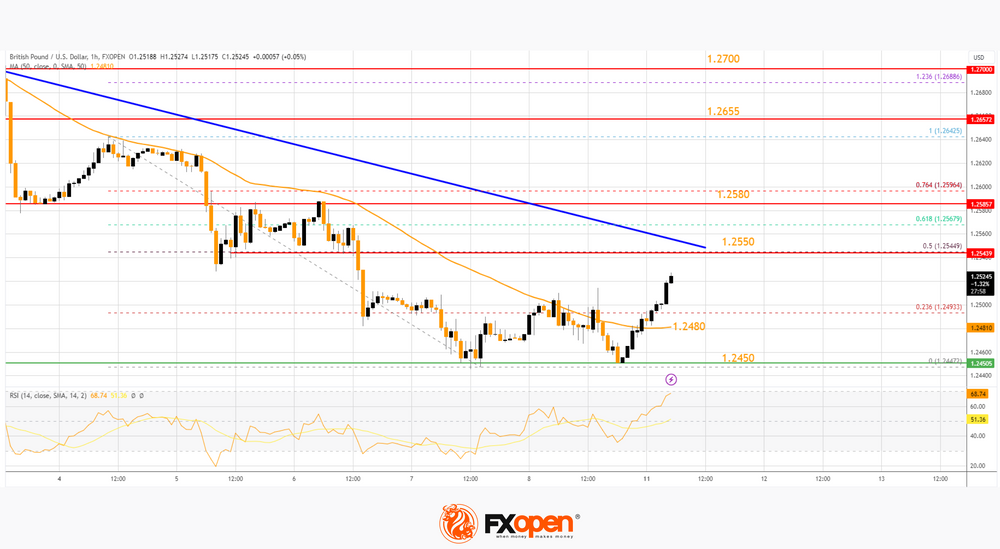
The RSI moved above the 50 level on the GBP/USD chart and the pair is now showing a few positive signs. Immediate resistance is forming near a key bearish trend line at 1.2550 and the 50% Fib retracement level of the downward move from the 1.2642 swing high to the 1.2447 low.
The next resistance is near 1.2580. An upside break above the 1.2580 zone could send the pair toward 1.2655. Any more gains might open the doors for a test of 1.2700.
On the downside, initial support is near the 1.2480 area. The next major support is 1.2450. If there is a break below 1.2450, the pair could extend its decline. The next key support is near the 1.2400 level. Any more losses might call for a test of the 1.2345 support.
USD/CAD Technical Analysis
On the hourly chart of USD/CAD at FXOpen, the pair started a fresh decline from the 1.3700 resistance zone. The US Dollar gained bearish momentum below the 1.3655 support against the Canadian Dollar.
There was also a close below the 50-hour simple moving average and 1.3615. It seems like the pair is now moving lower toward the 1.3585 support. If there is a recovery wave, the pair could face resistance near a connecting bearish trend line at 1.3615.
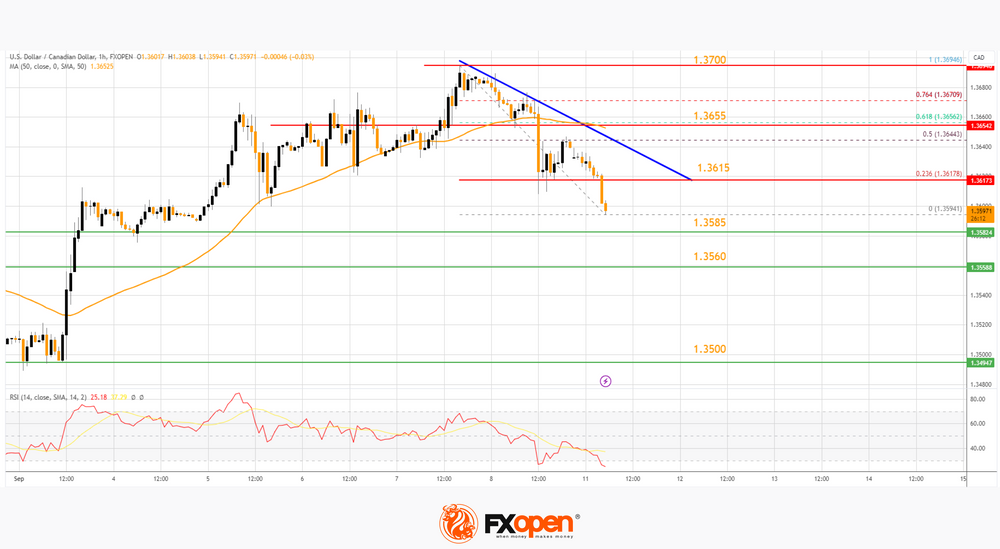
The trend line coincides with the 23.6% Fib retracement level of the recent decline from the 1.3694 swing high to the 1.3594 low. The next key resistance on the USD/CAD chart is near the 50-hour simple moving average at 1.3655.
The 61.85 Fib retracement level of the recent decline from the 1.3694 swing high to the 1.3594 low is also near 1.3655. If there is an upside break above 1.3655, the pair could rise toward the 1.3700 resistance.
The next major resistance is near the 1.3720 level, above which it could rise steadily toward the 1.3785 resistance zone. Conversely, it could continue to move down.
Immediate support is near 1.3585. The first major support is near 1.3560. A close below the 1.3560 level might trigger a strong decline. In the stated case, USD/CAD might test 1.3500. Any more losses may possibly open the doors for a drop toward the 1.3450 support.
This article represents the opinion of the Companies operating under the FXOpen brand only. It is not to be construed as an offer, solicitation, or recommendation with respect to products and services provided by the Companies operating under the FXOpen brand, nor is it to be considered financial advice.
Platinum (PL) Pullback Should Find Buyers
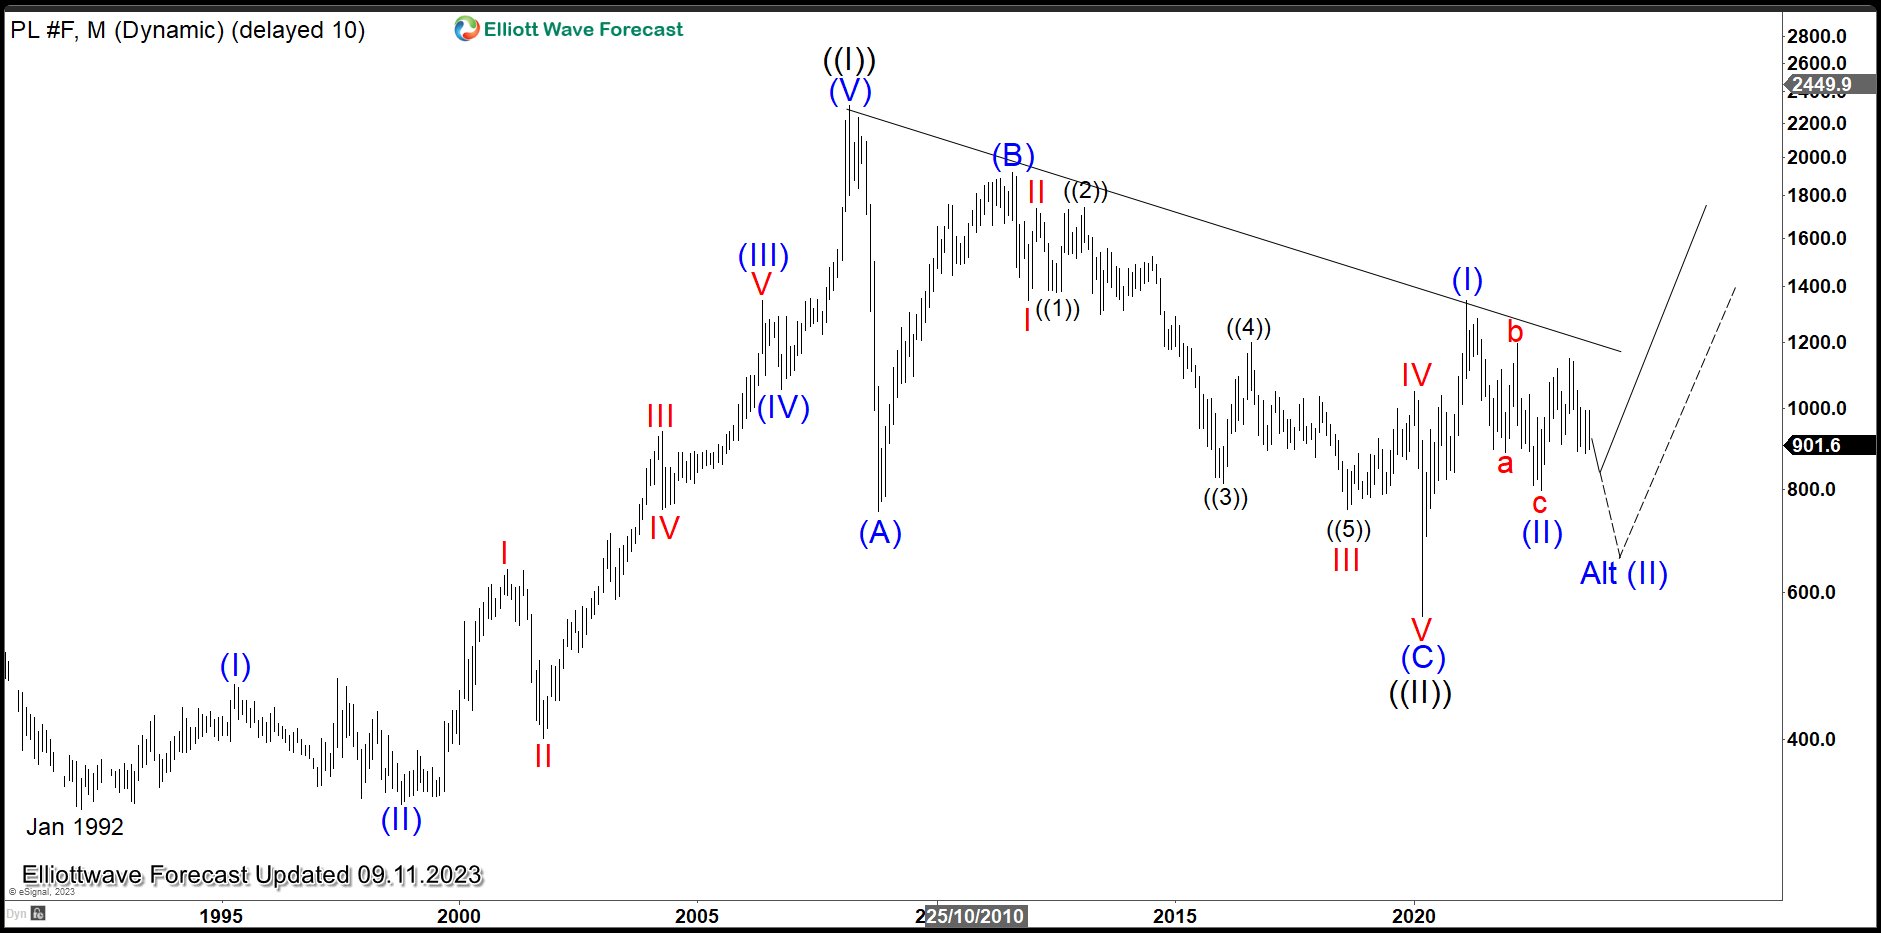
Platinum (PL) is still correcting cycle from 9.1.2022 low and the correction is unfolding as a double three. In this article, we will update the longer term Elliott Wave outlook for Platinum. We also present an alternate view if the pivot at September 2022 low (803) fails, which suggests a bigger correction against March 2020 low remains in play. In the higher time frame, the metal is in a bullish grand super cycle move higher against March 2020 low.
Platinum (PL) Monthly Elliott Wave Chart
Monthly Elliott Wave Chart of Platinum above shows that the metal has ended wave ((II)) at 562 on January 2020 low. The metal has turned higher in wave ((III)). Up from wave ((II)), wave (I) ended at 1348. Pullback from there was a clear 3 swing (corrective) and ended wave (II) at 796.8. The metal now needs to break above wave (I) at 1348 to rule out a double correction in wave (II). As far as pullback stays above wave (II) at 796.8, it can see further upside. Break below 796.8 suggests a double correction in wave (II) before the next leg higher.
Platinum (PL) Daily Elliott Wave Chart
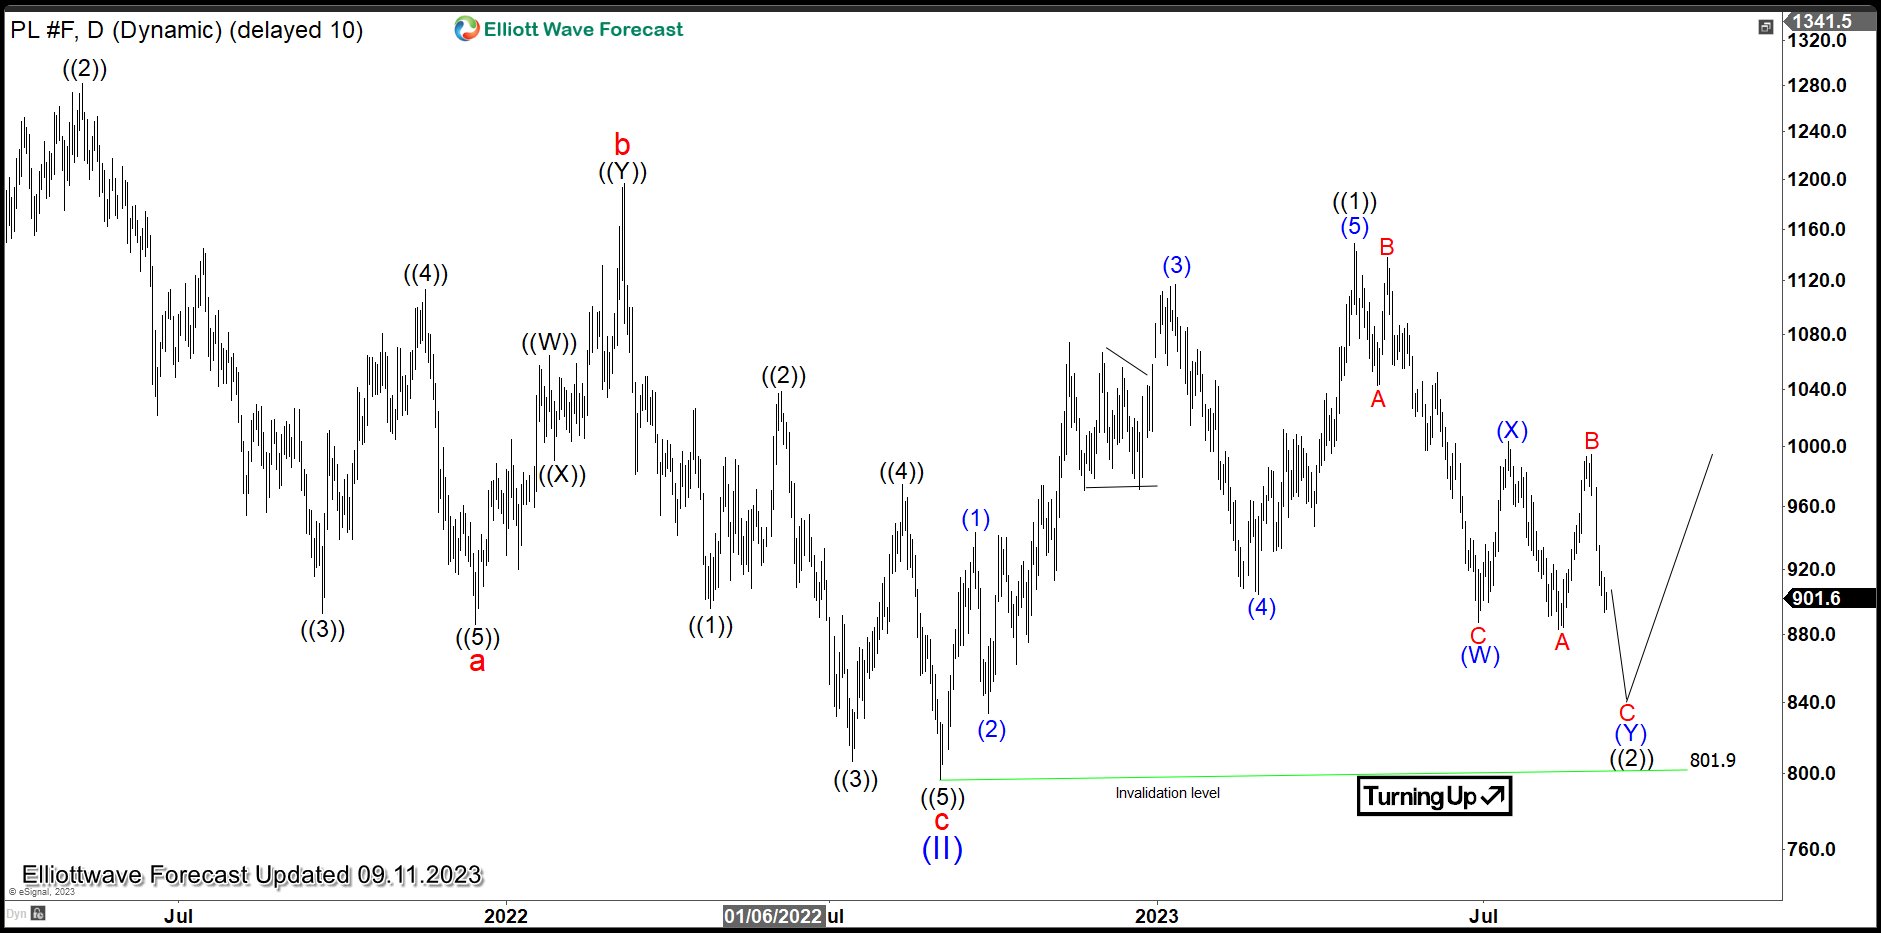
Platinum Daily Elliott Wave ChartDaily Elliott Wave Chart on Platinum above shows that the metal is pulling back in wave ((2)) to correct rally from 9.1.2022 low (801.9). Pullback is proposed to take the form of a double three. As far as pivot at 801.9 stays intact, expect pullback to find buyers and the metal to extend higher again.
Asian Currencies Lead FX Scoreboard This Morning
Markets
It’s a big week ahead, but we start rather quietly today with August inflation numbers in Czech Republic and Norway. Following last week’s upward surprise in South Korea, we start looking for more evidence of energy becoming an inflationary source again. Brent crude prices moved back above $90/b after Saudi Arabia & Russia’s joint decision to prolong unilateral production cuts by another 3 months (on top of OPEC+ cuts). Given the low comparison base, energy will at least from September on become an issue likely ending the disinflationary trend in headline CPI way before hitting central banks’ inflation targets. It could complicate the ECB & Fed’s catch 22 between stubborn inflation and weakening growth momentum even more and especially more than currently expected in the final quarter of this year. Before we arrive there, we have September updates by the ECB this week and the Bank of England next week. We expect them to both deliver a 25 bps rate hike. European money markets currently discount a 40% probability of a hike, slightly favoring a status quo. Lagarde and co switched to data dependence in July. Both data and speeches delivered by individual ECB members since then provided arguments both for the rate hike and for the rate pause camp. We expect updated inflation forecasts to still show above target inflation over the policy horizon, backing a 25 bps move. Contrary to the US, European real interest rates still hold just narrowly above 0% (0.15% for Germany 10y vs 1.9% for US) suggesting the ECB has more ground to cover. At the press conference, ECB Lagarde can afterwards put the onus on waning growth momentum and the lagged impact of previous tightening efforts to install a pause idea for the October policy meeting and allowing for a new comprehensive review in December. The Bank of England will get some final input from monthly labour market data tomorrow and the CPI next week before deciding on policy. A 25 bps hike is discounted with last week’s testimony before parliament by Bank of England Bailey suggesting caution going forward. Weak growth and the UK labour market becoming less tight are top of the BoE’s mind even as (wage) inflation isn’t under control yet. From a market-moving point of view, we think that Wednesday’s US CPI inflation figures are the real deal. Fed governors massaged another skip at next week’s FOMC meeting with money markets currently attaching a 40% probability to a final 25 bps rate hike in November.
News and views
Asian currencies lead the FX scoreboard this morning. The Japanese yen surges from a close last Friday at USD/JPY 147.83 to 146.05 currently following comments from Bank of Japan governor Ueda. He told the Yomiuri newspaper that there may be enough information to judge whether wages are rising sustainably. Wage growth is critical in the BoJ’s view of inflation hitting the 2% target in the medium term. The central bank considers the current price rally (4.3% in the core gauge) as mostly externally driven and only temporary. Having ultra-easy policy is therefore still necessary, it concludes. Should, however, domestic factor take over as the driving force, ending the era of negative interest rates is one of the options available, Ueda said. Speculation for policy normalization is lifting government bond yields as well. In an attempt to keep surging yields in check, the BoJ this morning also deployed its (bank) loans-for-bonds program by conducting a 5-year operation. The 10-y reference nevertheless adds 5 bps to top 0.7% for the first time since 2014. Ueda gave the interview just as the Japanese yen was nearing the symbolic 150 barrier, a level that sparked massive FX intervention in October of last year.
China’s yuan appreciates from USD/CNY 7.34 to 7.278, marking a blistering start of the new week even as it is still trading near the weakest levels since 2007. The strengthening move came amid three developments. Firstly, it followed in the Japanese yen’s slipstream. Second, after signaling more tolerance vs yuan deprecation last Friday, the PBOC again set a sharply stronger fixing this morning. Finally, the central bank held a foreign exchange mechanism meeting today. The statement after concluding the meeting said that the country’s financial regulators will take action against what it calls one-sided speculative moves in the market. The three strikes were combined with state-owned banks actively selling dollars today, putting a floor below the yuan, at least in the short run.
GBP/JPY Daily Outlook
Daily Pivots: (S1) 183.39; (P) 183.93; (R1) 184.80; More...
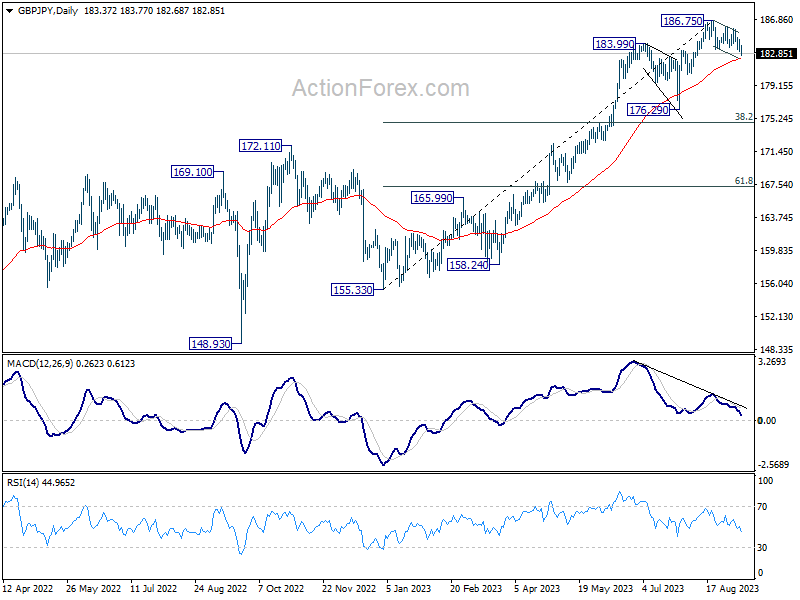
Intraday bias in GBP/JPY is back on the downside with break of 183.04 temporary low. Fall from 186.75 should target 55 D EMA (now at 182.23). Sustained break there will argue that it's already in a larger scale correction and target 176.29 support next. On the upside, break of 185.67 resistance will indicate that the pull back from 186.75 has completed. Further rise should then be seen through 186.75 to resume larger up trend.
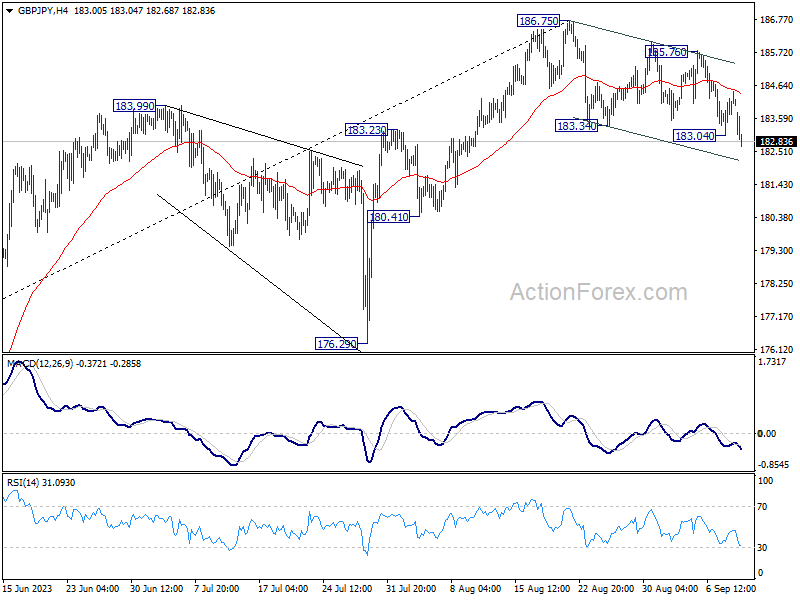
In the bigger picture, up trend from 123.94 (2020 low) is in progress. Next target is 195.86 (2015 high). This will remain the favored case as long as 176.29 support holds, even in case of deeper pull back.
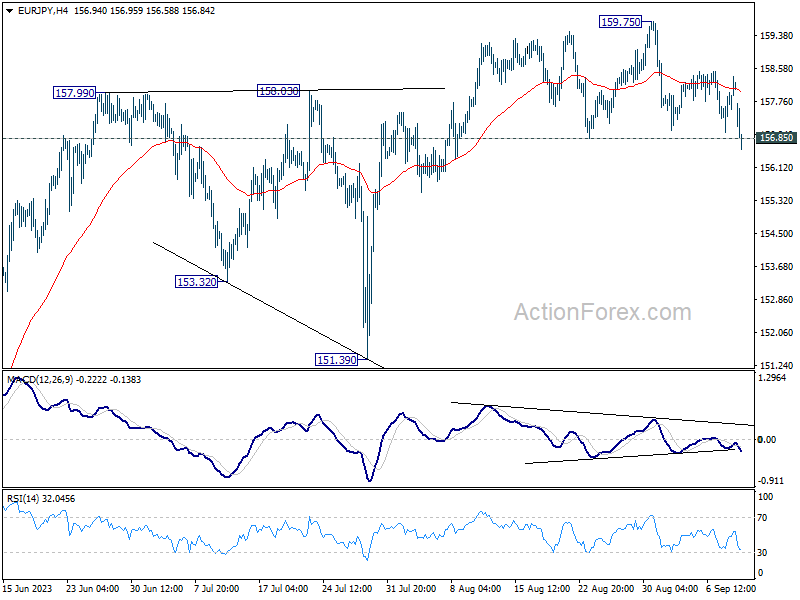
EUR/JPY Daily Outlook
Daily Pivots: (S1) 157.30; (P) 157.84; (R1) 158.69; More....
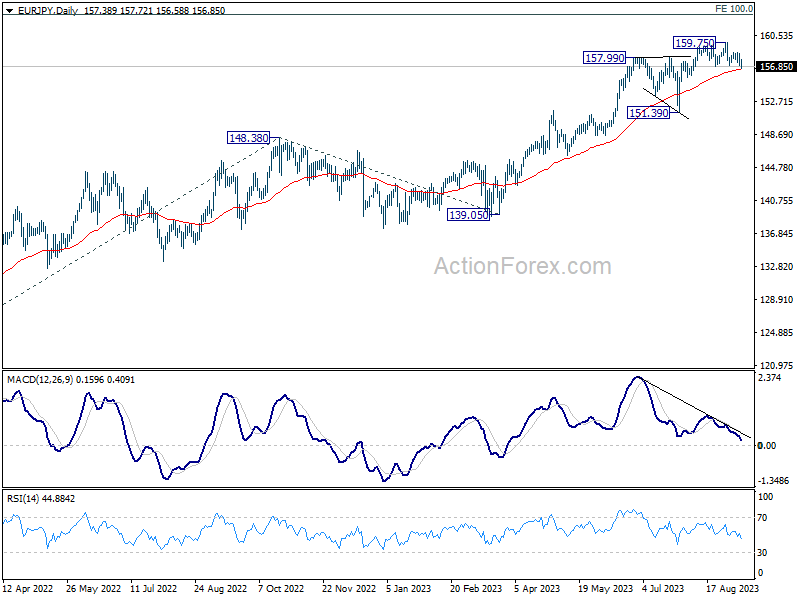
Intraday bias in EUR/JPY is back on the downside with break of 156.85 support. Sustained trading below 55 D EMA (now at 156.54) will argue that fall from 159.75 is a larger scale correction. Deeper fall would be seen back towards 151.39 support. On the upside, break of 159.75 will resume larger up trend to 163.06 projection target.
In the bigger picture, rise from 114.42 (2020 low) is in progress. Next target is 100% projection of 124.37 to 148.38 from 139.05 at 163.06. Sustained break there will pave the way to retest long term resistance at 169.96. This will remain the favored case as long as 151.39 support holds, even in case of deep pull back.
EUR/GBP Daily Outlook
Daily Pivots: (S1) 0.8570; (P) 0.8582; (R1) 0.8594; More...
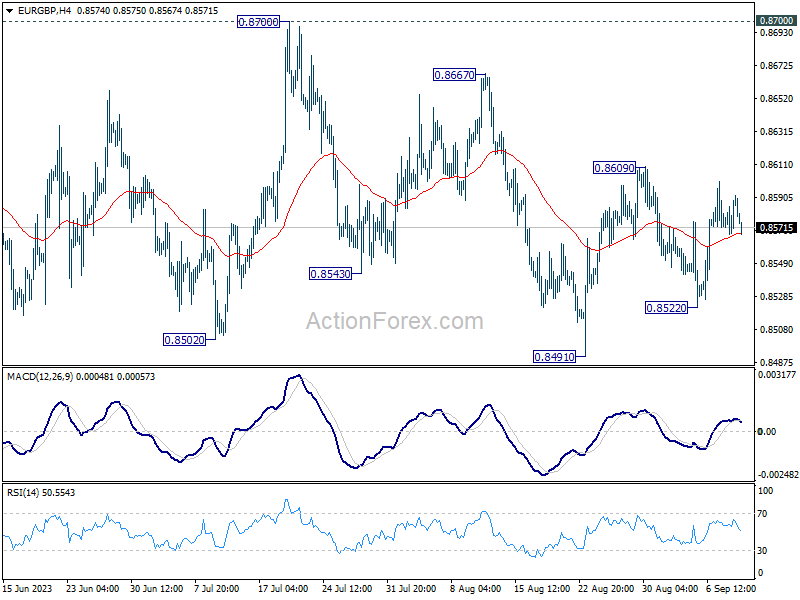
Intraday bias in EUR/GBP remains neutral for the moment. Current rise from 0.8941 could be the third leg of the corrective pattern from 0.8502. On the upside, above 0.8609 would resume the rebound and target 0.8667 resistance, possibly further to 0.8700. On the downside, however, break of 0.8522 will bring retest of 0.8491 low.
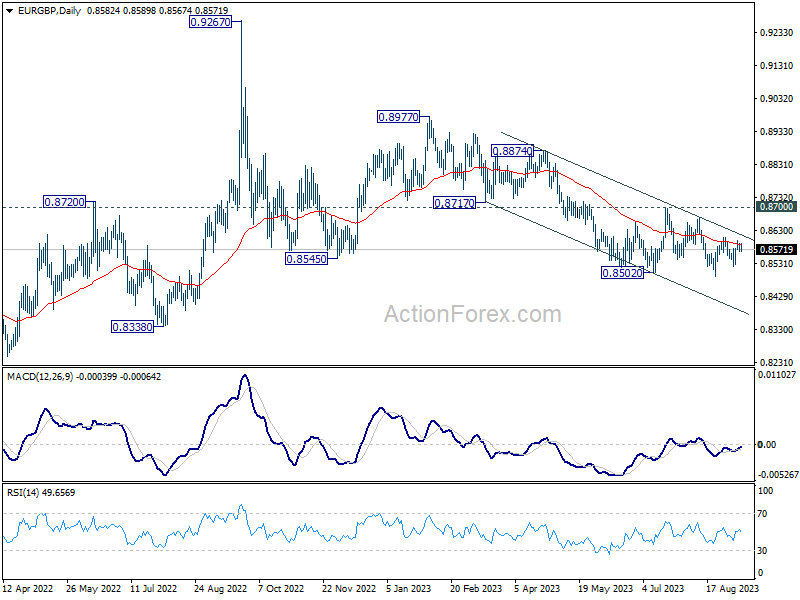
In the bigger picture, the down trend from 0.9267 (2022 high) is seen as part of the long term range pattern from 0.9499 (2020 high). Fall from 0.8977 is seen as the third leg. As long as 0.8700 resistance holds, further decline is still expected. Break of 0.8491 will resume the fall towards 0.8201 (2022 low). Nevertheless, firm break of 0.8700 will now be a sign of bullish reversal.
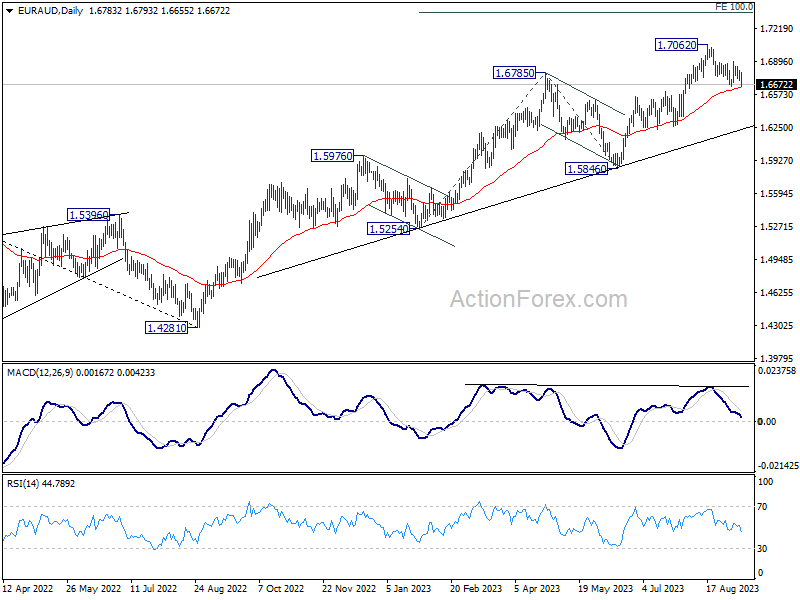
EUR/AUD Daily Outlook
Daily Pivots: (S1) 1.6727; (P) 1.6770; (R1) 1.6823; More...
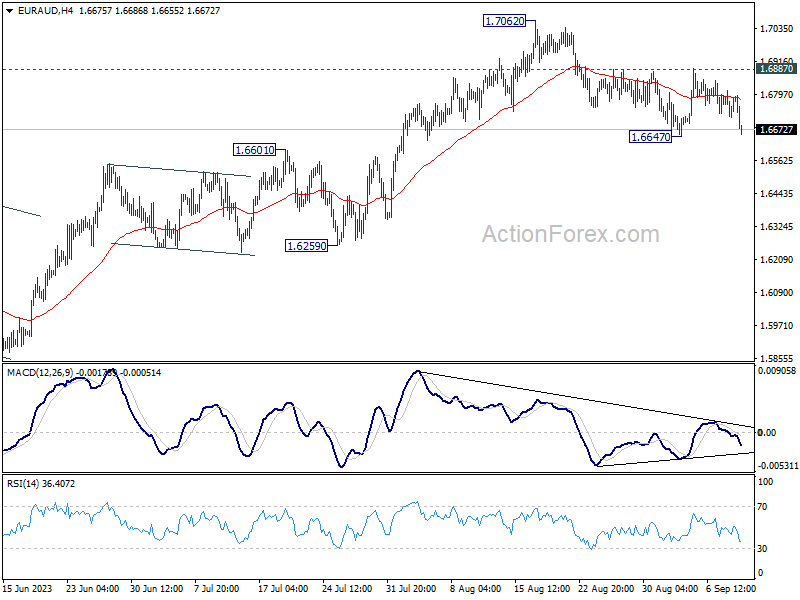
Intraday bias in EUR/AUD remains neutral for the moment. On the downside, break of 1.6647 will extend the corrective fall from 1.7062 to 1.6259/6601 support zone. On the upside, firm break of 1.6887 resistance should confirm that correction from 1.7062 has completed at 1.6647. Further rally should be seen through 1.7062 to 1.7377 projection level.
In the bigger picture, the rise from 1.4281 (2022 low) is in progress. Next target is 100% projection of 1.5254 to 1.6785 from 1.5846 at 1.7377. For now, outlook will stay bullish as long as 1.5846 support holds, even in case of deep pull back.