

Sample Category Title
GBP/USD Mid-Day Outlook
Daily Pivots: (S1) 1.2441; (P) 1.2478; (R1) 1.2504; More...
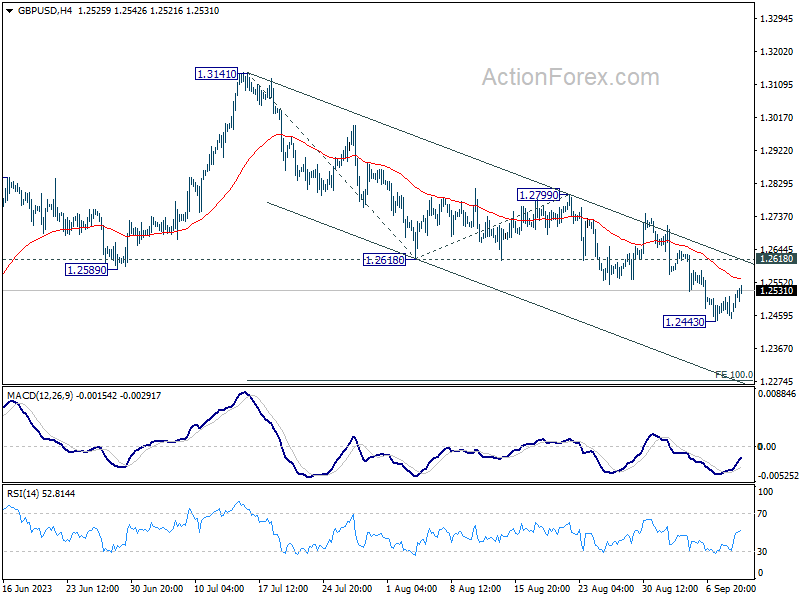
GBP/USD is extending the consolidation from 1.2443 and intraday bias remains neutral. Upside of recovery should be limited by 1.2618 support turned resistance to bring another fall. Break of 1.2443 will resume the decline from 1.3141 and target 100% projection of 1.3141 to 1.2618 from 1.2799 at 1.2276.
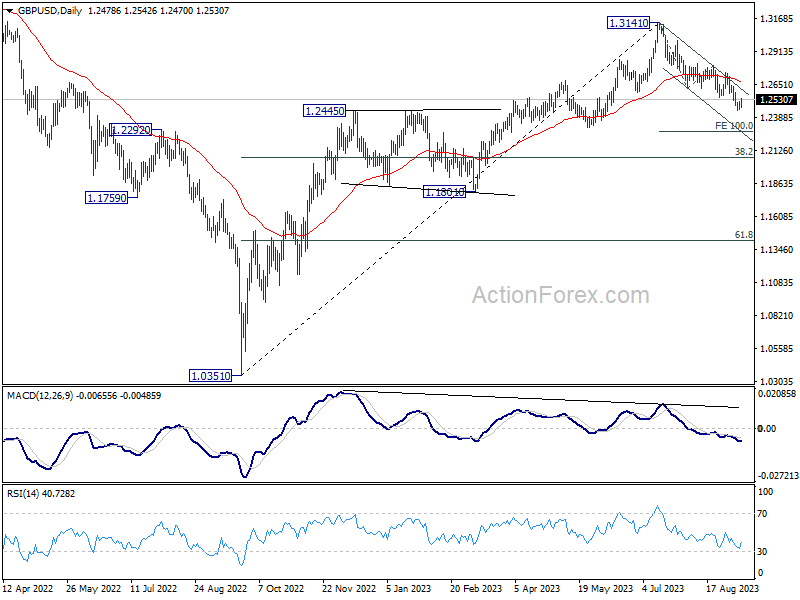
In the bigger picture, fall from 1.3141 medium term top is seen as a correction to up trend from 1.0351 (2022 low). Deeper decline would be seen to 38.2% retracement of 1.0351 to 1.3141 at 1.2075. Strong support would be seen there to bring rebound on first attempt. But outlook will be neutral at best as long as 1.3141 resistance holds, and consolidation from there is set to extend, until further development.
USD/CHF Mid-Day Outlook
Daily Pivots: (S1) 0.8904; (P) 0.8921; (R1) 0.8946; More....
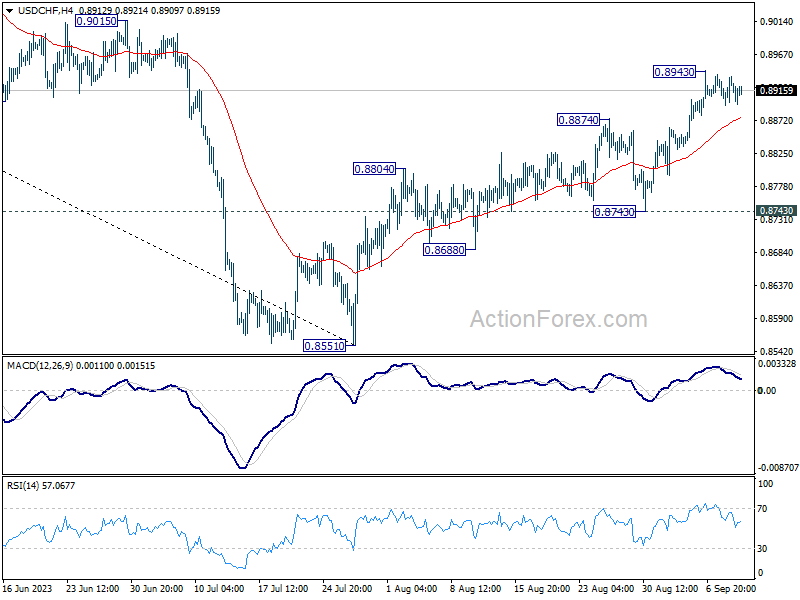
USD/CHF is staying in consolidation from 0.8943 and intraday bias remains neutral. While deeper pull back cannot be ruled out, downside should be contained above 0.8743 support to bring another rally. Break of 0.8943 will extend the rise from 0.8551 to 0.9146 cluster resistance.
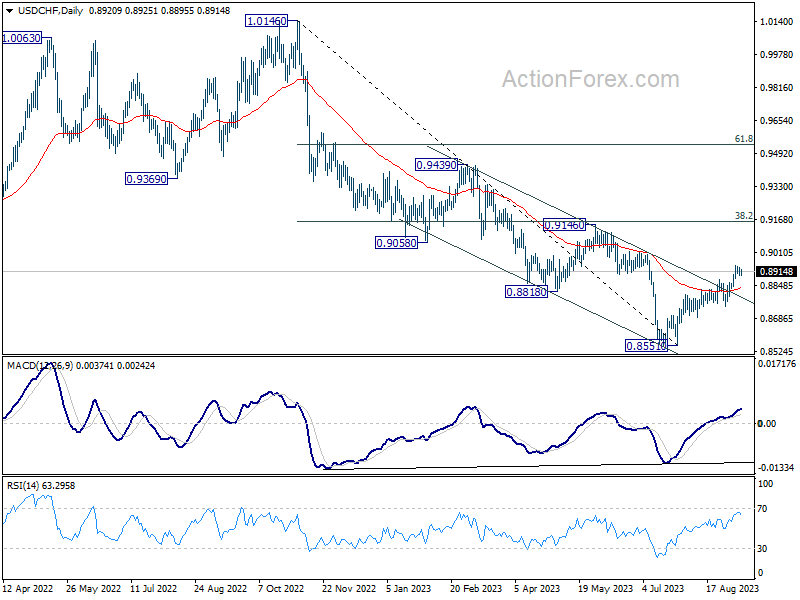
In the bigger picture, rebound from 0.8551 medium term bottom is currently seen as a correction to the downtrend from 1.0146 (2022 high). Further rally would be seen to 0.9146 cluster resistance (38.2% retracement of 1.0146 to 0.8551 at 0.9160). Strong resistance could be seen there to limit upside, at least on first attempt.
USD/JPY Mid-Day Outlook
Daily Pivots: (S1) 146.93; (P) 147.40; (R1) 147.76; More...
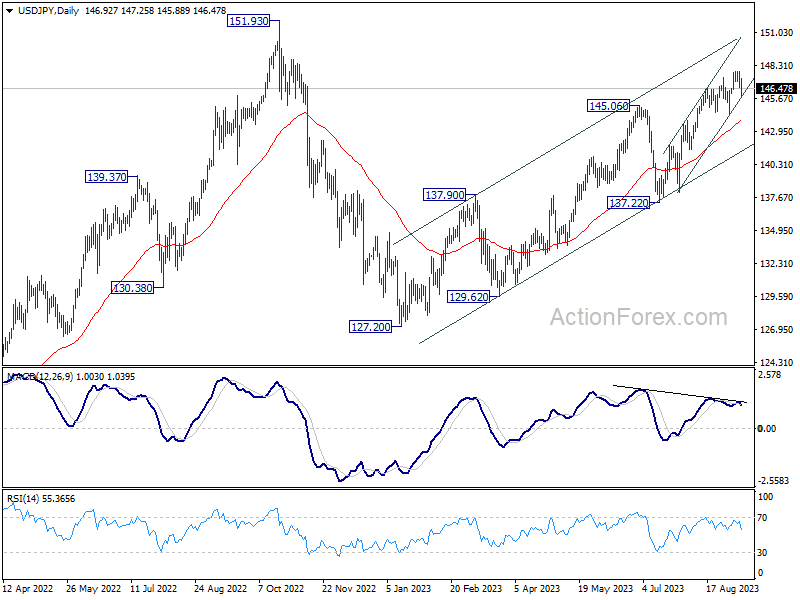
USD/JPY recovered after dipping to 145.88 today, drawing support from near term rising channel. Intraday bias remains neutral for the moment as consolidation form 147.88 could extend. But outlook remains bullish with 144.43 support intact. On the upside, above 147.88 will resume larger rise from 127.20, to retest 151.93 high.
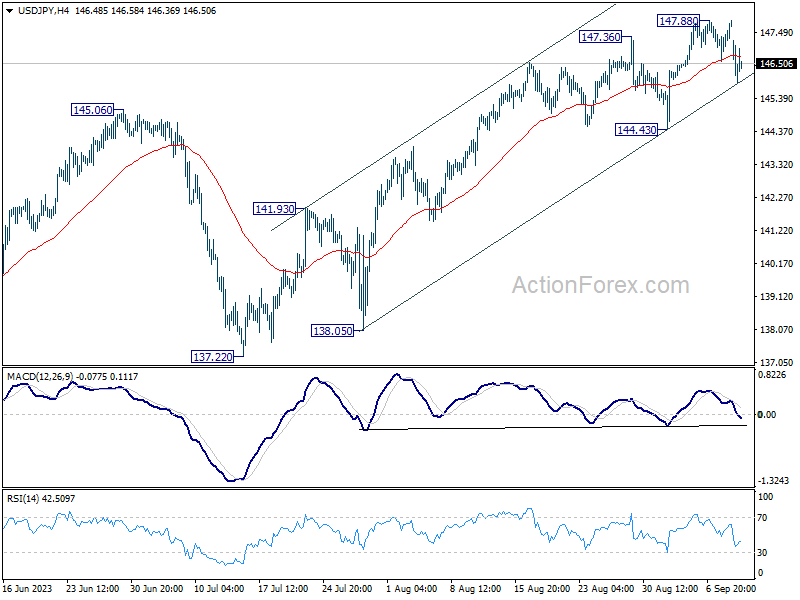
In the bigger picture, while rise from 127.20 is strong, it could still be seen as the second leg of the corrective pattern from 151.93 (2022 high). Rejection by 151.93, followed by break of 137.22 support will indicate that the third leg of the pattern has started. However, sustained break of 151.93 will confirm resumption of long term up trend.
Euro Softens Slightly on Growth Downgrade, Yen Rally Short-Lived
Trading in the European session has been relatively muted, with the primary contributor to the quietness being a notably thin economic calendar. Euro experienced a mild dip following European Commission's downgrade of growth projections for Eurozone for the current year and next. While Euro displayed pronounced weakness against commodity-linked currencies, its descent was restricted against other major peers. As market participants await ECB's interest rate announcement set for this Thursday, it seems that Euro traders are preserving their substantial positions for the time being.
Early trading saw Yen surged, primarily fueled by remarks from BoJ Governor Kazuo Ueda, stirring market chatter about a potential departure from negative interest rates by early next year. However, Yen's ascent was short-lived, with the currency giving up most of its gains by the onset of US session. Presently, the Yen ranks as the day's second-best performer, sitting behind Australian Dollar and just ahead of New Zealand Dollar.
In contrast, US Dollar has been the day's laggard, giving up some ground following its gains from the past week. Swiss Franc and Euro trail close behind in underperformance. Meanwhile, Sterling and Canadian Dollar are showing mixed performance.
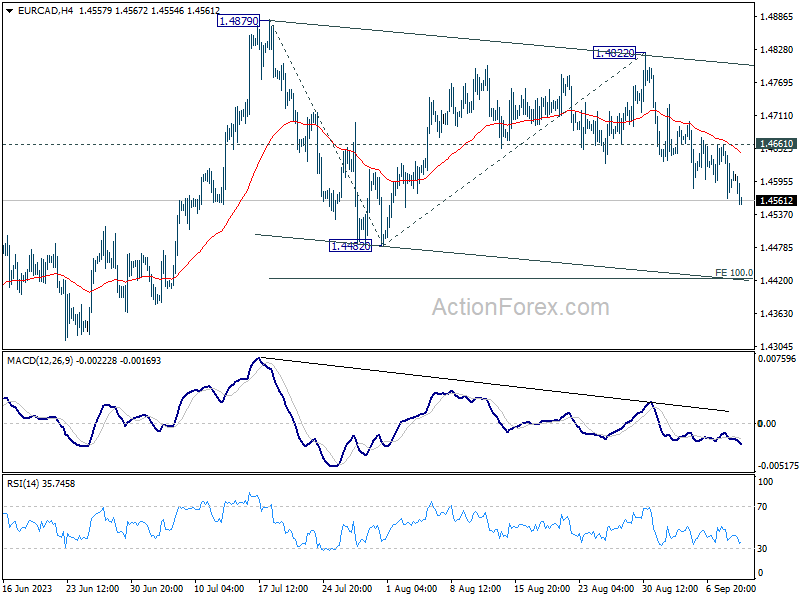
From technical perspective, EUR/CAD's bearish run from 1.4822 continues, marking a decline to 1.4554 today so far. As long as 1.4661 resistance remains intact, further downside is anticipated. The ongoing fall from 1.4822 is perceived as the third leg of the corrective pattern from 1.4879. The forthcoming targets are set at 1.4482 support, and then 100% projection of 1.4879 to 1.4482 from 1.4822 at 1.4425.
In Europe, at the time of writing, FTSE is up 0.06%. DAX is up 0.48%. CAC is up 0.59%. Germany 10-year yield is up 0.0316 at 2.644. Earlier in Asia, Nikkei dropped -0.43%. Hong Kong HSI dropped -0.58%. China Shanghai SSE rose 0.84%. Singapore Strait Times rose 0.33%. Japan 10-year JGB yield is up 0.0546 at 0.705.
EU downgrades Eurozone growth forecasts, Germany in contraction this year
European Commission, in its Summer 2023 interim forecast, revised down its growth projections for Eurozone. For 2023, growth outlook was cut from 1.1% to 0.8%, while 2024 projection was trimmed from 1.6% to 1.3%. On the inflation front, expectations for 2023 was adjusted downward from 5.8% to 5.6%, yet 2024 forecast saw a minor uptick from 2.8% to 2.9%.
Delving into individual nations, Germany's economic forecast has been dampened significantly. Growth projection for 2023 is now set at a contraction of -0.4%, a stark difference from prior 0.2% growth prediction. 2024 projection has been revised down from 1.4% to 1.1%.
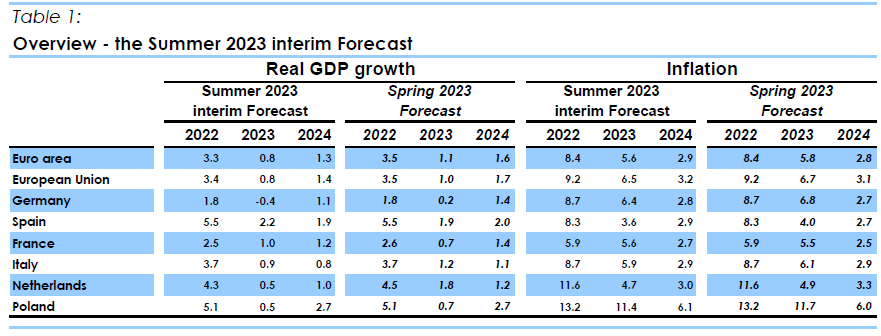
On the contrary, France has seen a boost in its 2023 growth projection, raised from 0.7% to 1.0%. However, its 2024 growth forecast was trimmed slightly, from 1.4% to 1.2%.
Valdis Dombrovskis, Executive Vice-President for an Economy that Works for People,said: "The persistently high inflation rate has exacted a heavy cost, although signs of its abating are visible. Following a spell of economic slack, we anticipate a modest rebound in growth in the coming year. This optimism is driven by a resilient labor market, historical lows in unemployment, and diminishing price pressures. Nonetheless, the economic trajectory remains uncertain, necessitating vigilant risk monitoring."
Echoing these sentiments, Paolo Gentiloni, Commissioner for Economy, stated, "Our economies have been battling numerous challenges this year, culminating in softer growth than our spring projections had indicated. While inflationary pressures are waning, the rate varies across the EU. Furthermore, Russia's aggressive actions against Ukraine persist, leading not just to human distress but also significant economic upheaval."
10-year JGB yield hits 9-year high on BoJ Ueda, Yen rebounds
Yen saw a notable uptick in Asian session, buoyed by hawkish sentiments by BoJ Governor Kazuo Ueda. Concurrently, 10-year JGB yield scaled its highest level in nine years, breaking 0.7% mark.
In an interview with Yomiuri newspaper published over the weekend, Ueda hinted at the possibility that BoJ might have sufficient data by the close of the year to contemplate ending its negative interest rate policy. Such remarks from Ueda have spurred speculation among market analysts, with some interpreting them as early signals for the markets, suggesting a potential end to negative interest rates by Q1 2024. Before this step, there also are anticipations of yield curve control being phased out later this year.
On the flip side, certain analysts, referencing recent data which highlights decelerating wage growth, argue that the transition from negative rates might not be imminent. They believe Ueda's remarks might be more of a countermeasure to Yen's recent depreciation.
Ueda, during the interview, emphasized the need for Japan to witness a consistent rise in inflation, complemented by wage growth, before implementing changes. "If we judge that Japan can achieve its inflation target even after ending negative rates, we'll do so," Ueda asserted. However, he also reiterated the central bank's stance on maintaining its ultra-loose policy for now, until there's firm confidence that inflation will consistently hover around the 2% mark, bolstered by robust demand and wage growth.
He cautioned, "While Japan is showing budding positive signs, achievement of our target isn't in sight yet." Looking ahead, Ueda underscored the importance of wage trajectories in the coming year, indicating that conclusive decisions would be data-driven. "We can't rule out the possibility we'll get enough information and data by year-end," Ueda added.
USD/JPY Mid-Day Outlook
Daily Pivots: (S1) 146.93; (P) 147.40; (R1) 147.76; More...
USD/JPY recovered after dipping to 145.88 today, drawing support from near term rising channel. Intraday bias remains neutral for the moment as consolidation form 147.88 could extend. But outlook remains bullish with 144.43 support intact. On the upside, above 147.88 will resume larger rise from 127.20, to retest 151.93 high.
In the bigger picture, while rise from 127.20 is strong, it could still be seen as the second leg of the corrective pattern from 151.93 (2022 high). Rejection by 151.93, followed by break of 137.22 support will indicate that the third leg of the pattern has started. However, sustained break of 151.93 will confirm resumption of long term up trend.
Economic Indicators Update
| GMT | Ccy | Events | Actual | Forecast | Previous | Revised |
|---|---|---|---|---|---|---|
| 23:50 | JPY | Money Supply M2+CD Y/Y Jul | 2.50% | 2.50% | 2.40% | 2.50% |
| 06:00 | JPY | Machine Tool Orders Y/Y Aug P | -17.60% | -19.80% | -19.70% | |
| 08:00 | EUR | Italy Industrial Output M/M Jul | -0.70% | -0.30% | 0.50% |
US 500 Index Challenges 50-day SMA
- US 500 index rebounds from its September low
- Bulls attack the 50-day SMA
- Momentum indicators point to short-term gains
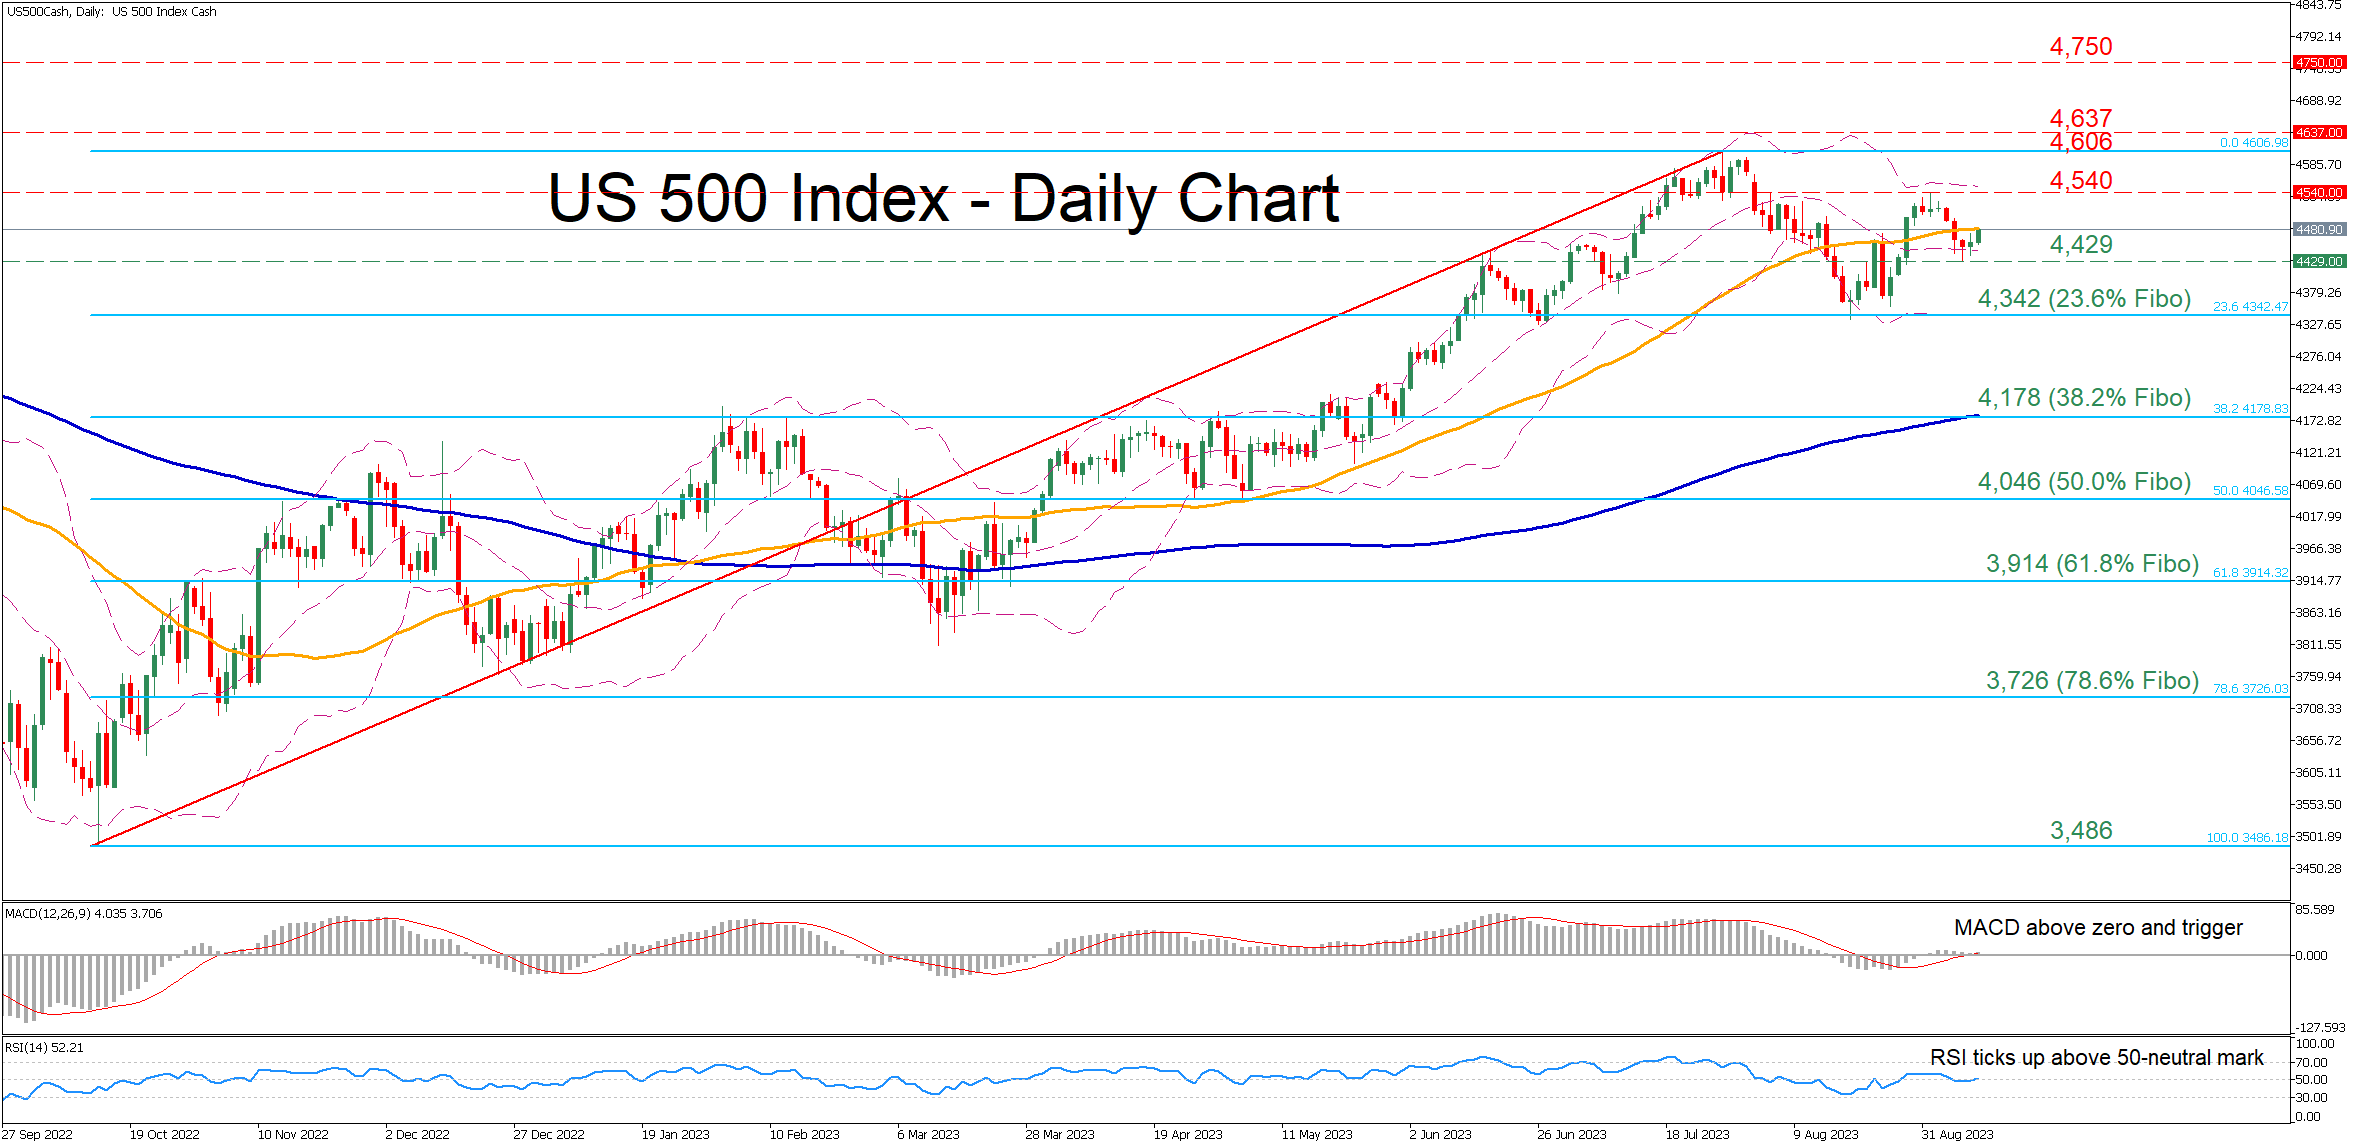
The US 500 stock index (cash) is currently testing the 50-day simple moving average (SMA), with short-term oscillators endorsing this latest advance. The MACD jumped above its red signal line in the positive zone, while the RSI is hovering above the 50-neutral threshold.
If buyers propel the price above the 50-day SMA, initial resistance could be found at the recent rejection region of 4,540. Surpassing that zone, the index might ascend towards the 16-month peak of 4,606. A break above that territory could open the door for the March 2022 high of 4,637.
Alternatively, should the bears regain the upper hand, the recent support of 4,429 may act as the first line of defence. Sliding beneath that floor, the price could challenge 4,342, which is the 23.6% Fibonacci retracement of the 3,486-4,606 upleg. If that barricade fails, attention might shift to the 38.2% Fibo of 4,178, which coincides with the 200-day SMA.
Overall, the US 500 index has regained traction, but bulls should not get excited before they conquer the 50-day SMA.
Yen Spikes after Ueda Comments, EC Downgrades Eurozone Growth Forecasts
A relatively quiet start to the week from an economic data perspective but we're still seeing some decent moves in the markets this morning, particularly in the Japanese yen.
The yen has jumped this morning on the back of comments from Bank of Japan Governor, Kazuo Ueda, who hinted that interest rates may not be negative for much longer.
Ueda reportedly claimed that if they become confident that prices and wages will keep rising sustainably, which could be as early as year-end, then an end to negative interest rates could be one option on the table. The focus for so long has been on the central bank's yield curve control policy but perhaps these comments suggest abandoning that will not be the first major move.
Of course, at a time of so much speculation around currency intervention and a rapidly weakening yen, you have to wonder what the real motivation behind these comments is and how seriously to take them. Only time will tell but for now, they've managed to give the yen a boost.
Downgraded growth forecasts for the eurozone ahead of the ECB meeting
The European Commission downgraded its forecasts for the EU this year and next, weighed down by much weaker growth in Germany. The new forecasts won't come as a major surprise and may even prove overly optimistic over time but they do come days ahead of the next ECB meeting and could tempt some policymakers into voting to pause the tightening cycle.
ECB policymakers will obviously be armed with their own forecasts when it comes to the vote but it's likely their growth expectations will be revised lower on the basis of recent releases. While markets are currently pricing in a pause this week, around 60/40 at the time of writing, I'm probably leaning more toward a final hike before pausing in October.
It's probably easier to justify a hike this week than it may be at the end of next month and I'm not sure there's enough desire at the ECB to stop at the current rates. Weaker economic readings will probably drive a lively debate and they obviously won't suggest, if they do hike, that it's job done, rather more finely balanced. But they can't ignore the progress in recent months, other economic indicators and lag effect of past moves.
Oil steadies around $90 as China data fails to give it a boost
Signs of stabilization in China don't appear to be giving oil prices much of a lift today, with Brent and WTI trading a little lower so far. While the annual CPI reading moved back into positive territory and new loans improved, traders are seemingly cautious about the outlook so are refusing to get carried away with the figures.
Oil prices have also been tearing higher again in recent weeks, aided by the Saudi/Russian decision to extend output restrictions until the end of the year. Brent is now trading around $90 where it has stalled over the last week. A sustained break above here would be a big psychological move and trigger a lot more speculation about triple-figure oil again, something we haven't seen in a year and could complicate the inflation and interest rate outlook.
Gold edges higher on weaker Dollar but focus on US CPI
Gold has steadied since the middle of last week after falling on the back of some better economic data from the US. Naturally, the focus is now on the inflation report tomorrow ahead of next week's Fed meeting but the yellow metal is climbing a little today as the dollar eases off its recent highs. If it adds to these gains it could face resistance once more around $1,950 where it ran into difficulty a couple of weeks ago.
NIKKEI (NKD_F) Buying The Dips At The Blue Box Area
In this article we’re going to take a quick look at the Elliott Wave charts of NIKKEI published in members area of the website. As our members know NIKKEI is showing impulsive bullish sequences that are calling for a further strength. Recently we got a 7 swings pull back that has ended at the Blue Box zone,our buying area. In the further text we are going to explain the Elliott Wave Forecast and trading setup.
NIKKEI Elliott Wave 4 Hour Chart 08.17.2023
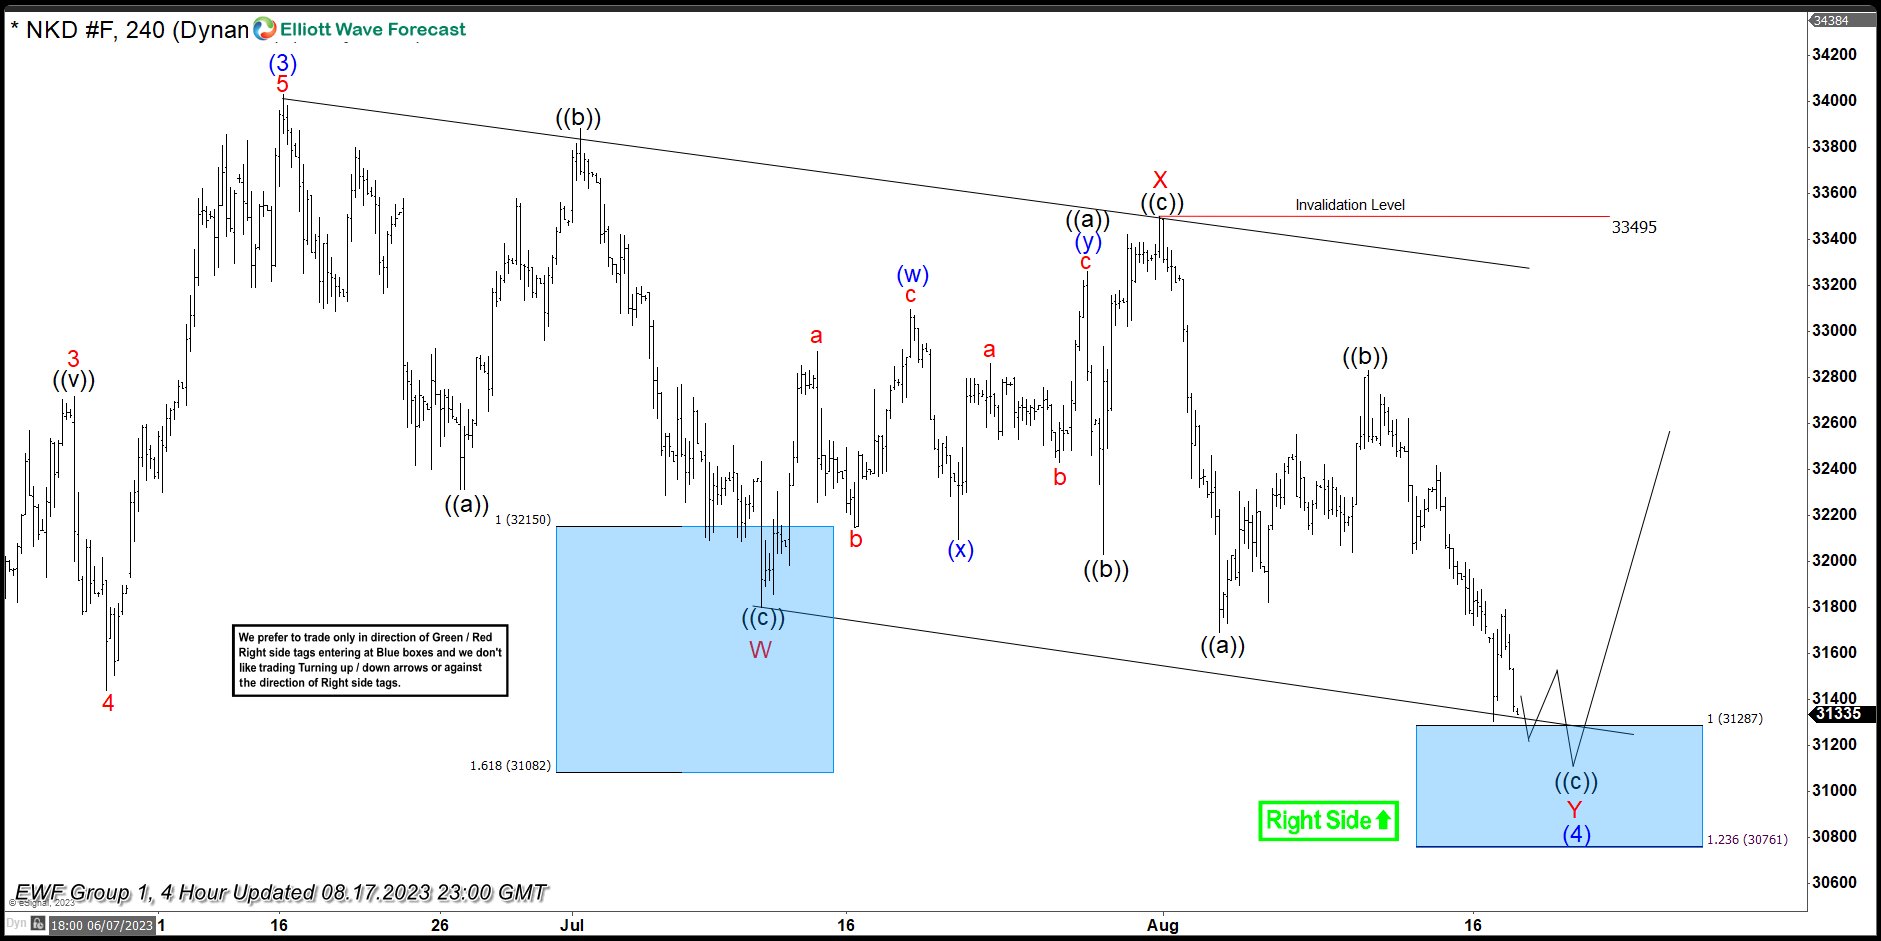
NIKKEI is giving us correction that is unfolding as a 7 swings pattern. The price is reaching extreme area at 31287-30761 blue box ( buying zone). At the moment structure is still incomplete. Another wave down should be ideally seen toward marked area. We don’t recommend selling the futures and prefer the long side. We expect NIKKEI to make a rally toward new highs or in 3 waves bounce alternatively. Once bounce reaches 50 Fibs against the X red high-33495 , we will make long position risk free ( put SL at BE) and take partial profits.
Official trading strategy on How to trade 3, 7, or 11 swing and equal leg is explained in details in Educational Video, available for members viewing inside the membership area.
Quick reminder on how to trade our charts :
Red bearish stamp+ blue box = Selling Setup
Green bullish stamp+ blue box = Buying Setup
Charts with Black stamps are not tradable. 🚫
NIKKEI Elliott Wave 4 Hour Chart 09.04.2023
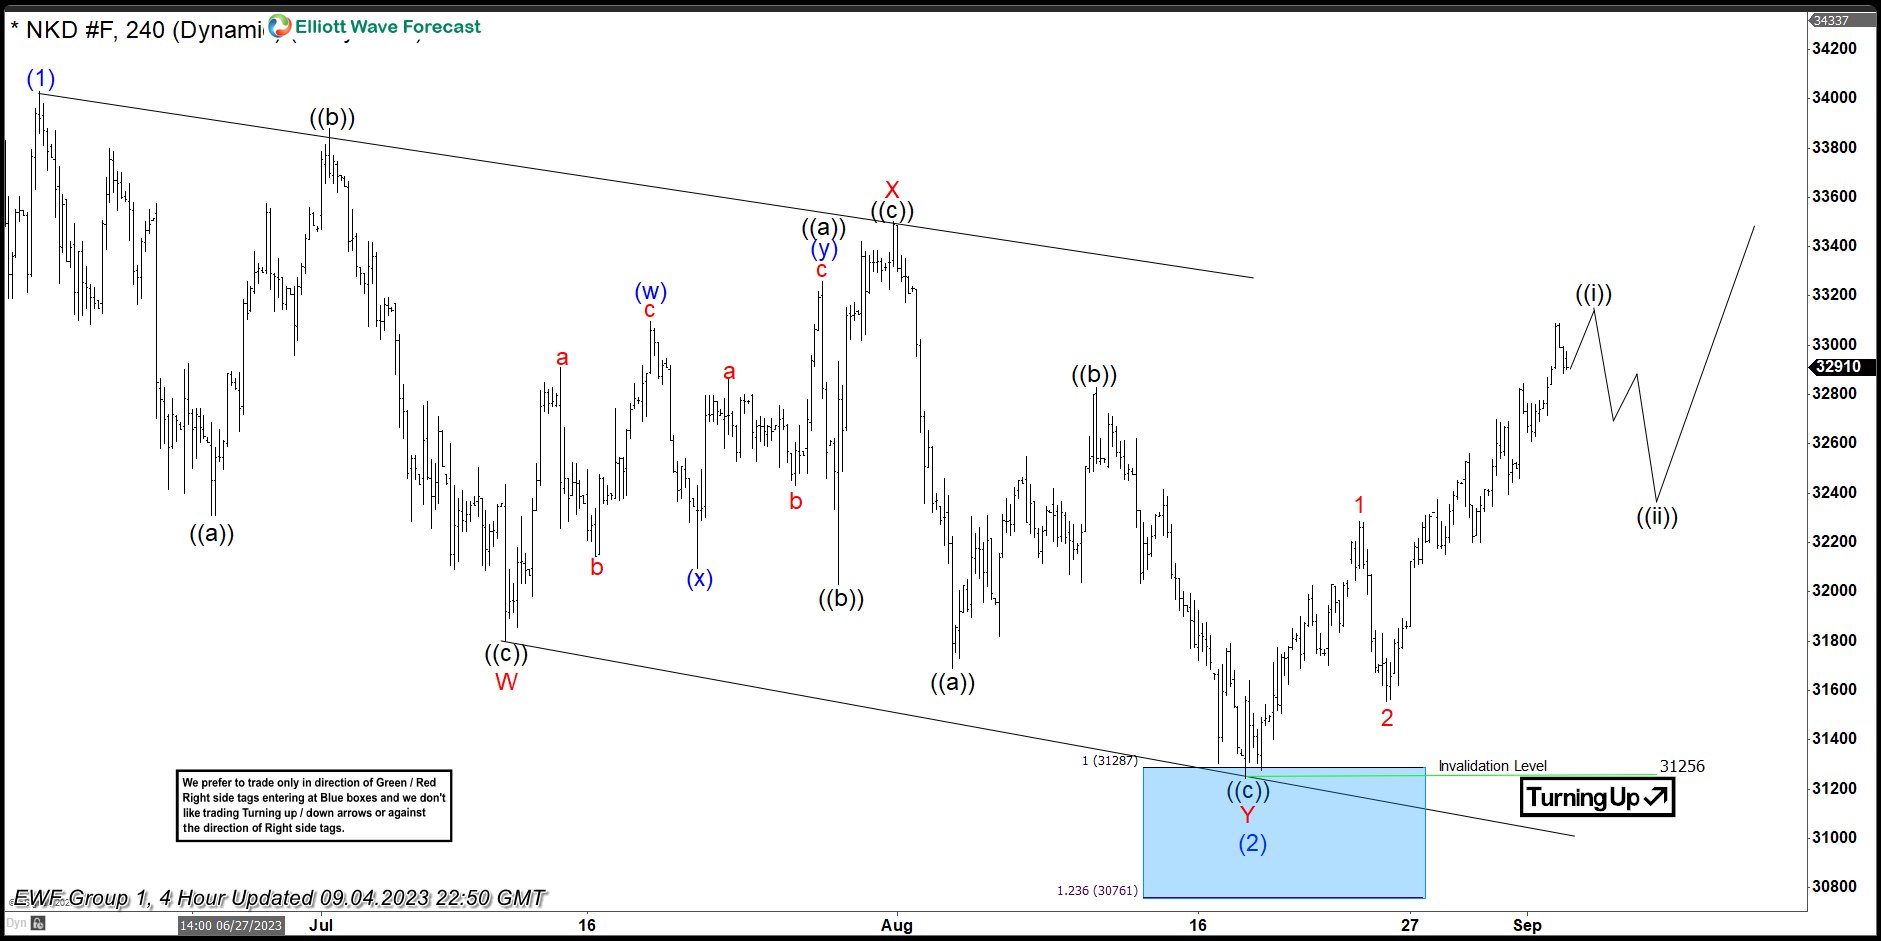
NIKKEI made the last push down as expected. The price found buyers right at the equal legs area : 31287-30761 . NIKKEI made good reaction from our buying zone. We call wave pull back completed at 31256 low. The price has reached and exceeded 50 fibs against the X red high. Consequently, members who took the long trade are enjoying profits now in a risk free positions. We would like to see break of (1) blue high :34040, to confirm next leg up is in progress.
EUR/USD Braces for Pivotal Week Ahead: An In-Depth Look
The EUR/USD currency pair kicked off the week on a vibrant note, trading around 1.0720. The days ahead promise a series of impactful events that could influence the pair's trajectory.
In the U.S., critical inflation data for August is set to be released this week. Year-over-year Consumer Price Index (CPI) figures are expected to have increased to 3.6%, up from 3.2% the prior month. On the eve of the Federal Reserve's upcoming meeting, this uptick could bring mixed sentiments. In contrast, core inflation is projected to decline to 4.3% year-over-year from the previous 4.7%.
Across the Atlantic, the European Central Bank (ECB) is scheduled to convene on Thursday to determine interest rate policy. Given the precarious state of the Eurozone's economy, the consensus expectation is that the ECB will opt to maintain its current interest rate of 3.75% per annum. Any statements or actions from the ECB are expected to significantly influence the euro's value.
Technical Analysis of the EUR/USD Currency Pair
On the 4-hour chart, EUR/USD recently completed a downward wave at 1.0686. In the short term, the market could experience a corrective rally towards 1.0755. Upon reaching this level, a fresh downward structure targeting 1.0680 may ensue. Subsequently, a bullish wave could set its sights on 1.0911. The Moving Average Convergence Divergence (MACD) indicator lends technical support to this scenario; its signal line is currently below zero but appears to be gearing up for an upward move.
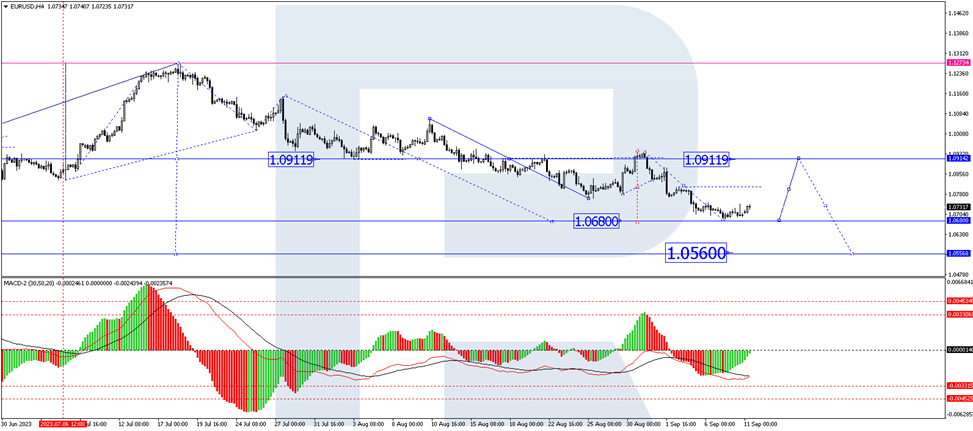
On the 1-hour chart, a consolidation zone has taken shape around 1.0720. The market at one point extended this range upward and could potentially trend towards 1.0755. Once this price level is attained, a downward movement towards 1.0680 may commence. This viewpoint gains technical validation from the Stochastic oscillator, whose signal line has recently recoiled from the 80 mark and is now oriented downward, possibly heading towards the 20 level.
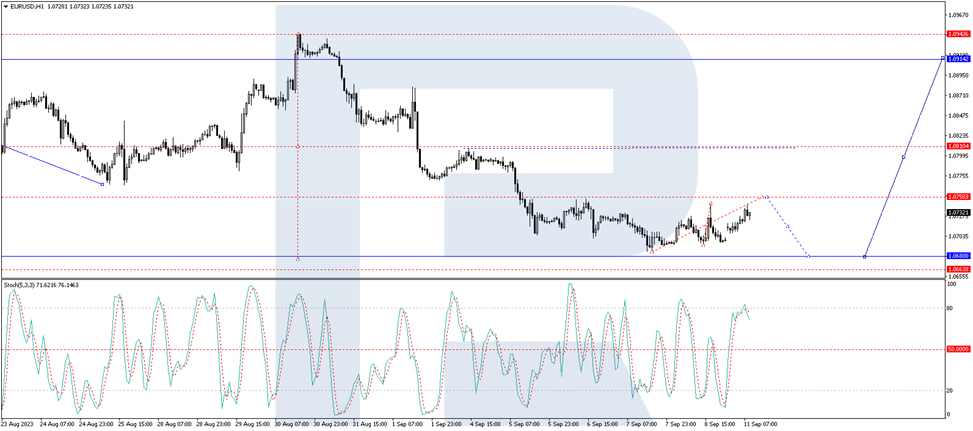
In summary, the EUR/USD pair faces a week rich in potential catalysts, with key data releases and policy meetings in both the U.S. and Eurozone. Both short-term and medium-term technical analyses suggest a mixed outlook, with opportunities for both upward corrections and renewed declines. Keep a close eye on economic indicators and central bank actions as they could drastically alter the landscape.
September Flashlight for the FOMC Blackout Period
Summary
- We look for the FOMC to keep its target range for the federal funds rate unchanged at 5.25-5.50% at its meeting on September 20. Most market participants expect rates to remain on hold as well.
- Recent data suggest that the U.S. economy generally remains resilient despite the 525 bps of rate hikes that the FOMC has delivered since March 2022. That said, it appears that the monetary tightening of the past 18 months is beginning to have its intended effect. The labor market is becoming less tight, and price pressures are easing.
- There remains some distance to go before reaching the Fed's inflation target of 2% on a sustained basis. Therefore, we expect the post-meeting statement will continue to signal that the Committee maintains a hawkish bias.
- The FOMC will release its quarterly Summary of Economic Projections (SEP) at the conclusion of the meeting. We expect that the September SEP will portray a more optimistic outlook for the U.S. economy than the last SEP did in June. Specifically, we look for the FOMC to raise its forecast for real GDP growth this year while also nudging down its outlook for inflation.
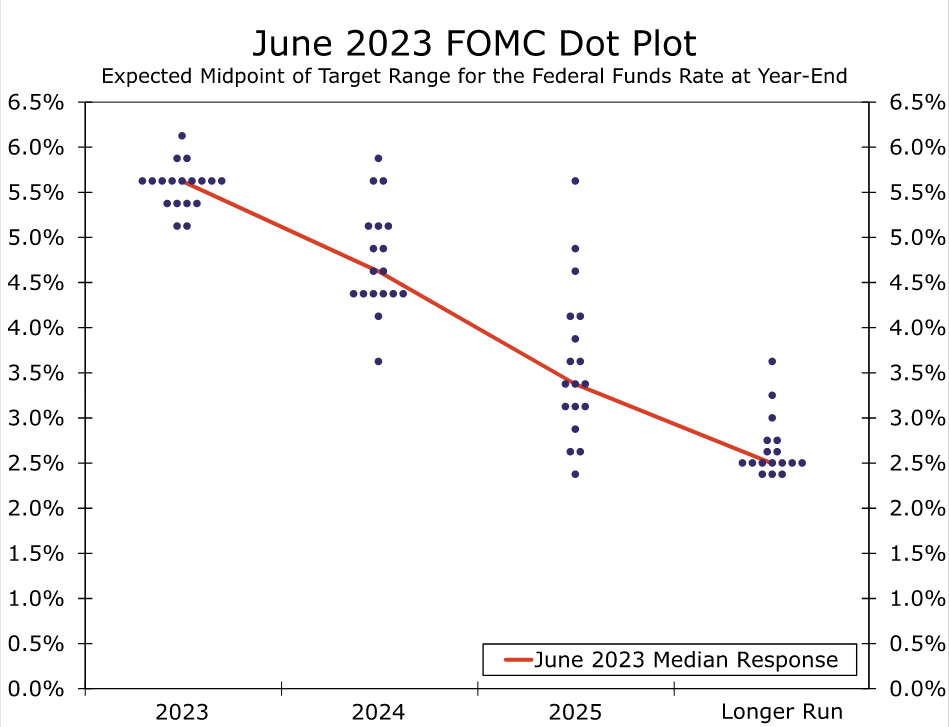
- We do not expect major changes in the "dot plot." The median dot for 2023 stood at 5.625% in the June SEP, which would imply another 25 bps rate hike between now and the end of the year. We think it will be a close call on whether the median stays at 5.625% in the new dot plot or drops to the current midpoint of 5.375%. We lean toward the latter, though the August CPI report, to be released on September 13, may be the ultimate deciding factor.
- We do not think the median dots for 2024 and 2025 will change much, if at all, though some of the highest dots may be reined in a bit.
Standing Pat in September, but with a Hawkish Bias
After having raised the fed funds target range by 75 bps at four consecutive meetings beginning in June of last year, the FOMC has gradually slowed the pace of subsequent policy tightening. The FOMC hiked rates by 50 bps in December 2022, then slowed the pace of tightening to 25 bps at each of its first three meetings of this year. A "skip" in June followed by another 25 bps hike at its most recent meeting on July 26 suggests that the pace of tightening has slowed even further, consistent with the policy rate nearing—if not already having arrived at—its ultimate destination for this cycle.
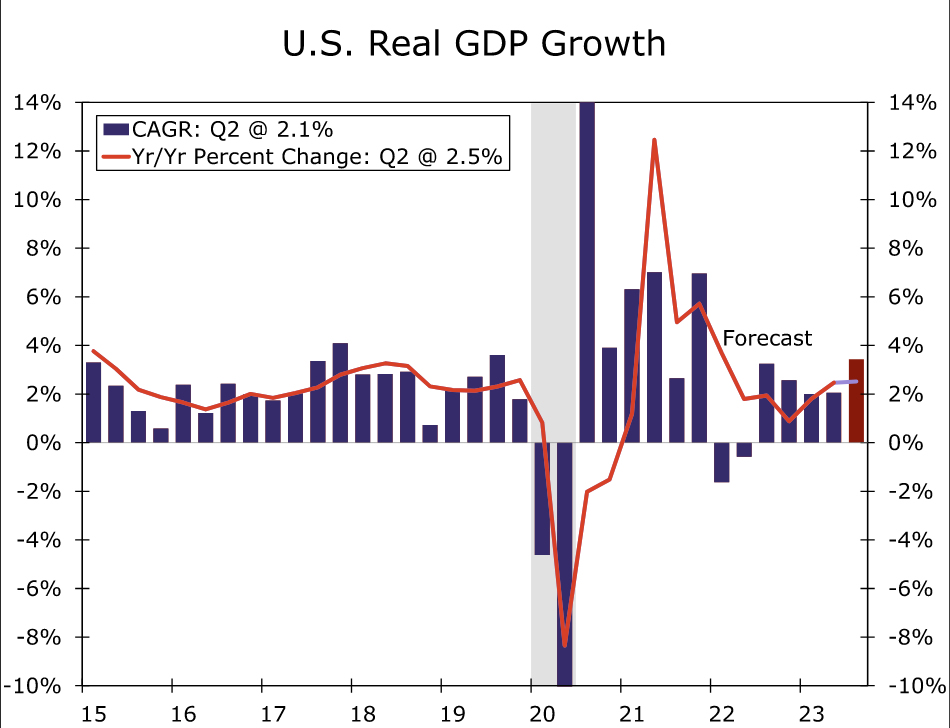
We expect the FOMC will leave the fed funds target range unchanged at 5.25-5.50% at the conclusion of its next meeting on September 20. Economic activity has continued to hold up relatively well considering the 525 bps of cumulative rate hikes since March 2022. GDP growth looks set to strengthen in Q3-2023, underpinned by a pickup in consumer spending (Figure 1). Survey data also suggest that growth has improved over the past few months, with the ISM services index rising to a six-month high in August.
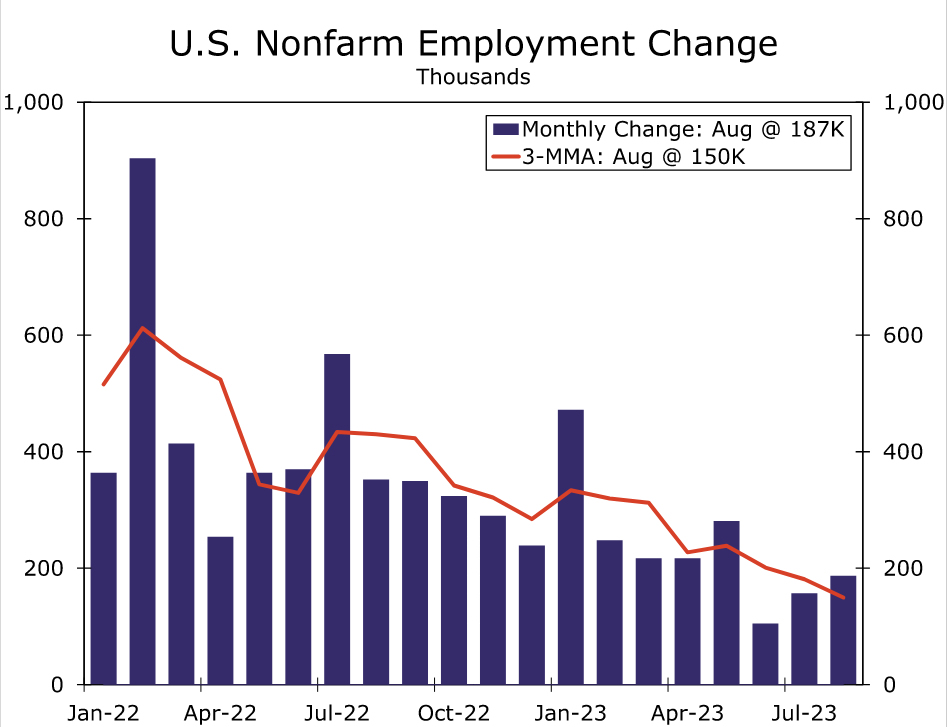
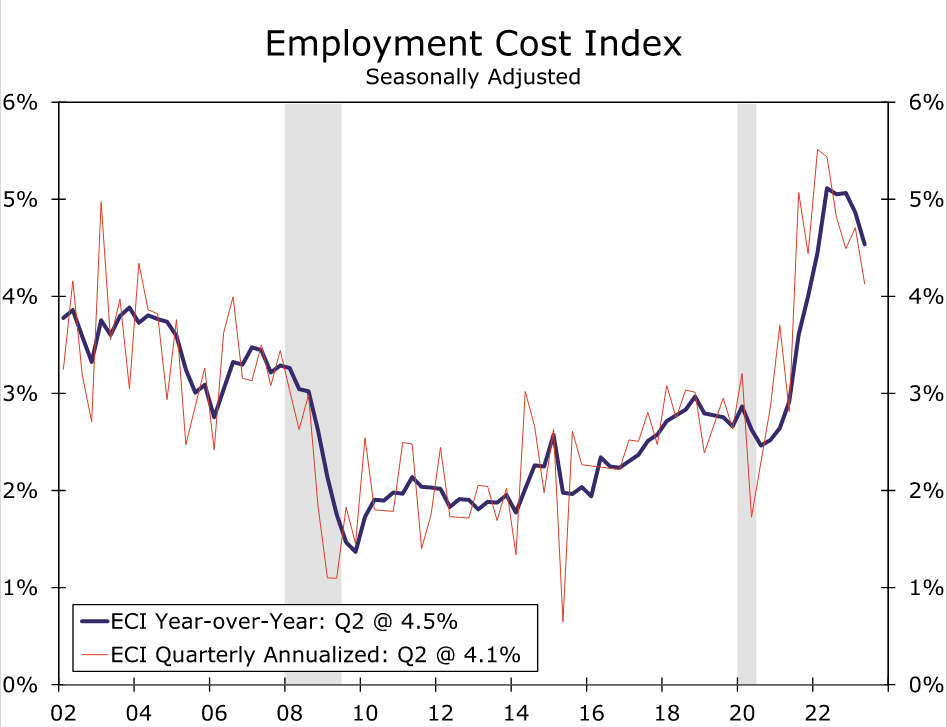
Yet recent data on the labor market and inflation suggest that the policy tightening of the past 18 months is beginning to have its intended effect more clearly. Nonfarm payroll growth has slowed to a three-month average of 150K from a reported 244K when the FOMC last met in July (Figure 2). Supply and demand for labor are moving toward a better balance. The unemployment rate rose to 3.8% in August, its highest rate since February 2022, fueled by a surge in the labor force. Demand for new workers has cooled, as evidenced by a sharp decline in job openings in July; however, low and steady layoffs indicate employers are holding on to existing workers. With businesses more easily meeting hiring needs, labor cost growth has started to slow (Figure 3).
Inflation also has started to make encouraging progress toward the Fed's 2% goal, even if there remains some distance to go before reaching it on a sustained basis. Core PCE inflation, historically the FOMC's preferred gauge of the underlying trend in inflation, slowed to a 2.9% annualized rate in July, the first sub-3% reading in two-and-a-half years (Figure 4). Some of the biggest pandemic-era drivers of inflation are fading, with core goods prices declining and housing inflation slowing over the past two months. The FOMC will get one more key inflation reading before its policy decision with the August CPI report on September 13. If core CPI prints in line with the consensus and our own expectations (+0.2% month-over-month), the three-month annualized pace of price increases would slow to 2.0%.
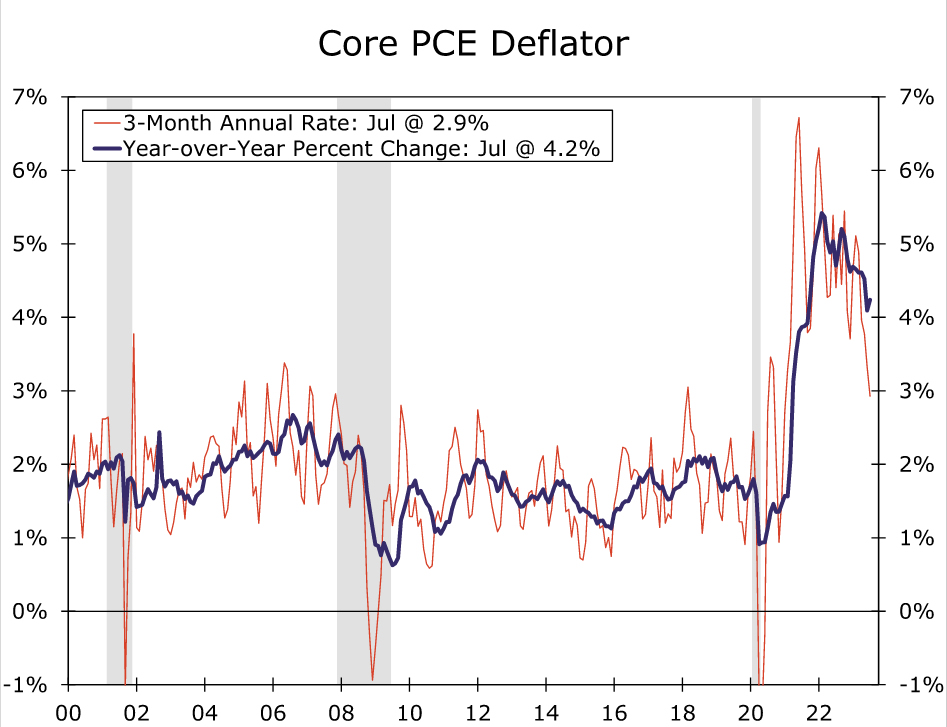
Even if the August core CPI surprises to the upside, we doubt it would spur the FOMC to hike again next week. Policymakers have been stressing that the cumulative amount of rate hikes and uncertainty surrounding the lagged effect of policy changes require moving more cautiously at this juncture of the cycle and assessing a longer period of data before determining its next move. In addition, a few relatively hawkish members of the Committee have indicated they are comfortable leaving the fed funds rate unchanged in September. For example, in an interview on September 5, Governor Waller said that the recent data would "allow us to proceed carefully" and that "there's nothing that is saying we need to do anything imminently." Furthermore, the FOMC has been loath to spring a surprise decision on markets. Interest rate futures contracts currently point to less than a 10% chance of a hike next week, a rather low probability if next week's decision hinged on the outcome of Wednesday's CPI report.
With progress on inflation still tentative, the labor market cooling only gradually, and GDP continuing to chug along, we expect the post-meeting statement will continue to signal that the Committee maintains a hawkish bias. Specifically, the statement likely will note considerations for "additional policy firming" rather than hint at an extended pause in order to maintain optionality at its following meeting on November 1. The characterization of current economic conditions in the post-meeting statement are likely to be little changed, except for a modest downgrade to the description of recent job growth.
Summary of Economic Projections: A More Optimistic Outlook
The September FOMC meeting will include an update to the Committee's Summary of Economic Projections (SEP). The last SEP was released at the conclusion of the June 13-14 FOMC meeting, and since then the economy has outperformed expectations. The June SEP contained a median real GDP growth projection of 1.0% for 2023. Based off the strong data over the past few months, we expect this forecast will be revised materially higher, perhaps as high as 2.0%. We suspect the median projection for real GDP growth in 2024 and 2025 will be revised a bit lower to reflect that some of the anticipated slowdown has been delayed rather than forgone, but we doubt the downward revisions will be as big as the upward move for 2023. Accordingly, we expect the median projection for the unemployment rate to tick down by a tenth or two for 2023 and beyond.
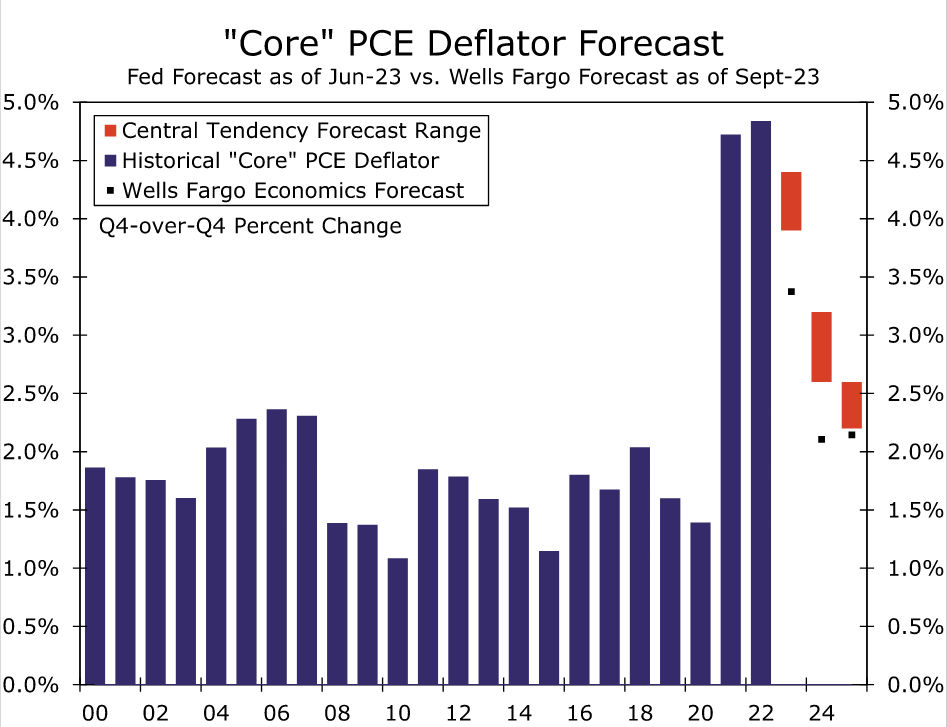
Perhaps even more encouragingly, this more optimistic outlook for output growth and the labor market likely will be accompanied by some downward revisions to the Committee's inflation projections. As discussed earlier, the slowdown in inflation over the past few months has been impressive. In June, the median FOMC participant expected headline PCE inflation of 3.2% and core PCE inflation of 3.9% for 2023. Our latest forecast looks for headline and core PCE inflation to be 3.0% and 3.4%, respectively, on a year-over-year basis in Q4-2023 (Figure 5). We doubt the Committee's projection for 2023 core PCE inflation will fall all the way to 3.4%, but 3.6% or so strikes us as plausible. The 2024 and 2025 median projections for core inflation may also tick lower by a tenth or so. If realized, this would mark the first downward revisions to the Committee's median core inflation projections since 2020, a key sign that the central bank is feeling more confident that it is starting to get price growth back in check.
What will a stronger economy and slower inflation outlook mean for the dot plot? We suspect the answer is not much. Given that inflation continues to recede, we doubt the FOMC will want to signal tighter monetary policy than what was conveyed in the June SEP. That said, we doubt the median dots will fall much either. Committee members probably will be wary of sending an overly dovish signal when the fight against high inflation remains incomplete. The June projections showed a median fed funds rate of 5.625% for year-end 2023 (Figure 6). Assuming the FOMC does not hike rates at the September meeting, the June dot plot would imply one more 25 bps rate hike at one of the two remaining FOMC meetings of the year. We think it will be a close call on whether the median stays at 5.625% or drops to the current midpoint of 5.375%. We lean towards the latter, though the August CPI report, to be released on September 13, may be the ultimate deciding factor. For 2024 and 2025, we do not think the median dot will change much, if at all, though some of the highest dots may be reined in a bit as the case for very restrictive monetary policy in 2024 and 2025 has receded.
The September SEP also will include the initial rollout of the Committee's projections for 2026, but we doubt this will be a major game changer for markets. We suspect the median projections for 2026 will look much like the "longer-run" forecasts from the June SEP: roughly 2% real GDP growth, an unemployment rate at or slightly above 4%, inflation near 2% and a fed funds rate at or slightly above 2.5%.
EU downgrades Eurozone growth forecasts, Germany in contraction this year
European Commission, in its Summer 2023 interim forecast, revised down its growth projections for Eurozone. For 2023, growth outlook was cut from 1.1% to 0.8%, while 2024 projection was trimmed from 1.6% to 1.3%. On the inflation front, expectations for 2023 was djusted downward from 5.8% to 5.6%, yet 2024 forecast saw a minor uptick from 2.8% to 2.9%.
Delving into individual nations, Germany's economic forecast has been dampened significantly. Growth projection for 2023 is now set at a contraction of -0.4%, a stark difference from prior 0.2% growth prediction. 2024 projection has been revised down from 1.4% to 1.1%.
On the contrary, France has seen a boost in its 2023 growth projection, raised from 0.7% to 1.0%. However, its 2024 growth forecast was trimmed slightly, from 1.4% to 1.2%.
Valdis Dombrovskis, Executive Vice-President for an Economy that Works for People,said: "The persistently high inflation rate has exacted a heavy cost, although signs of its abating are visible. Following a spell of economic slack, we anticipate a modest rebound in growth in the coming year. This optimism is driven by a resilient labor market, historical lows in unemployment, and diminishing price pressures. Nonetheless, the economic trajectory remains uncertain, necessitating vigilant risk monitoring."
Echoing these sentiments, Paolo Gentiloni, Commissioner for Economy, stated, "Our economies have been battling numerous challenges this year, culminating in softer growth than our spring projections had indicated. While inflationary pressures are waning, the rate varies across the EU. Furthermore, Russia's aggressive actions against Ukraine persist, leading not just to human distress but also significant economic upheaval."