Sample Category Title
Yen Rebounds on BoJ Ueda’s Hawkish Remarks; US CPI and ECB to Highlight the Week
Yen displayed impressive strength in Asian session, following hawkish remarks from BoJ Governor Kazuo Ueda over the weekend. Speculation is rife that the central bank is laying down preparations to exit negative rates early next year, with sustained wage growth being a key prerequisite, as echoed by various BoJ officials.
Meanwhile, both Australian and New Zealand Dollars are seeing a revival, largely supported by rebound in Chinese Yuan. This bounce back was facilitated by the PBoC's stronger-than-expected daily fixing by a record margin. Reinforcing its stance on currency stability, the Chinese central bank declared its commitment to "correct one-sided and pro-cyclical activities," vowing to stave off undue currency risks and speculatory behaviors that might disrupt the foreign exchange market's orderly operations.
On the other hand, Dollar is trading generally lower as it undergoes a consolidation phase, absorbing some of the gains from last week. The greenback is poised to engage in more consolidative trading as markets anticipate the release of Wednesday's US CPI data. In Europe, Euro presents a mixed picture, with investors keenly awaiting the ECB's rate decision scheduled for Thursday.
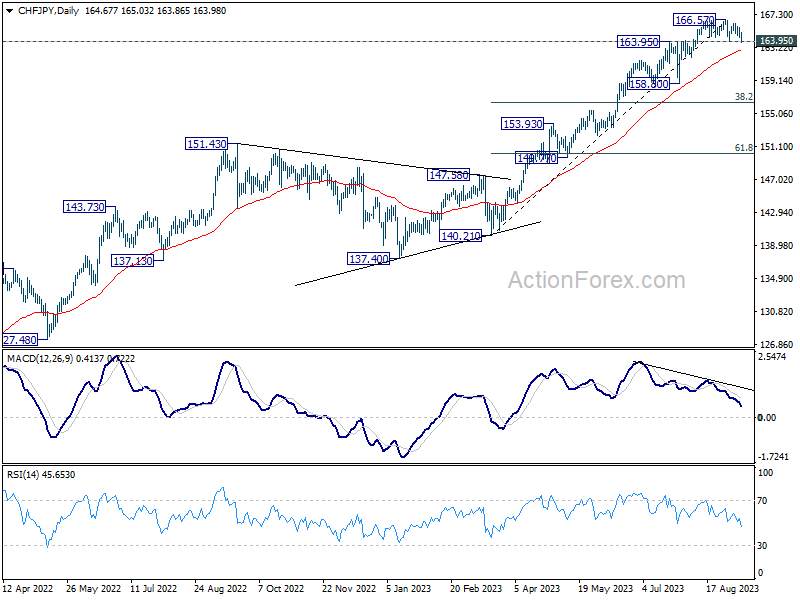
From a technical standpoint, CHF/JPY's breach of 163.95 resistance-turned-support, combined with bearish divergence observed in D MACD, indicates the possibility of a more extensive correction on the horizon. Near term attention has shifted towards 55 D EMA (now at 162.81). Sustained trading below this EMA might instigate a steeper decline towards 38.2% retracement of 140.21 to 166.57 at 156.50. Nonetheless, robust rebound from the EMA would maintain near-term bullish outlook, paving the way for an extension of the recent upward trend, sooner rather than later.
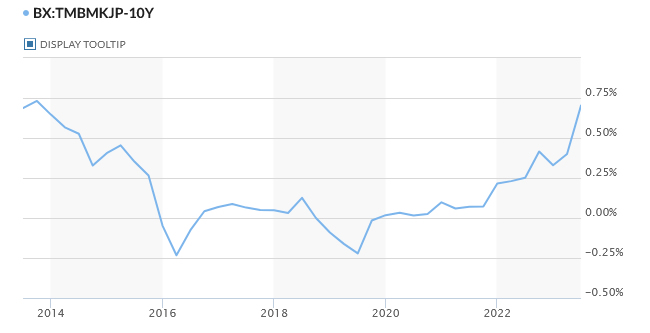
In Asia, at the time of writing, Nikkei is down -0.48%. Hong Kong HSI is down -0.77%. China Shanghai SSE is up 1.13%. Singapore Strait Times is up 0.09%. Japan 10-year JGB yield is up 0.0550 at 0.706.
10-year JGB yield hits 9-year high on BoJ Ueda, Yen rebounds
Yen saw a notable uptick in Asian session, buoyed by hawkish sentiments by BoJ Governor Kazuo Ueda. Concurrently, 10-year JGB yield scaled its highest level in nine years, breaching 0.7% mark.
In an interview with Yomiuri newspaper published over the weekend, Ueda hinted at the possibility that BoJ might have sufficient data by the close of the year to contemplate ending its negative interest rate policy. Such remarks from Ueda have spurred speculation among market analysts, with some interpreting them as early signals for the markets, suggesting a potential end to negative interest rates by Q1 2024. Before this step, there also are anticipations of yield curve control being phased out later this year.
On the flip side, certain analysts, referencing recent data which highlights decelerating wage growth, argue that the transition from negative rates might not be imminent. They believe Ueda's remarks might be more of a countermeasure to Yen's recent depreciation.
Ueda, during the interview, emphasized the need for Japan to witness a consistent rise in inflation, complemented by wage growth, before implementing changes. "If we judge that Japan can achieve its inflation target even after ending negative rates, we'll do so," Ueda asserted. However, he also reiterated the central bank's stance on maintaining its ultra-loose policy for now, until there's firm confidence that inflation will consistently hover around the 2% mark, bolstered by robust demand and wage growth.
He cautioned, "While Japan is showing budding positive signs, achievement of our target isn't in sight yet." Looking ahead, Ueda underscored the importance of wage trajectories in the coming year, indicating that conclusive decisions would be data-driven. "We can't rule out the possibility we'll get enough information and data by year-end," Ueda added
A pivotal week with ECB, US CPI, UK GDP and employment, and Chinese data
A series of high-profile events are scheduled for the week, Euro finds itself on unstable grounds ahead of ECB's rate decision slated for this Thursday. Dollar is staying firm as US anticipates pivotal CPI data on Wednesday. There are also substantial economic releases from UK and China.
ECB stands at a crossroads, grappling with the choice of either implementing a 10th consecutive rate hike — potentially elevating main refinancing rate to 4.50% and deposit rate to 4.0% — or pausing to assess the evolving economic and inflation development. The consensus among economists is far from unanimous, although a slightly larger faction envisages ECB holding steady.
Market stakeholders also await the new ECB staff economic projections with bated breath, keen to discern any adjustments to 2023 inflation outlook influenced by rising oil prices since June. However, the pivotal elements in shaping policy guidance remain the projections for 2024 and 2025, given the recent slowdown in the Eurozone service sector and the broader economy hinting at reduced price pressures.
For Euro, the ideal bullish outcome would be a combination of a rate hike along with significant upward revision in inflation forecasts, with growth projections taking only a minor hit. However, such outcome seems to be on the less probable side of the spectrum. Conversely, if ECB signals that the terminal rate has been reached, combined with a subdued economic outlook for the upcoming year, Euro could face a steep decline.
US market is gearing up for the critical release of August CPI data this Wednesday, a development holding notable sway over market movements. Market observers should take note Fed policymakers are placing significant emphasis on the month-on-month core inflation rate, perhaps even more so than its year-over-year counterpart.
Headline CPI could experience a significant surge, leaping by 0.6% mom. This spike can be attributed in large part to almost 10% surge in gas prices. That would translate to re-acceleration in annual headline inflation rate from 3.2% yoy to 3.6% yoy.
However, it's worth noting that this gas-induced inflationary rise might not cause much concern among Fed officials. From their perspective, the real metric to watch is core CPI, which excludes volatile elements like food and energy prices. If core CPI maintains its steady 0.2% mom growth, this would result in an annual rate reduction from 4.7% yoy to around 4.3% yoy. Such deceleration would align with Fed's expectation of moderating inflationary pressures.
In UK, spotlight is firmly on upcoming economic revelations including employment and GDP data, with significant implications for Sterling. Recent comments from BoE Governor Andrew Bailey about being "much nearer now to the top of the cycle" have exerted downward pressure on Pound, positioning it as the second-worst performer of the month, overtaken only by Australian Dollar.
Another BoE rate hike is still widely anticipated on September 21. However, the looming economic releases stand as potential turning points that could alter the path beyond that significantly. Slowdown in wages growth coupled with disappointing GDP figures might drastically reduce the likelihood of further monetary tightening in the aftermath of this forthcoming meeting.
Simultaneously, Australian Dollar will be influenced by both domestic employment data and a suite of economic releases from China, its largest trading partner. In particular, industrial production and retail sales data will reveal much insight into the impact of persistently sluggish exports and weak domestic demand.
Here are some highlights for the week:
- Monday: Japan M2, machine tool orders; Italy industrial production.
- Tuesday: Australia Westpac consumer sentiment, NAB business confidence; UK employment; Germany ZEW;
- Wednesday: UK GDP, production, trade balance; Eurozone industrial production; US CPI.
- Thursday: Japan machine orders; Australia employment; Swiss PPI; ECB rate decision; US PPI, retail sales, jobless claims, business inventories.
- Friday: New Zealand BusinessNZ manufacturing; China industrial production, retail sales, fixed asset investment; Japan tertiary industry index; Eurozone trade balance; Canada manufacturing sales; US Empire State manufacturing, import prices, industrial production, U of Michigan consumer sentiment.
USD/JPY Daily Outlook
Daily Pivots: (S1) 146.93; (P) 147.40; (R1) 147.76; More...
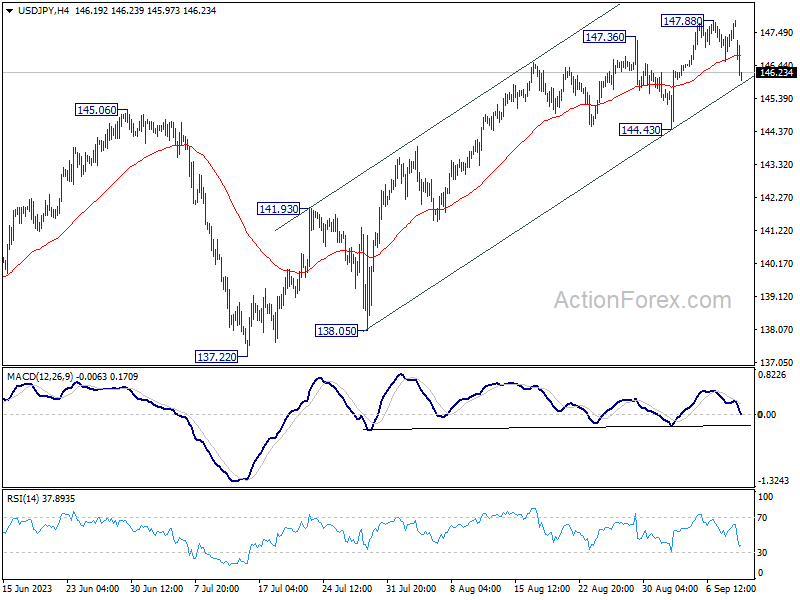
USD/JPY dips notably today, but stays well above 144.43 support. Intraday bias remains neutral at this point, as consolidation from 147.88 could extend. But outlook remains bullish with 144.43 support intact. On the upside, above 147.88 will resume larger rise from 127.20, to retest 151.93 high.
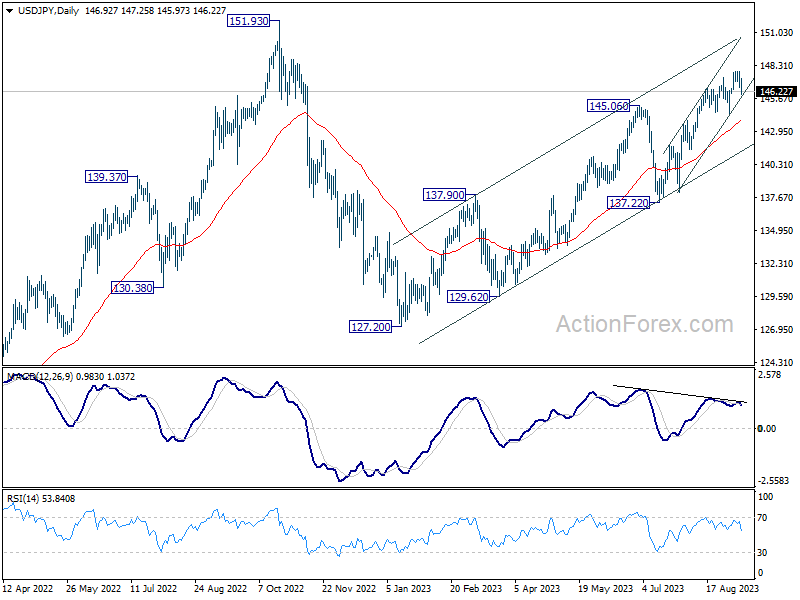
In the bigger picture, while rise from 127.20 is strong, it could still be seen as the second leg of the corrective pattern from 151.93 (2022 high). Rejection by 151.93, followed by break of 137.22 support will indicate that the third leg of the pattern has started. However, sustained break of 151.93 will confirm resumption of long term up trend.
Economic Indicators Update
| GMT | Ccy | Events | Actual | Forecast | Previous | Revised |
|---|---|---|---|---|---|---|
| 23:50 | JPY | Money Supply M2+CD Y/Y Jul | 2.50% | 2.50% | 2.40% | 2.50% |
| 06:00 | JPY | Machine Tool Orders Y/Y Aug P | -19.80% | |||
| 08:00 | EUR | Italy Industrial Output M/M Jul | -0.30% | 0.50% |
Gold Technical: Bears Stalling Again at 200-day Moving Average ahead of US CPI and ECB
- Last Friday’s price actions of spot Gold (XAU/USD) have managed to find support again at the 200-day moving average ahead of the US CPI data release & ECB monetary policy decision this week.
- The recent -5.15 % decline seen in Gold from its 20 July 2023 swing high of US$$1,987.53 has started to see some signs of short-term bullish reversal elements since 21 August 2023.
- The up-trending 10-year US Treasury real yield has also started to consolidate between 1.95% to 2.00% level which may negate the bearish tone on Gold at least in the short-term.
- US$1,910 support and US$1,932 resistance are the two key short-term technical levels to watch.
Since its 20 July 2023 swing high of US$1,987.53, spot Gold (XAU/USD) has declined by -5.15% to print a low of US$1,885 on 17 August 2023 in line with a rising longer-term 10-year US Treasury real yield which increased the opportunity costs of holding gold as it is a non-interest yielding asset.
Major uptrend remains intact
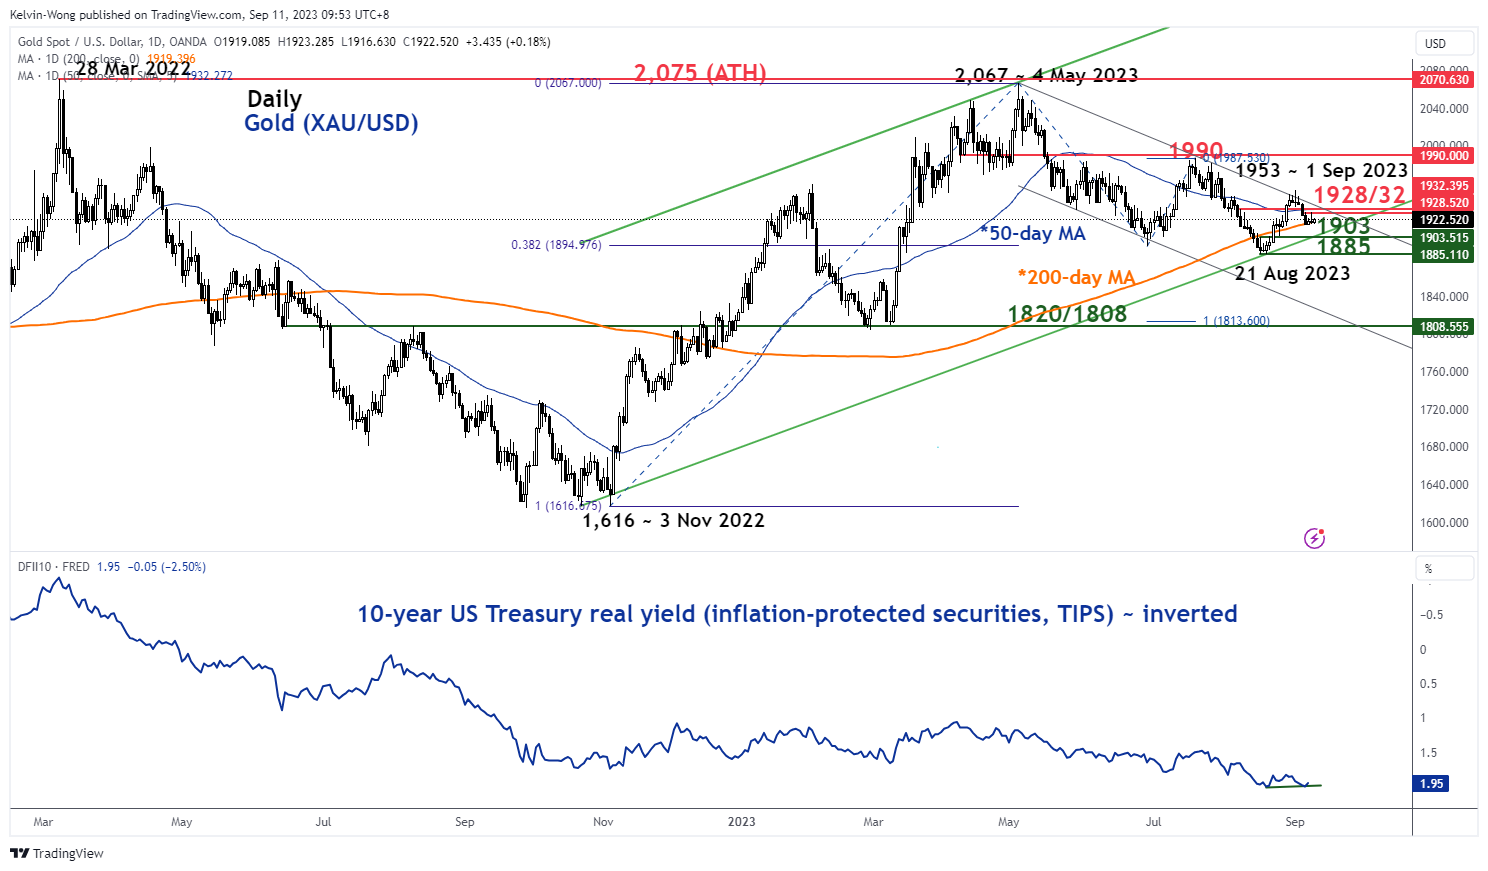
Fig 1: Gold (XAU/USD) major trend as of 11 Sep 2023 (Source: TradingView, click to enlarge chart)
Despite the underperformance of Gold seen in the past five weeks, its major uptrend phase in place since the 3 November 2022 low of US$1,616 remains intact as the -5.15% fall from the 20 July 2023 high of US$1,987.15 has managed to stall at the lower boundary of a major ascending channel from its 3 November 2022 major swing low and close to the 38.2% Fibonacci retracement of the prior major uptrend phase from 3 November 2022 low to 4 May 2023 high (see daily chair).
Also, the up-trending 10-year US Treasury real yield (derived via the inflation-protected securities, TIPS of the same duration) has started to consolidate at the 1.95% to 2.00% level which may negate the bearish tone on Gold at this juncture.
Short-term momentum has tilted toward the bullish camp
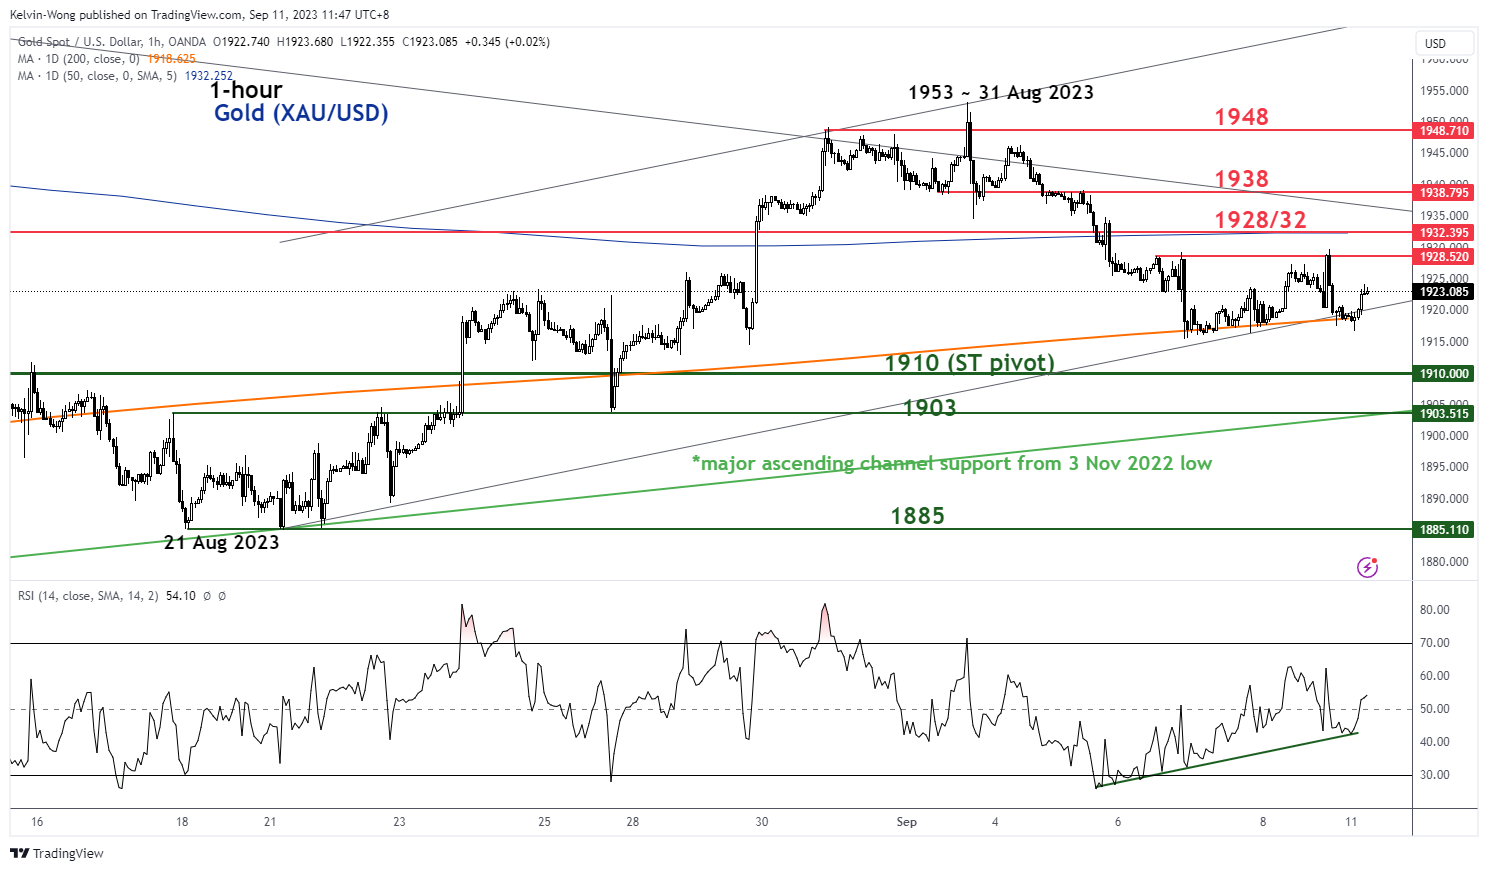
Fig 2: Gold (XAU/USD) minor short-term uptrend as of 11 Sep 2023 (Source: TradingView, click to enlarge chart)
Since 26 August 2023, the price actions of Gold (XAU/USD) have reintegrated back above the key 200-day moving average and its recent slide from its US$1,953 minor swing high of 1 September 2023 has managed to find support at the 200-day moving after a retest on it on last week, the lower boundary of a minor ascending channel from 21 August 2023 low and close to the 50% Fibonacci retracement of the recent minor uptrend from 21 August 2023 low to 1 September 2023 high.
In addition, the hourly RSI oscillator, a gauge of short-term momentum shaped a bullish divergence condition on 7 September 2023 and continued to trace out a series of “higher lows” thereafter.
These observations indicate a revival of short-term bullish momentum conditions that in turn advocates another round of minor potential up leg in Gold. Watch the US$1,910 key short-term pivotal support and a break above the intermediate resistance at US$1,932 (also the 50-day moving average) may see a further push-up for the next resistances to come in at US$1,938 and US$1,949.
On the other hand, failure to hold at US$1,910 invalidates the bullish scenario for a further slide to expose the major support at US$1,903.
Technical Outlook and Review
DXY:
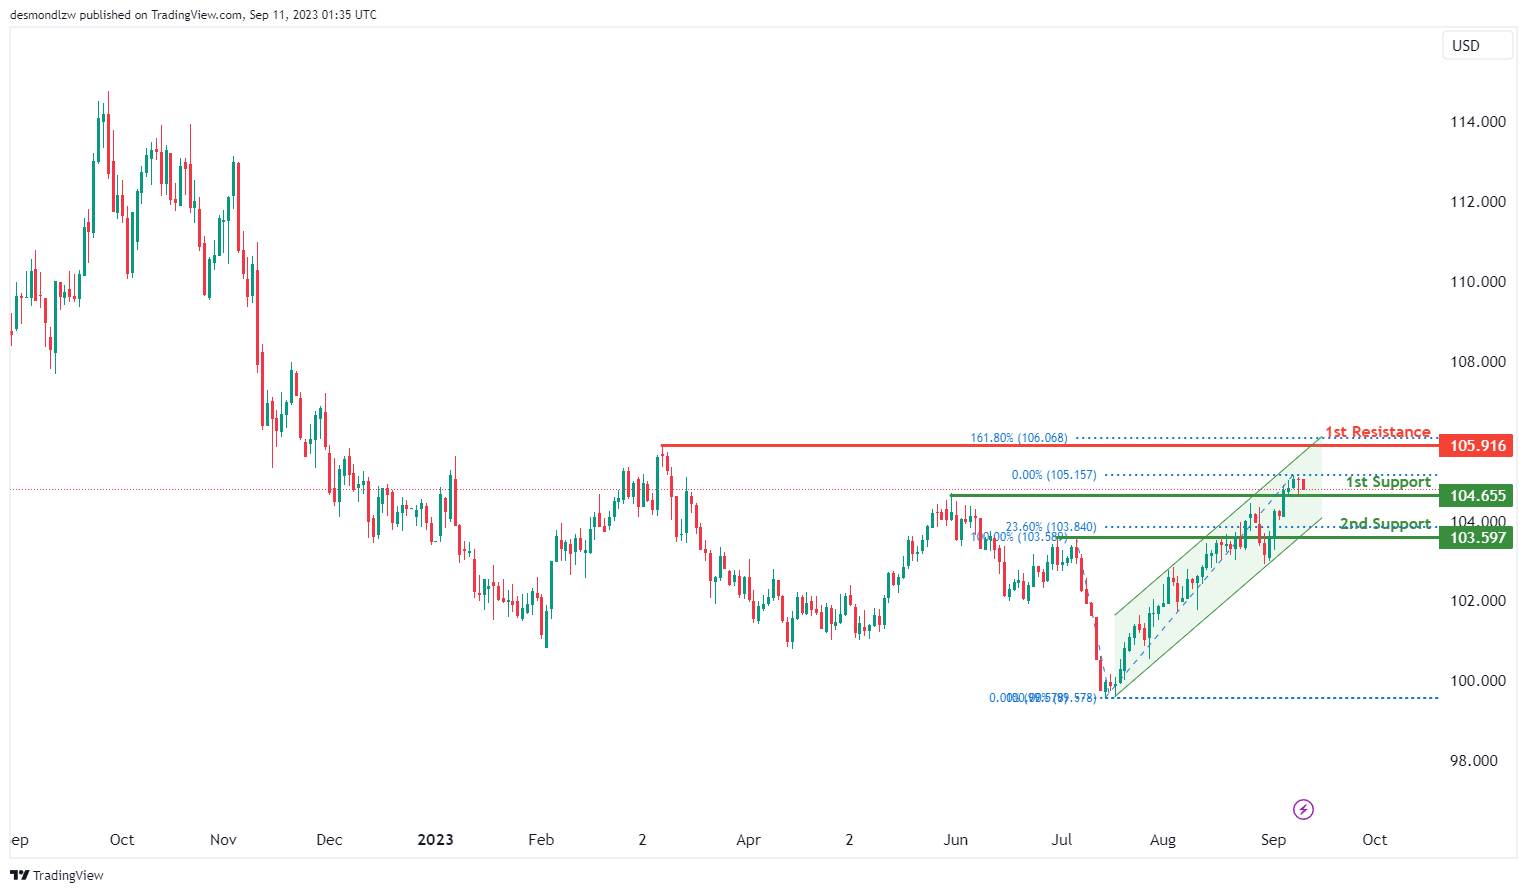
The DXY (US Dollar Index) chart currently displays a bullish overall momentum, with price situated within a bullish ascending channel.
There’s potential for a bullish bounce off the 1st support level at 104.65, identified as an overlap support.
Additionally, the 2nd support at 103.59 is noted as a pullback support, further reinforcing its significance as a potential area of price support.
On the resistance side, the 1st resistance at 105.91 is designated as an overlap resistance, and it aligns with the 161.80% Fibonacci Retracement level. This confluence of factors enhances its potential as a resistance zone.
EUR/USD:
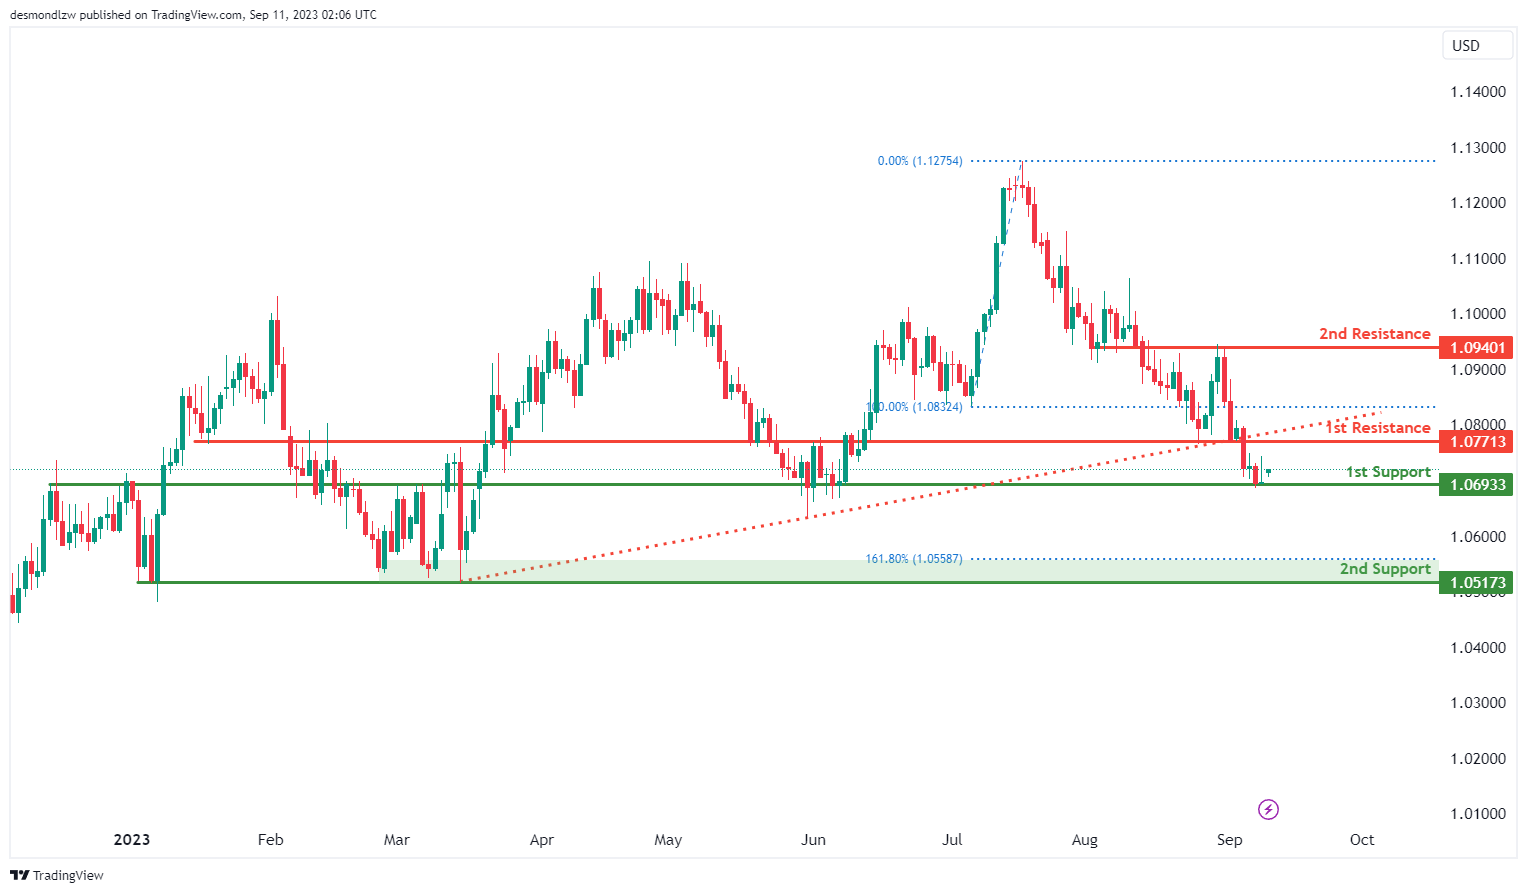
The EUR/USD chart is currently characterized by bearish momentum, with price positioned below a major descending trend line, indicating a potential for continued bearish movement.
There’s a possibility of a short-term rise in price towards the 1st resistance level at 1.0771 before a potential reversal and a drop towards the 1st support level.
The 1st support at 1.0693 is identified as an overlap support, providing a historical level of price support.
Additionally, the 2nd support at 1.0517 is significant as it represents multi-swing low support and aligns with the 161.80% Fibonacci Extension, further reinforcing its importance as a potential support zone.
On the resistance side, the 1st resistance at 1.0771 is considered significant as it acts as a pullback resistance.
Furthermore, the 2nd resistance at 1.0940 is marked as an overlap resistance, suggesting potential selling pressure in this area.
EUR/JPY:
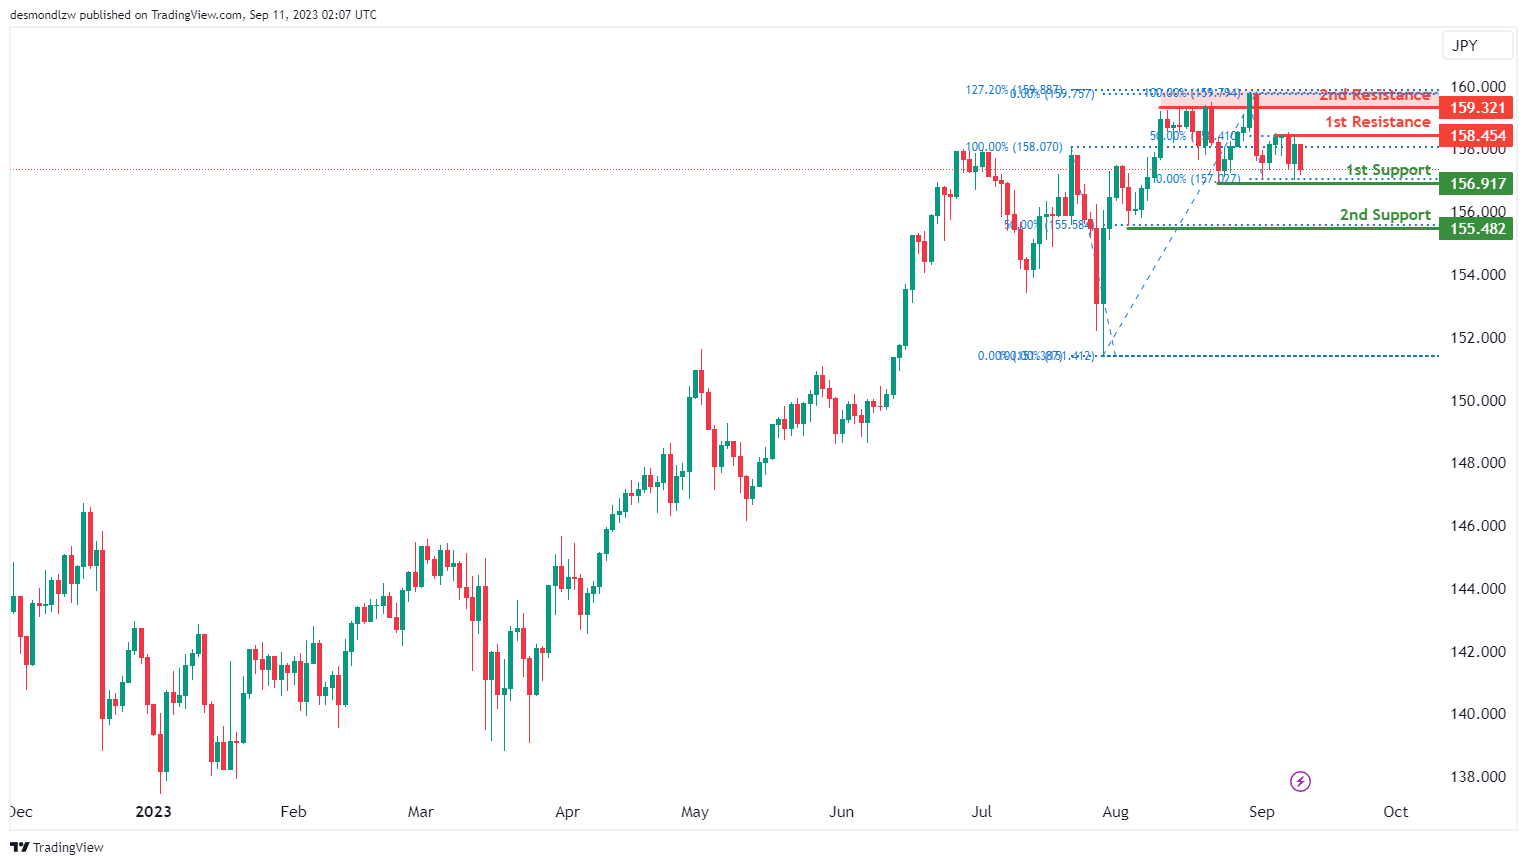
For EUR/JPY, the overall momentum of the chart is currently bearish, indicating a downward trend.
There is a potential for the price to continue its bearish movement towards the 1st support level at 156.91. The 1st support at 156.91 is considered significant because it represents multi-swing low support, suggesting potential stability at this level.
In the event of a more substantial decline, the 2nd support at 155.48 is also noteworthy. This support level is characterized as a swing low support and aligns with the 50% Fibonacci Retracement level, adding further significance to it.
On the other hand, if there’s a reversal in the price, it may encounter resistance at the 1st resistance level of 158.45, which is identified as a swing high resistance and is supported by a 50% Fibonacci Retracement.
Further upward movement could face resistance at the 2nd resistance level of 159.32, which is characterized as a pullback resistance and is aligned with the 127.20% Fibonacci Extension, potentially acting as a barrier to the bullish momentum.
EUR/GBP:
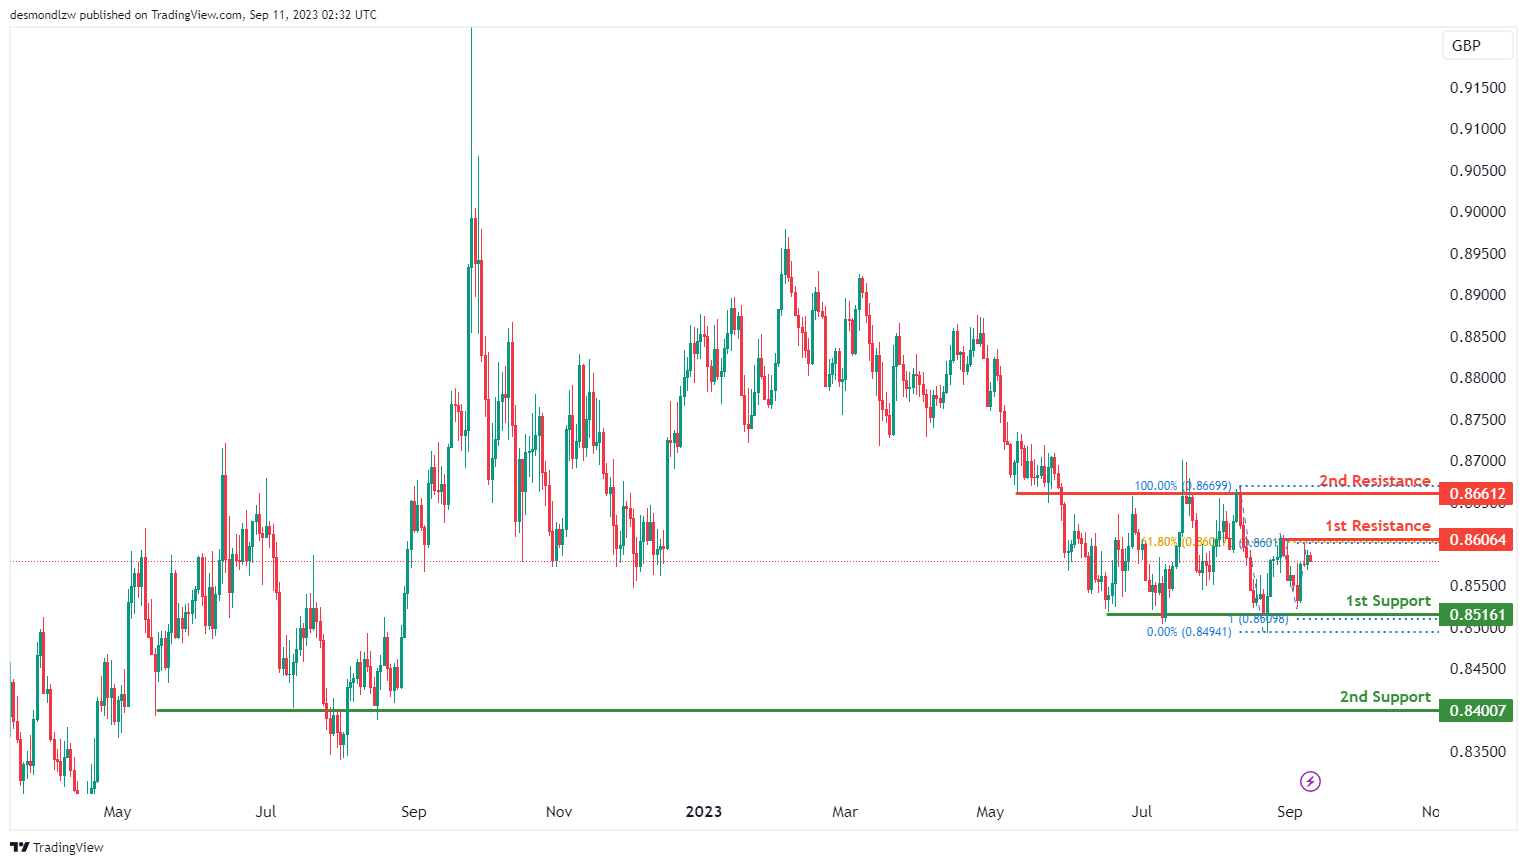
For EUR/GBP, the overall momentum of the chart is currently bearish, indicating a downward trend.
There is potential for the price to continue its bearish movement towards the 1st support level at 0.8516. This 1st support is considered significant because it represents multi-swing low support and aligns with the 100% Fibonacci Projection, suggesting a strong potential for support at this level.
In case of a more substantial decline, the 2nd support level at 0.8400 is also noteworthy as it acts as an overlap support.
On the upper side, if there’s a reversal in the price, it may face resistance at the 1st resistance level of 0.8606. This 1st resistance is considered important due to its characteristics as a swing high resistance and its alignment with the 61.80% Fibonacci Retracement level.
Further upward movement could encounter resistance at the 2nd resistance level of 0.8661, characterized as an overlap resistance, which may act as a barrier to the bullish momentum within the observed range.
GBP/USD:
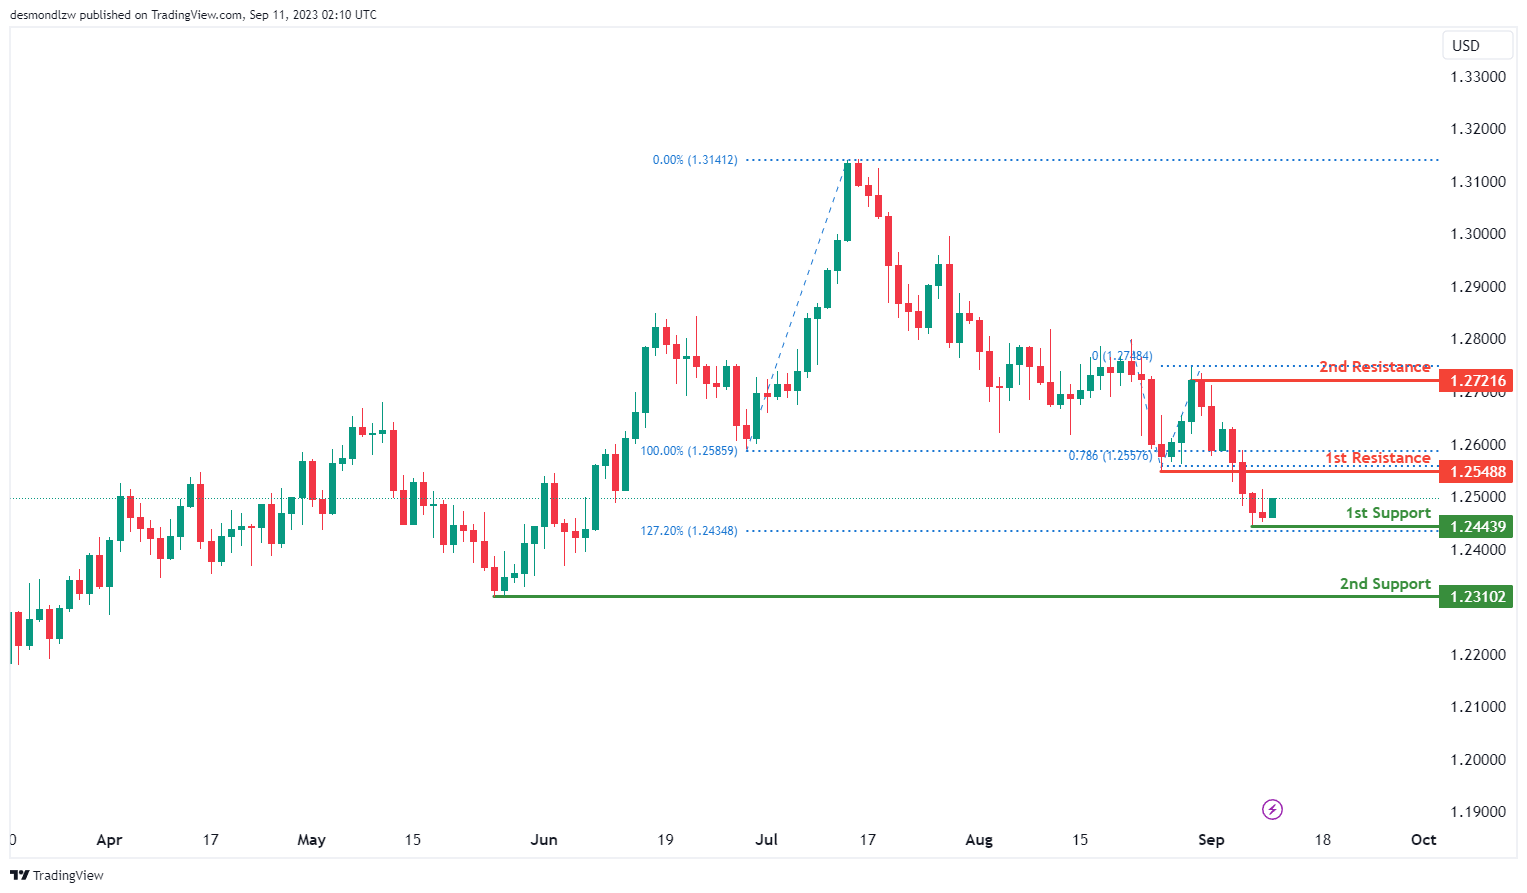
The GBP/USD chart currently demonstrates a bullish momentum, suggesting a potential upward trend in price movement.
There’s a likelihood of a bullish bounce off the 1st support level at 1.2443, which is supported by swing low characteristics and aligns with the 127.20% Fibonacci Expansion.
Additionally, another 1st support at 1.2310 is marked as a swing low support, further reinforcing its role as a potential area of price support.
Looking at resistance levels, the 1st resistance at 1.2548 is identified as a pullback resistance and is significant as it aligns with the 78.60% Fibonacci Projection.
Furthermore, the 2nd resistance at 1.2721 is notable as it represents swing high resistance.
GBP/JPY:
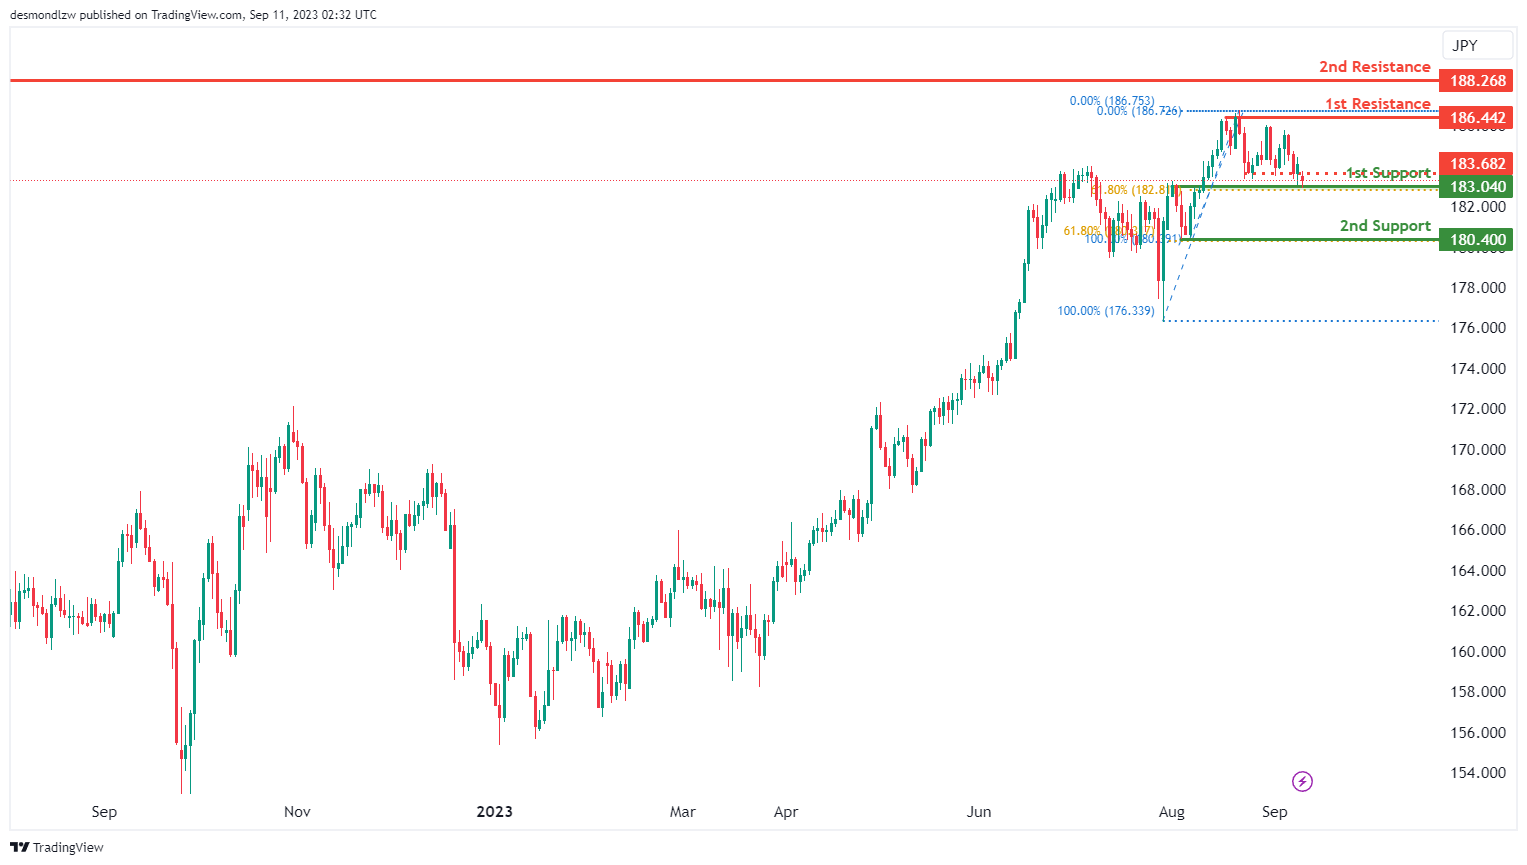
For GBP/JPY, the overall momentum of the chart is currently bullish, indicating an upward trend.
There is potential for the price to make a bullish move by bouncing off the 1st support level at 183.04 and heading towards the 1st resistance at 186.42.
The 1st support at 183.04 is considered significant because it represents an overlap support and aligns with the 61.80% Fibonacci Retracement level, suggesting potential stability and support at this level.
In the event of a more substantial retracement, the 2nd support level at 180.40 is also noteworthy as it acts as a swing low support and coincides with the 61.80% Fibonacci Retracement, offering additional reinforcement for the price.
On the upper side, the 1st resistance at 186.42 is considered important due to its characteristics as multi-swing high resistance, indicating potential resistance to upward movement.
Further upward movement may encounter resistance at the 2nd resistance level of 188.26, characterized as multi-swing high resistance, which could pose a significant barrier to the bullish momentum.
Additionally, there is an intermediate resistance level at 183.68, identified as pullback resistance, which may temporarily slow down the bullish momentum within the observed range.
USD/CHF:
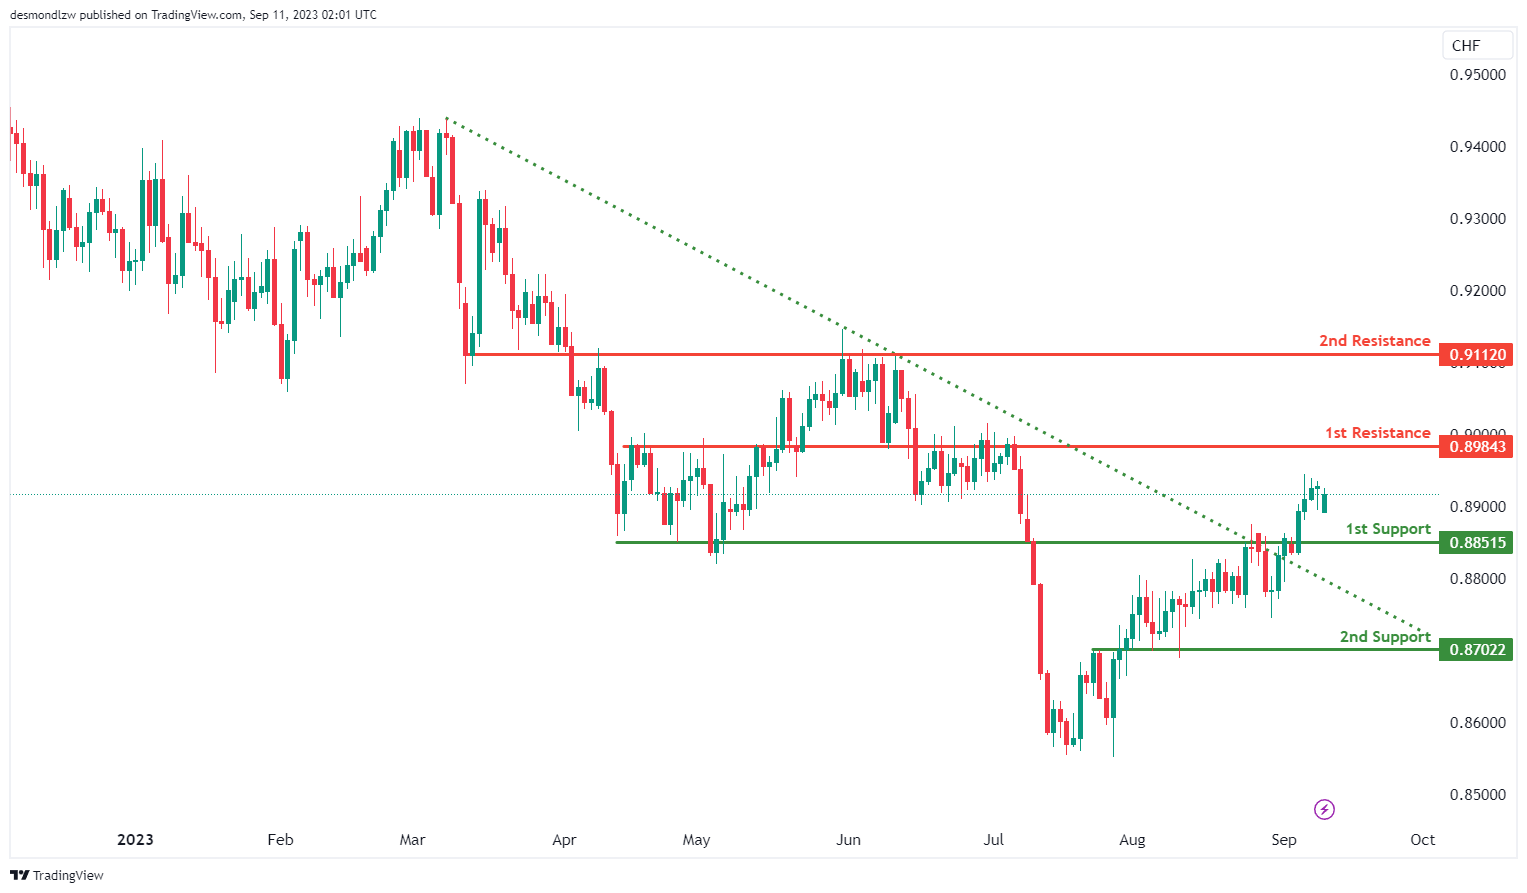
The USD/CHF chart currently displays a bullish momentum, primarily driven by the breakout above a descending resistance line, indicating the potential for an upward price movement.
There’s a likelihood of a bullish continuation towards the 1st resistance level at 0.8984, which is identified as an overlap resistance.
On the support side, the 1st support at 0.8851 is considered a pullback support, indicating its significance as a potential area of price support.
Additionally, the 2nd support at 0.8702 is marked as an overlap support, further reinforcing its potential role as a support level.
Furthermore, the 2nd resistance at 0.9112 is also noted as an overlap resistance, which could potentially act as a barrier to further bullish movements.
USD/JPY:
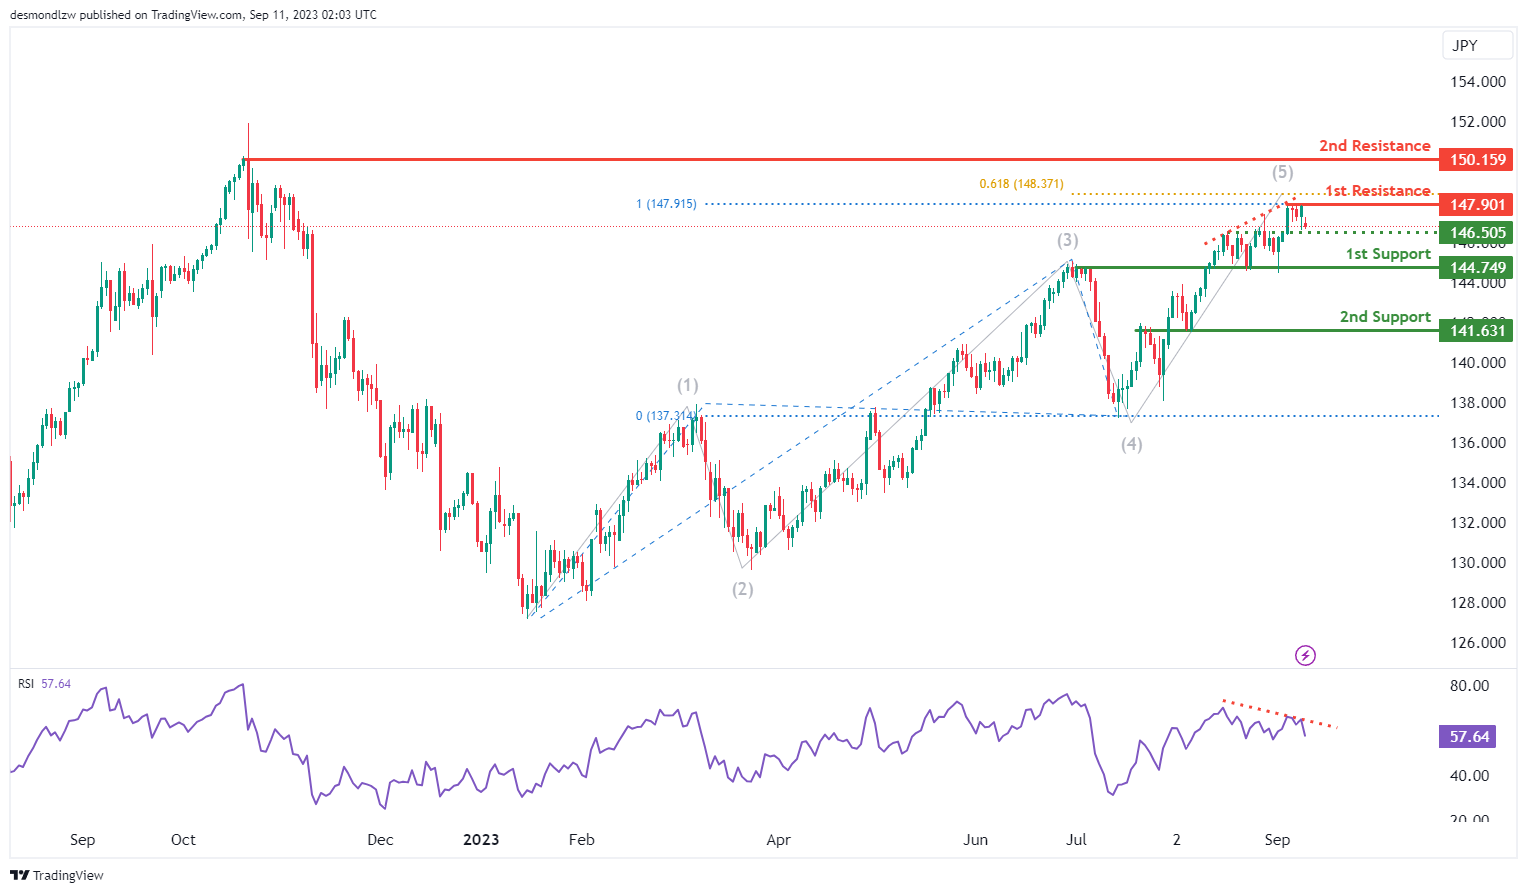
The USD/JPY chart currently exhibits a bearish momentum, suggesting a potential downward trend in price movement.
There’s a likelihood of a bearish continuation towards the 1st support level at 144.74, which is identified as an overlap support.
Additionally, the 2nd support at 141.63 is marked as an overlap support, further reinforcing its potential role as a support level.
On the resistance side, the 1st resistance at 147.90 is considered significant as it represents swing high resistance, potentially acting as a barrier to any bullish movements.
Furthermore, the 2nd resistance level at 150.15 is also noted as swing high resistance, further indicating potential resistance in this area.
Intermediate support is observed at 146.50, identified as an overlap support, adding to the potential significance of this level.
It’s important to note that RSI is displaying bearish divergence versus price, suggesting the likelihood of a rapid decline in price, aligning with the overall bearish momentum.
USD/CAD:
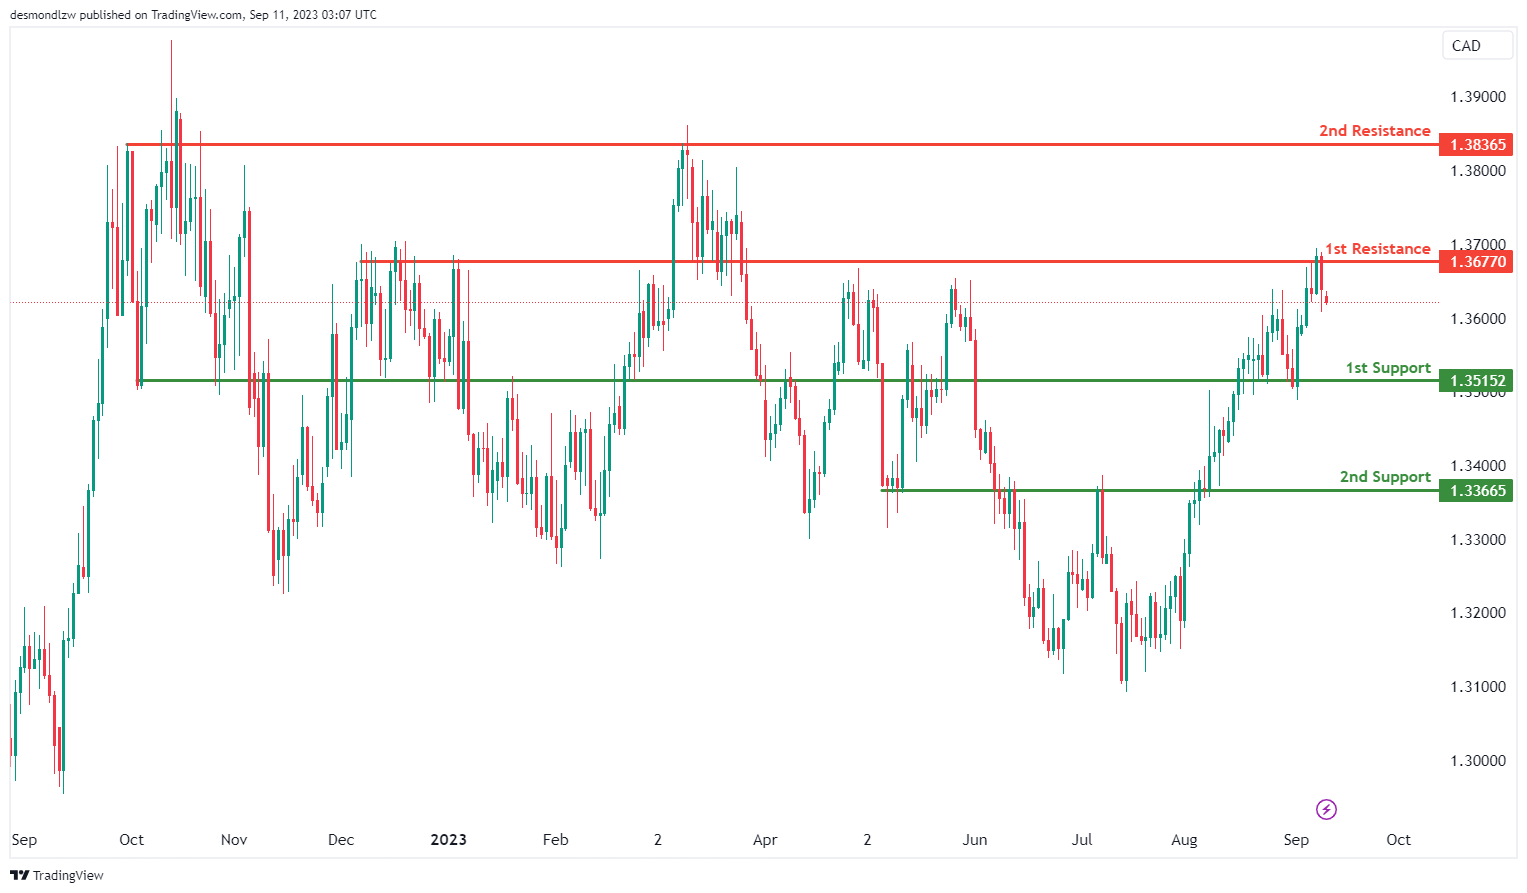
The USD/CAD chart currently indicates an overall bearish momentum, suggesting a potential downward trend in price movement.
There is a possibility of a bearish continuation towards the 1st support level at 1.3515, which is identified as an overlap support. Additionally, the 2nd support level at 1.3367 is also marked as an overlap support, further reinforcing its role as a potential support zone.
To the upside, the 1st resistance level at 1.3677 is identified as an overlap resistance while the 2nd resistance level at 1.3837 is also noted as an overlap resistance, reinforcing its potential as a resistance level.
AUD/USD:
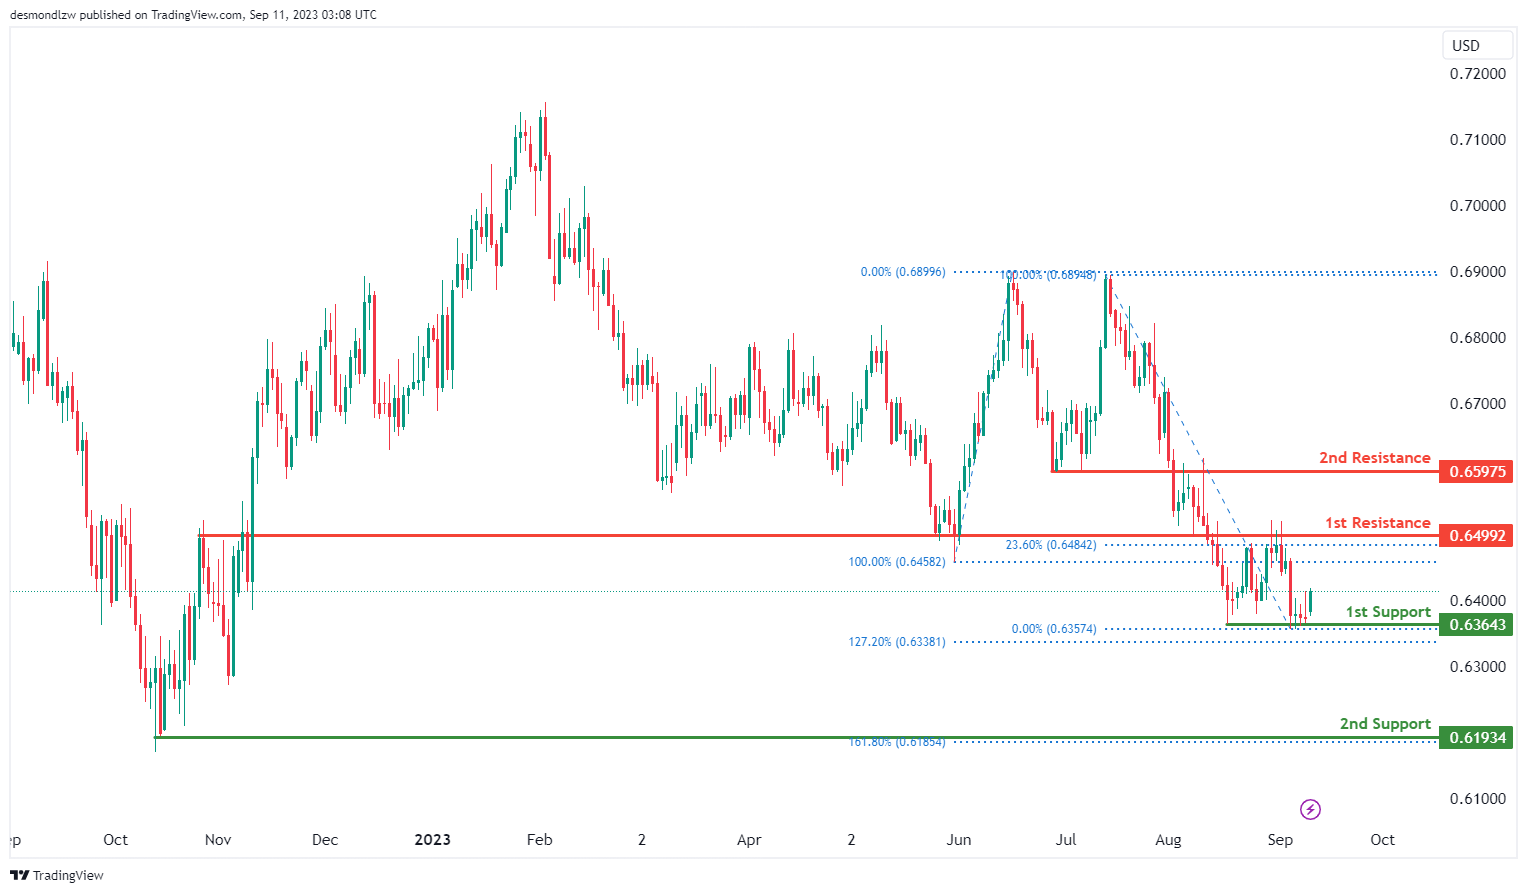
The AUD/USD chart currently exhibits an overall bullish momentum, indicating a potential upward trend in price movement.
There’s a likelihood of a bullish continuation towards the 1st resistance level at 0.6499 which is identified as an overlap resistance that aligns with the 23.60% Fibonacci retracement level. Furthermore, the 2nd resistance level at 0.6598 is also identified as an overlap resistance.
To the downside, the 1st support level at 0.6364 is identified as a pullback support that aligns with the 127.20% Fibonacci extension level while the 2nd support level at 0.6193 is also marked as a pullback support that aligns with the 161.80% Fibonacci extension level, further enhancing its role as a potential support zone.
NZD/USD
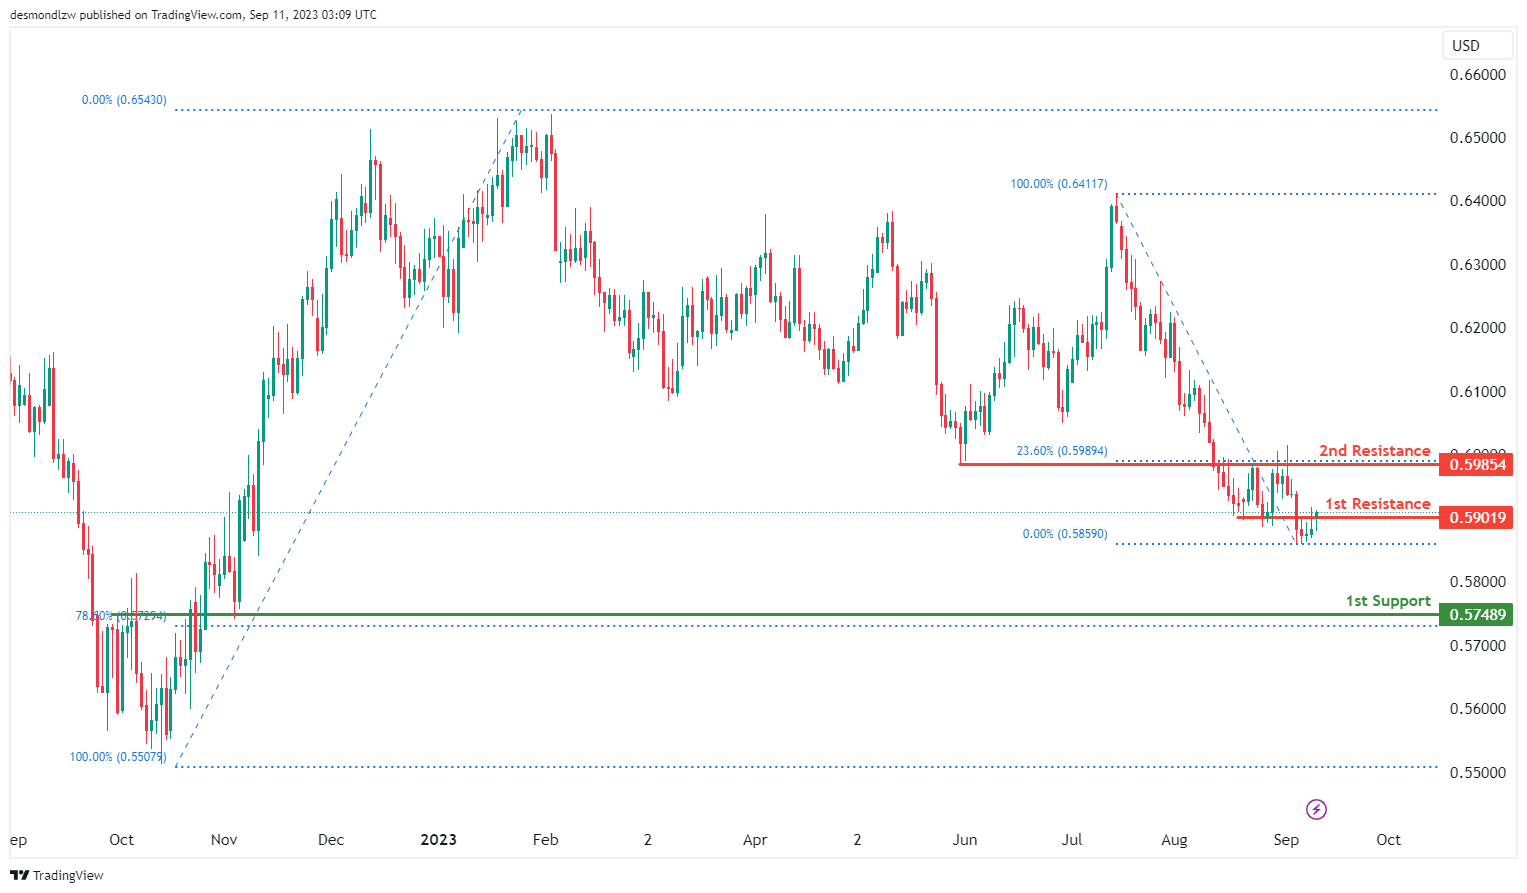
The NZD/USD chart currently demonstrates an overall bullish momentum, suggesting a potential upward trend in price movement.
There is a likelihood of a bullish breakout through the 1st resistance level at 0.5902 which is identified as an overlap resistance. Furthermore, a successful breakthrough of the 1st resistance level could lead to a further rise towards the 2nd resistance level at 0.5985. This level is also marked as an overlap resistance that aligns with the 23.60% Fibonacci retracement level.
To the downside, the 1st support level at 0.5749 is identified as an overlap support that aligns with the 78.60% Fibonacci retracement level, highlighting its significance as a potential area of price support.
DJ30:
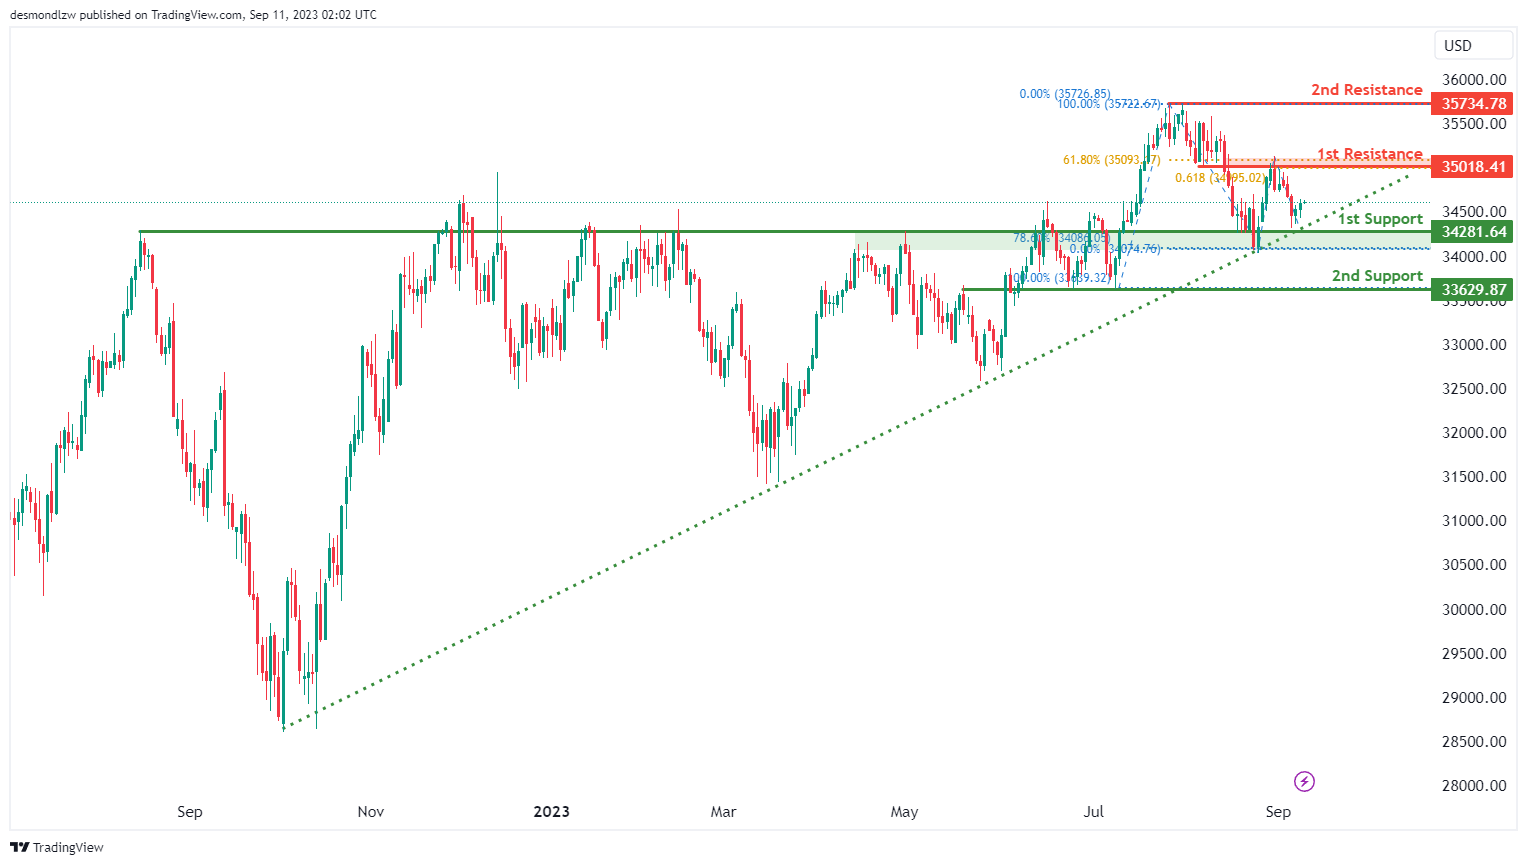
For DJ30, the overall chart momentum is currently bullish, and this bullish sentiment is reinforced by the fact that the price is positioned above a major ascending trend line, which suggests further bullish momentum in the future.
There’s potential for the price to continue its bullish movement towards the 1st resistance level at 35081.41. This 1st resistance is considered significant because it represents an overlap resistance and is supported by both a 61.80% Fibonacci Retracement and a 61.80% Fibonacci Projection, indicating Fibonacci confluence.
In case of a retracement, the 1st support level at 34281.64 is notable due to its characteristics as an overlap support and its alignment with the 78.60% Fibonacci Retracement level. Additionally, the 2nd support at 33629.87 also acts as an overlap support.
If the price continues to rise, it might encounter the 2nd resistance at 35734.78, which is identified as a swing high resistance. This level could pose as a significant obstacle to further upward movement.
GER30:
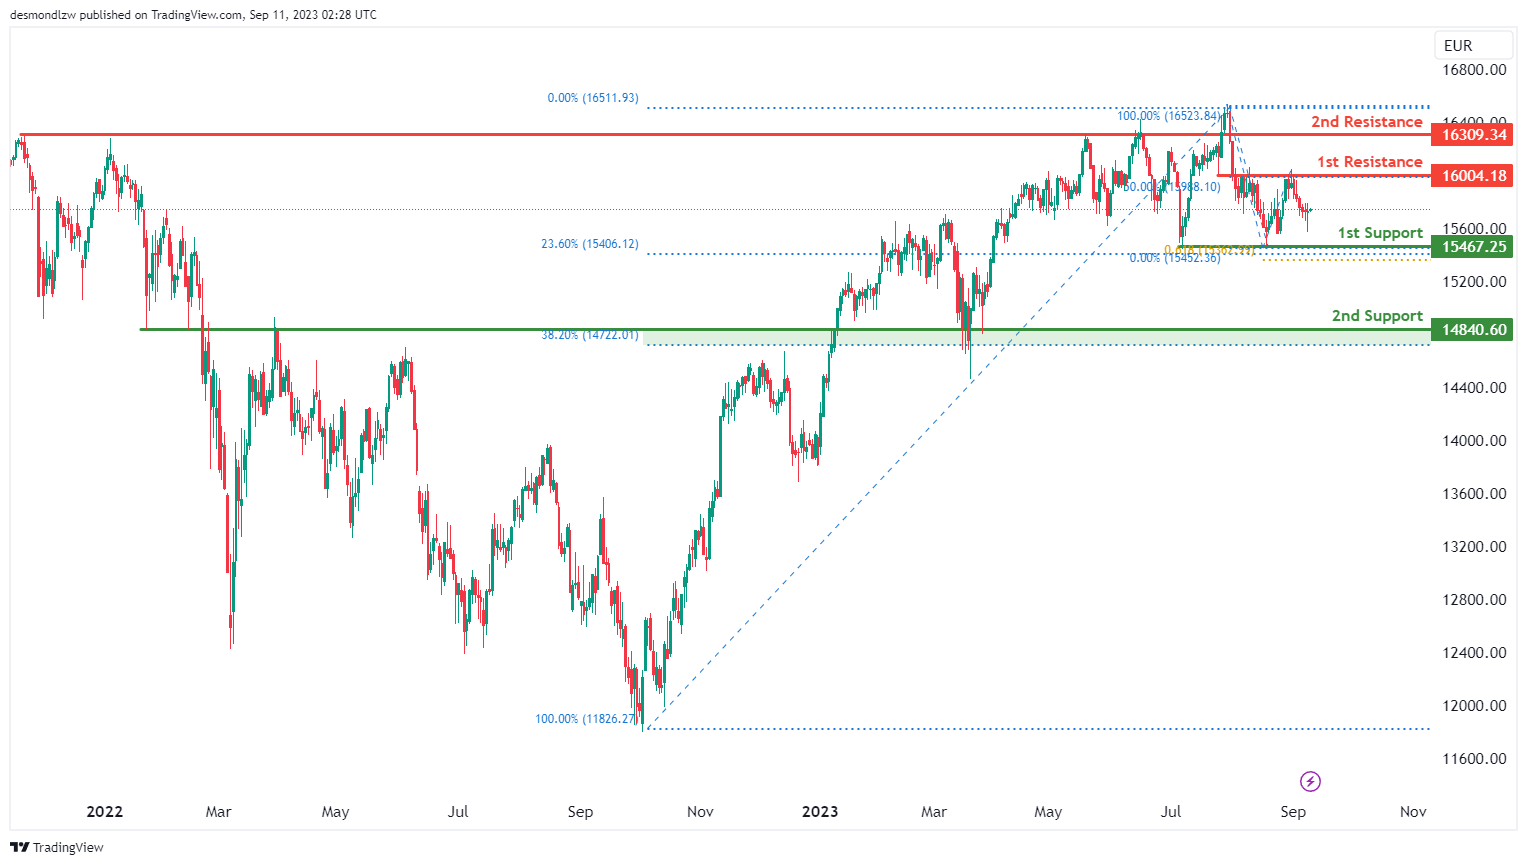
For GER30, the overall momentum of the chart is currently bearish, indicating a downward trend.
There is potential for the price to continue its bearish movement towards the 1st support level at 15467.25. This 1st support level is considered significant because it represents multi-swing low support and aligns with both the 23.60% Fibonacci Retracement and the 61.80% Fibonacci Projection. This indicates a Fibonacci confluence, suggesting strong potential support at this level.
In case of a more significant decline, the 2nd support level at 14840.60 is also noteworthy. This support level is characterized as an overlap support and aligns with the 38.20% Fibonacci Retracement, adding further significance to it.
On the upper side, if there’s a reversal in the price, it may face resistance at the 1st resistance level of 16026.10. This 1st resistance is considered significant due to its properties as an overlap resistance and its alignment with the 50% Fibonacci Retracement level.
Further upward movement could encounter resistance at the 2nd resistance level of 16309.34, characterized as a pullback resistance, which may act as a barrier to the bullish momentum within the observed range.
US500
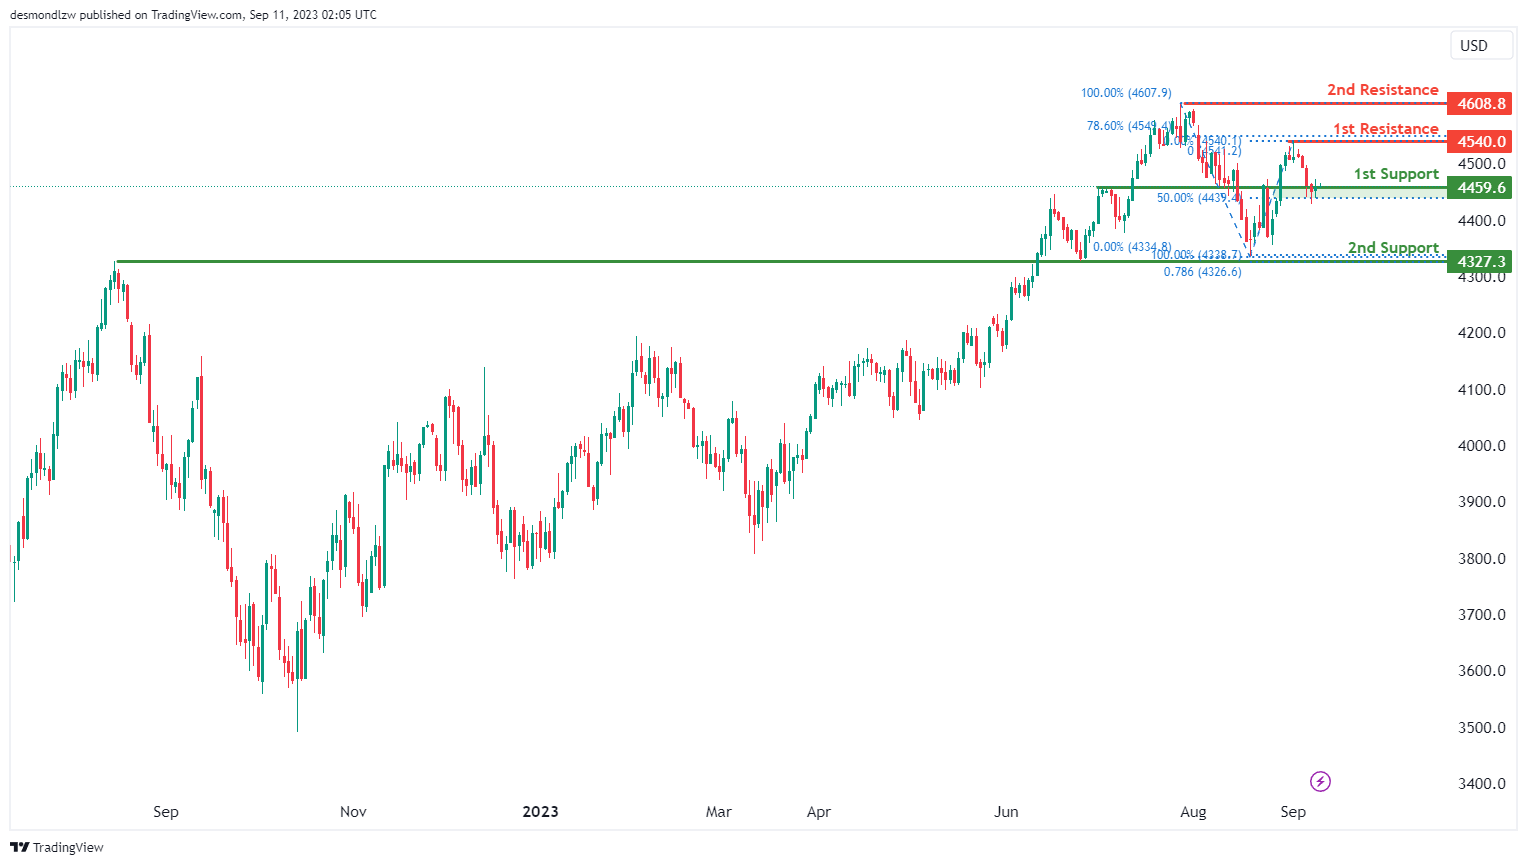
For US500, the overall momentum of the chart is currently bearish, indicating a downward trend.
There is a potential for the price to make a bearish move by breaking below the 1st support level at 4459.6 and then dropping towards the 2nd support at 4327.3. The 1st support at 4459.6 is considered significant because it represents an overlap support and aligns with the 50% Fibonacci Retracement level.
If the bearish momentum continues, the 2nd support at 4327.3 is also noteworthy as it acts as an overlap support and aligns with the 78.60% Fibonacci Projection, providing additional support for this level.
On the other hand, if there’s a reversal in the price, it may face resistance at the 1st resistance level of 4540.0, which is identified as a swing high resistance and is supported by a 38.20% Fibonacci Retracement.
Further upward movement could encounter the 2nd resistance level at 4608.8, which is also characterized as a swing high resistance, potentially acting as a barrier to the bullish momentum.
BTC/USD:
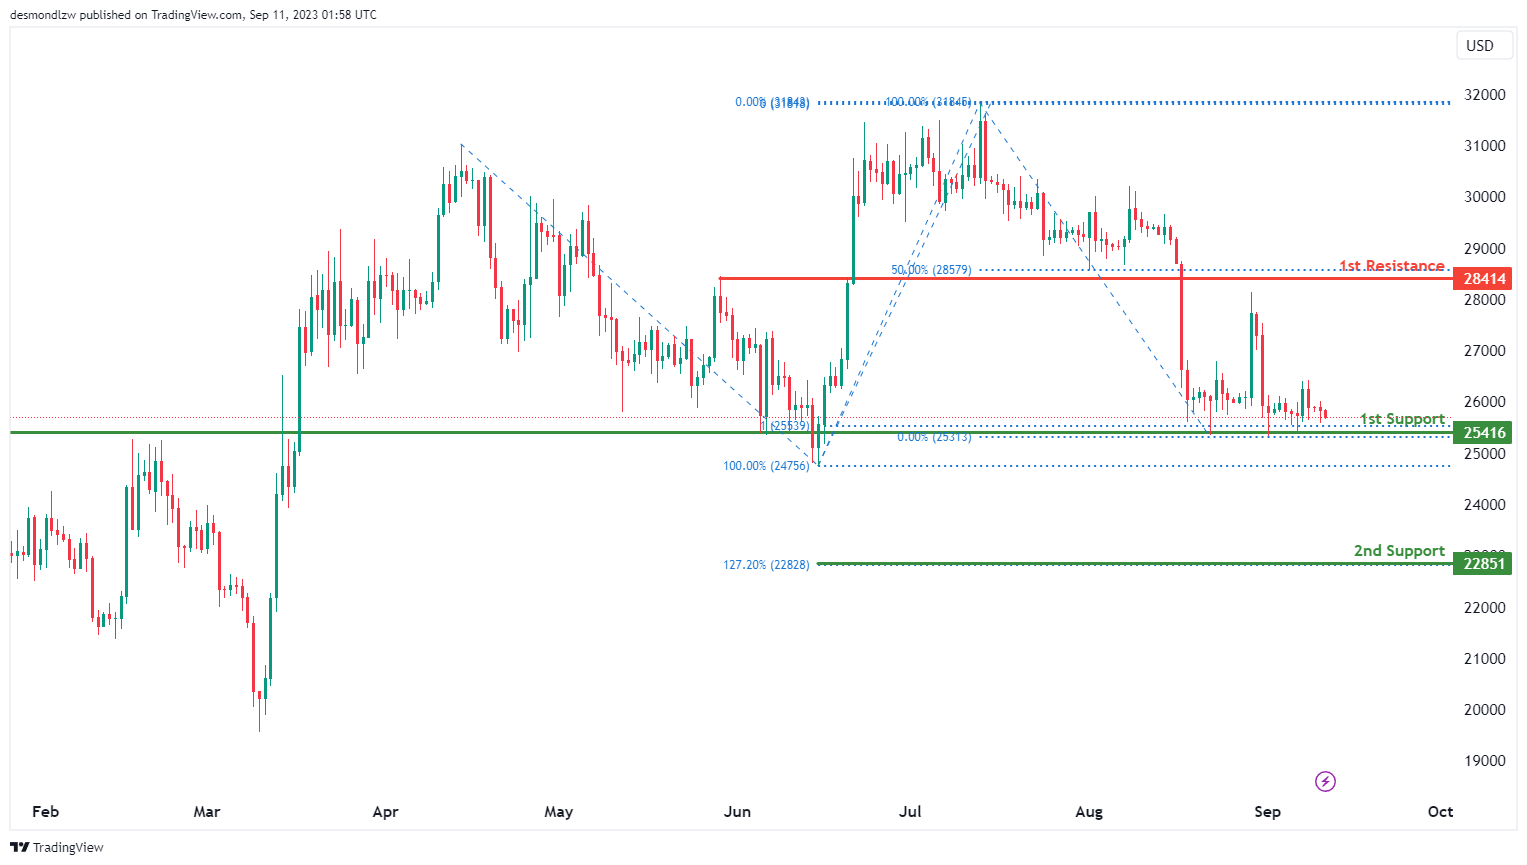
For BTC/USD, the overall momentum of the chart is currently bullish, indicating an upward trend.
There is potential for the price to make a bullish move by bouncing off the 1st support level at 25416 and heading towards the 1st resistance at 28414.
The 1st support at 25416 is considered significant because it represents an overlap support and aligns with the 100% Fibonacci Projection, suggesting potential stability at this level.
In case of a more substantial retracement, the 2nd support at 22851 is also noteworthy as it is identified as a 127.20% Fibonacci Extension, which can provide additional support for the price.
On the upper side, the 1st resistance at 28414 is considered important as it represents pullback resistance and aligns with the 50% Fibonacci Retracement, indicating potential resistance to further upward movement.
If the bullish momentum continues, it might face resistance at the 2nd resistance level of 27302, which is characterized as an overlap resistance and may pose a barrier to the bullish trend.
ETH/USD:
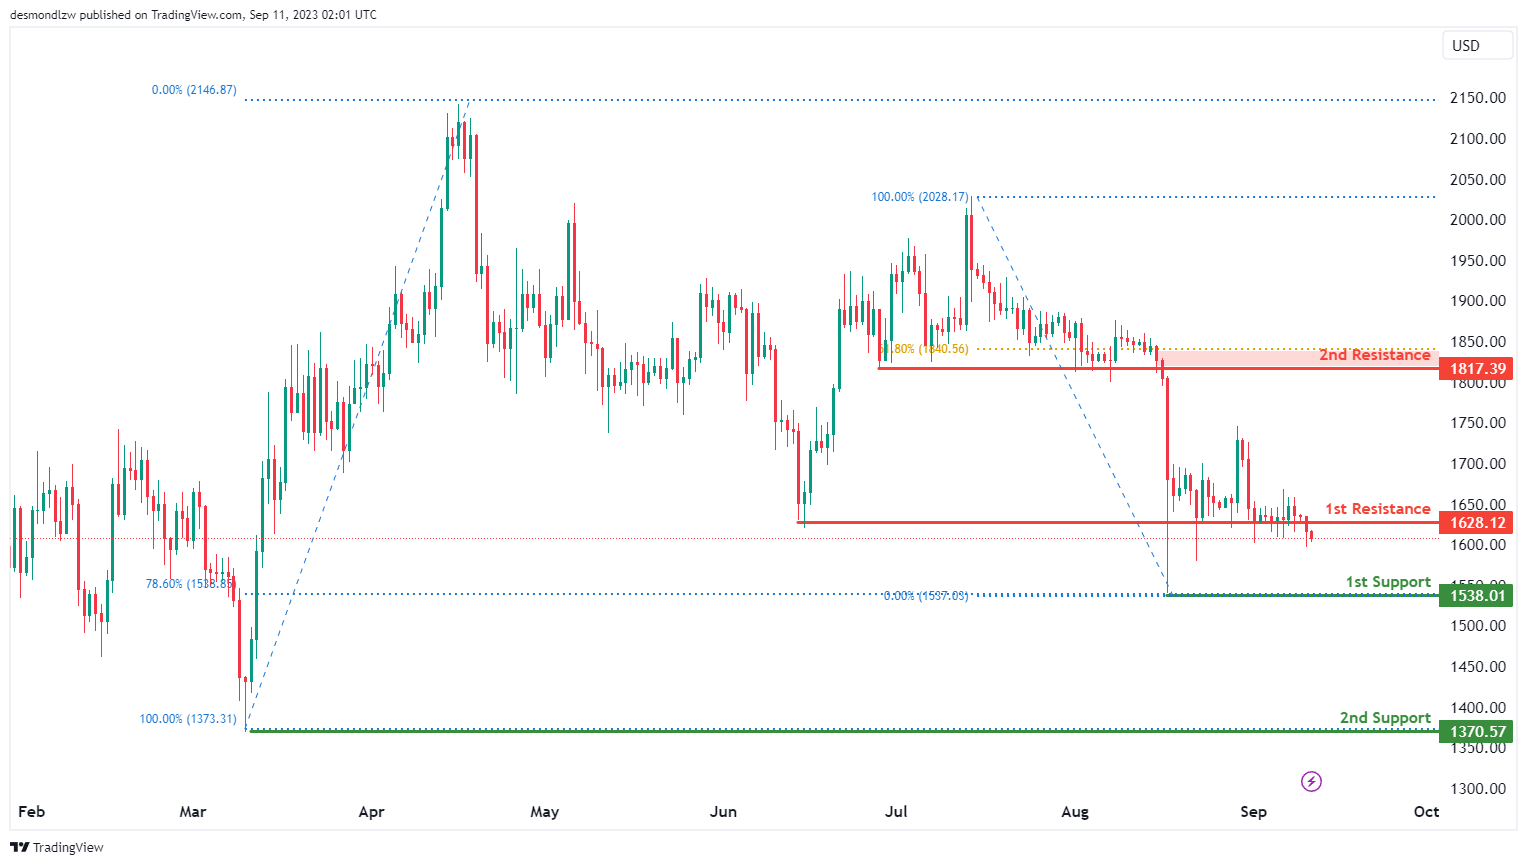
For ETH/USD, the overall momentum of the chart is currently bearish, indicating a downward trend.
There is potential for the price to continue in a bearish direction towards the 1st support level at 1538.01. This 1st support is considered significant because it represents a swing low support and aligns with the 78.60% Fibonacci Retracement level, suggesting potential stability at this point.
In case of a more substantial decline, the 2nd support level at 1370.57 is also noteworthy as it acts as a swing low support, offering potential additional support to the price.
On the other hand, if there’s a reversal in the price, it may face resistance at the 1st resistance level of 1628.12, identified as pullback resistance.
Further upward movement could encounter resistance at the 2nd resistance level of 1817.39, characterized as a pullback resistance and coinciding with the 61.80% Fibonacci Retracement level, potentially acting as a barrier to the bullish momentum.
WTI/USD:
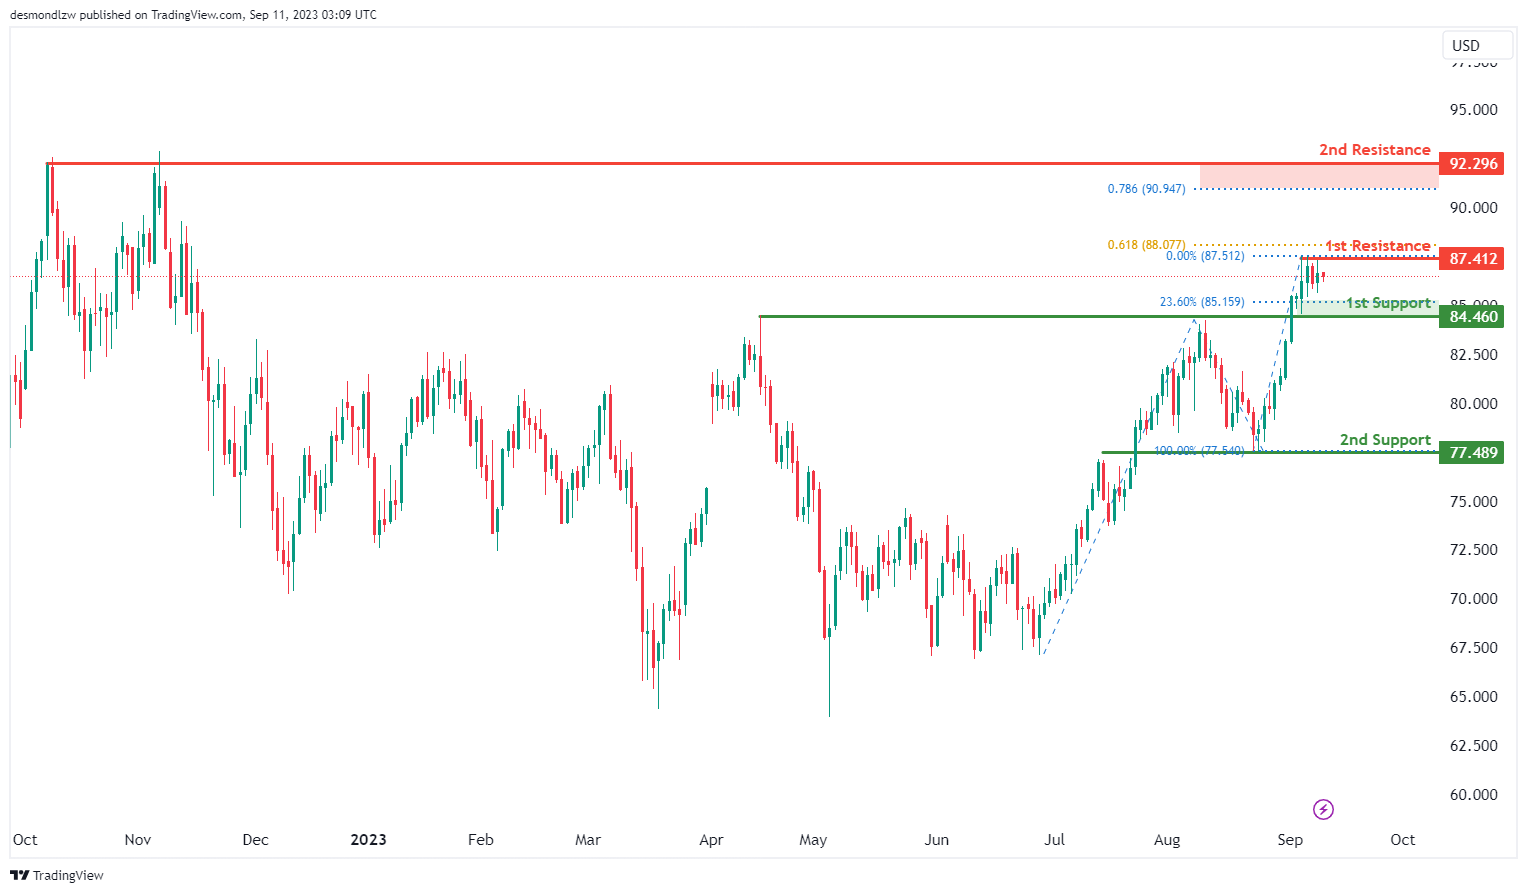
The WTI (West Texas Intermediate) chart currently exhibits a neutral overall momentum, indicating a lack of a clear bullish or bearish trend. Given this neutral momentum, there is a possibility that price could fluctuate between the 1st support and 1st resistance levels.
The 1st support level at 84.46 is identified as a pullback support that aligns with the 23.60% Fibonacci retracement level while the 2nd support level at 77.49 is marked as an overlap support, suggesting historical instances of price finding support around this level.
To the upside, the 1st resistance at 87.41 is identified as a swing-high resistance that aligns with the 61.80% Fibonacci projection level. In addition, the 2nd resistance level at 92.29 is noted as a multiple swing-high resistance that aligns with the 78.60% Fibonacci projection level, further enhancing its potential as a resistance level.
XAU/USD (GOLD):
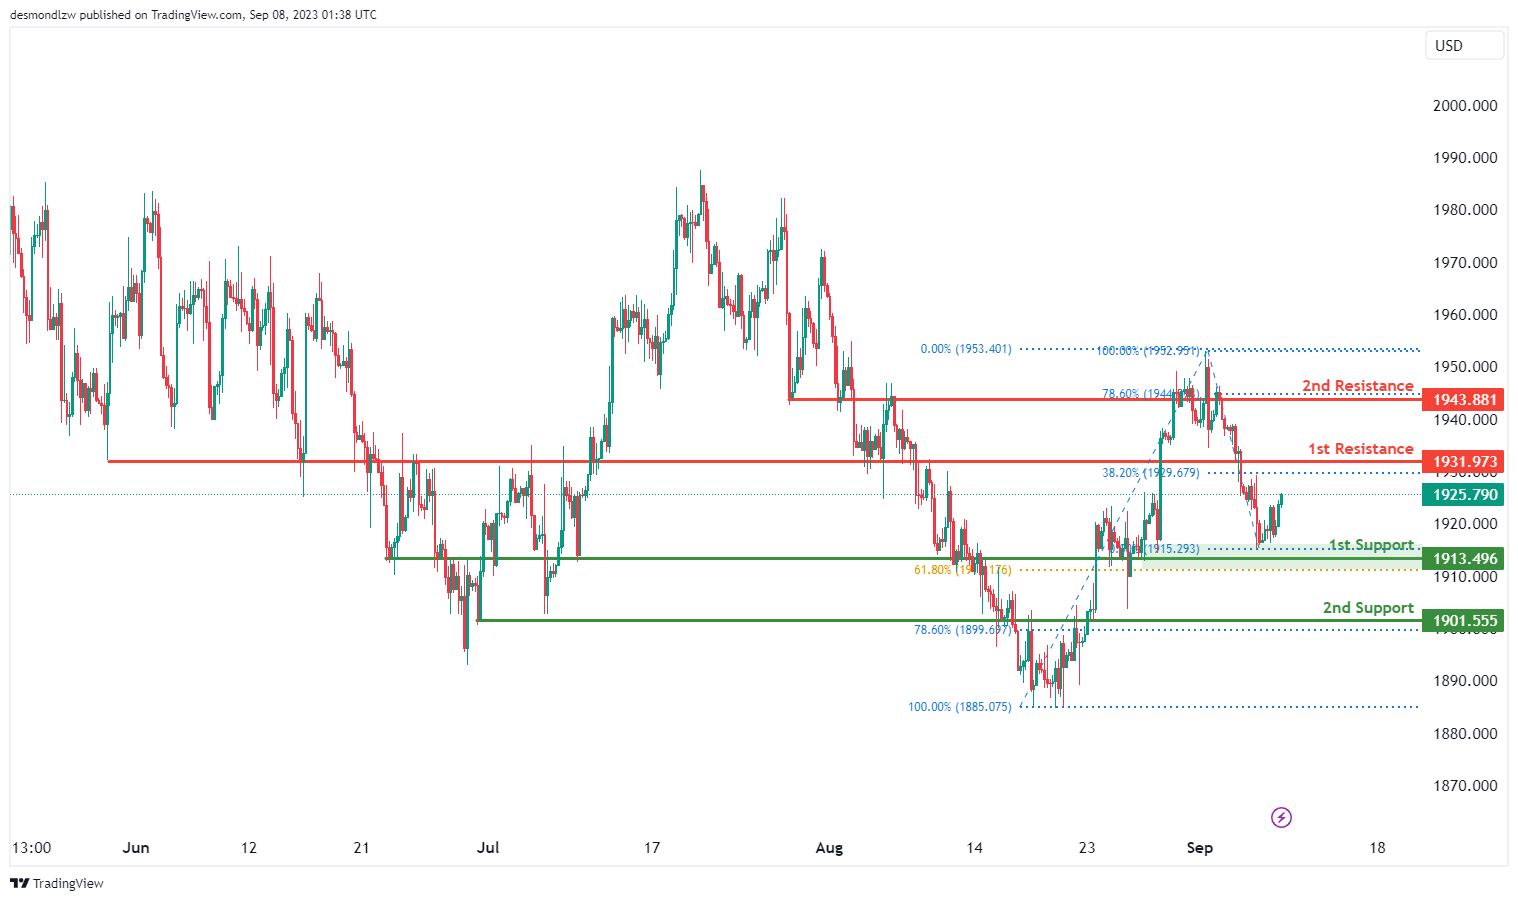
The XAU/USD chart currently exhibits a bearish overall momentum, indicating a potential downward trend in price movement. This is supported by the fact that the price is below a major descending trend line, reinforcing the notion of bearish momentum.
There’s a possibility of a short-term rise in price towards the 1st resistance level at 1945.31 before a potential reversal and a drop towards the 1st support.
The 1st support level at 1906.85 is considered significant as it represents an overlap support and aligns with the 61.80% Fibonacci Retracement level, indicating a strong potential support zone.
Additionally, the 2nd support at 1888.80 is also marked as an overlap support and aligns with the 78.60% Fibonacci Retracement, further reinforcing its potential role as a support level.
On the resistance side, the 1st resistance at 1945.31 is identified as an overlap resistance, potentially acting as a barrier to any bullish movements.
Furthermore, the 2nd resistance level at 1981.69 is noted as an overlap resistance, indicating potential resistance in this area.
EUR/USD Signals Bearish Breakdown, 1.0620 Presents Support
Key Highlights
- EUR/USD started a fresh decline below the 1.0750 support.
- A connecting bearish trend line is forming with resistance near 1.0730 on the 4-hour chart.
- GBP/USD dropped below the key 1.2500 support zone.
- USD/JPY is aiming for a move toward the 148.80 resistance.
EUR/USD Technical Analysis
The Euro faced rejection above the 1.0900 level against the US Dollar. As a result, EUR/USD started a fresh decline below the 1.0850 and 1.0780 levels.
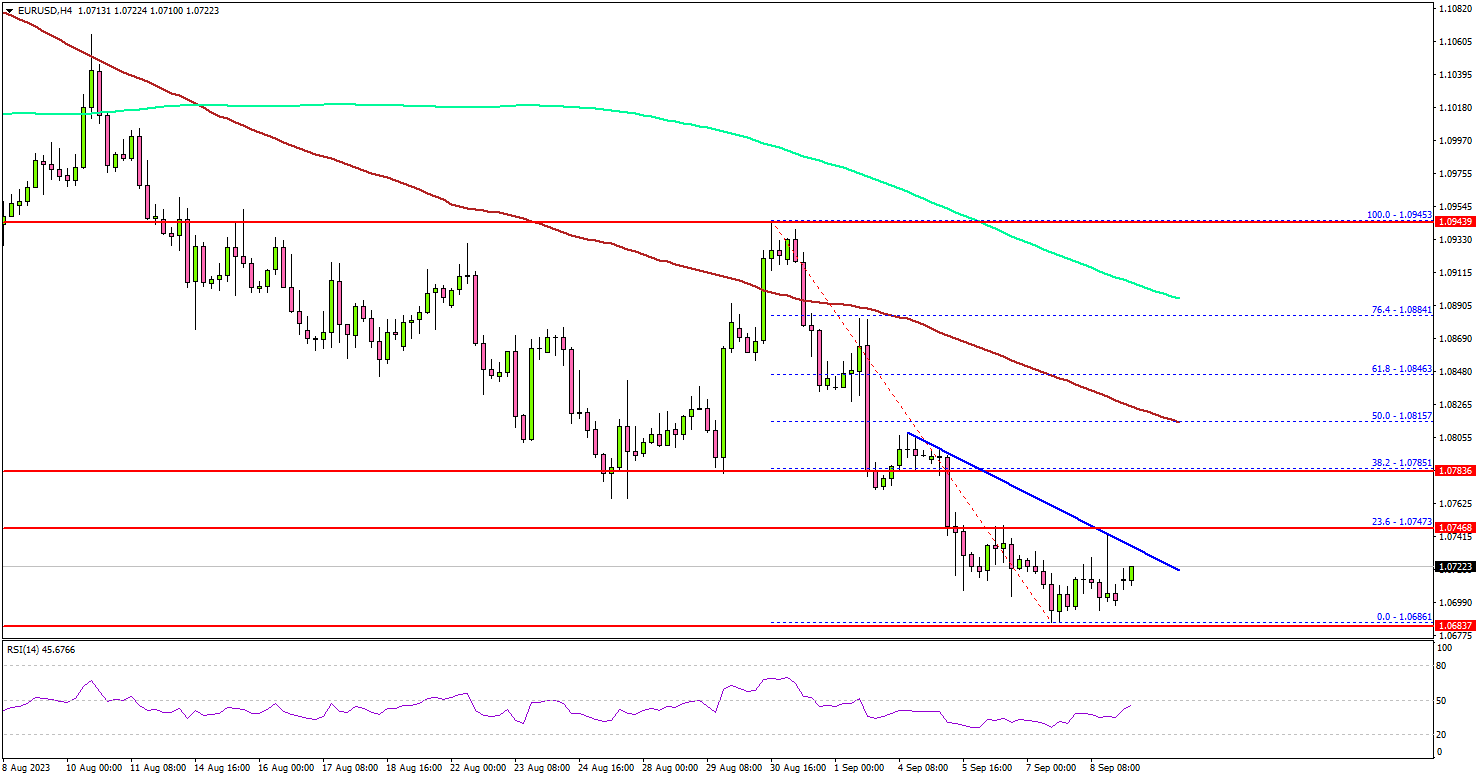
Looking at the 4-hour chart, the pair settled below the 1.0750 support, the 100 simple moving average (red, 4 hours), and the 200 simple moving average (green, 4 hours).
The pair even traded below 1.0700 before the bulls appeared. The pair is now consolidating losses and remains at risk of more downsides. On the downside, immediate support is near 1.0675. The next key support is seen near the 1.0650 level.
The first major support is near 1.0620. If there is a move below 1.0620, the pair could dive toward 1.0550. Any more losses might send the pair toward the 1.0500 level.
On the upside, an initial resistance is near the 1.0725 level. There is also a connecting bearish trend line forming with resistance near 1.0730 on the same chart. The next major resistance is near the 1.0785 level. A close above 1.0785 could start another decent increase.
In the stated case, the pair could rise toward the 1.0850 level. Any more gains could send the pair toward the 1.0950 pivot zone.
Looking at GBP/USD, the pair remained in a bearish zone and there was an extended decline below the 1.2500 support.
Economic Releases
- BoE's Mann speech.
10-year JGB yield hits 9-year high on BoJ Ueda, Yen rebounds
Yen saw a notable uptick in Asian session, buoyed by hawkish sentiments by BoJ Governor Kazuo Ueda. Concurrently, 10-year JGB yield scaled its highest level in nine years, breaching 0.7% mark.
In an interview with Yomiuri newspaper published over the weekend, Ueda hinted at the possibility that BoJ might have sufficient data by the close of the year to contemplate ending its negative interest rate policy. Such remarks from Ueda have spurred speculation among market analysts, with some interpreting them as early signals for the markets, suggesting a potential end to negative interest rates by Q1 2024. Before this step, there also are anticipations of yield curve control being phased out later this year.
On the flip side, certain analysts, referencing recent data which highlights decelerating wage growth, argue that the transition from negative rates might not be imminent. They believe Ueda's remarks might be more of a countermeasure to Yen's recent depreciation.
Ueda, during the interview, emphasized the need for Japan to witness a consistent rise in inflation, complemented by wage growth, before implementing changes. "If we judge that Japan can achieve its inflation target even after ending negative rates, we'll do so," Ueda asserted. However, he also reiterated the central bank's stance on maintaining its ultra-loose policy for now, until there's firm confidence that inflation will consistently hover around the 2% mark, bolstered by robust demand and wage growth.
He cautioned, "While Japan is showing budding positive signs, achievement of our target isn't in sight yet." Looking ahead, Ueda underscored the importance of wage trajectories in the coming year, indicating that conclusive decisions would be data-driven. "We can't rule out the possibility we'll get enough information and data by year-end," Ueda added.
USDCAD Wave Analysis
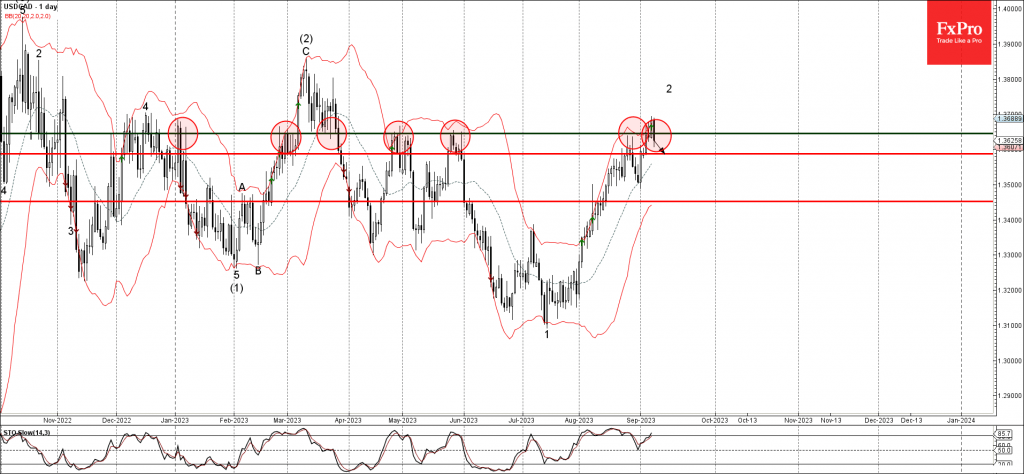
- USDCAD reversed from key resistance level 1.3645
- Likely to fall to next support level 1.3585
USDCAD currency pair recently reversed down from the key resistance level 1.3645 (which has been repeatedly reversing the price from April), intersecting with the upper daily Bollinger Band.
The downward reversal from the resistance level 1.3645 stopped the previous short-term correction 2.
Given the overbought daily Stochastic, USDCAD can be expected to fall toward the next support level 1.3585.
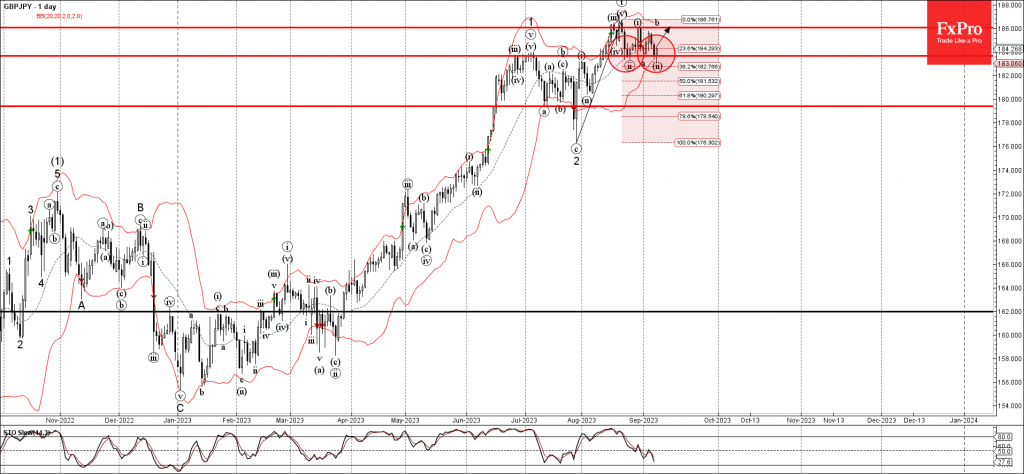
GBPJPY Wave Analysis
- GBPJPY reversed from support level 183.65
- Likely to rise to resistance level 186.00
GBPJPY currency pair recently reversed up from the key support level 183.65 (which has been repeatedly reversing the pair from the end of August), intersecting with the lower daily Bollinger Band and the 38.2% Fibonacci correction of the upward impulse from July.
The upward reversal from the support level 183.65 stopped the previous short-term correction ii.
Given the strong daily uptrend, GBPJPY can be expected to rise toward the next resistance level 186.00 (which has been reversing the price from the middle of August).
Forex and Cryptocurrencies Forecast
EUR/USD: September 13 and 14 - Key Days of the Week
For the eighth consecutive week, the U.S. Dollar Index (DXY) is rising, while EUR/USD is declining. The currency pair has retreated to levels last seen three months ago, settling in the 1.0700 zone. It was only the dollar bulls starting to lock in accumulated gains on Friday, September 8, that prevented further declines.
The fundamental backdrop continues to favour the U.S. currency. Business activity, as measured by the Services PMI, shows consistent growth; it rose from 52.7 to 54.5 against a forecast of 52.5. Additionally, data released on September 8th indicated that the U.S. labour market is performing at least adequately. The number of initial jobless claims came in at 216K, lower than both the forecast of 234K and the previous figure of 229K.
On the same day, European statistics appeared decidedly weak. For instance, in Q2, the EU economy grew by a mere 0.1%, despite Q1 growth and market expectations being at 0.3%. In annual terms, with a forecast of 0.6%, the actual growth rate was also lower at 0.5%. Germany's industrial production volume decreased by -0.8% in July, compared to a forecast decline of -0.5%. Meanwhile, despite efforts to reduce it, inflation in Germany remains stable. The Consumer Price Index (CPI) published on Friday, September 8, stayed at 0.3% month-over-month (m/m) and 6.4% year-over-year (y/y).
According to many analysts, the European Central Bank (ECB) finds itself in a predicament. On one hand, to combat inflation, interest rates need to be raised; on the other hand, to assist the economy, they should be lowered. It is quite possible that in its meeting on Thursday, September 14, the regulator will take a pause and leave the key interest rate unchanged at 4.25%. Currently, the likelihood of such a decision is estimated at 35%.
As for the Federal Open Market Committee (FOMC) meeting of the U.S. Federal Reserve scheduled for September 20th, market participants are confident that the regulator will also leave interest rates unchanged. However, the reason in this case is different. While the Eurozone teeters on the edge of recession and stagflation, the U.S. is undergoing a "soft landing." As assured by John C. Williams, President of the Federal Reserve Bank of New York, "monetary policy is in a good place." Of course, the balance could tip one way or the other after inflation data for the United States becomes available on Wednesday, September 13.
That said, a pause in September does not mean the end of the monetary tightening cycle. According to CME FedWatch, the odds of a 25 basis point (b.p.) rate hike in November are at 37%. Even if this hike doesn't materialize, it is unlikely to harm the dollar. Much of the negative sentiment is already priced into the USD, as markets have long been betting on a recession in the U.S. economy and a corresponding easing of the Federal Reserve's monetary policy. Now, it has become clear that a dovish shift is unlikely, and the key interest rate will, at a minimum, remain at the peak level of 5.5% for an extended period.
EUR/USD pair began its descent from a high of 1.1275 eight weeks ago, on July 18, ending the past trading week at 1.0699, shedding 576 points. As of the evening of September 8, when this review was written, 45% of experts predict a rise for the pair in the near term, another 45% foresee a decline, and 10% hold a neutral stance. Regarding technical analysis, nothing has changed over the past week. All trend indicators and oscillators on the D1 timeframe continue to be 100% in favor of the U.S. currency and are coloured red. However, already 30% of the most recent indicators signal the pair is oversold. Immediate support for the pair is located around 1.0680, followed by 1.0620-1.0635, 1.0515-1.0525, 1.0480, 1.0370, and 1.0255. Bulls will encounter resistance around 1.0730-1.0745, followed by 1.0780-1.0800, 1.0835-1.0865, 1.0895-1.0925, 1.0985, 1.1045, 1.1090-1.1110, 1.1150-1.1170, 1.1230, and 1.1275-1.1290.
It's essential to note Wednesday, September 13 in the calendar for the upcoming week, when consumer inflation data (CPI) for the U.S. will be released. On Thursday, September 14, the European Central Bank (ECB) will announce its decision on interest rates. Of course, the subsequent central bank leadership press conference will also be of great interest. On the same day, the number of initial jobless claims in the U.S. will traditionally be published, along with retail sales data and the Producer Price Index (PPI) for the country.
GBP/USD: Peak Rate Continues to Lower
At present, the central question for many central banks, including the Bank of England (BoE), is what takes precedence: taming inflation or preventing the economy from slipping into recession? Indeed, the British economy seems to be heading in the latter direction. The Purchasing Managers' Index (PMI) for the country's manufacturing sector in August stood at a mere 43.0, with the headline PMI dropping to a 39-month low. According to recent data, the PMI in the services sector has declined to 49.5, dipping below the 50.0 threshold into contraction territory for the first time since January.
So, what about inflation? Although the annual inflation rate in the UK decreased from 7.9% to 6.8% (the lowest since February 2022), it remains the highest among G7 countries. Moreover, the core Consumer Price Index (CPI) remained at 6.9% year-over-year, only 0.2% below the peak set two months earlier.
According to the latest survey conducted by the Bank of England's Monthly Decision Maker Panel (DMP) on Thursday, September 7th, British businesses anticipate that the CPI will decline to 4.8% year-over-year within the next year. It is worth noting that the regulator itself aims to bring the CPI closer to 5.0% by the end of this year.
Surveys indicate that under the current circumstances, the country's leadership is prioritizing economic salvation over the battle against inflation. Huw Pill, the Bank of England's Chief Economist, stated that while there is no room for complacency concerning inflation, he would prefer to keep the interest rate stable for a longer period. He added that in the upcoming BoE meeting on September 21, he will vote to maintain the rate at its current level of 5.25%.
According to Reuters, markets are currently pricing in an 85% likelihood that the BoE's final interest rate, after one or two hikes by year's end, will be 5.75%. This projection is significantly lower than July's, when a peak rate of 6.5% was anticipated. It is worth noting that the future 5.75% for the pound is just 25 basis points higher than the current 5.50% for the dollar, a gap that clearly does not favour the British currency. Moreover, the U.S. Federal Reserve's rate could potentially rise by an additional 25-50 basis points.
GBP/USD closed last week at a rate of 1.2465. Economists from Singapore's United Overseas Bank Limited (UOB) anticipate that the pair may test strong support at the 1.2400 level over the next 1-3 weeks. However, they believe that short-term oversold conditions could decelerate the pace of further decline. Expert forecasts are evenly divided, much like those for EUR/USD: 45% predict a northward correction, 45% foresee a continued southward trend, and the remaining 10% point to an eastward move. Among the oscillators on the D1 chart, 100% are coloured in red, with 15% indicating oversold conditions. Trend indicators show a 90% to 10% ratio favouring red. If the pair trends downward, it will encounter support levels and zones at 1.2445, 1.2370-1.2390, 1.2300-1.2330, 1.2270, 1.2190-1.2210, 1.2085, 1.1960, and 1.1800. In case of upward movement, resistance can be expected at levels 1.2510, 1.2560-1.2575, 1.2600-1.2615, 1.2690-1.2710, 1.2760, 1.2800-1.2815, 1.2880, 1.2940, 1.2995-1.3010, 1.3060, and 1.3125-1.3140, as well as 1.3185-1.3210.
In terms of key economic data for the United Kingdom, the unemployment figures set to be released on Tuesday, September 12, are of particular interest. Additionally, the country's July GDP numbers, which will be disclosed on Wednesday, September 13, are also noteworthy.
USD/JPY: Bulls Wary as Bears Anticipate Currency Interventions
As for Japan, the question of "economy or inflation" is not up for debate; the answer is unequivocally the economy. On Wednesday, September 6, Kyodo News, citing anonymous sources, reported that the Japanese government apparently plans to roll out new economic stimulus measures in October. Reuters, quoting Japanese media outlets, identified the primary goals of the stimulus as "supporting wage increases within companies and mitigating electricity costs." "It is expected that Prime Minister Fumio Kishida will task [the responsible parties] with preparing a draft […] to allocate additional budget resources for these measures," the report stated. Reuters also presented an analysis indicating that the country's debt burden will increase due to the announced stimulus measures. According to estimates, Japan's debt, which is already twice its GDP, will hit a record level of 112 trillion yen (760 billion dollars) in the next fiscal year.
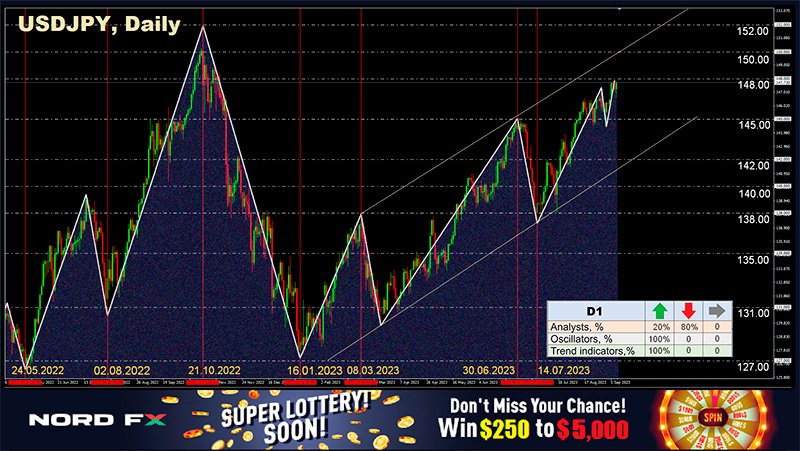
It becomes clear that under such circumstances, inflation will continue to rise. Meanwhile, USD/JPY continues its upward movement, reaching a level of 147.86 on September 7, marking a 10-month high. On Friday, September 8, Japan's Finance Minister Shunichi Suzuki reiterated once again that the country's authorities "are not ruling out any options to combat excessive currency fluctuations." However, no market participants believe in a rate hike anymore, given that it has been stuck at a negative level of -0.1% for many years. Concerns are growing among investors that the Ministry of Finance and the Bank of Japan (BoJ) may finally resort not to verbal, but to actual currency interventions, as was the case last fall. According to the same Reuters report, Japan's chief currency diplomat, Masato Kanda, stated that Japanese banking authorities are considering the possibility of intervention to put an end to "speculative" movements.
Against the backdrop of the DXY Dollar Index holding around 105.00, its highest level since March, only currency interventions by the Bank of Japan could help the yen strengthen its position somewhat. However, according to some analysts, the main reason for the yen's weakness lies in the disagreements among the country's politicians regarding its monetary policy.
The final point of the past trading week was marked at 147.79. Strategists at UOB Group anticipate that the continuation of the upward momentum could push USD/JPY towards an assault on the 149.00 level in the coming weeks. As for the consensus forecast, only 20% of analysts still believe in the dollar's potential and the pair's further growth. Bears have gained the favour of 80%. (It's worth noting that even a 100% consensus does not guarantee the accuracy of the forecast, especially when it comes to the Japanese yen.) As for the trend indicators and oscillators on the D1 chart, all 100% are coloured green, although 40% of these are signalling overbought conditions. The nearest support level lies in the 146.85-147.00 zone, followed by 146.10, 145.55-145.70, 145.30, 144.90, 144.50, 143.75-144.05, 142.90-143.05, 142.20, 141.40-141.75, 140.60-140.75, 139.85, 138.95-139.05, 138.05-138.30, and 137.25-137.50. The nearest resistance stands at 148.45, followed by 148.85-149.10, 150.00, and finally, the October 2022 peak at 151.90.
No significant economic data concerning the state of the Japanese economy is scheduled for release in the upcoming week.
CRYPTOCURRENCIES: Fear and Doubt in the Market
For the third week, the market has been in a state of apathy. According to observations by crypto-millionaire William Clemente, the total trading volume for digital assets has fallen to its lowest levels since 2020. The BTC/USD chart on the H1 and H4 timeframes mostly resembles an ant trail, where these insects move in a thin, unbroken line.
The situation was invigorated by a court decision in the Grayscale case. This world-leading investment firm in cryptocurrency asset management won an appeal against the U.S. Securities and Exchange Commission (SEC). As a result, on August 29, bitcoin surged from $26,060 to $28,122 within three hours, showing its best growth rate in the last 12 months. However, the excitement was short-lived, as the SEC struck back by deciding to postpone until October the consideration of applications for spot bitcoin ETF registrations. Consequently, the flagship cryptocurrency returned to the support zone of $25,500.
Turning to technical analysis, this support corresponds to the Fibonacci level of 0.382. A break below this level could potentially lead to a fall to $21,700: the Fibonacci level of 0.618. Experts from Fairlead Strategies note that at the end of August, the digital gold's monthly chart confirmed an exit from the overbought zone on the stochastic oscillator, which could signal disappointment for bitcoin bulls. Analysts believe that this formed signal often indicates the passing of a local peak, as seen at the end of 2017 and the beginning of 2021. "The decline [in the stochastic oscillator] suggests that the bottom formation process may be prolonged. This is especially true when considering the Ichimoku cloud overhead, which serves as resistance (~$31,900)," said the report from Fairlead Strategies.
According to an analyst going by the nickname Tolberti, the BTC chart is forming a "head and shoulders" pattern, which threatens further price declines. Another argument supporting the bearish trend is that bitcoin is trading below its 200-week moving average (MA). As a result, Tolberti speculates that the leading cryptocurrency could fall to $10,000, with a possible reversal occurring in March 2024.
Negative forecasts are also coming from analysts at Cointelegraph. The fact is that bitcoin derivatives have started to show bearish tendencies. The BTC price chart leaves no doubt that investor sentiment has not improved following Grayscale's victory. Therefore, experts anticipate that the leading cryptocurrency's quotes could decline to $22,000 in the coming weeks.
Cointelegraph believes that not only the postponement of the launch of spot bitcoin ETFs is pressuring the market, but also U.S. regulatory actions against exchanges like Binance and Coinbase. Multiple sources claim that the U.S. Department of Justice (DOJ) is likely to charge the world's largest trading platform and initiate a criminal investigation. The allegations involve money laundering assistance and violation of sanctions against Russian companies.
Currently, market participants are in a state of limbo and are uncertain about what to expect. Regulatory uncertainty is favouring the bears. The derivatives market is ridden with fear and doubt, which benefits those betting on a decline, according to Cointelegraph.
We have previously noted that powerful catalysts for market growth in the medium and long term could be the launch of spot bitcoin ETFs and the bitcoin halving event scheduled for April 2024.
Recall that this summer, eight major financial institutions submitted applications to the SEC to enter the cryptocurrency market through spot bitcoin ETFs. Among them, in addition to BlackRock, are global asset managers like Invesco and Fidelity. According to some estimates, in the first six months after the ETF launch, new demand for the cryptocurrency could amount to $5-10 billion, and the value of BTC could rise to $50,000-120,000 per coin.
Despite the SEC's decision to postpone the review of applications until mid-autumn, the chances of approval are quite high. After all, BlackRock is not some small fish but a global investment giant, and it is in good standing with U.S. authorities. It's worth mentioning that when the Federal Reserve decided in 2020 to buy securities through ETFs to support the American economy, half of the volume went to BlackRock funds.
Interestingly, the company itself highly estimates the chances of application approval. This is evident from its purchasing of both bitcoin and shares of mining companies. In mid-August, it became known that BlackRock acquired shares of four major mining companies, spending a total of over $400 million. Larry Fink, BlackRock's CEO, has referred to bitcoin as digital gold and an international asset that potentially offers inflation protection.
Alistair Milne, the Chief Investment Officer of the Altana Digital Currency Fund, believes that the price of bitcoin could reach $100,000 even without the approval of spot bitcoin exchange-traded funds (ETFs). In his view, the ETF topic merely distracts market participants. Milne is confident that issues within the U.S. banking sector, the stabilization of risky assets following the end of the Federal Reserve's interest rate hikes and increasing profitability in the crypto-mining sector will drive the coin's price upward.
Arthur Hayes, the co-founder of the crypto exchange BitMEX, also thinks that due to issues in the banking sector, bitcoin is poised for substantial growth. According to him, the bull phase began after the Federal Reserve initiated a $25 billion program to stabilize the banking sector, notably including the "rescue" of Silicon Valley Bank. Hayes asserts that this situation has prompted traders to focus on assets with limited supply, such as bitcoin. While only a small fraction of market participants are currently taking this into account, he is convinced that their number will increase, and over the next 6-12 months, the leading cryptocurrency will experience a new surge.
As for the second driver, the halving, well-known blogger and analyst Lark Davis believes that this event could lead to a 500-600% increase in bitcoin's current price, potentially reaching around $150,000 to $180,000. However, with more than seven months to go before the halving, there are two upcoming events that could significantly influence investors' appetite for risky assets. These are the publication of U.S. inflation data on Wednesday, September 13, and the Federal Reserve meeting on September 20.
As of the time of writing this review, on the evening of Friday, September 8, BTC/USD is trading at around $25,890. The total market capitalization of the cryptocurrency market stands at $1.043 trillion, slightly down from $1.048 trillion a week ago. The Crypto Fear & Greed Index for bitcoin remains in the 'Fear' zone, registering at 46 points, up from 40 points a week earlier, though it is edging closer to the 'Neutral' zone.
In conclusion, another forecast comes from Artificial Intelligence. Utilizing several technical indicators, including Moving Average Convergence Divergence (MACD), Relative Strength Index (RSI), Bollinger Bands (BB), and others, the AI on the PricePredictions platform has calculated that the price of bitcoin should reach $26,228 by September 30. We don't have long to wait to see whether such intelligence can be trusted.
Dollar Index Nearing Key Resistance Zone ahead of an Important Fortnight
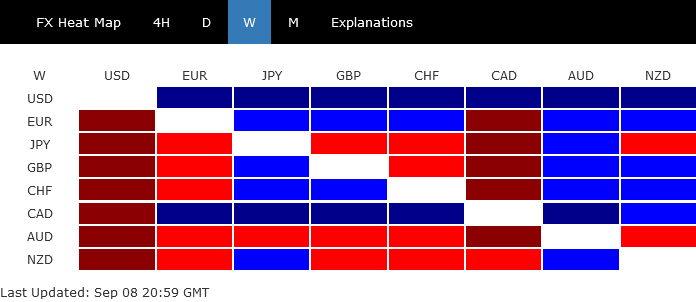
In a week characterized by significant currency movements, Dollar asserted its dominance, closing as the top performer and pushing the Dollar Index tantalizingly close to a pivotal medium-term resistance zone. The upcoming fortnight will be instrumental in assessing Dollar's upside momentum, which, in turn, will shed light on whether the currency is embarking on a sustained medium-term rally. Canadian Dollar clinched the second spot on the leaderboard, buoyed by robust employment figures.
Despite noticeable vulnerability against surging Dollar and looming uncertainties surrounding the ECB imminent rate decisions, the Euro still managed to outpace both Sterling and Swiss Franc, and closed as overall third strongest. However, the trio largely continued their trend of near-term range-bound movements, indicating a wait-and-watch approach among investors.
Down under, Australian Dollar faced a rough patch, ending the week as the most beleaguered currency. Despite evading sustained selling pressure towards the week's conclusion, Aussie continues to hang in a precarious balance, its fate intricately tied to the unfolding developments in China. This includes the renewed downward trajectory of the Yuan, which plumbed new lows, signaling concerns that could further dent the Australian Dollar's standing.
Adding to the narrative of struggling currencies was Yen, which emerged as the second most feeble currency over the week. While attempts to resurrect its stance through heightened verbal interventions by Japan did foster a transient recovery, it fell short of altering the entrenched downtrend.
Dollar Index Approaches Critical Resistance with Eight-Week Winning Streak
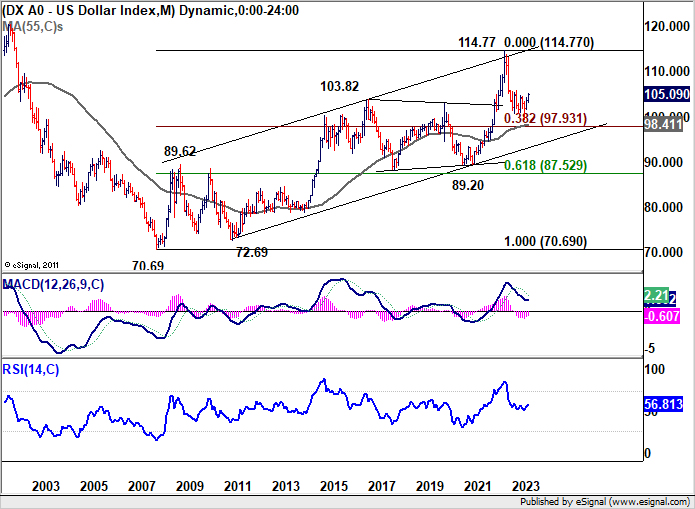
Dollar Index has notched its eighth consecutive week of gains, marking its longest winning streak since 2014 and closing at its highest point since March. The pivotal resistance zone of 105/106 is expected to be a decisive territory that could shape the medium-term outlook for the index. Investors and analysts are gearing up for a potentially significant period in the next two weeks, with key events including US CPI release on September 13, followed by ECB rate decision on September 14, and FOMC rate decision on September 20, which could delineate the future path of the dollar.
The narrative that Fed might persist with its high interest rates (if not higher) for an extended period is gaining traction. Last week's data release displayed unexpectedly strong performance by US services sector in August, characterized also by robust employment and price readings. Moreover, initial jobless claims descended to their lowest point since February, steering the sentiment towards positivity. Although the consensus anticipates a pause from Fed this, discussions are rife, with bets on another rate hike this year lingers around a 50-50 chance. Additionally, the central theme is beginning to shift to the duration for which current restrictive interest rates should be upheld to ensure a full circle back to the target inflation level, completing the last mile of disinflation.
The prolonged weakness of Euro, which constitutes a massive 57.6% of Dollar Index, has been a cornerstone in the protracted rally of the index. Last week saw EUR/USD declined by -0.7%, rounding off its eighth successive month in the red. The spotlight now turns towards ECB's upcoming actions. A recent Reuters poll showcased a polarized expectation, with 39 out of 69 participants foreseeing a hold in deposit rate at 3.75% in the Thursday announcement. Futures market is leaning towards a pause too, with a 65% probability. The end of the year prediction remains equally split, as 36 of 69 respondents expecting the deposit rate to stay unchanged through 2023, with 33 expecting one more 25bps hike.
Technically, it's still uncertain if Dollar Index's rise from 99.57 represents a correction to the down trend from 114.77 (2022 high), or it's reversing the trend. The pickup in upside momentum as seen in D MACD is adding favor to the bullish case. In the background, DXY was also supported well by 55 M EMA (now at 98.41) and 38.2% retracement of 70.69 (2008 low) to 114.77 at 97.93.
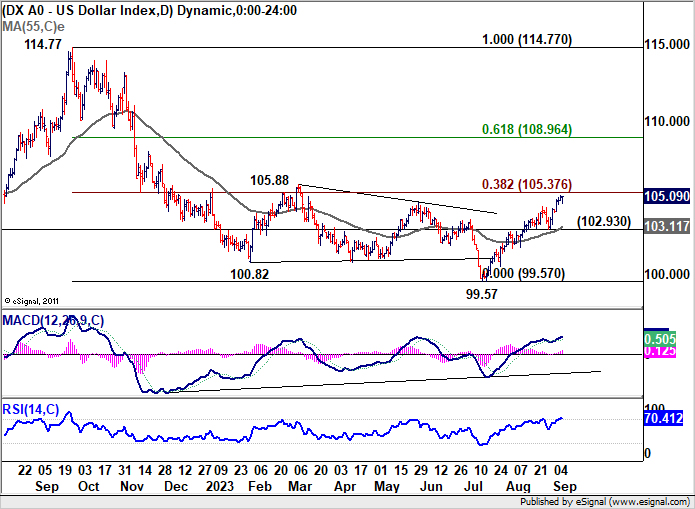
Sustained break of 38.2% retracement of 114.77 to 99.57 at 105.37, and more preferably 105.88 resistance) would add more weight to the bullish scenario, and set up further rally to 61.8% retracement at 108.96 next. Nevertheless, rejection by 105.37/88 zone, followed by break of 102.93 will turn near term outlook bearish for retesting 99.57 low again.
The next move would hopefully be decided after the rate decisions of ECB and then Fed, as well as their new economic projections.
Japan's intervention might only slow Yen's decline for now
In the face of a 10-month low against Dollar nearing 148 mark, Japan intensified its verbal intervention last week, indicating a strong vigilance towards the ongoing depreciation in Yen's exchange rate. Following the assertive comments from Japan's top officials, USD/JPY exhibited a brief pullback only to resurge swiftly, wrapping up the week on a strong note.
Masato Kanda, noted as Japan's FX czar by several quarters, emphasized the government's heightened sense of urgency as they closely monitor the currency fluctuations, asserting a readiness to respond adeptly to curb any excesses. This stance found a resonance in Finance Minister Shunichi Suzuki's affirmation that all options remained on the table to mitigate excessive volatility, reflecting a reinforced government vigilance over the currency dynamics.
A retrospection to the scenario exactly a year back brings to light Ministry of Finance's direct intervention in the currency market, as USD/JPY escalated past 145. This move managed to momentarily pull back the pair to around 140 on September 22. However, the respite was transient as a potent rally propelled USD/JPY past 150 in October.
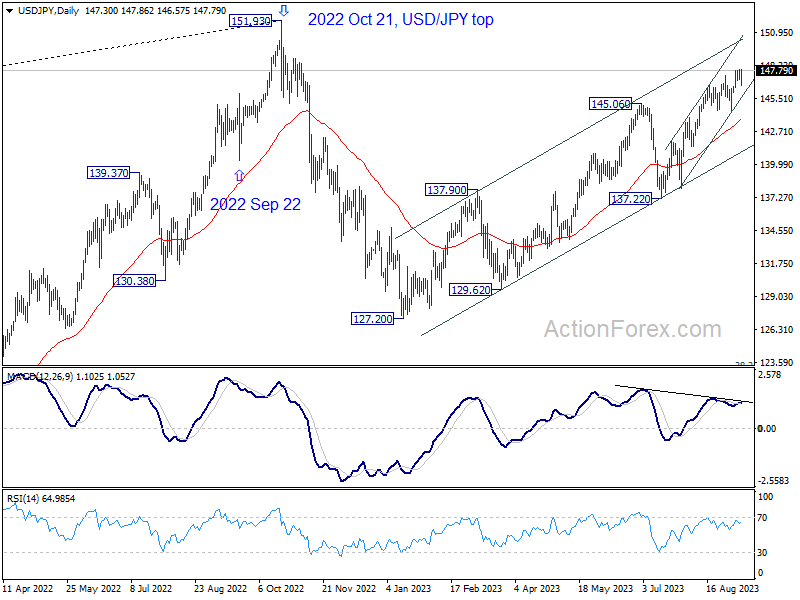
The strategic approach adopted by Japan was apparent — a cautious foray to gauge the readiness of Yen buyers, and opting not to combat forcefully when the markets exhibited unreadiness. Later, the government adopted a more assertive posture in latter part of October, capitalizing on the positive shift in US market risk sentiment.
The government's concerted Yen purchasing action on October 21 last year, synchronized with the intensified rally of DOW breaking through 55 D EMA, spurred speculators to relinquish their short positions on Yen. This collaborative force fueled a sustained Yen rebound, ensuing a nearly three-month downtrend in USD/JPY.
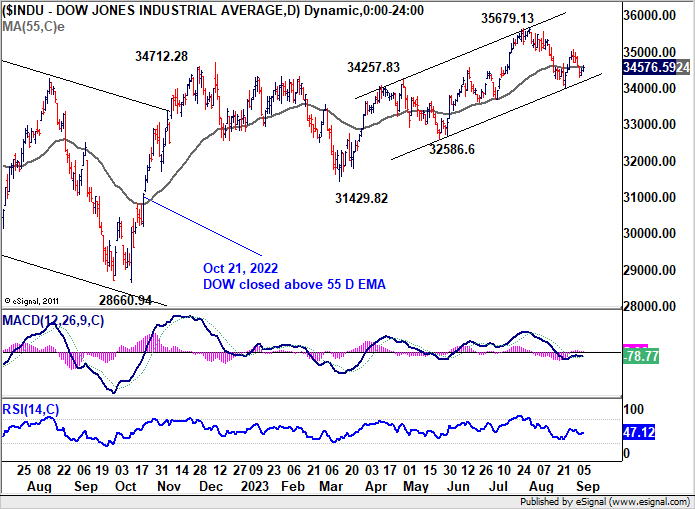
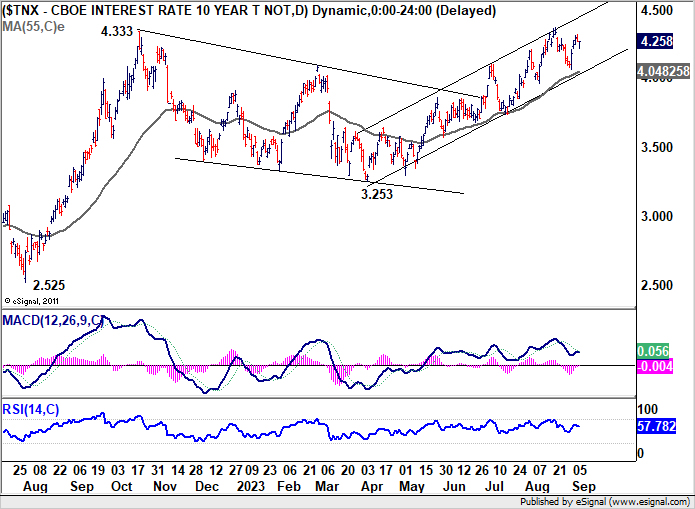
As history often paints the potential future, it is inferred that any successful intervention by Japan — verbal or tangible — hinges predominantly on a transformation in the broader market environment. The ongoing rally in US stocks does little to bolster Yen. Bearish reversal in equities could paradoxically fuel Dollar's overall rally, rendering support to Yen quite limited.
The prospect of US 10-year yield piercing through the significant 4% psychological threshold to invoke a bearish reversal seems remote at this juncture. Consequently, while Japan's vigilant stance and readiness for intervention echo loud, reversal of USD/JPY's up trend through the hands of the government appears to be a distant objective, with slowing down being a more immediate and realistic expectation.
Chinese Yuan plummets to historic lows
Chinese Yuan's downslide resumed vigorously last week, with the onshore Yuan depreciating to its lowest point against Dollar since 2007. Concurrently, its offshore equivalent dipped to a ten-month nadir against the greenback. The Yuan's decline began early this year, pressured by stumbling post-pandemic economic recovery and expanding yield gap with other global economies. These dynamics shifted capital flows. An escalating crisis in the property markets only intensified the gloomy economic outlook.
Recent economic indicators point towards an unabated slowdown in the Chinese economy. August Caixin PMI services underscored a sharper-than-anticipated contraction in the sector. This pullback mirrors the reluctance of Chinese households to spend, further evidenced by subdued inflation figures for August, which saw the CPI inch up by just 0.1% yoy.
China's response to these development has been perplexing. Attempts were made to buttress Yuan, including the 200 basis points cut in the foreign exchange reserve requirement ratio by China's central bank. Yet, in a twist, PBoC on Friday reversed a recent practice, adjusting the daily reference rate – or "fixing" – to its lowest point in two months. This indicates a potential willingness by PBoC to accommodate a weaker Yuan.
Amid this backdrop, a Bloomberg analysis brings to light the potential for China's economic woes to send shockwaves across global financial markets. Citing a Fed discussion paper titled "Global Spillovers of a China Hard Landing" published in 2019, the report highlighted the historical precedence from 2015-16 where capital flight from China induced swift devaluation of Yuan and steep descents in Chinese equities. These shifts spilled over, impacting global markets across various sectors, from forex and stocks to treasuries and commodities.
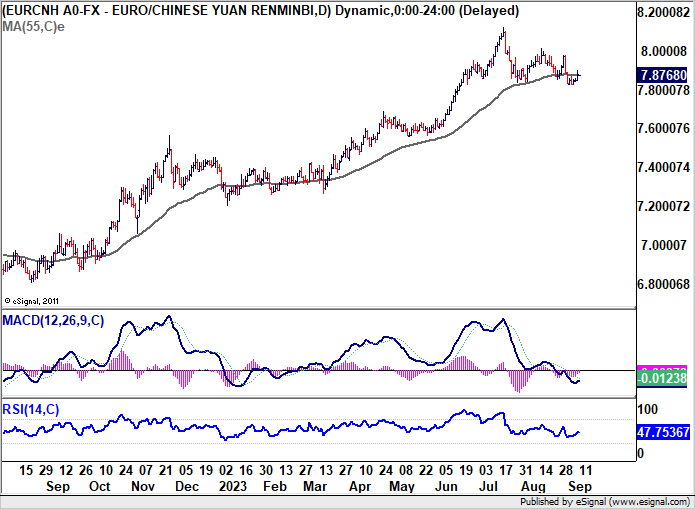
However, the prevailing rally in USD/CNH appears to be more a reflection of the Dollar's robustness rather than intrinsic Yuan weaknesses. EUR/CNH, which stands at 7.8768, remains well below its July peak of 8.1219. The alarm bells shouldn't ring unless there's a simultaneous extended sell-off in EUR/USD combined with a bullish breakout in EUR/CNH.
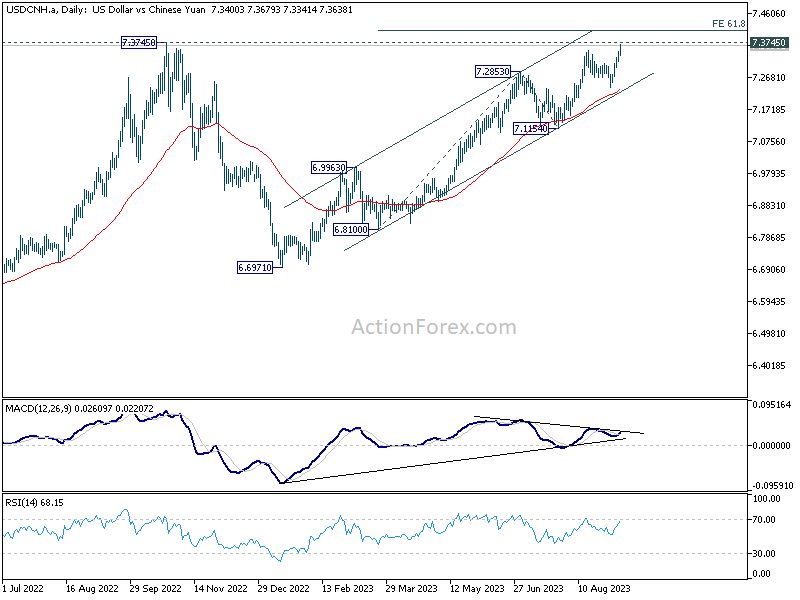
As for USD/CNH, the focal point will be on whether 61.8% projection of 6.8100 to 7.2853 from 7.1154 at 7.4091 could cap upside after the pair passes through 7.3745.
EUR/USD Weekly Outlook
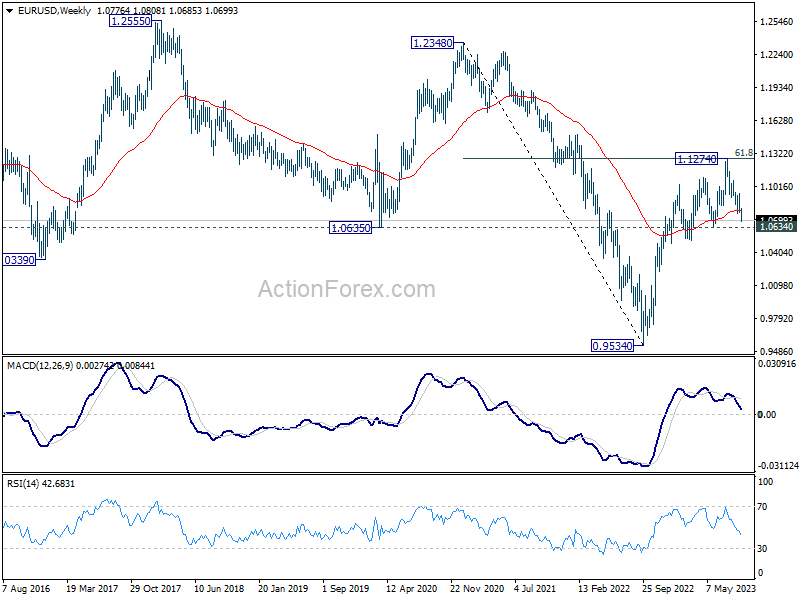
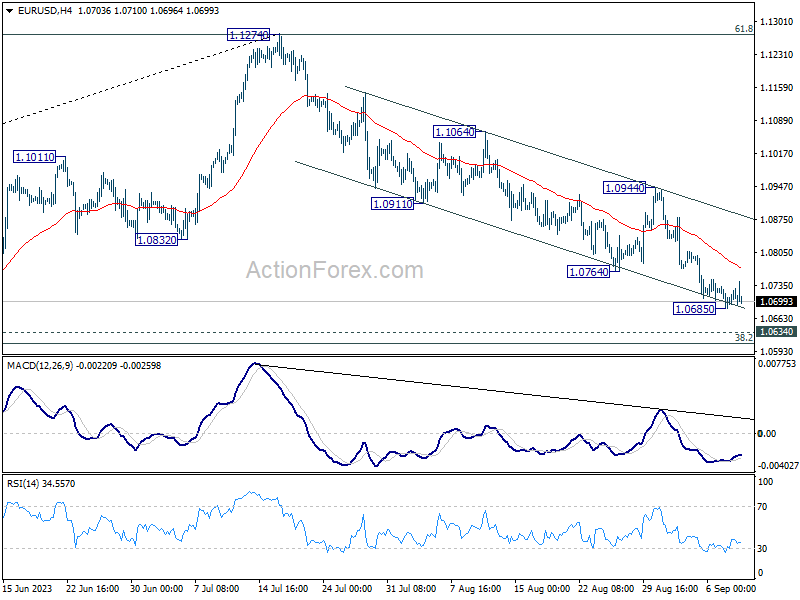
EUR/USD's decline from 1.1274 resumed last week and hit as low as 1.0685. As a temporary low was formed, initial bias stays neutral this week for consolidations first. But outlook will remain bearish as long as 1.0944 resistance holds. Below 1.0685 will target 1.0609/34 cluster support zone next.
In the bigger picture, fall from 1.1274 medium term top is seen as a correction to up trend from 0.9534 (2022 low). Strong support could be seen from 1.0634 cluster support (38.2% retracement of 0.9534 to 1.1274 at 1.0609) to bring rebound, at least on first attempt. Break of 1.0944 will indicate the start of the second leg, and target retest of 1.1274. However, sustained break of 1.0609/0634 will raise the chance of bearish trend reversal, and target 61.8% retracement at 1.0199.
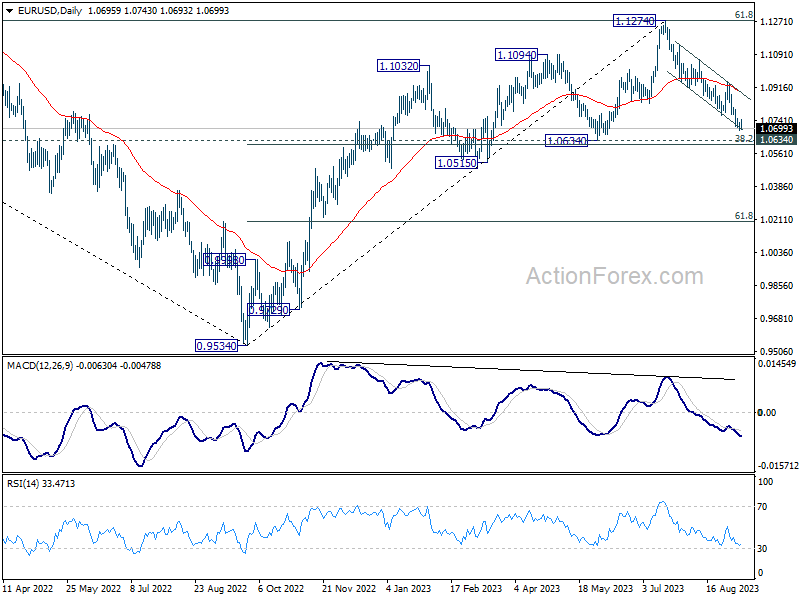
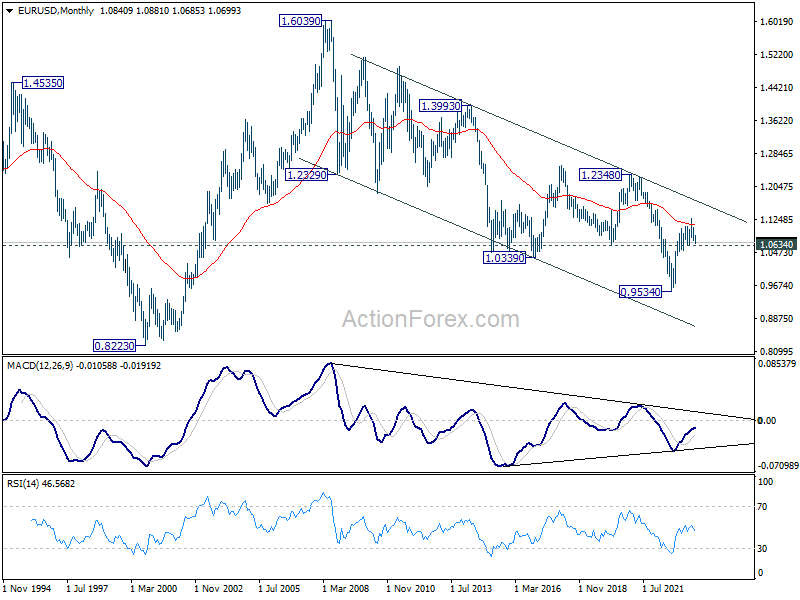
In the long term picture, focus stays on 55 M EMA (now at 1.1124). Rejection by this EMA will revive long term bearishness for resuming the down trend form 1.6039 (2008 high). However, sustained break above there will affirm the case of long term bullish reversal and target 1.2348 resistance for confirmation.