Sample Category Title
Beginning of the End of Fossil Fuel Era
Markets
The first trading day of the week went by without much ado, apart from a lot of corporate supply. In its summer forecast update, the European Commission as expected downwardly revised its 2023 (0.8% from 1.1%) and 2024 (1.3% from 1.6%) growth forecasts as consumption is still held back by the ongoing increase in prices for most goods and services even as the labour market stays strong. The EC slightly reduced the EMU 2023 inflation forecast from 6.7% in the spring update to currently 6.5%. However, a sustained return of inflation to the 2% ECB target isn’t in the cards yet with the 2024 outlook put slightly higher at 3.2% (from 3.1% ). The NY Fed’s August Survey of Consumer Expectations showed 1-yr and 5-yr ahead inflation expectations both increasing by 0.1 percentage point to 3.6% and 3% respectively. Conversely, the 3-yr ahead inflation expectations decreased from 2.9% to 2.8%. Median home price growth expectations rose to the highest since July 2022 (3.1% from 2.8%) while US households continue to expect decent income growth in the year-ahead (2.9% from 2.8%). The mean probability of losing one’s job in the next 12 months rose from 11.8% to 13.8%. Finally, households turned less optimistic about their financial situation (expected income growth, household spending, credit access, outlook). The US Treasury kicked off its mid-month refinancing operation with an average $44bn 3-yr Note auction which was awarded at the highest yield since 2007. The bid cover was average (2.75) with the auction stopping tailing slightly (4.66% vs 4.65% 1 pm bid yield). The Treasury continues today and tomorrow with closely-watched 10-yr Note ($35bn) and 30-yr Bond ($20bn) auctions.
In subdued trading, US yield changes ranged between flat (2-yr) and +3.4 bps (30-yr). German yields added 1.9 bps (2-yr) to 3.7 bps (30-yr). Main European and US stock markets gained around 0.5% with Nasdaq outperforming (+1.15%). EUR/USD moved away from the 1.07 big figure to close near 1.0750 with EUR/GBP ending almost unchanged at 0.8590. We retain comments by hawkish BoE Mann who said that holding rates constant at the current level risks enabling further inflation persistence which will have to be unwound eventually with a worse trade-off (even tighter policy with repercussions for the economy). This morning’s UK labour market data (disappointing & decreasing employment, accelerating wage growth, limited GBP-gains) and German ZEW investor confidence are today’s sole economic releases. Tomorrow’s US CPI and Thursday’s ECB meeting are the main events.
News and views
New Zealand updated its economic and fiscal forecasts going into the October 14 general election. Treasury expects a much larger deficit this fiscal year (ending in June 2024) of NZ$11.4bn compared to the NZ$7.6bn gap predicted in May. It also postponed the return to a surplus by one year, in 2027. The country’s debt ratio is expected to peak at 22.8% in 2025 before falling to 21% two years later. Finance Minister Robertson of the ruling Labour Party said the budget worsening still reflects the costs of the pandemic and cyclone Gabrielle - New Zealand’s costliest nonearthquake natural disaster - earlier this year. A deterioration in global growth, and China in particular, meanwhile weighed down on government’s tax revenues and will continue to do so for some time. Economic growth has nevertheless been revised upwards to 1.3% by mid-2024. Unlike the country’s central bank, Treasury believes another recession can be avoided (q/q GDP growth was negative in Q4 2022 and Q1 2023). Inflation is expected to fall below 3% and thus re-enter the central bank’s 1-3% target by the end of next year. The Labour Party and the main opposition National Party are parting ways in recent polling to the disadvantage of the former.
The International Energy Agency for the first time said global demand for oil, natural gas and coal will peak before 2030, dubbing it “the beginning of the end” of the fossil fuel era. The updated forecast brings the peak date forward because of the accelerated rollout of renewable technologies and the spread of electric vehicles in the past year. Increased responsiveness to climate change as well as the energy crisis following the Russian invasion sparked green investments. IEA head Birol said that to limit global warming to 1.5°C, emissions needed to fall rapidly after a peak in the mid-2020s. Birol also noted structural shifts are going on in China as its economy is moving from heavy, oilconsuming industry to less energy-intensive sectors and services. According to the IEA chief, China in the last 10 years accounted for a third of the growth in global natural gas demand and two-thirds of the growth in oil.
CHF/JPY Technical: Bullish Exhaustion Sighted Below Key Resistance of 166.60
- The recent four months of bullish acceleration may have reached a major climax condition at 166.60 resistance.
- The short-term minor trend of CHF/JPY has turned bearish as it traded below the prior upward-sloping 20-day moving average.
- Watch the key short-term resistance at 165.60 on CHF/JPY.
After recording an accumulated gain of +2,378 pips since January 2023, the cross pair CHF/JPY seems to have lost its bullish mojo as it failed to make any headway above the 166.60 key major resistance and broke below its medium-term support at 164.50 (defined by the lower boundary of an ascending channel from 20 March 2023 low) yesterday, 11 September.
A major bullish climax may have been reached
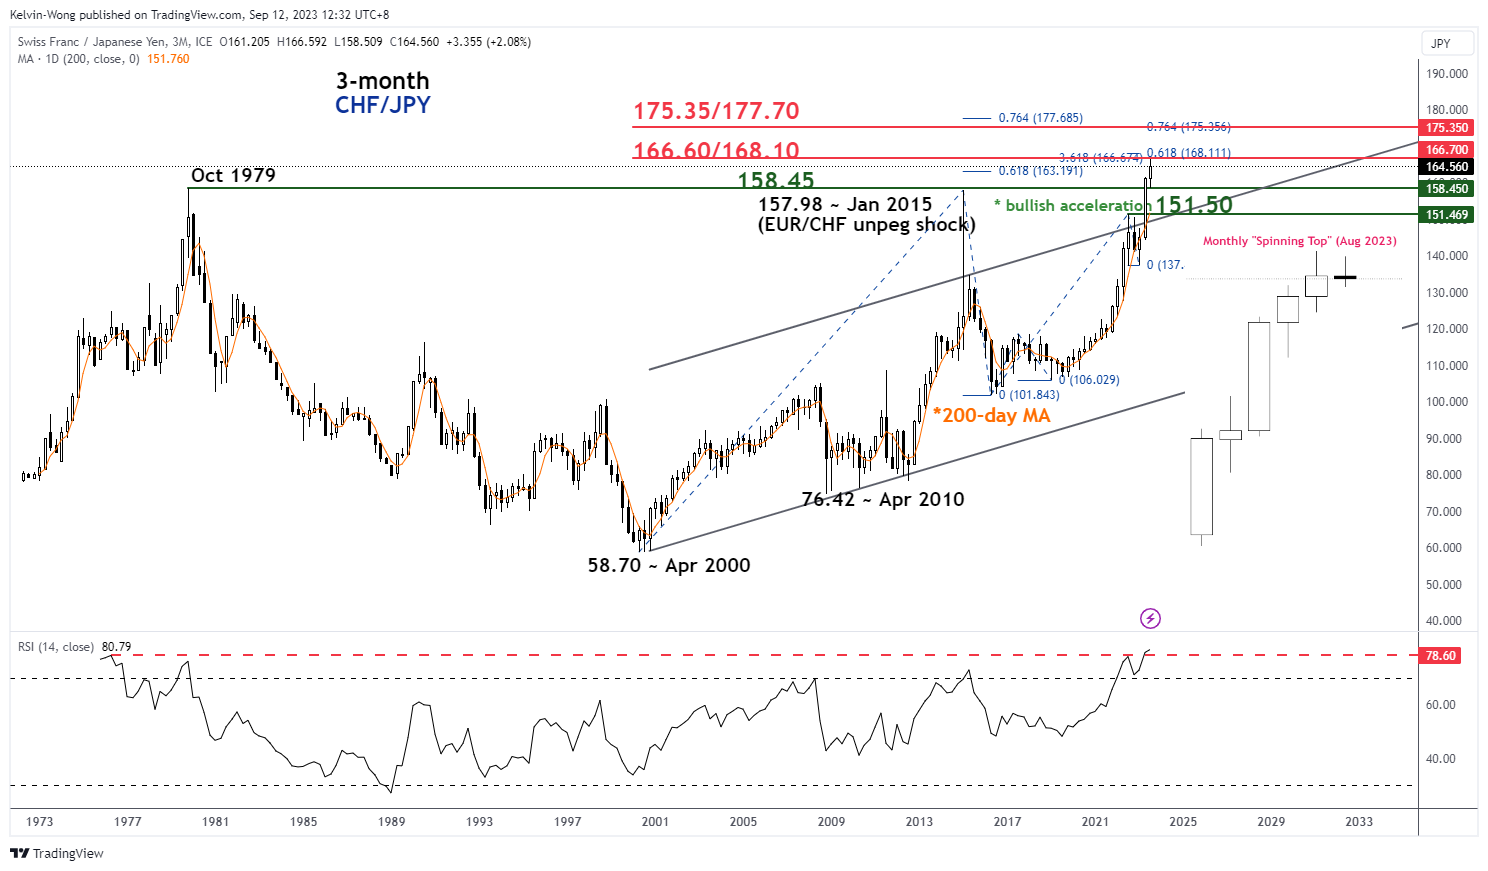
Fig 1: CHF/JPY long-term term secular trend as of 12 Sep 2023 (Source: TradingView, click to enlarge chart)
The recent bullish acceleration move in the past four months may have reached a climax where price actions at the end of August 2023 formed a monthly bearish “Spinning Top” candlestick pattern coupled with the 3-month RSI oscillator hitting an extreme all-time high overbought level of 80.79 at this time of the writing based on data available since April 1972.
Short-term momentum has turned bearish
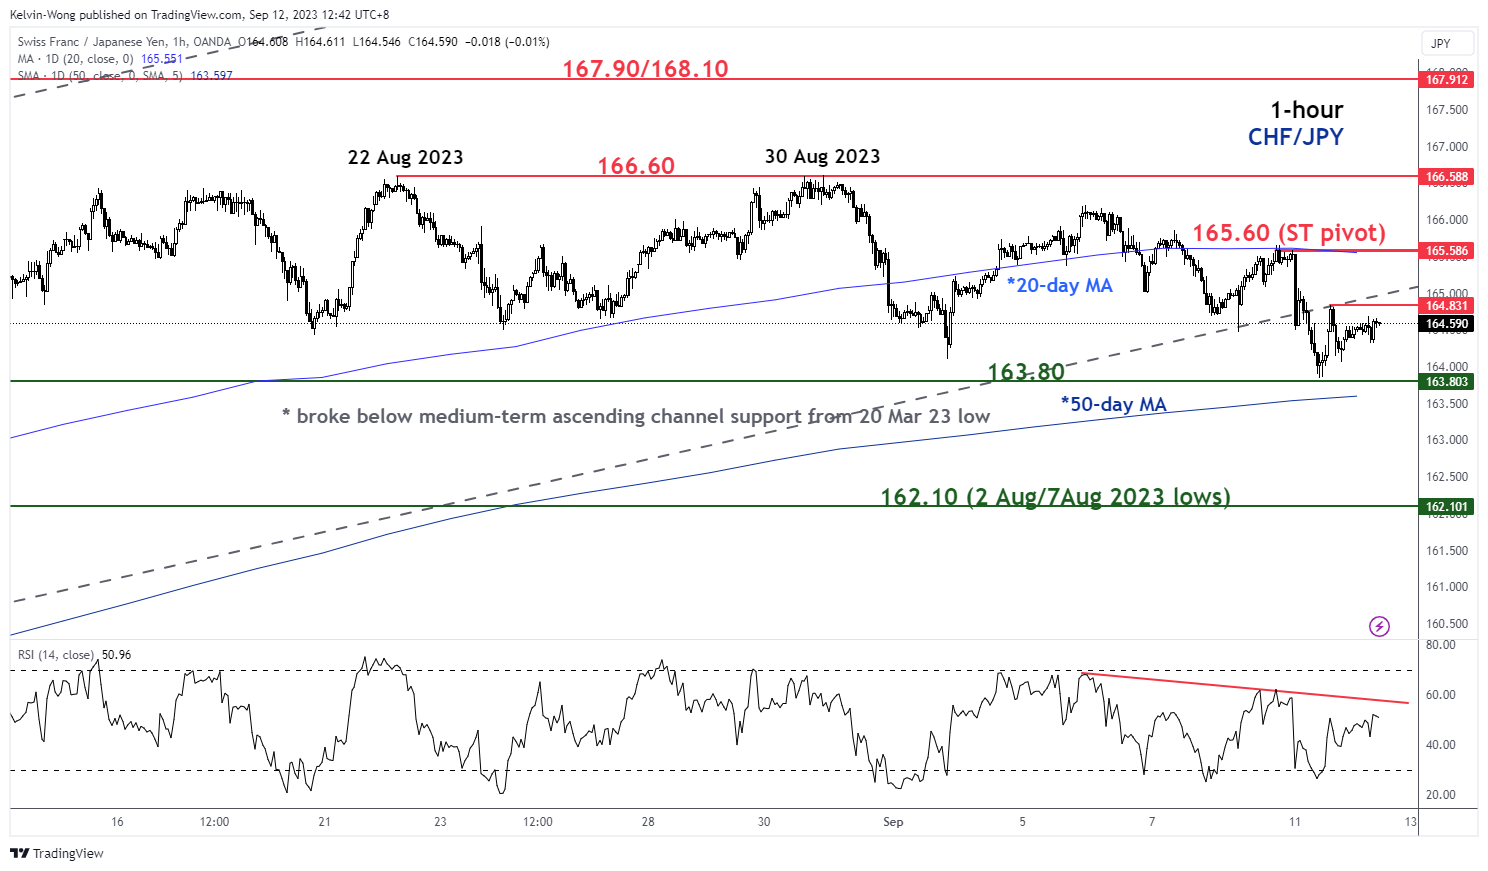
Since 7 September 2022, the CHF/JPY has pierced below its 20-day moving average and started to form a series of “lower highs” and “lower lows”.
In conjunction with the 1-hour RSI oscillator that has also traced out similar “lower highs” below a parallel descending resistance at the 57-level which suggests short-term bearish momentum of price actions remains intact.
Watch the 165.60 key short-term pivotal resistance (also the 20-day moving average) and a break below the intermediate support at 163.80 (former minor range resistance of 21 July to 8 August 2023 & the 50-day moving average) may trigger a further impulsive slide to see the next support coming in at 162.10 in the first step.
However, a clearance above 165.60 negates the bearish tone for a push-up to retest the 166.60 key major resistance.
Tesla Fuels Market Rally
Tesla jumped 10% yesterday and reversed morose mood due to the Apple-led selloff. Tesla shares flirted with the $275 per share on Monday, thanks to Morgan Stanley analysts who said that its Dojo supercomputer may add as much as $500bn to its market value, as it would mean a faster adoption of robotaxis and network services. As a result, MS raised its price target from $250 to $400 a share.
Tesla rally helped the S&P500 make a return above its 50-DMA, as Nasdaq 100 jumped more than 1%. Apple recorded a second day of steady trading after shedding almost $200bn in market value last week because of Chinese bans on its devices in government offices, and Qualcomm, which was impacted by the waves of the same quake, recovered nearly 4%, after Apple announced an extension to its chip deal with the company for 3 more years. Making chips in house to power Apple devices would take longer than thought.
Speaking of chips and their makers, ARM which prepares to announce its IPO price tomorrow, has been oversubscribed by 10 times already and bankers will stop taking orders by today. The promising demand could also encourage an upward revision to the IPO price, and we could eventually see the kind of market debut that we like!
Today, at 10am local time, Apple will show off its new products to reverse the Chinese-muddied headlines to its favour before the crucial holiday selling season. The Chinese ban of Apple devices in government offices sounds more terrible than it really is, as the real impact on sales will likely remain limited at around 1%.
In the bonds market, the US 2-year yield is steady around the 5% mark before tomorrow’s much-expected US inflation data. The major fear is a stronger-than-expected uptick in headline inflation, or lower-than-expected easing in core inflation. The Federal Reserve (Fed) is torn between further tightening or wait-and-see as focus shifts to melting US savings, which fell significantly faster than the rest of the DM, and which could explain the resilience in US spending and growth, but which also warns that the US consumers are now running out of money, and they will have to stop spending. So, are we finally going to have that Wile E. Coyote moment? Janet Yellen doesn’t think so, she is on the contrary confident that the US will manage a soft landing, that the Fed will break inflation’s back without pushing economy into recession. Wishful thinking?
But everyone comes to agree on the fact that the Eurozone is not looking good. The EU Commission itself cut the outlook for the euro-area economy. It now expects GDP to rise only 0.8% this year, and not 1.1% as it forecasted earlier, as Germany will probably contract 0.4% this year. The slowing euro-area economy has already softened the European Central Bank (ECB) doves’ hands over the past weeks. Consequently, the EURUSD gained marginally yesterday despite the fresh EU commission outlook cut and should continue gently drifting higher into Thursday’s ECB meeting. There is no clarity regarding what the ECB will decide this week. The economy is slowing but inflation will unlikely to continue its journey south, giving the ECB a reason to opt for a ‘hawkish’ pause or a ‘normal’ 25bp hike.
Waiting Mode Ahead of US CPI and ECB Meeting
Market movers today
Markets remain in waiting mode ahead of the ECB meeting and US CPI data later this week. Today, the German ZEW index will provide early hints about how the largest European economy has developed in September, consensus is looking for weakening sentiment following a downbeat reading in the Sentix indicator last week.
In the US, NFIB Small Business Optimism index will be released. While companies reported slightly more positive outlooks over summer, consensus is looking for a modest setback in August.
The 60 second overview
Markets. In the US stock markets saw an upturn, driven by Tesla's substantial gains and a broader rally in large-cap tech stocks. The S&P500 increased by 0.7%, while the Nasdaq Composite, focusing on technology stocks, gained 1.1%. Tesla's stock surged by 10.4% following optimism from Morgan Stanley analysts who suggested that the company's supercomputer Dojo could significantly enhance its value by opening new markets. In Europe, natural gas futures surged by 5.5% due to ongoing strikes at a liquefied natural gas production site in Australia, posing a threat to global supplies. Amidst these developments, Europe's Stoxx 600 index registered a 0.3% gain, primarily driven by positive sentiment from Asia. Elsewhere, the USD fell by the most in two months as both China and Japan took steps to bolster their currencies, while Brent crude oil reached 2023 highs around USD 91 per barrel. This morning, Asian markets are mixed. Futures point to a positive open in Europe.
The US House of Representatives returns from summer break today and will have a busy schedule for the coming weeks, as Congress needs to pass a new funding bill by 30 September to avoid a government shutdown. A shutdown, while not as serious as a default, could still lead to federal workers missing salaries and there may be disruptions to public services. Over summer, Democratic Senate Majority Leader Schumer and Republican House Speaker McCarthy struck a preliminary deal on a short-term funding measure known as 'continuing resolution' aimed at buying time for more thorough budget negotiations later on. But the measure still needs to pass through the House, and McCarthy is once again facing opposition from hardliner Republicans, who demand new spending cuts as well as progress on an attempt to impeach President Biden in return for support. House Democrats and moderate Republicans do have the combined votes to pass the bill without the hardliners, so for now we think a shutdown remains unlikely. But Republicans could still attempt to push for some spending cuts such as delaying new support measures for Ukraine. As usual, the negotiations often tend to go down to the wire, but they should have limited impact on financial markets.
Equities: Global equities were higher yesterday, driven by cyclical growth stocks while energy was the only sector that was lower. Tesla - the second biggest consumer discretionary company in the world - was upgraded at Morgan Stanley and drove a substantial outperformance of the sector yesterday. In US Dow +0.3%, S&P500 +0.7%, Nasdaq +1.1% and Russell 2000 +0.2%. The positive tone from Wall Street has carried over to Asia this morning with most markets being higher. Japanese stocks are leading the way higher and bond vol has come down just one day after the hawkish tone from Ueda. European futures are in green this morning while US futures are in red.
FI: There was a modest rise in European government bond yields across the curve, which was driven partly by the negative sentiment in the Japanese government bond market, where yields rose on the back of comments from Bank of Japan hinting towards the end of negative policy rate. Furthermore, the issuance in the primary market continues with plenty of syndicated deals.
FX: EUR/USD is trading in around the 1.0750 mark as the USD weakened across the board in yesterday's session. In contrast, the JPY strengthened the most in the G10 space on the back of hawkish BoJ comments, sending USD/JPY down to around 146.5. EUR/GBP is still just short of the 0.86 mark. EUR/SEK remains around 11.90, while EUR/NOK is hovering around 11.45.
Credit: Mirroring the overall positive tone yesterday, the credit markets continued to see tightening in CDS indices. iTraxx Main closed the day 0.9bp lower at 70.21p, while iTraxx Xover was 4.2bp lower at 395bp. The primary market appears to be frontloaded ahead of this week's US CPI report for August and ECB's rate decision. The constructive tone continued with several corporates and financials announcing debt offerings.
Nordic macro
In Norway, we expect mainland GDP dropped 0.1 % m/m in July after zero growth in Q2. If so, the figure will confirm that growth is slowing down in line with expectations and support our view that the September hike will be the last in this cycle.
Technical Outlook and Review
DXY:
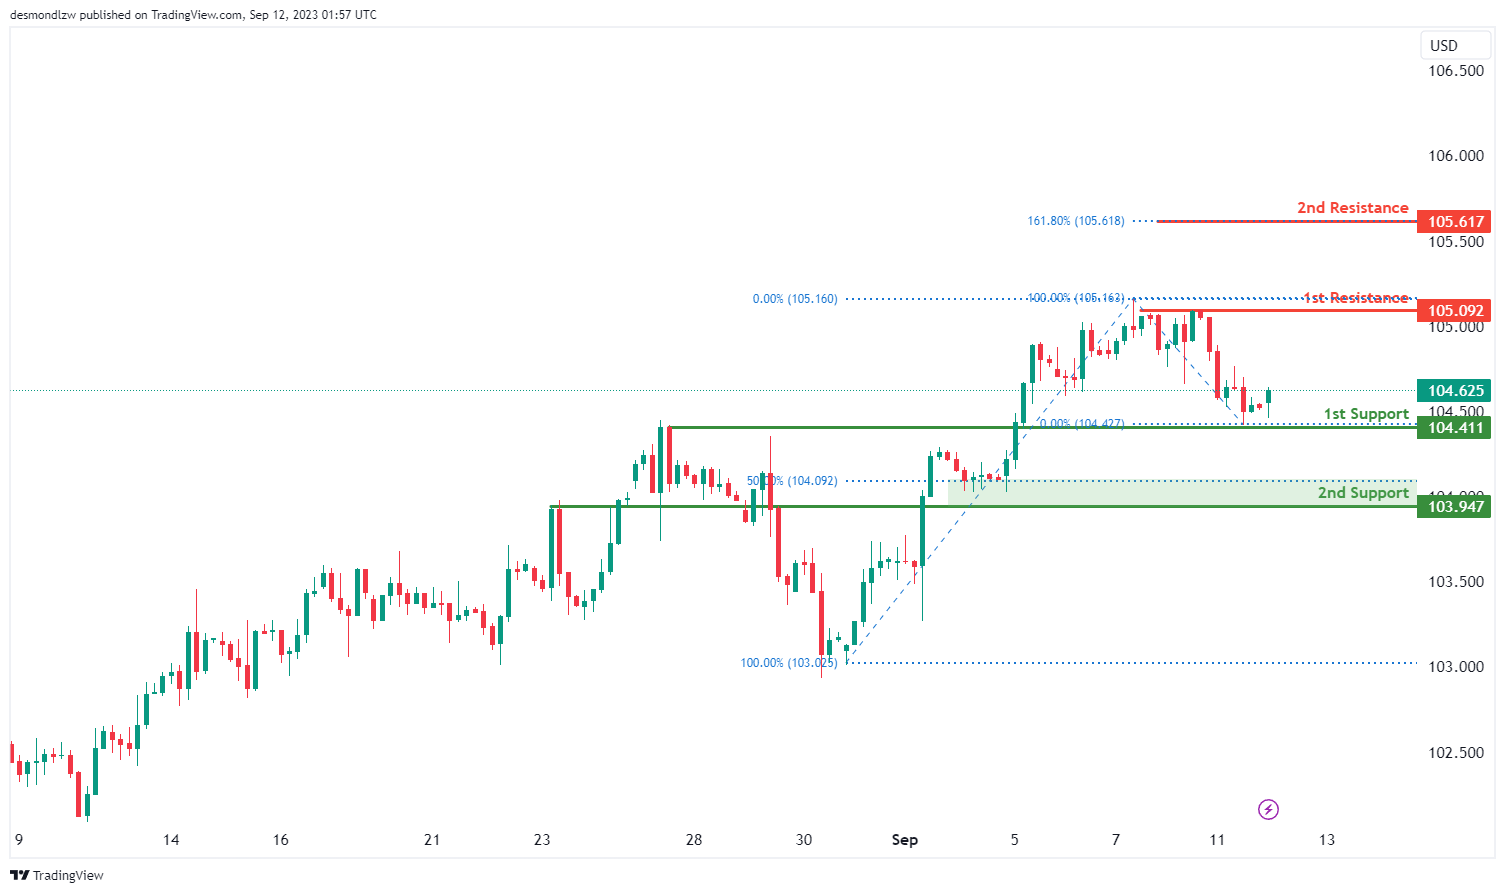
The current analysis of the DXY (US Dollar Index) chart indicates a prevailing bullish momentum. There is a prospect of a bullish rebound anticipated at the 1st support level at 104.41, which is characterized as an overlap support. Furthermore, the 2nd support level at 103.94 corresponds to an overlap support and conveniently aligns with the 50% Fibonacci Retracement level.
Conversely, on the resistance front, the 1st resistance at 105.09 signifies multi-swing high resistance, while the 2nd resistance at 105.61 is associated with the 161.80% Fibonacci Retracement. These levels are of particular interest as they are indicative of potential inflection points in the price movement.
EUR/USD:
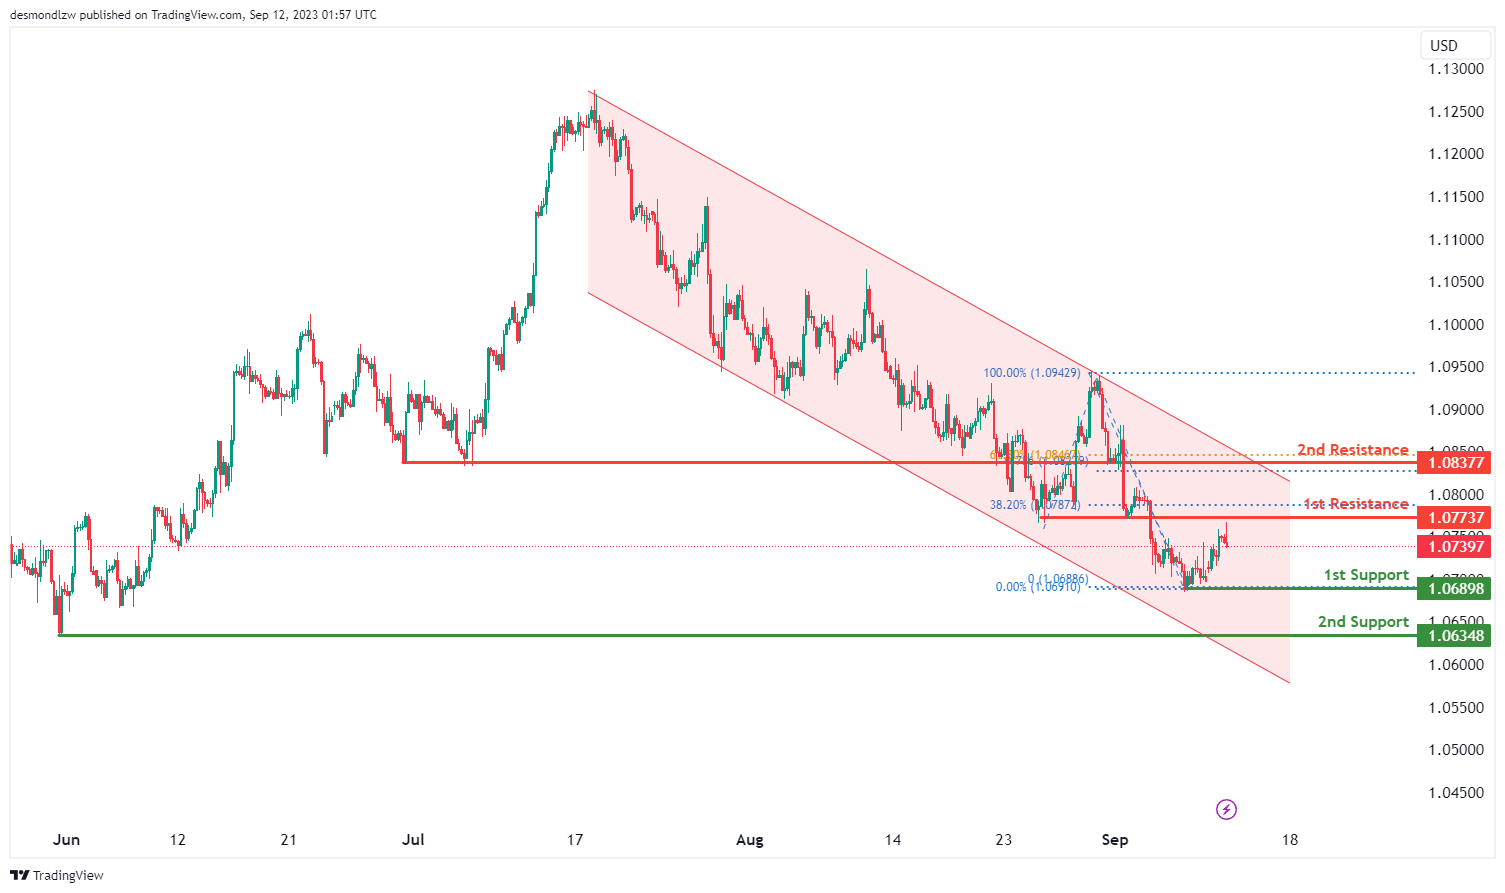
The EUR/USD chart currently demonstrates a bearish overall momentum, primarily attributed to its confinement within a bearish descending channel.
There’s a possibility of a bearish continuation in the near term, potentially leading the price to the 1st support level at 1.0689. This support level holds significance as it aligns with a swing low support. Additionally, the 2nd support at 1.0634, also corresponding to a swing low support, reinforces its potential role as a support zone.
On the resistance side, the 1st resistance at 1.0773 is noteworthy as it serves as overlap resistance and aligns with the 38.20% Fibonacci Retracement level. Furthermore, the 2nd resistance level at 1.0837 is significant as it represents overlap resistance and aligns with the 61.80% Fibonacci Retracement.
EUR/JPY:
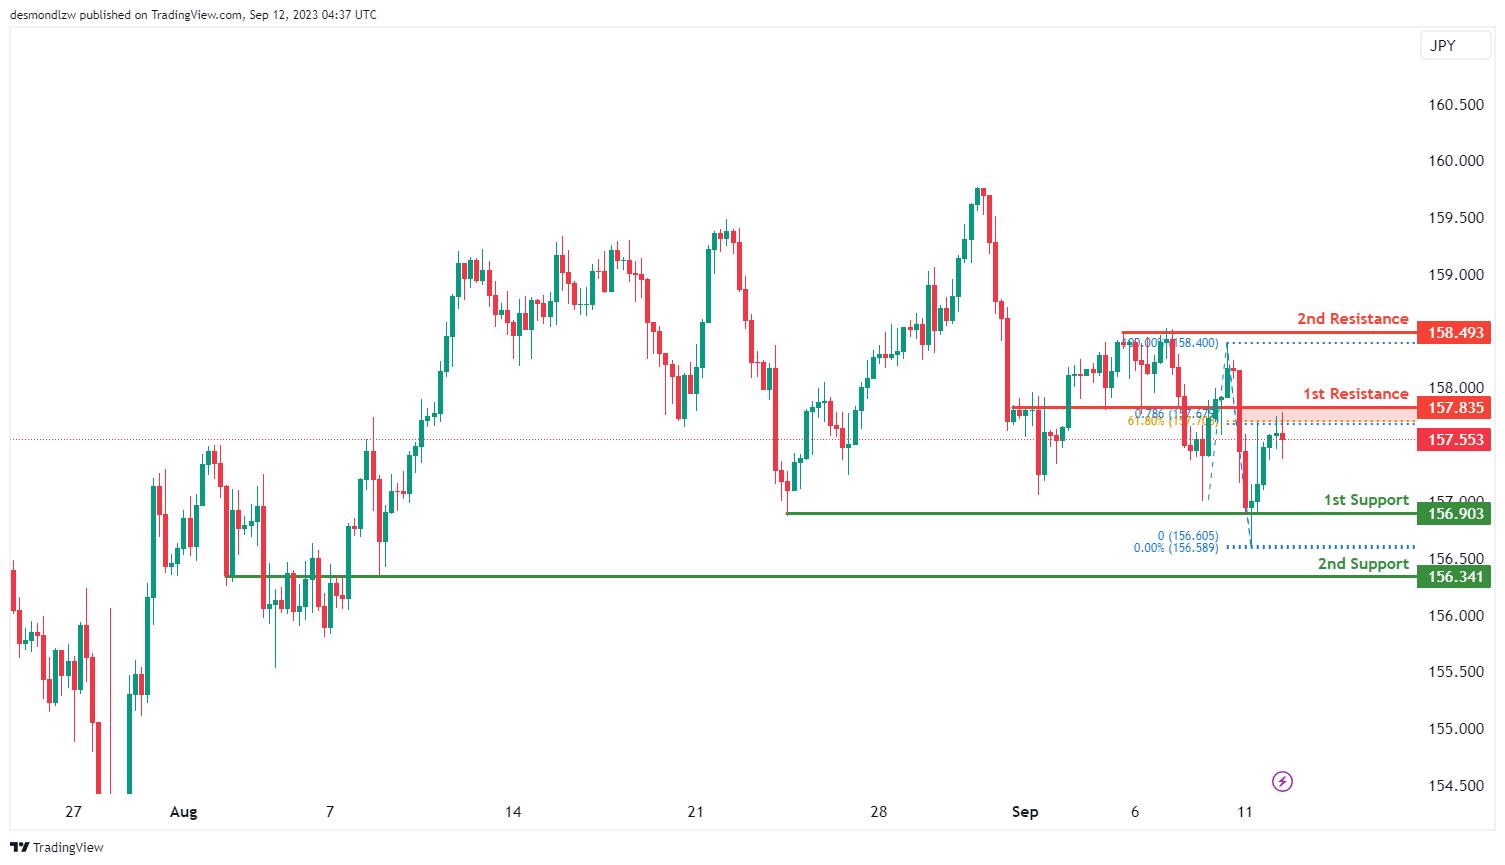
For EUR/JPY, the overall momentum of the chart is currently bearish, indicating a downward trend.
There is potential for the price to continue its bearish movement towards the 1st support level at 156.90. This 1st support level is considered significant because it represents multi-swing low support, suggesting potential stability at this level.
In case of a further decline, the 2nd support level at 156.34 is also noteworthy as it acts as an overlap support, potentially providing additional reinforcement for the price.
On the upper side, if there’s a reversal in the price, it may face resistance at the 1st resistance level of 157.83. This 1st resistance is considered important due to its characteristics as a swing high resistance, supported by both the 78.60% Fibonacci Projection and the 61.80% Fibonacci Retracement, indicating a Fibonacci confluence and potential resistance to upward movement.
Further upward movement may encounter resistance at the 2nd resistance level of 158.49, characterized as multi-swing high resistance, which could pose a significant barrier to the bullish momentum.
EUR/GBP:
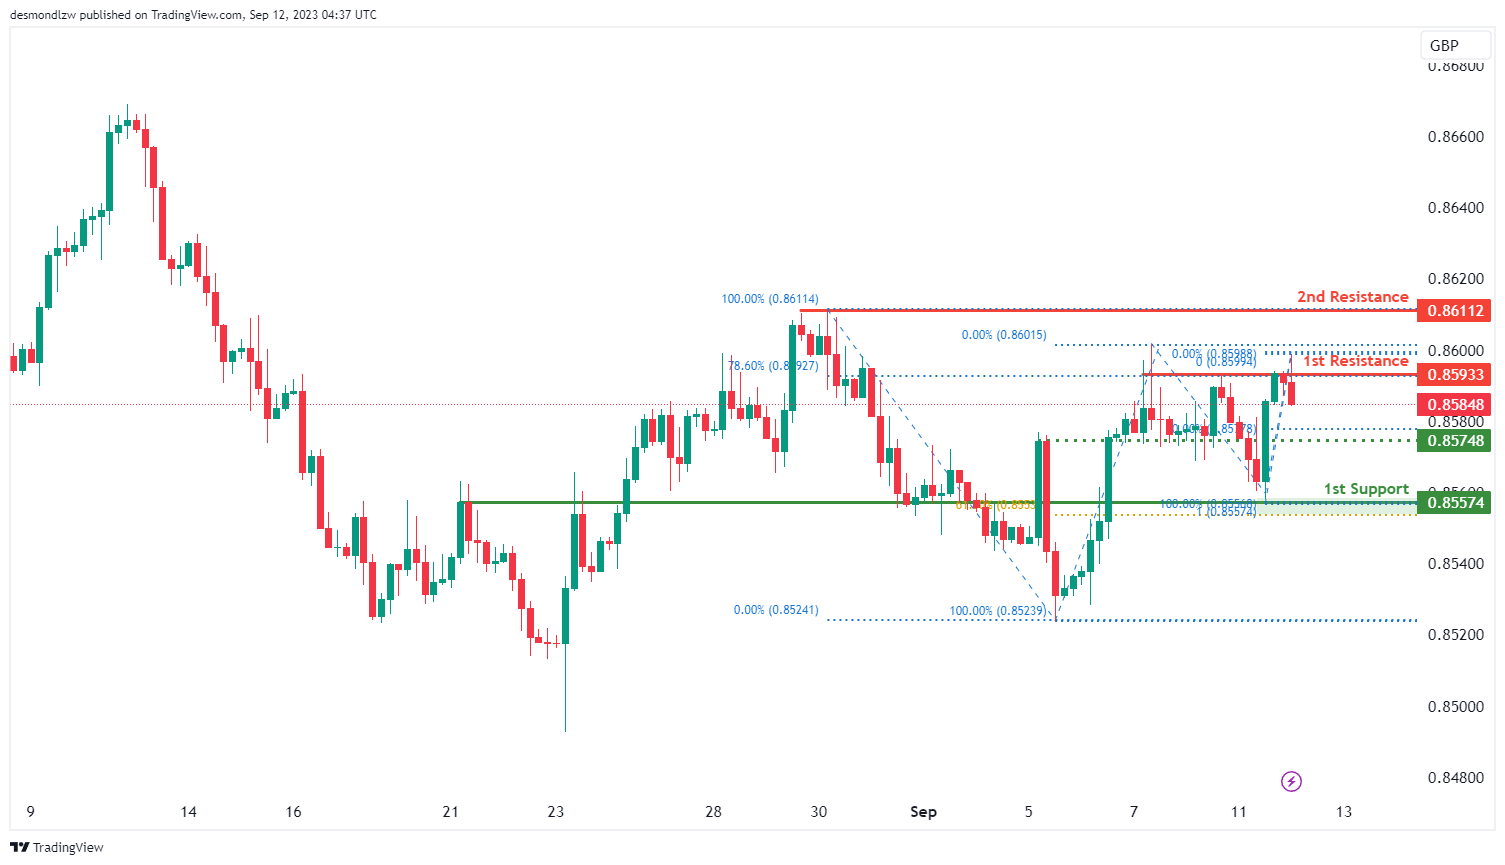
For EUR/GBP, the overall momentum of the chart is currently bearish, indicating a downward trend.
There is potential for the price to continue its bearish movement towards the 1st support level at 0.8557. This 1st support level is considered significant because it represents an overlap support and aligns with both the 100% Fibonacci Projection and the 61.80% Fibonacci Retracement, indicating strong potential support due to Fibonacci confluence.
On the upper side, if there’s a reversal in the price, it may face resistance at the 1st resistance level of 0.8593. This 1st resistance is considered important because it represents multi-swing high resistance and is supported by the 78.60% Fibonacci Retracement.
Further upward movement could encounter resistance at the 2nd resistance level of 0.8611, characterized as swing high resistance, which may act as a barrier to the bullish momentum within the observed range.
Additionally, there is an intermediate support level at 0.8574, identified as pullback support and aligning with the 50% Fibonacci Retracement. This level may temporarily slow down the bearish momentum within the observed range.
GBP/USD:
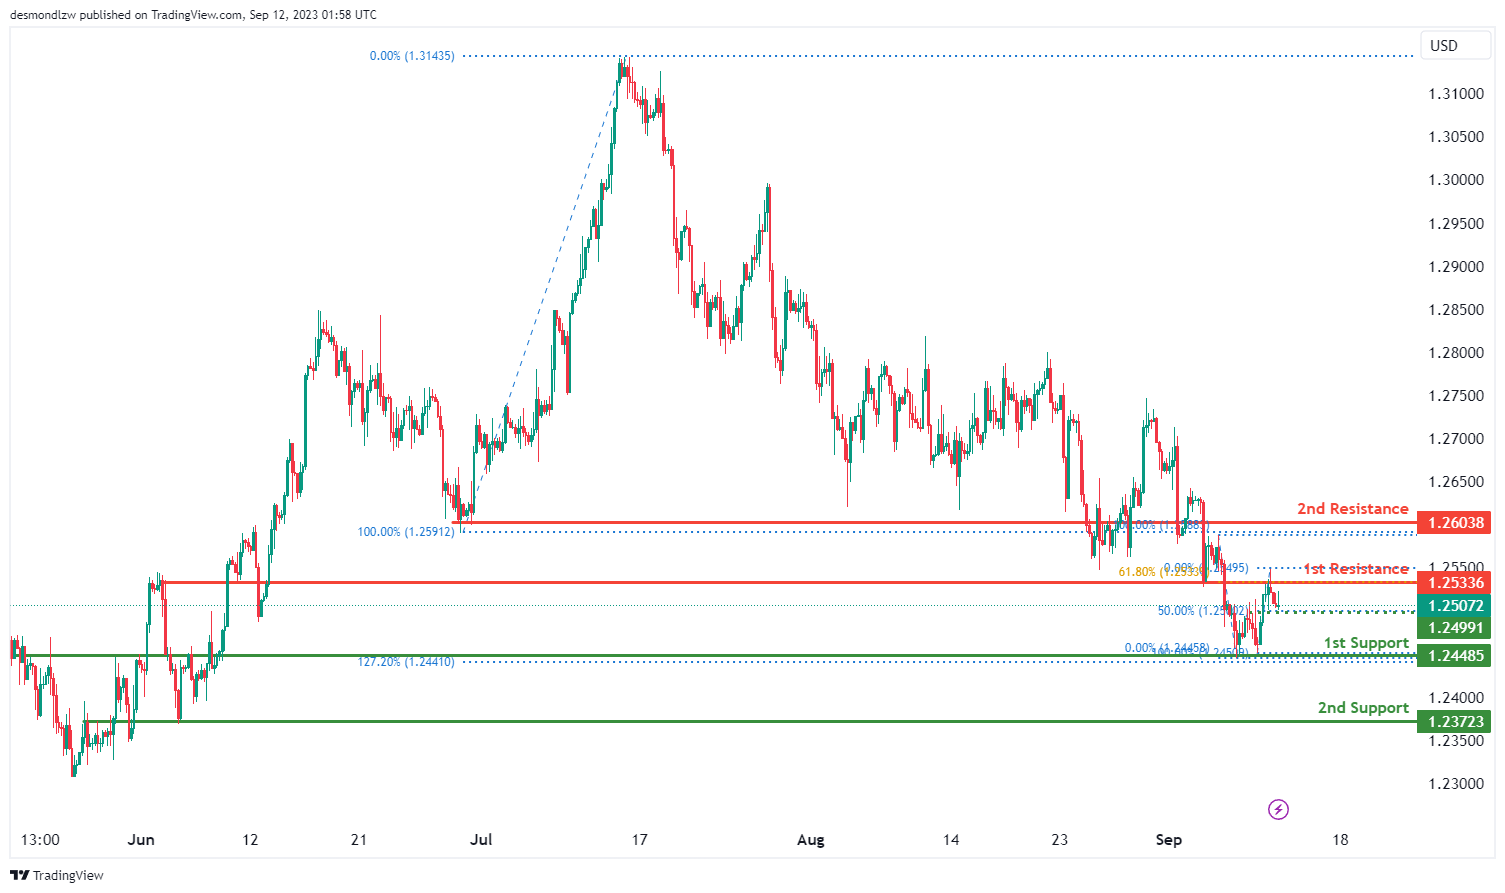
The GBP/USD chart currently indicates a bearish overall momentum, suggesting a potential continuation of the bearish trend.
There’s a likelihood of a bearish continuation in the near term, potentially taking the price towards the 1st support level at 1.2448. This support level is significant as it aligns with an overlap support and the 127.20% Fibonacci Expansion.
Additionally, there’s another 1st support at 1.2372, marked as an overlap support, further reinforcing its potential as a support zone.
On the resistance side, the 1st resistance at 1.2533 is identified as an overlap resistance and aligns with the 61.80% Fibonacci Retracement level.
Furthermore, the 2nd resistance level at 1.2603 is marked as an overlap resistance. These resistance levels may act as barriers to any bullish movements.
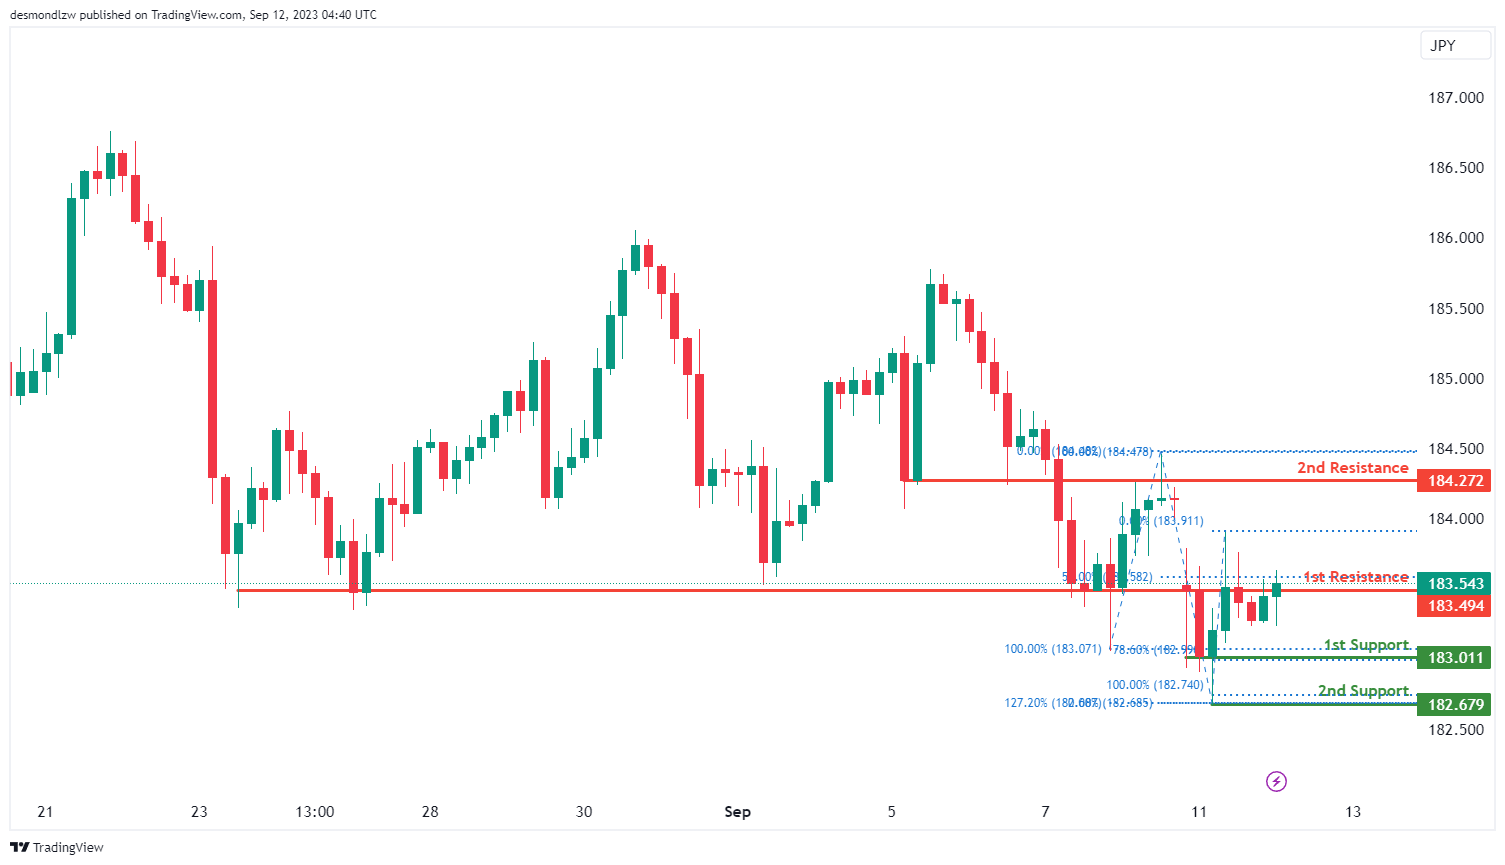
GBP/JPY:
For GBP/JPY, the overall momentum of the chart is currently bearish, indicating a downward trend.
There is potential for the price to have a bearish reaction off the 1st resistance level at 183.49 and drop to the 1st support at 183.01.
The 1st support at 183.01 is considered significant because it represents a swing low support and aligns with the 78.60% Fibonacci Retracement level, indicating potential stability and support at this level.
In case of a more substantial decline, the 2nd support level at 182.67 is also noteworthy as it represents a swing low support and aligns with the 127.20% Fibonacci Extension, potentially providing additional support for the price.
On the upper side, the 1st resistance at 183.49 is considered important due to its characteristics as an overlap resistance and its alignment with the 50% Fibonacci Retracement level.
Further upward movement may encounter resistance at the 2nd resistance level of 184.27, characterized as an overlap resistance, which could pose a barrier to the bullish momentum within the observed range.
USD/CHF:
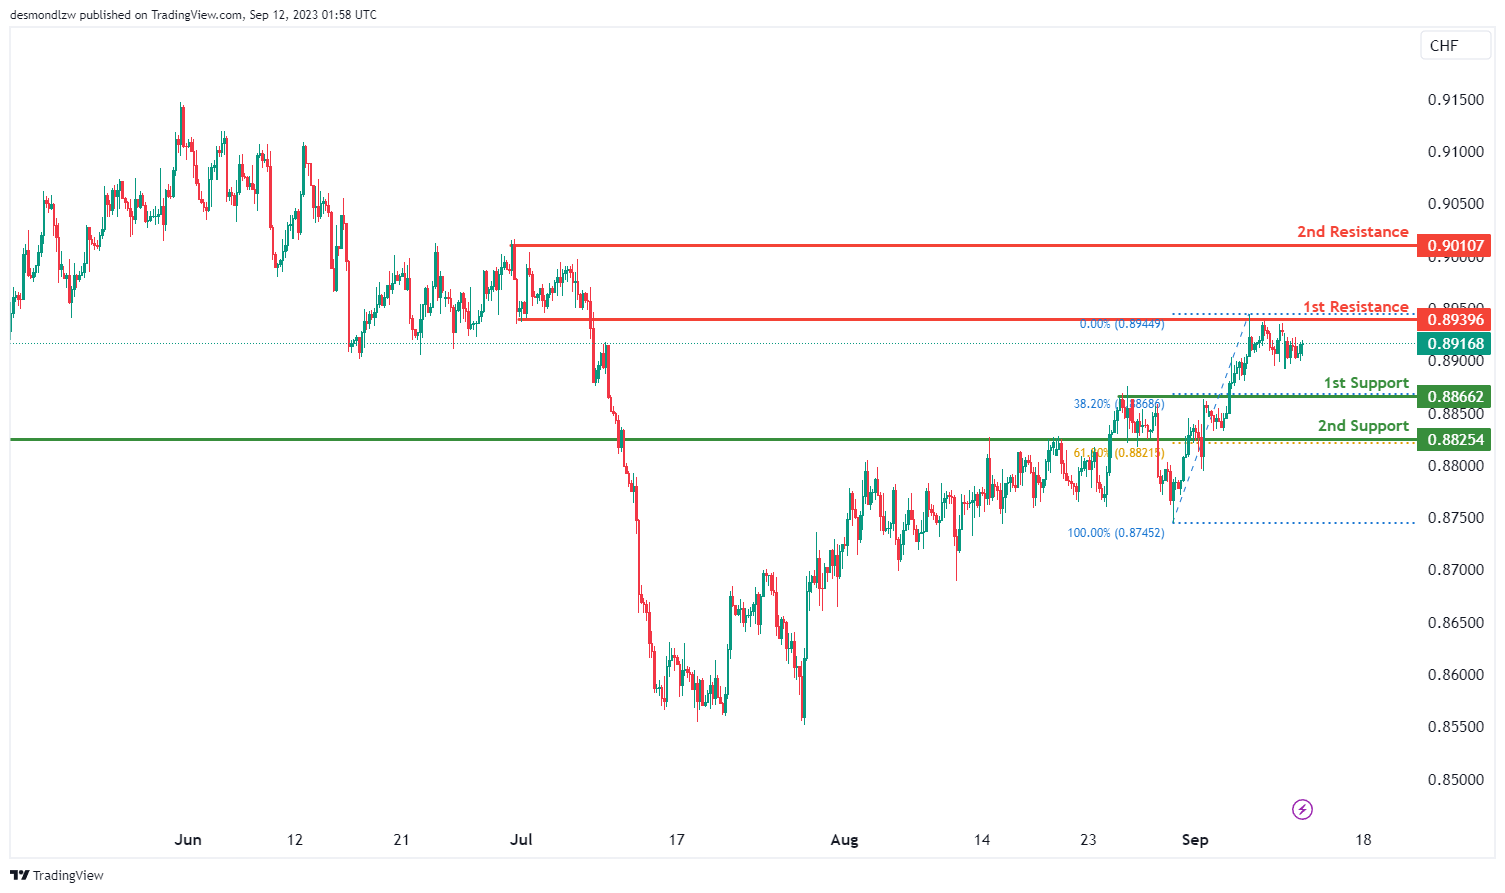
The USD/CHF chart currently reflects a neutral overall momentum, suggesting a lack of a clear directional trend.
Price is expected to potentially oscillate within a range defined by the 1st support at 0.8866 and the 1st resistance at 0.8939.
The 1st support level at 0.8866 is considered a suitable level for potential price rebounds, characterized as a pullback support. Similarly, the 2nd support at 0.8825 serves as another pullback support.
Conversely, the 1st resistance at 0.8939 is identified as an overlap resistance, while the 2nd resistance at 0.9010 represents a swing high resistance. These levels may act as barriers to any significant bullish movements.
USD/JPY:
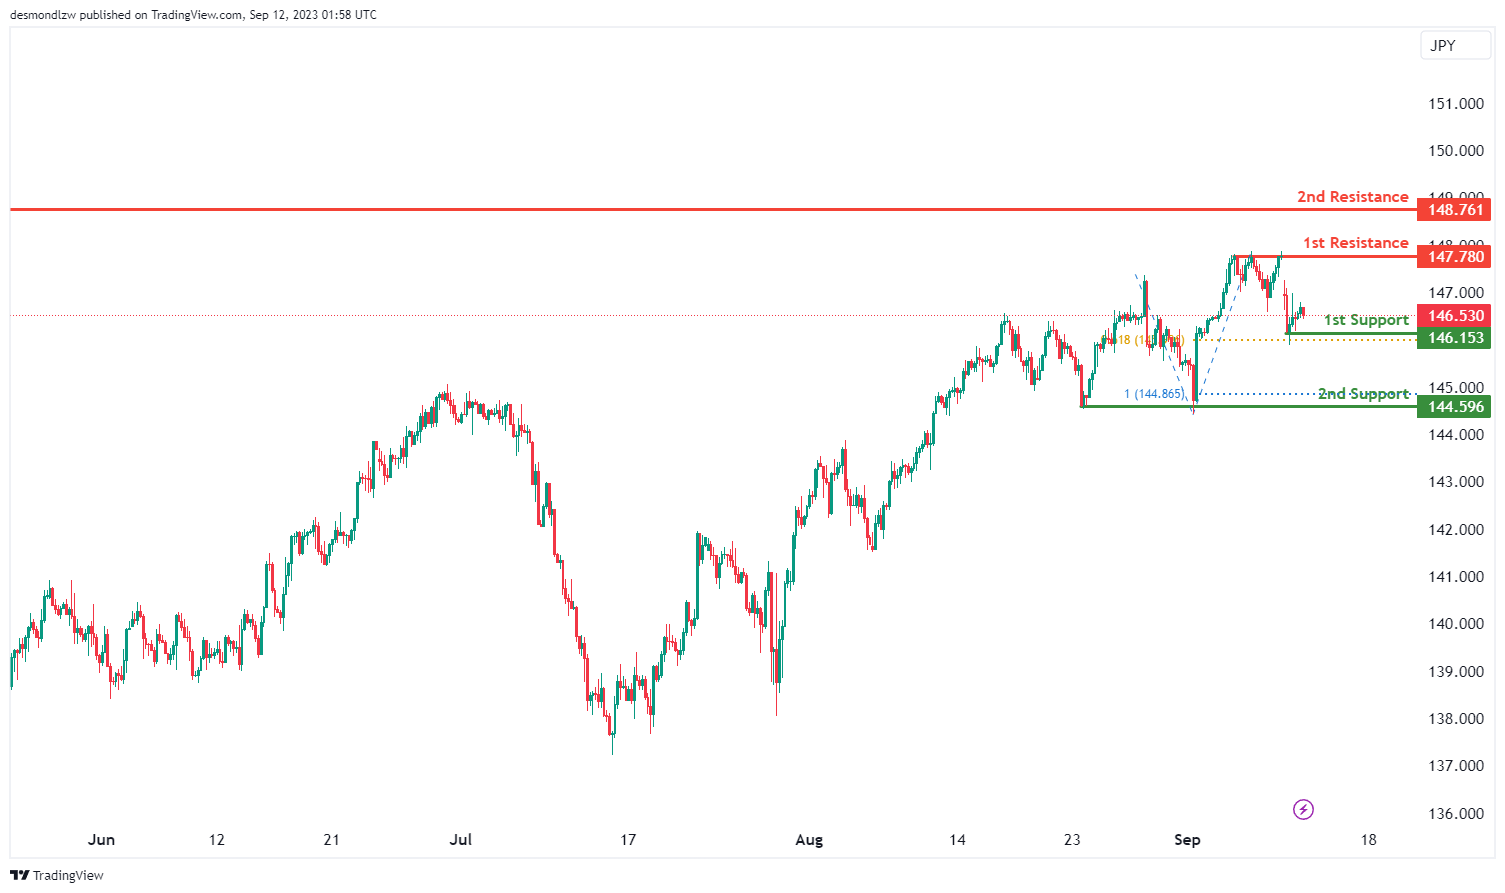
The USD/JPY chart currently indicates a bearish overall momentum, suggesting a potential downward trend in price movement.
In the short term, there’s a possibility of a price rise towards the 1st resistance level at 147.78 before potentially reversing and moving lower towards the 1st support.
The 1st support level at 146.15 is identified as a significant level for potential price rebounds, characterized as a swing low support and aligning with the 61.80% Fibonacci Projection.
Additionally, the 2nd support at 144.59 is considered another critical support level, marked as a multi-swing low support and aligning with the 100% Fibonacci Projection.
On the resistance side, the 1st resistance at 147.78 represents a multi-swing high resistance, while the 2nd resistance at 148.76 is characterized as a swing high resistance. These levels may act as barriers to any substantial bullish movements.
USD/CAD:
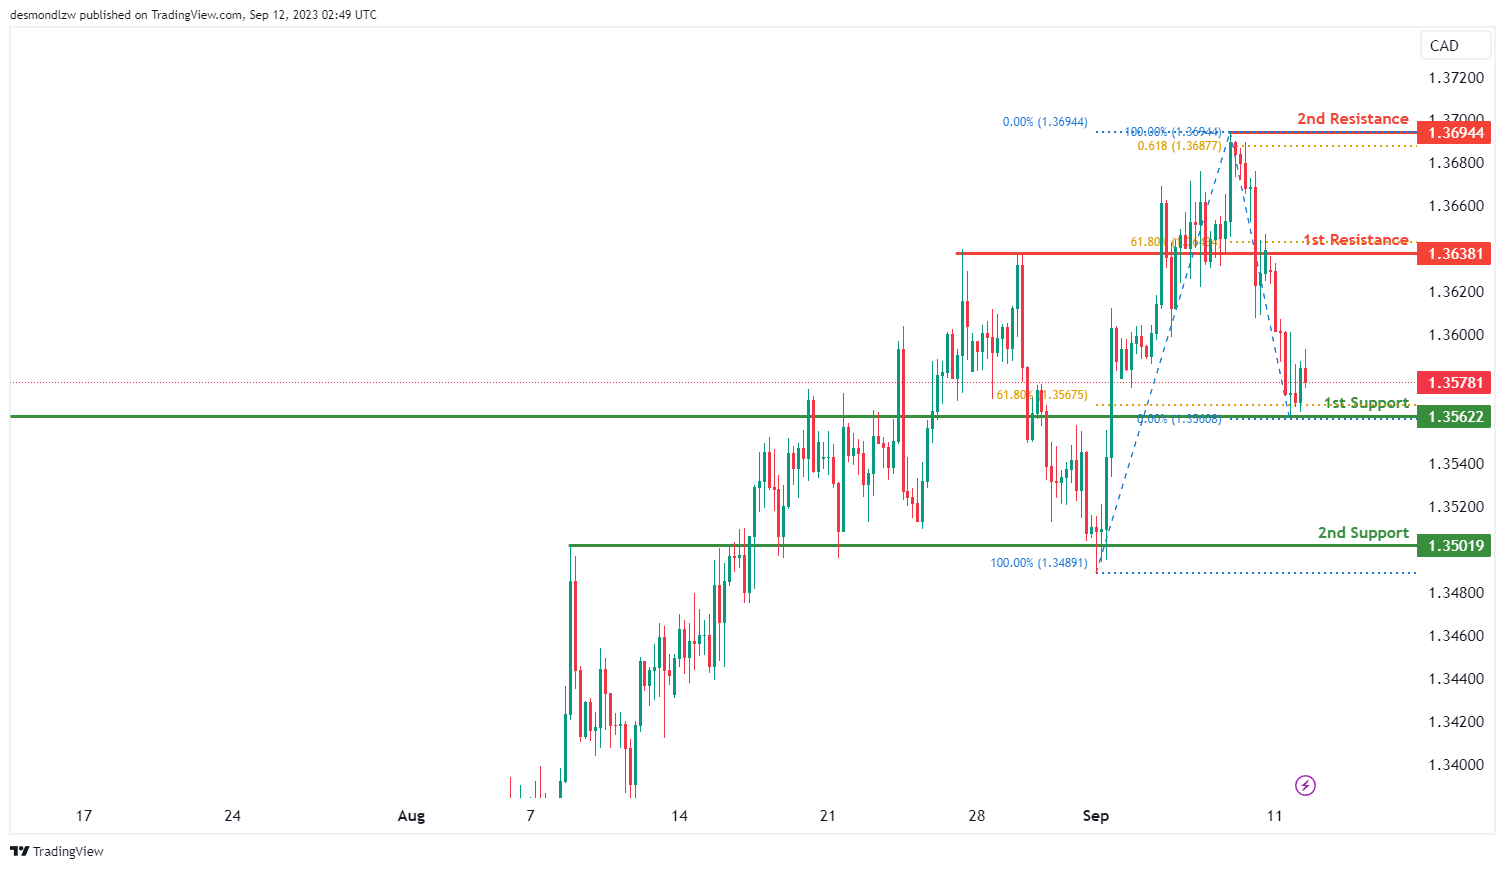
The USD/CAD chart currently displays an overall bearish momentum, indicating a potential continuation of the bearish trend towards the 1st support level.
The 1st support level at 1.3562 is identified as an overlap support that aligns with the 61.80% Fibonacci retracement level. Additionally, the 2nd support level at 1.3502 is also marked as an overlap support, reinforcing its potential as a support zone.
To the upside, the 1st resistance level at 1.3638 is identified as an overlap resistance that aligns with the 61.80% Fibonacci retracement level. Furthermore, the 2nd resistance level at 1.3694 is identified as a swing-high resistance that aligns with the 61.80% Fibonacci projection level.
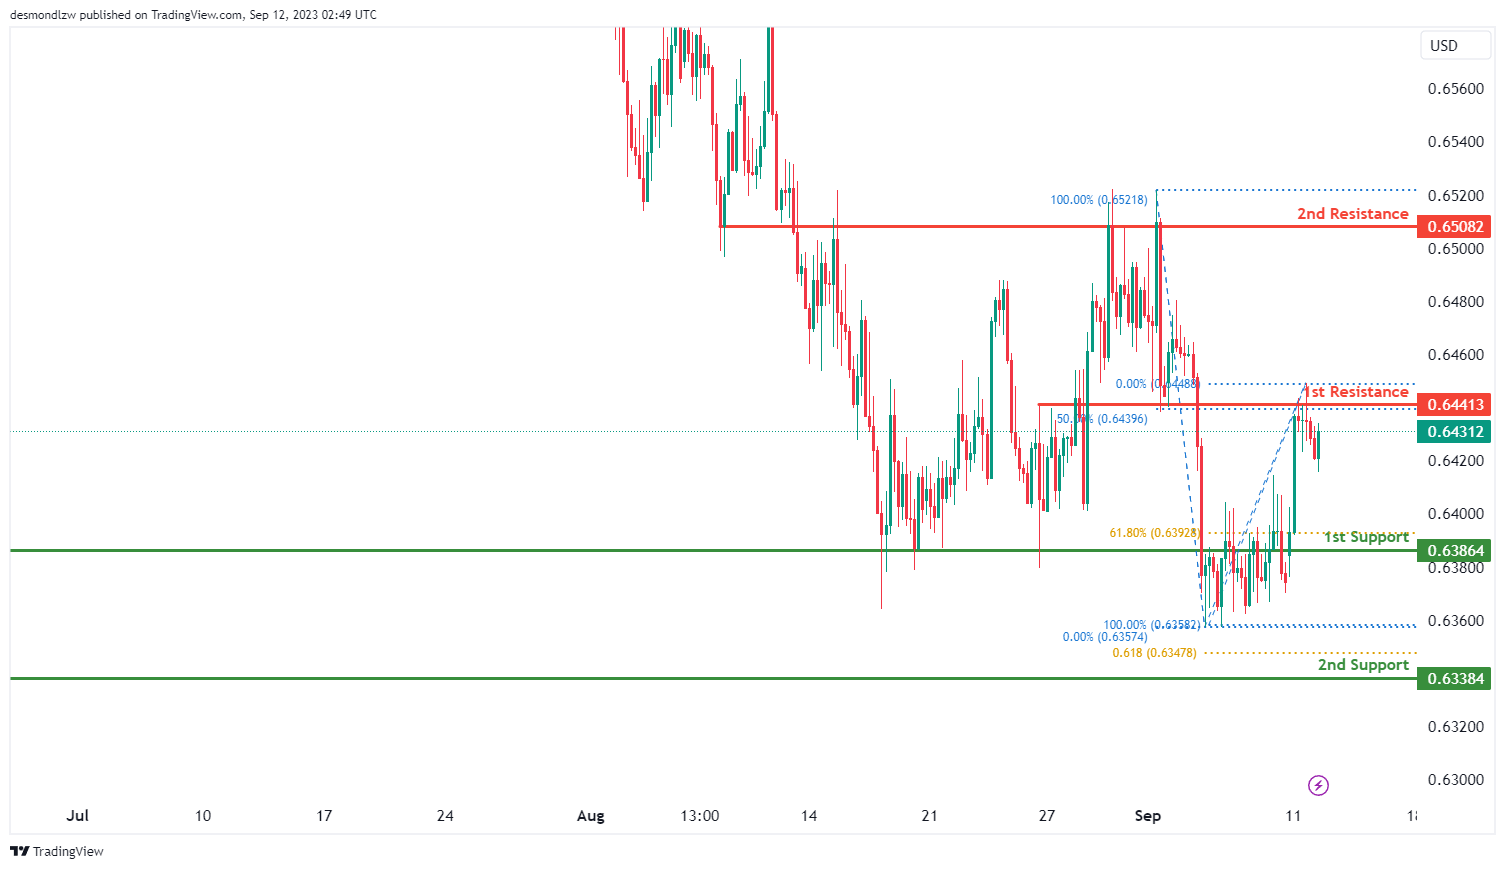
AUD/USD:
The AUD/USD chart currently exhibits an overall bullish momentum, suggesting a potential upward trend in price movement. There is a possibility of a bullish continuation towards the 1st resistance level.
The 1st resistance level at 0.6441 is identified as an overlap resistance that aligns with the 50.00% Fibonacci retracement level. Furthermore, the 2nd resistance level at 0.6508 is marked as an overlap resistance, indicating its significance as a potential barrier to further bullish movements.
To the downside, the 1st support level at 0.6386 is identified as an overlap support that aligns with the 61.80% Fibonacci retracement level. Additionally, the 2nd support level at 0.6338 is marked as a pullback support that aligns with the 61.80% Fibonacci projection level, reinforcing its potential role as a support level.
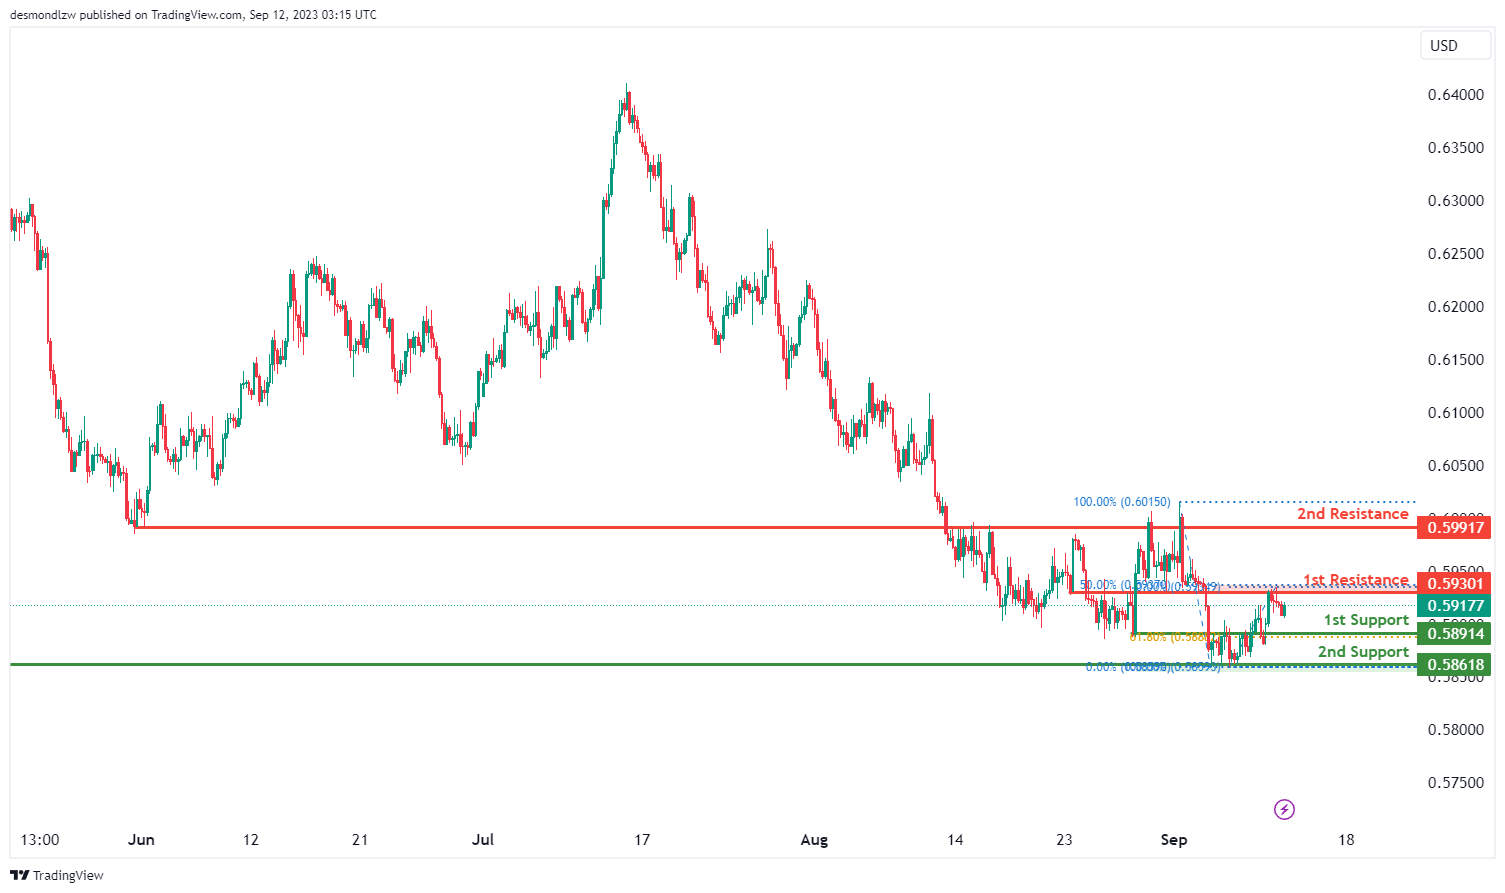
NZD/USD
The NZD/USD chart currently indicates an overall bullish momentum, suggesting a potential upward trend in price movement. There is a possibility of a bullish continuation towards the 1st resistance level.
The 1st resistance level at 0.5930 is identified as an overlap resistance that aligns with the 50.00% Fibonacci retracement level. Furthermore, the 2nd resistance level at 0.5992 is marked as an overlap resistance, reinforcing its potential role as a barrier to further bullish movements.
To the downside, the 1st support level at 0.5891 is identified as an overlap support that aligns with the 61.80% Fibonacci retracement level. Additionally, the 2nd support level at 0.5862 is marked as a pullback support, reinforcing its potential role as a support level.
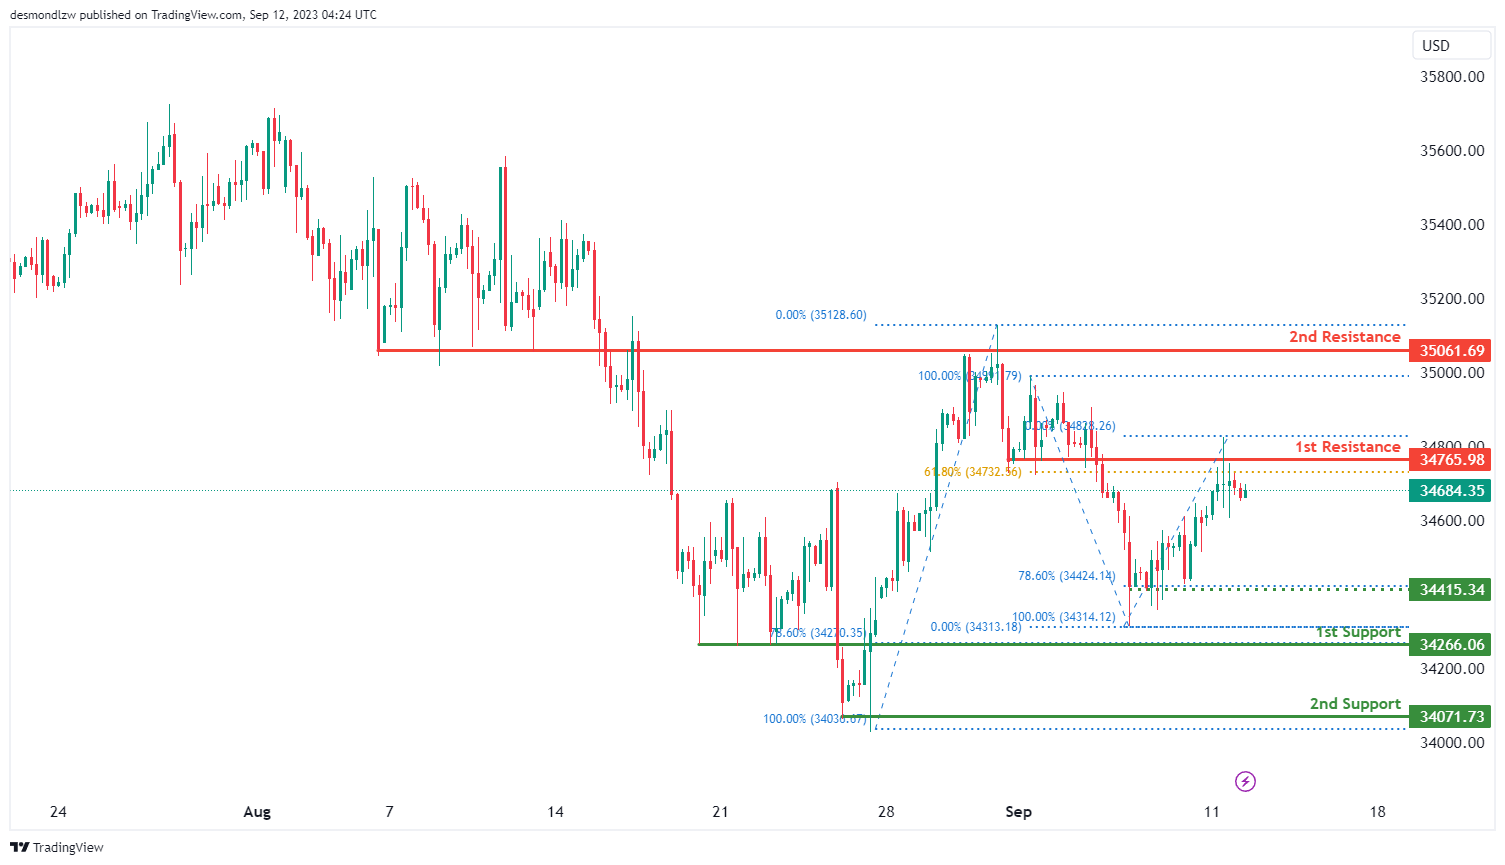
DJ30:
For DJ30, the overall momentum of the chart is currently bearish, indicating a downward trend.
There is potential for the price to continue its bearish movement towards the 1st support level at 34266.06.
The 1st support at 34266.06 is considered significant because it represents a pullback support and aligns with the 78.60% Fibonacci Retracement level, suggesting potential stability and support at this level.
In case of a more significant decline, the 2nd support level at 34071.73 is also noteworthy as it represents a swing low support, offering additional reinforcement for the price.
On the upper side, the 1st resistance at 34765.98 is considered important because it represents an overlap resistance, supported by the 61.80% Fibonacci Retracement level. This level may act as a barrier to upward movement.
Further upward movement could face resistance at the 2nd resistance level of 35061.69, characterized as an overlap resistance, which could pose a significant challenge to the bullish momentum.
Additionally, there is an intermediate support level at 34415.34, identified as multi-swing low support, which may temporarily slow down the bearish momentum within the observed range.
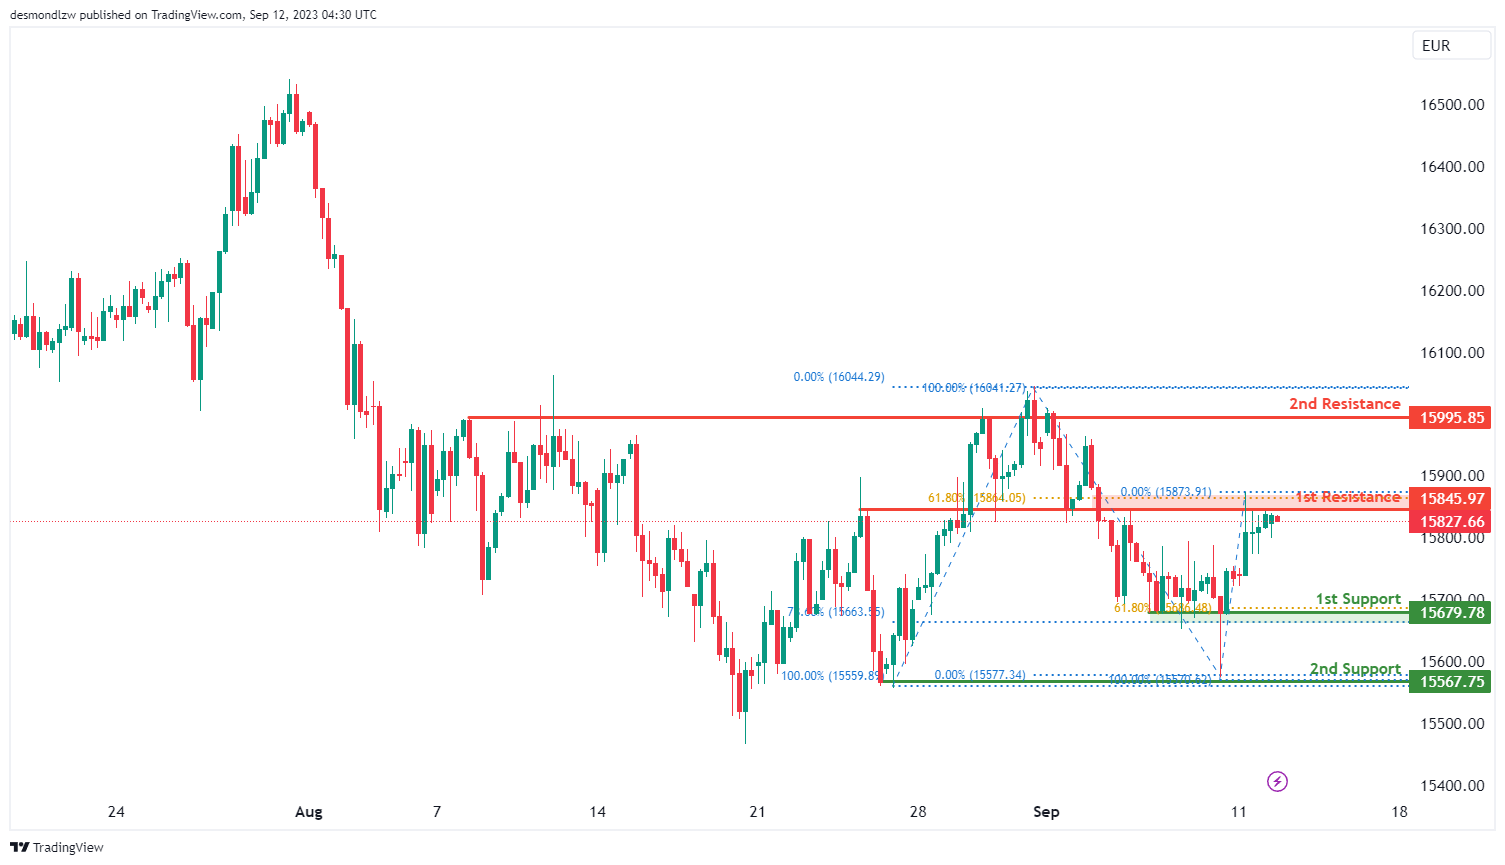
GER30:
For GER30, the overall momentum of the chart is currently bearish, indicating a downward trend.
There is potential for the price to continue its bearish movement towards the 1st support level at 15679.78. This 1st support level is considered significant because it represents multi-swing low support and aligns with both the 61.80% Fibonacci Retracement and the 78.60% Fibonacci Retracement, indicating a strong potential for support at this level due to Fibonacci confluence.
In case of a more significant decline, the 2nd support level at 15567.75 is also noteworthy, representing multi-swing low support and aligning with the 38.20% Fibonacci Retracement, providing additional reinforcement for the price.
On the upper side, if there’s a reversal in the price, it may face resistance at the 1st resistance level of 15845.97, identified as an overlap resistance and supported by the 61.80% Fibonacci Retracement.
Further upward movement could encounter resistance at the 2nd resistance level of 15995.85, characterized as multi-swing high resistance, which may act as a barrier to the bullish momentum within the observed range.
US500
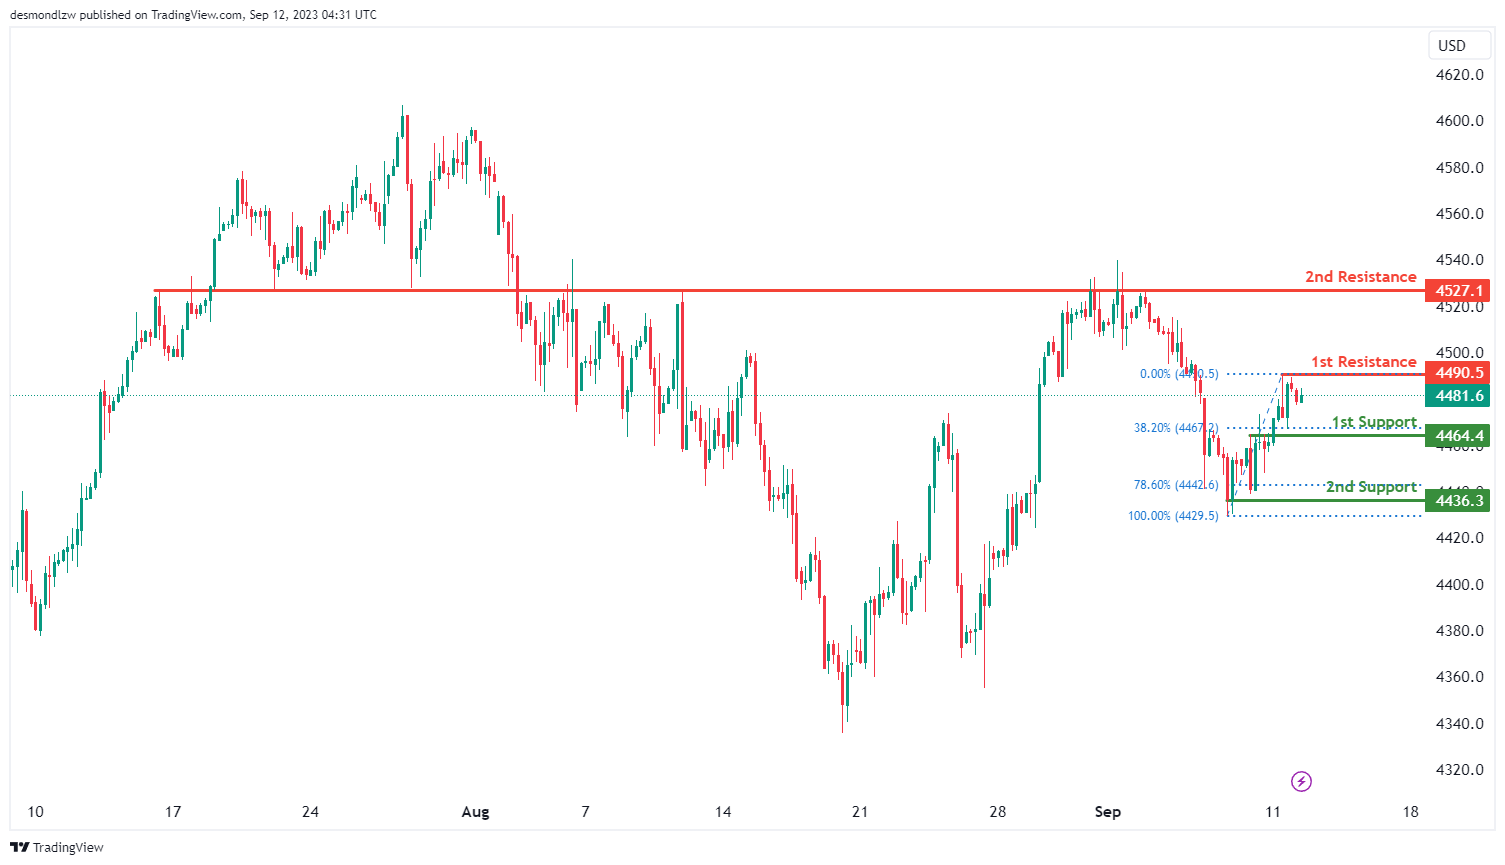
For US500, the overall momentum of the chart is currently bearish, indicating a downward trend.
There is potential for the price to continue its bearish movement towards the 1st support level at 4464.4. This 1st support is considered significant because it represents a pullback support and aligns with the 38.20% Fibonacci Retracement level, suggesting potential stability and support at this level.
In case of a more substantial decline, the 2nd support level at 4436.3 is also noteworthy. This support level is characterized as a swing low support and aligns with the 78.60% Fibonacci Projection, adding further significance to it.
On the upper side, if there’s a reversal in the price, it may encounter resistance at the 1st resistance level of 4490.5, identified as a swing high resistance.
Further upward movement could face resistance at the 2nd resistance level of 4527.1, characterized as an overlap resistance, which may act as a barrier to the bullish momentum within the observed range.
BTC/USD:
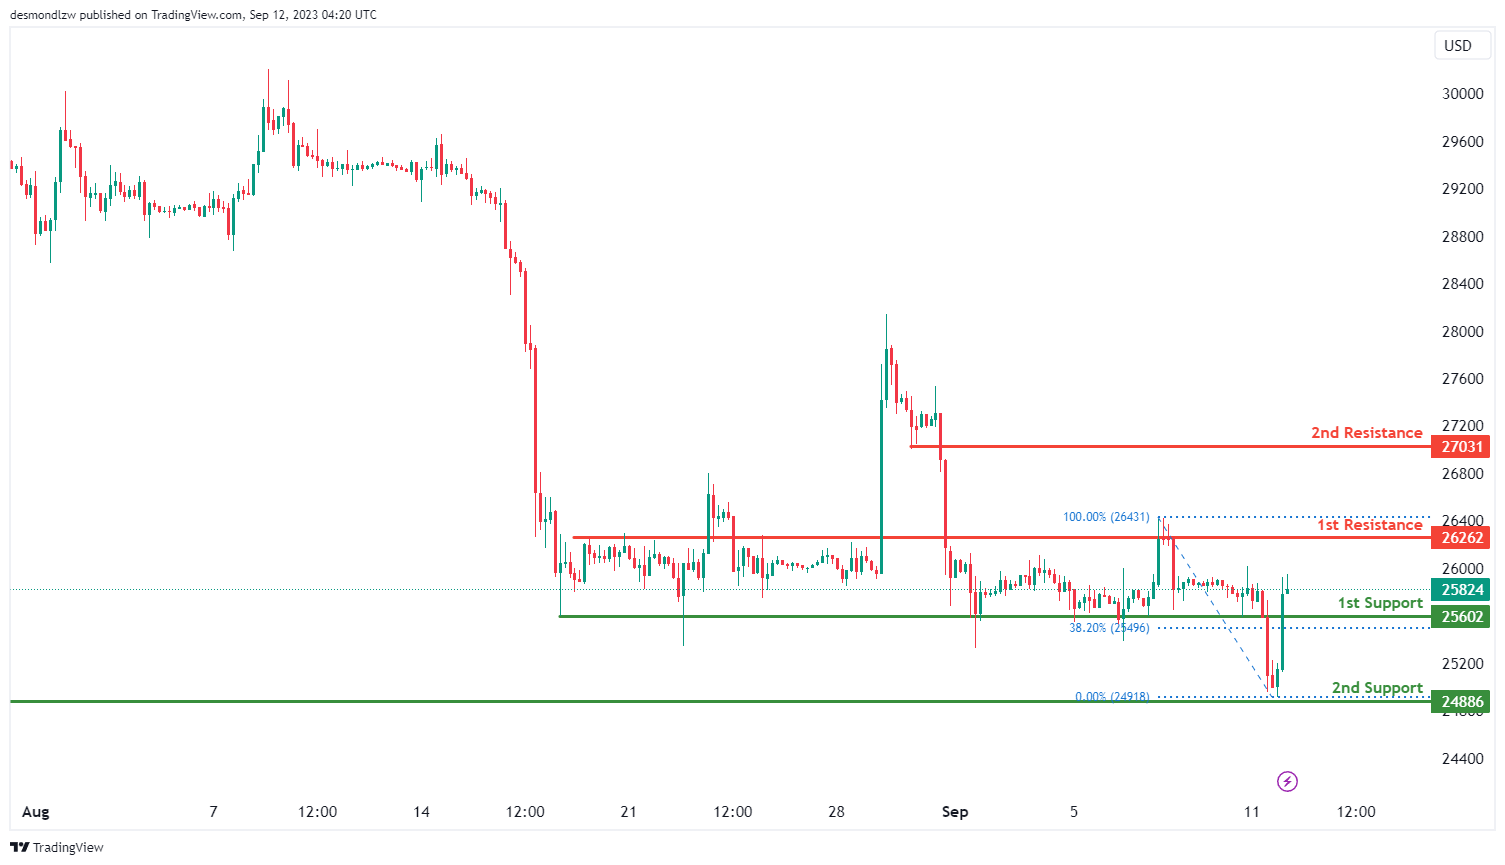
For BTC/USD, the overall momentum of the chart is currently bullish, indicating an upward trend.
There is potential for the price to make a bullish move by bouncing off the 1st support level at 25602 and heading towards the 1st resistance at 26262.
The 1st support at 25602 is considered significant because it represents a pullback support and aligns with the 38.20% Fibonacci Retracement level, suggesting potential stability and support at this level.
In case of a more substantial retracement, the 2nd support level at 24886 is also noteworthy as it represents multi-swing low support, which can provide additional support to the price.
On the upper side, the 1st resistance at 26262 is considered important because it represents an overlap resistance.
Further upward movement may encounter resistance at the 2nd resistance level of 27031, identified as a pullback resistance, which could pose a barrier to the bullish momentum.
ETH/USD:
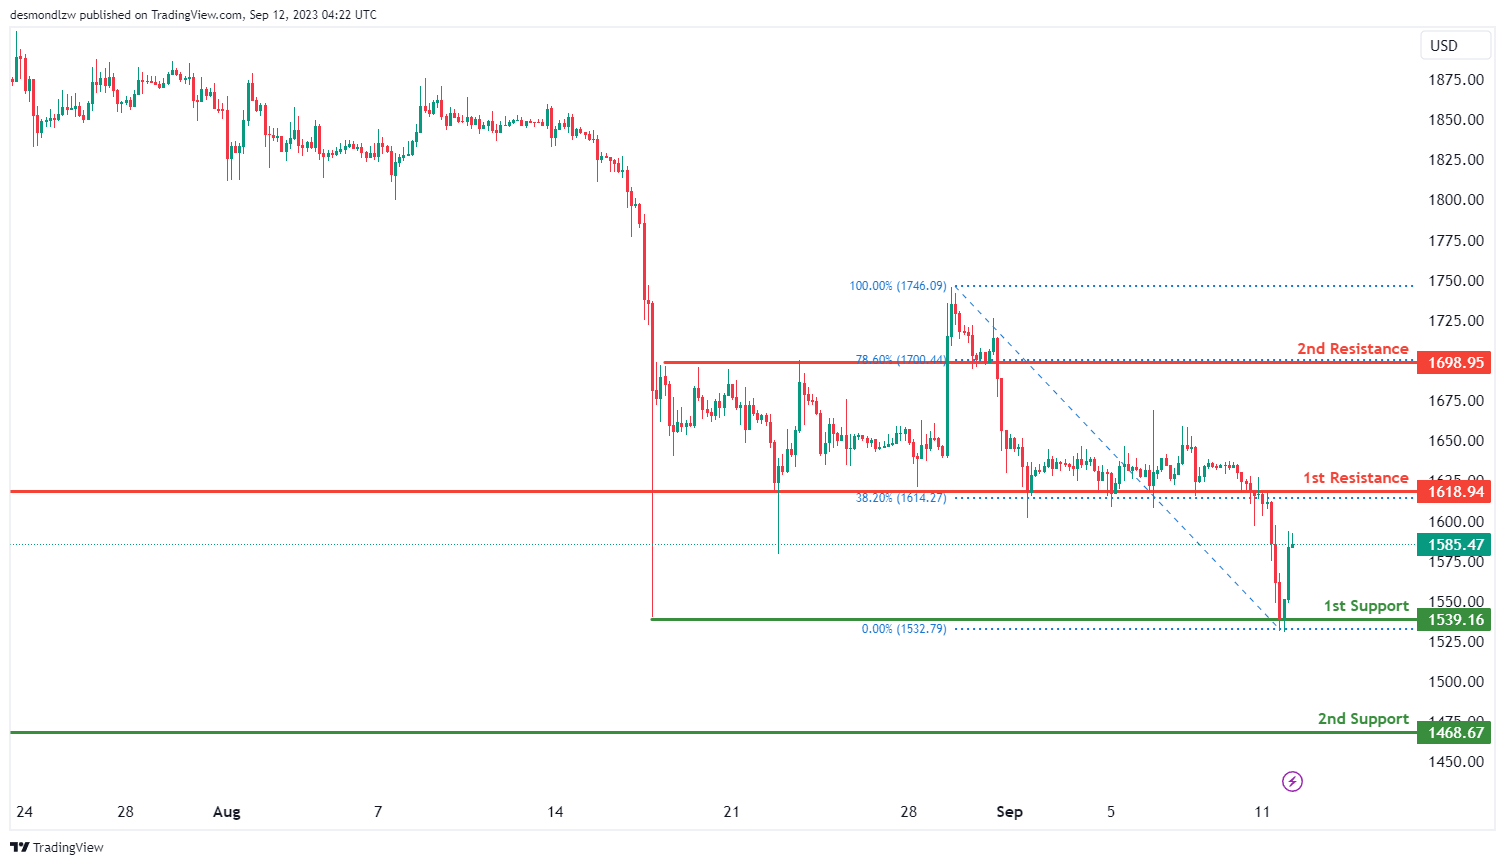
For ETH/USD, the overall momentum of the chart is currently bullish, indicating an upward trend.
There is potential for the price to continue its bullish movement towards the 1st resistance level at 1618.94.
The 1st support at 1539.16 is considered good because it represents multi-swing low support, indicating potential stability at this level.
In case of a more substantial retracement, the 2nd support level at 1468.67 is also noteworthy as it represents a swing low support, offering additional reinforcement for the price.
On the upper side, the 1st resistance at 1618.94 is considered important due to its characteristics as pullback resistance, supported by the 38.20% Fibonacci Retracement level. This level may act as a barrier to upward movement.
Further upward movement could face resistance at the 2nd resistance level of 1698.95, characterized as pullback resistance and aligned with the 78.60% Fibonacci Retracement level, potentially posing a significant obstacle to the bullish momentum.
WTI/USD:
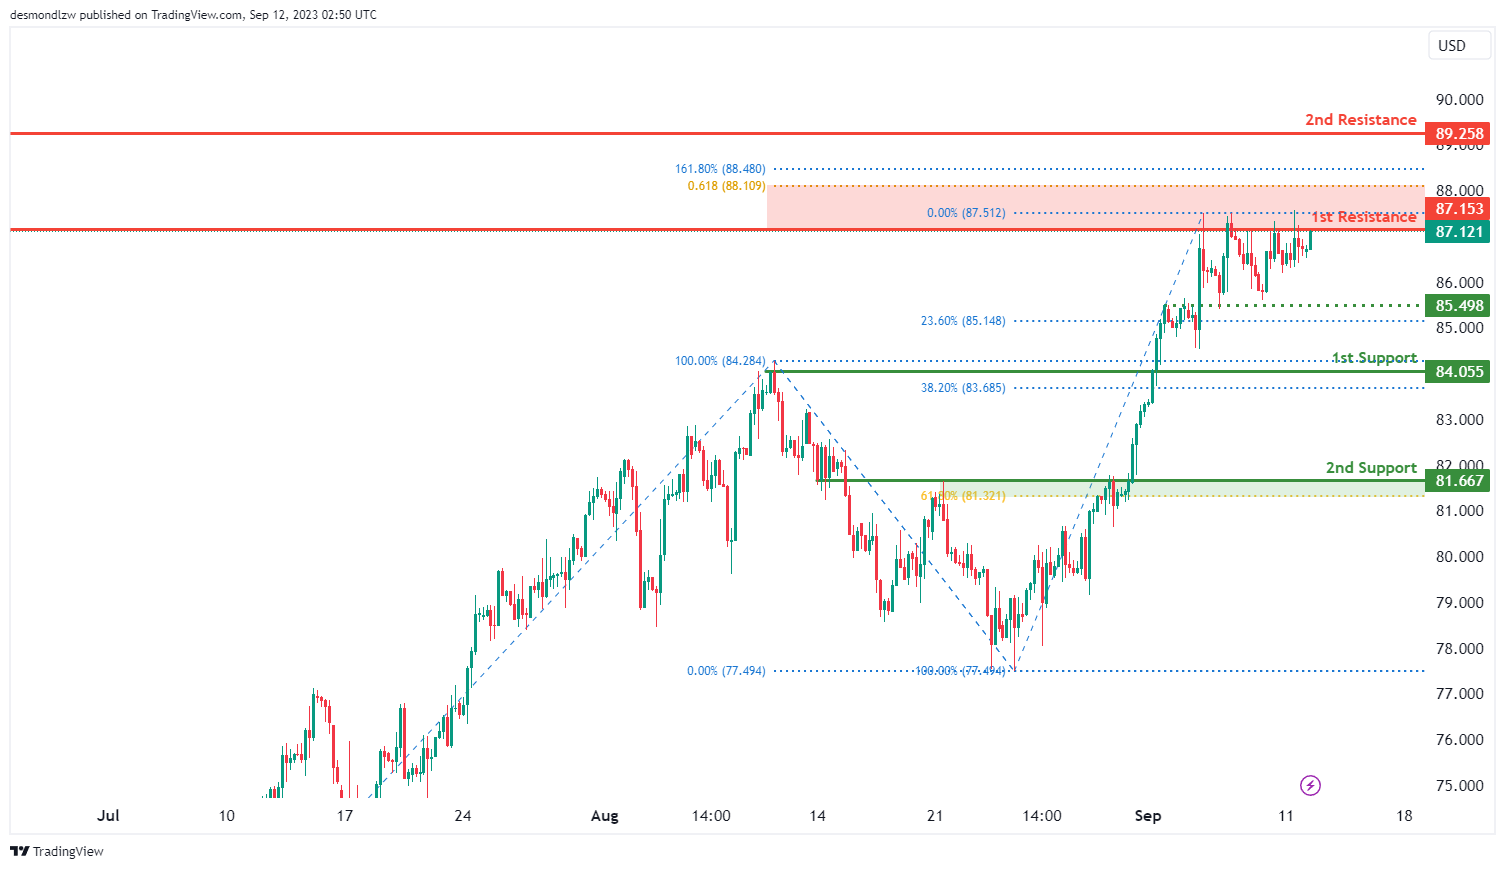
The WTI chart currently exhibits an overall bullish momentum, indicating a potential upward trend in price movement.There is a possibility of a bullish breakout beyond the 1st resistance level with the potential to rise towards the 2nd resistance level.
The 1st resistance level at 87.15 is identified as an overlap resistance that aligns with a confluence of Fibonacci levels i.e. the 61.80% projection and the 161.80% extension levels. Furthermore, the 2nd resistance level at 89.26 is marked as an overlap resistance, indicating its potential significance as a barrier to further bullish movements.
To the downside, the Intermediate support level at 85.49 is identified as an overlap support that aligns with the 23.60% Fibonacci retracement level. The 1st support level at 84.06 is identified as a pullback support that aligns with the 38.20% Fibonacci retracement level.
Additionally, the 2nd support level at 81.67 is identified as an overlap support that aligns with the 61.80% Fibonacci retracement level, further reinforcing its potential role as a support level.
XAU/USD (GOLD):
The XAU/USD chart currently displays a neutral overall momentum, suggesting a lack of a clear directional trend.
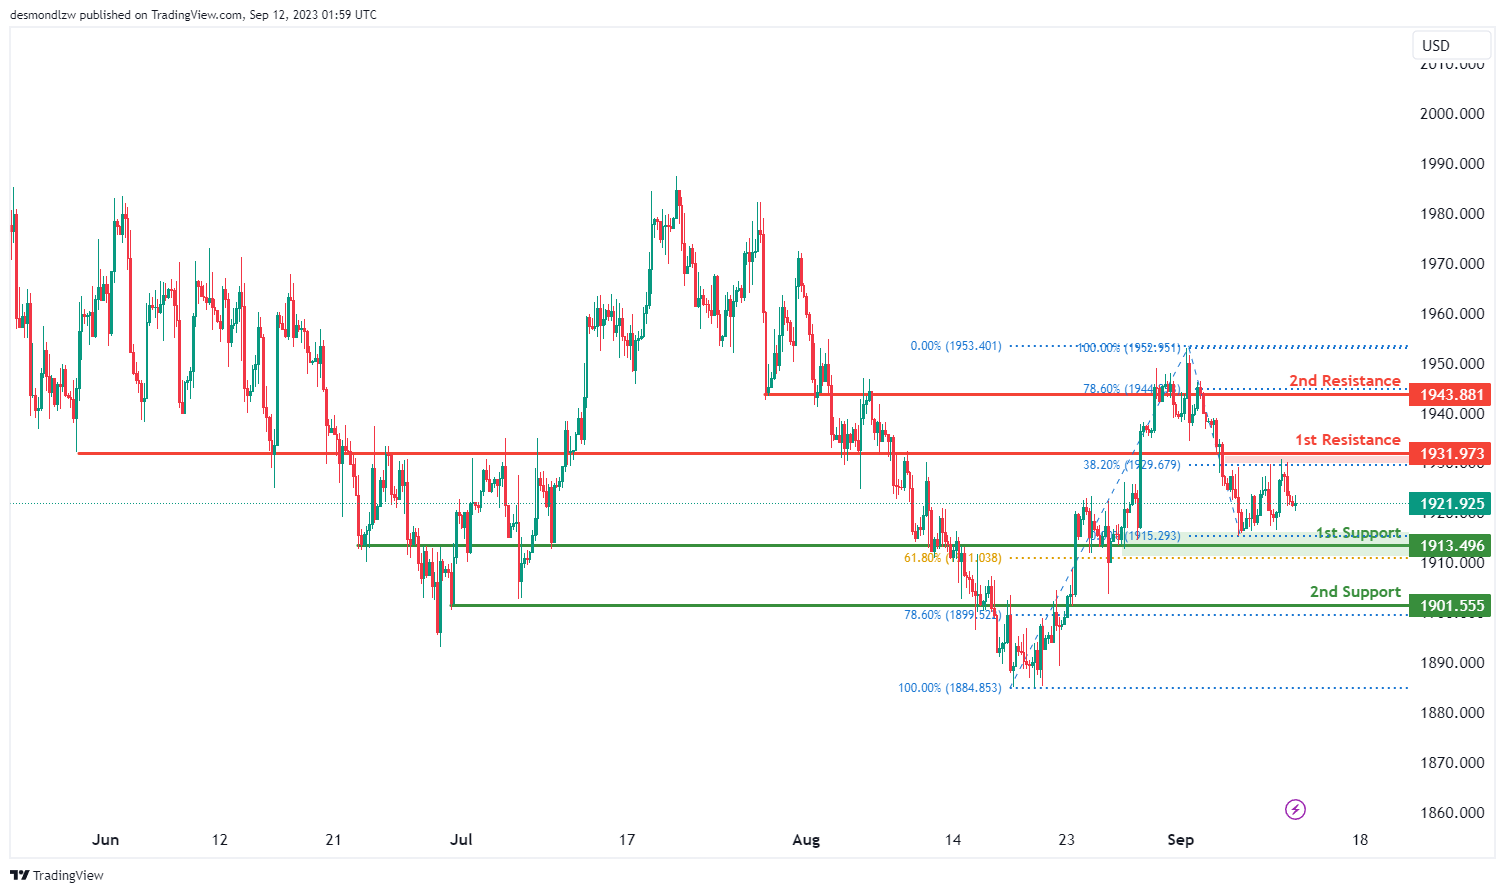
Price is anticipated to fluctuate within a range defined by the 1st support at 1913.49 and the 1st resistance at 1931.97.
The 1st support level at 1913.49 is considered significant, representing an overlap support and aligning with the 61.80% Fibonacci Retracement level, indicating potential price support.
Additionally, the 2nd support at 1901.55 is also marked as an overlap support and aligns with the 78.60% Fibonacci Retracement, further reinforcing its potential role as a support level.
On the resistance side, the 1st resistance at 1931.97 is identified as an overlap resistance, potentially acting as a barrier to significant upward price movements.
Furthermore, the 2nd resistance level at 1943.88 is noted as an overlap resistance, indicating another potential resistance area.
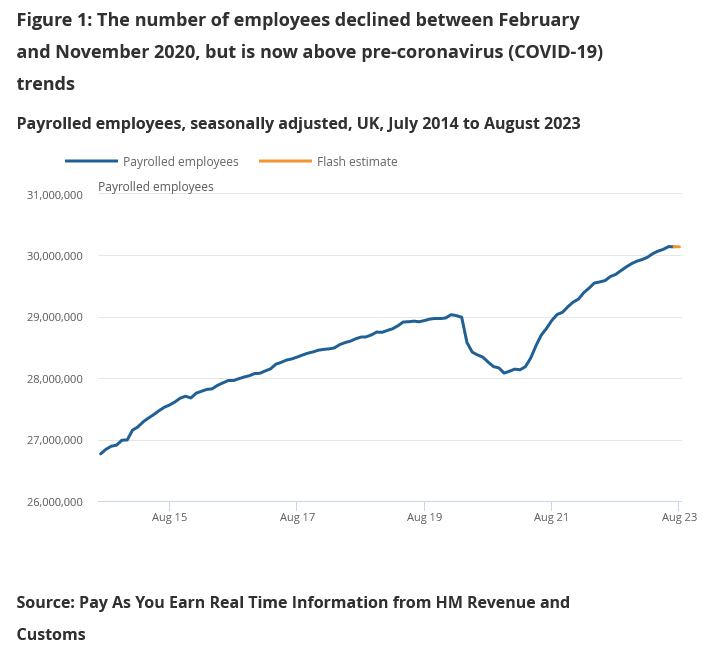
UK payrolled employment down -1k in Aug, median monthly pay growth slowed
In August, UK saw a minimal decline in payrolled employment by -1,000 (-0.0% mom) bringing the total to 30.1 million. In a positive revision, prior month's figures were adjusted from a -4k decrease to a substantial increase of 97k. Despite this, there is no dismissing the slowed momentum in the job market as reflected in the slight decline in August.
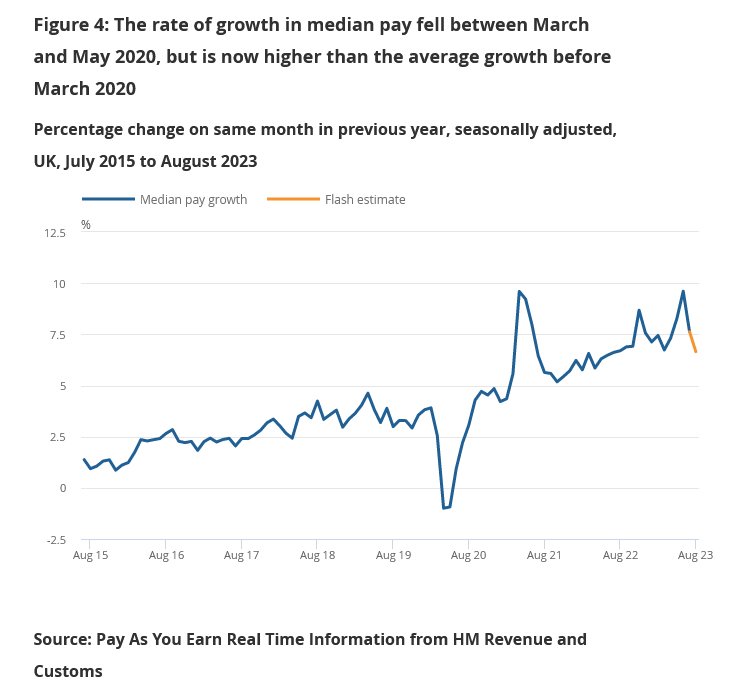
Dive deeper into the earnings, and one notices a yoy rise of 6.7% for the median monthly pay, touching GBP 2,260. The service activities sector led this growth, clocking an 8.7% yoy rise, while the finance and insurance sector recorded the lowest at 3.2% yoy. However, there was a perceptible deceleration in the growth rate of median monthly pay, down from July's 7.6% yoy and notably from June's 9.6% yoy, with the latter month having a peak of GBP 2,305.
Turning to median monthly pay, service activities sector spearheaded growth, showcasing an 8.7% yoy increase, attaining the highest growth rate across sectors. Contrastingly, finance and insurance sector lagged, recording the lowest annual growth rate at 3.2% yoy. Overall, median monthly pay elevated by 6.7% yoy to GBP 2,260. However, there was a perceptible deceleration in growth rate of median monthly pay, down from July's 7.6% yoy and notably from June's 9.6% yoy, with the latter month having a peak of GBP 2,305.
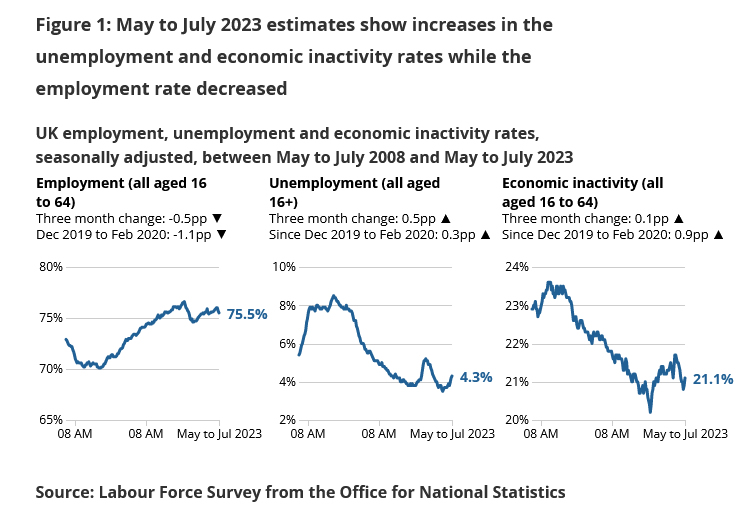
The three months leading to July painted a similar picture of mixed outcomes. Unemployment settled at 4.3%, rising by 0.5% from the previous quarter, in line with market anticipations. Meanwhile, employment rate dropped by 0.5% to 75.5% alongside a modest increase in economic inactivity rate to 21.1%, up by 0.1%.
Total weekly hours dropped -18.5% over the three-month period. Average earnings excluding bonus was unchanged at 7.8% 3moy, matched expectations. Average earnings including bonus rose to 8.5% 3moy, above expectations of 8.2%.
USD/CAD Daily Outlook
Daily Pivots: (S1) 1.3545; (P) 1.3592; (R1) 1.3623; More....
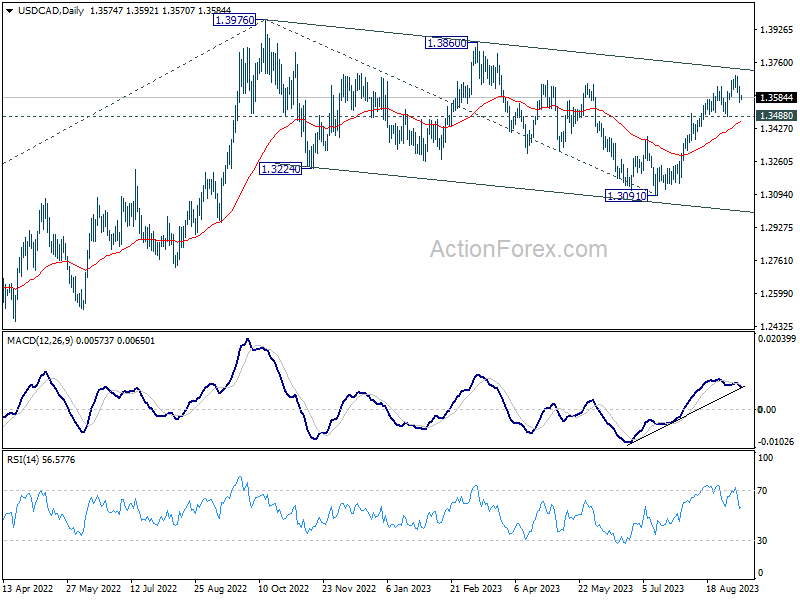
Outlook in USD/CAD remains unchanged and intraday bias stays neutral. Consolidation from 1.3693 would extend and deeper pull back might be seen. But further rally is expected as long as 1.3488 support holds. Above 1.3693 will resume the rally from 1.3091 to 1.3860 resistance, and then 1.3976 high.
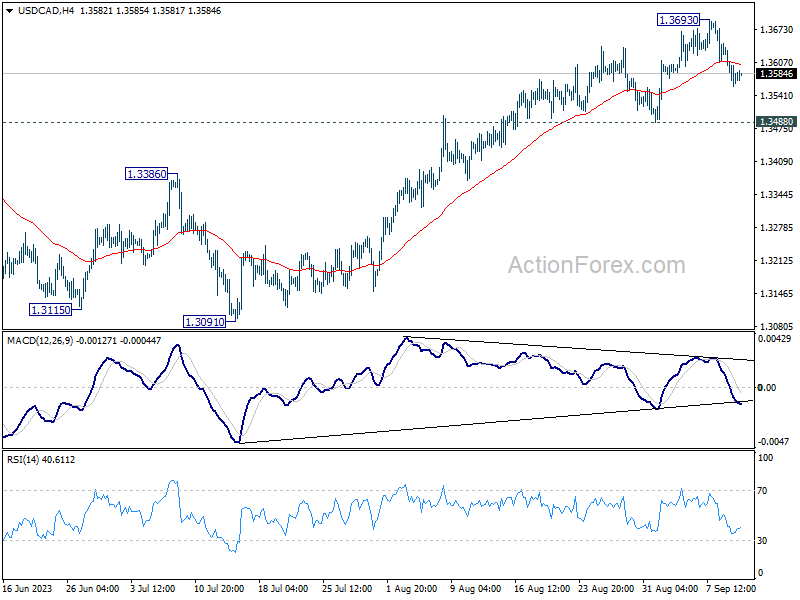
In the bigger picture, price actions from 1.3976 are viewed as a corrective pattern only. Upon completion, rise from 1.2005 (2021 low) would resume through 1.3976. Next target is 61.8% projection of 1.2005 to 1.3976 from 1.3091 at 1.4309. For now, this will remain the favored case as long as 55 D EMA (now at 1.3456) holds.
Sterling and Euro in Focus: Markets Await UK Employment and Germany ZEW
In Asian trading session today, the forex markets remained steady with no significant movements outside of yesterday's range among major pairs and crosses. Sterling stood slightly firmer, holding much anticipation for the forthcoming UK employment data, notably the insights on wage growth which can potentially delineate its next significant move.
In contrast, Euro presented a softer tone as markets awaited Germany ZEW Economic Sentiment indicator, an important data set which may reflect further degradation given the mounting worries of recession. EUR/GBP's reactions to the releases could be noteworthy.
As we look beyond, Yen has reverted back to its previous week's range vis-à-vis other major rivals, as yesterday's sharp rise was fleeting. However, it maintains its position as the second strongest currency at present. Australian Dollar emerges as the frontrunner, a situation catalyzed by rejuvenated Chinese Yuan.
Dollar, on the other hand, has been exhibiting mild weakness this week, closely followed by Swiss Franc. Euro and Canadian dollar are maneuvering with mixed performance. But the picture could be shaken up drastically with the unveiling of US CPI data on Wednesday and the much-awaited ECB rate decision alongside the economic projections slated for release on Thursday.
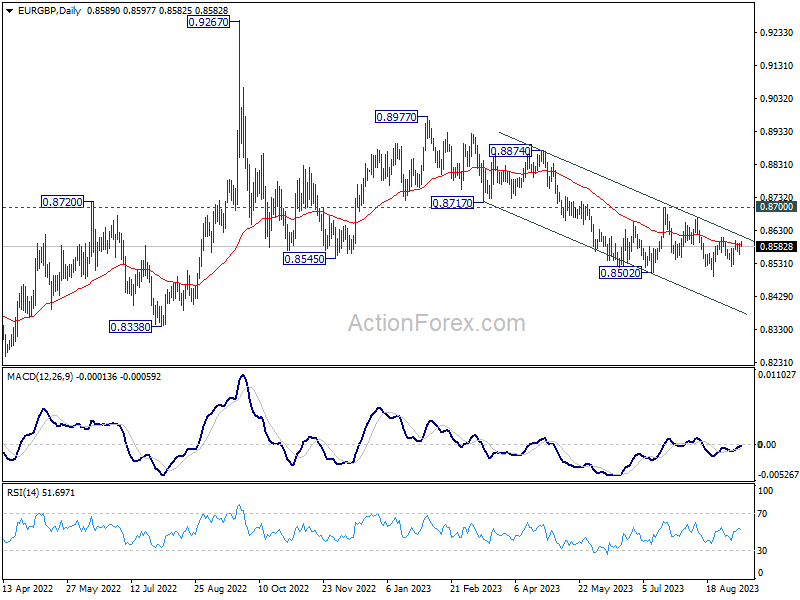
Technically, being capped by falling 55 D EMA, immediate risks for EUR/GBP is staying on the downside. That is, down trend from 0.8977 is in favor to resume sooner rather than later through last week's low of 0.8491. Sustained break of the 55 D EMA would provide some near term relieve for the cross. Yet, until 0.8700 resistance is decisively broken, bullish reversal remains unconfirmed, keeping the door wide open for sellers to regain control post a recovery.
In Asia, at the time of writing, Nikkei is up 0.81%. Hong Kong HSI is up 0.01%. China Shanghai SSE is up 0.04%. Singapore Strait Times is down -0.20%. Japan 10-year JGB yield is up further by 0.0054 at 0.711. Overnight, DOW rose 0.25%. S&P 500 rose 0.67%. NASDAQ rose 1.14%. 10-year yield rose 0.030 to 4.288.
Japan's FM Suzuki expects BoJ to liaise with government closely
In the wake of the spike in Yen, prompted by BoJ Governor Kazuo Ueda's remarks, Finance Minister Shunichi Suzuki made clarifying comments today. Yen's climb was chiefly attributed to Ueda's interview with Yomiuri Shimbun, where he hinted at the possibility of exiting negative rates policy in the coming year.
At a regular press conference, Suzuki underlined the autonomy of BOJ, stating that the "specific monetary policy conduct is up to the BOJ to decide."
However, the minister did not hold back from expressing the government's expectations . Suzuki conveyed his aspirations for BOJ, emphasizing its collaboration with the government. He said, "I expect the BOJ to continue to liaise with the government closely and conduct monetary policy appropriately."
The guiding principle for this collaboration, as Suzuki suggests, should be a comprehensive evaluation of the economy, considering factors like pricing and prevailing financial conditions. The ultimate aim is to "achieve its price stability target in a stable and sustainable way."
The remarks by the Finance Minister, while emphasizing BoJ's autonomy, also subtly convey the weight of responsibility the central bank carries in managing the nation's economic health, especially in unpredictable financial climates.
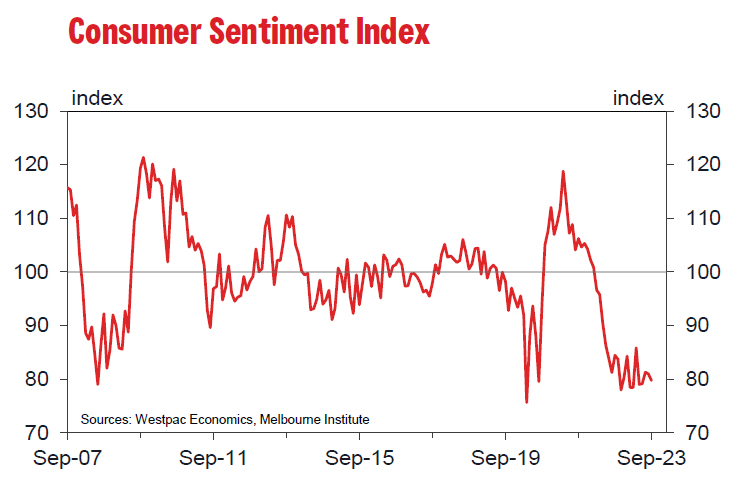
Australia consumer sentiment fell to 79.7, languishes at deeply pessimistic levels
Australia's consumer sentiment, as depicted by Westpac Consumer Sentiment Index, witnessed a dip of -1.5% mom, settling at 79.7 in September. The sentiment has been gloomily "languished at deeply pessimistic levels".
Westpac draws attention to the historical context, pointing out that since the initiation of the survey back in 1974, such enduring periods of pessimism have been rare. The most notable instance was during early 1990s' recession when sentiments dipped even lower and remained so for a duration exceeding two years.
On the brighter side, households showcased reduced apprehension about potential rate hikes, with noticeable surge in confidence, up 7.8%, particularly among mortgagors. However, looming worries about cost of living and inflation continue to weigh down on consumer spirits. Although job confidence has steadied itself, it has drastically plummeted, down -33% from its peak levels. One silver lining is the buoyed expectations around house prices.
Westpac expects RBA to maintain their status quo until August 2024. By this timeframe, Westpac envisions inflation receding to 3.4%, a jump in unemployment rate to 4.5%, and a noticeable slowdown in the annual growth rate of consumer spending, tapering to a mere 0.8%.
Also released, NAB Business Conditions rose from 11 to 13 in August. Business Confidence rose from 1 to 2.
Looking ahead
UK employment data and Germany ZEW Economic Sentiment are the only notably economic data release today.
USD/CAD Daily Outlook
Daily Pivots: (S1) 1.3545; (P) 1.3592; (R1) 1.3623; More....
Outlook in USD/CAD remains unchanged and intraday bias stays neutral. Consolidation from 1.3693 would extend and deeper pull back might be seen. But further rally is expected as long as 1.3488 support holds. Above 1.3693 will resume the rally from 1.3091 to 1.3860 resistance, and then 1.3976 high.
In the bigger picture, price actions from 1.3976 are viewed as a corrective pattern only. Upon completion, rise from 1.2005 (2021 low) would resume through 1.3976. Next target is 61.8% projection of 1.2005 to 1.3976 from 1.3091 at 1.4309. For now, this will remain the favored case as long as 55 D EMA (now at 1.3456) holds.
Economic Indicators Update
| GMT | Ccy | Events | Actual | Forecast | Previous | Revised |
|---|---|---|---|---|---|---|
| 00:30 | AUD | Westpac Consumer Confidence Sep | -1.50% | -0.40% | ||
| 01:30 | AUD | NAB Business Conditions Aug | 13 | 10 | 11 | |
| 01:30 | AUD | NAB Business Confidence Aug | 2 | 2 | 1 | |
| 06:00 | GBP | Claimant Count Change Aug | 29K | |||
| 06:00 | GBP | ILO Unemployment Rate (3M) Jul | 4.30% | 4.20% | ||
| 06:00 | GBP | Average Earnings Excluding Bonus 3M/Y Jul | 7.60% | 7.80% | ||
| 06:00 | GBP | Average Earnings Including Bonus 3M/Y Jul | 8.20% | 8.20% | ||
| 09:00 | EUR | Germany ZEW Economic Sentiment Sep | -15 | -12.3 | ||
| 09:00 | EUR | Germany ZEW Current Situation Sep | -75 | -71.3 | ||
| 09:00 | EUR | Eurozone ZEW Economic Sentiment Sep | -6.2 | -5.5 | ||
| 10:00 | USD | NFIB Business Optimism Index Aug | 91.6 | 91.9 |
Japan’s FM Suzuki expects BoJ to liaise with government closely
In the wake of the spike in Yen, prompted by BoJ Governor Kazuo Ueda's remarks, Finance Minister Shunichi Suzuki made clarifying comments today. Yen's climb was chiefly attributed to Ueda's interview with Yomiuri Shimbun, where he hinted at the possibility of exiting negative rates policy in the coming year.
At a regular press conference, Suzuki underlined the autonomy of BOJ, stating that the "specific monetary policy conduct is up to the BOJ to decide."
However, the minister did not hold back from expressing the government's expectations . Suzuki conveyed his aspirations for BOJ, emphasizing its collaboration with the government. He said, "I expect the BOJ to continue to liaise with the government closely and conduct monetary policy appropriately."
The guiding principle for this collaboration, as Suzuki suggests, should be a comprehensive evaluation of the economy, considering factors like pricing and prevailing financial conditions. The ultimate aim is to "achieve its price stability target in a stable and sustainable way."
The remarks by the Finance Minister, while emphasizing BOJ's autonomy, also subtly convey the weight of responsibility the central bank carries in managing the nation's economic health, especially in unpredictable financial climates.
Australia consumer sentiment fell to 79.7, languishes at deeply pessimistic levels
Australia's consumer sentiment, as depicted by Westpac Consumer Sentiment Index, witnessed a dip of -1.5% mom, settling at 79.7 in September. The sentiment has been gloomily "languished at deeply pessimistic levels".
Westpac draws attention to the historical context, pointing out that since the initiation of the survey back in 1974, such enduring periods of pessimism have been rare. The most notable instance was during early 1990s' recession when sentiments dipped even lower and remained so for a duration exceeding two years.
On the brighter side, households showcased reduced apprehension about potential rate hikes, with noticeable surge in confidence, up 7.8%, particularly among mortgagors. However, looming worries about cost of living and inflation continue to weigh down on consumer spirits. Although job confidence has steadied itself, it has drastically plummeted, down -33% from its peak levels. One silver lining is the buoyed expectations around house prices.
Westpac expects RBA to maintain their status quo until August 2024. By this timeframe, Westpac envisions inflation receding to 3.4%, a jump in unemployment rate to 4.5%, and a noticeable slowdown in the annual growth rate of consumer spending, tapering to a mere 0.8%.