Sample Category Title
EUR/USD Daily Outlook
Daily Pivots: (S1) 1.0677; (P) 1.0705; (R1) 1.0723; More...
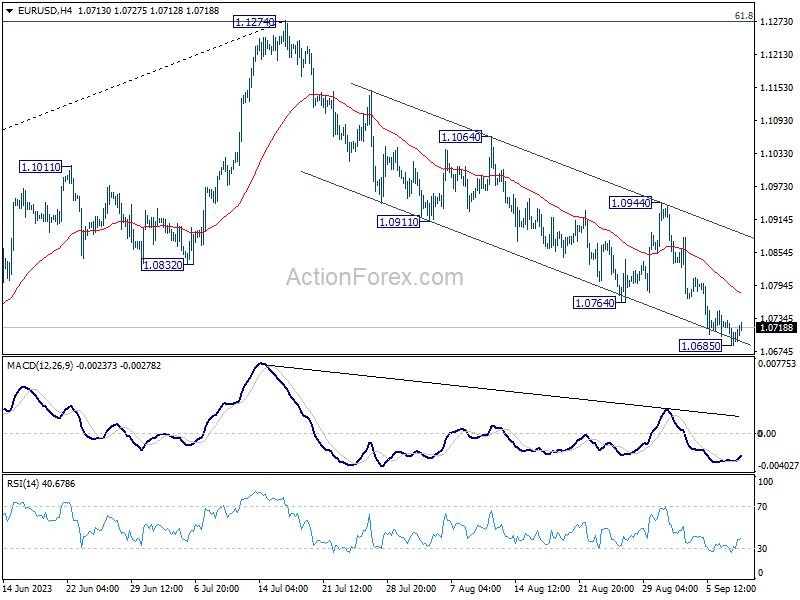
Intraday bias in EUR/USD is turned neutral with current recovery and some consolidations would be seen. But outlook will stay bearish as long as 1.0944 resistance holds. Below 1.0685 will resume the fall from 1.1274 to 1.0609/34 cluster support.
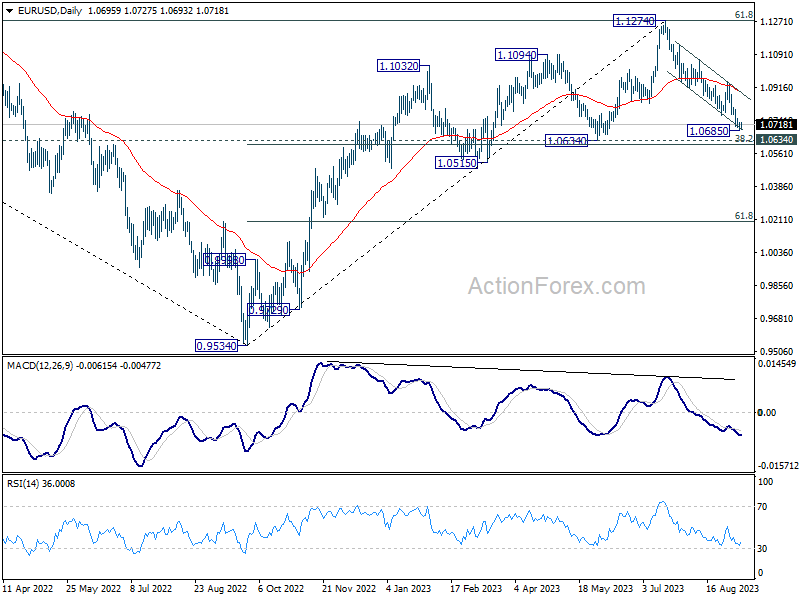
In the bigger picture, fall from 1.1274 medium term top is seen as a correction to up trend from 0.9534 (2022 low). Deeper decline would be seen to 1.0634 cluster support (38.2% retracement of 0.9534 to 1.1274 at 1.0609). Strong support could be seen there, at least on first attempt, to bring rebound. Yet, medium term outlook will be neutral for now, as long as 1.1274 resistance holds. However, sustained break of 1.0609/34 will raise the chance of bearish trend reversal, and target 61.8% retracement at 1.0199.
GBP/USD Daily Outlook
Daily Pivots: (S1) 1.2441; (P) 1.2476; (R1) 1.2506; More...
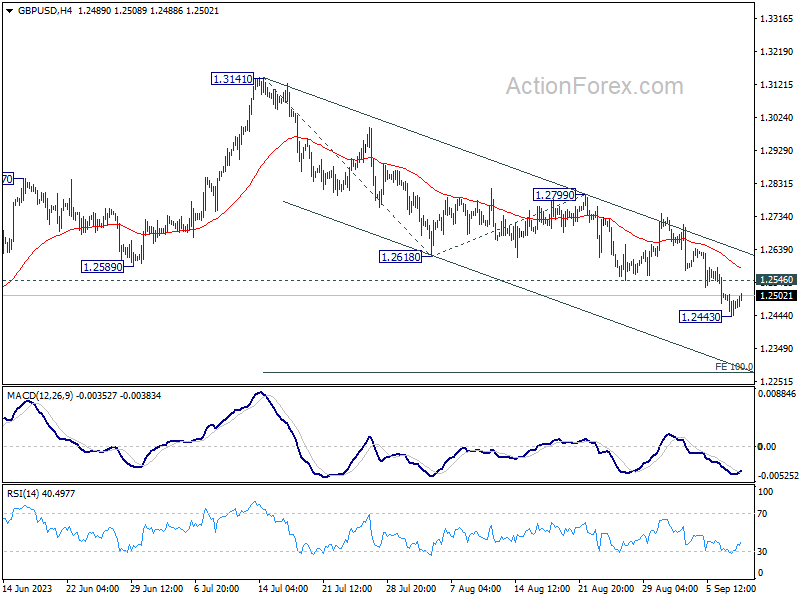
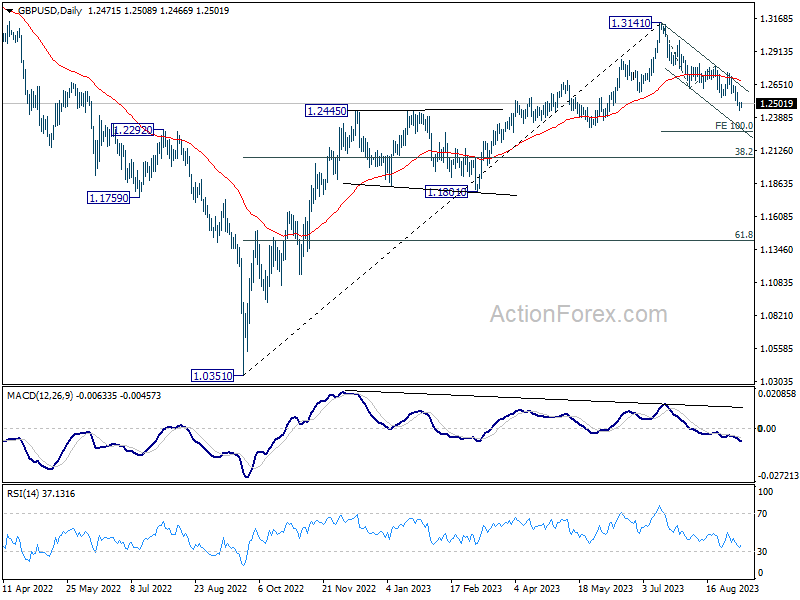
Intraday bias in GBP/USD is turned neutral with current recovery. Some consolidation would be seen above 1.2443 temporary low. But upside of recovery should be limited by 1.2618 support turned resistance. Below 1.2443 will resume the fall from 1.3141 to 100% projection of 1.3141 to 1.2618 from 1.2799 at 1.2276.
In the bigger picture, fall from 1.3141 medium term top is seen as a correction to up trend from 1.0351 (2022 low). Deeper decline would be seen to 38.2% retracement of 1.0351 to 1.3141 at 1.2075. Strong support would be seen there to bring rebound on first attempt. But outlook will be neutral at best as long as 1.3141 resistance holds, and consolidation from there is set to extend, until further development.
USD/JPY Daily Outlook
Daily Pivots: (S1) 146.93; (P) 147.40; (R1) 147.76; More...
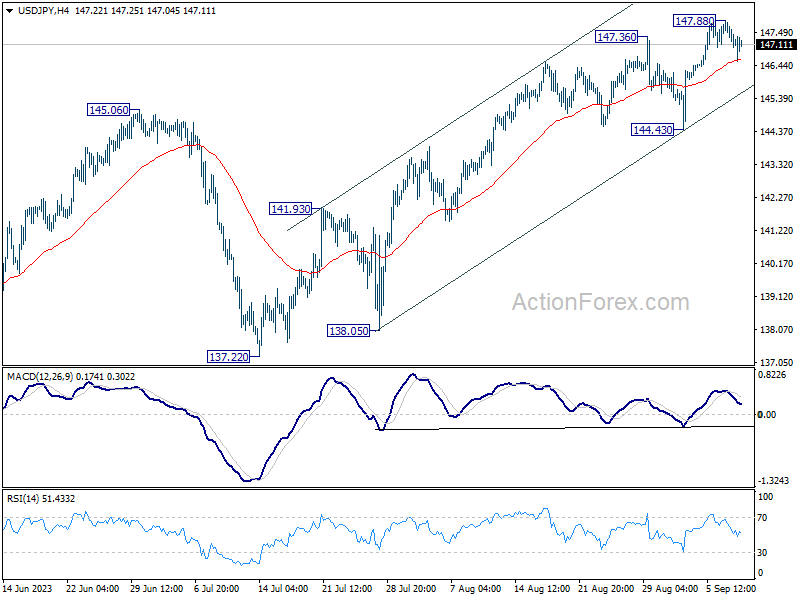
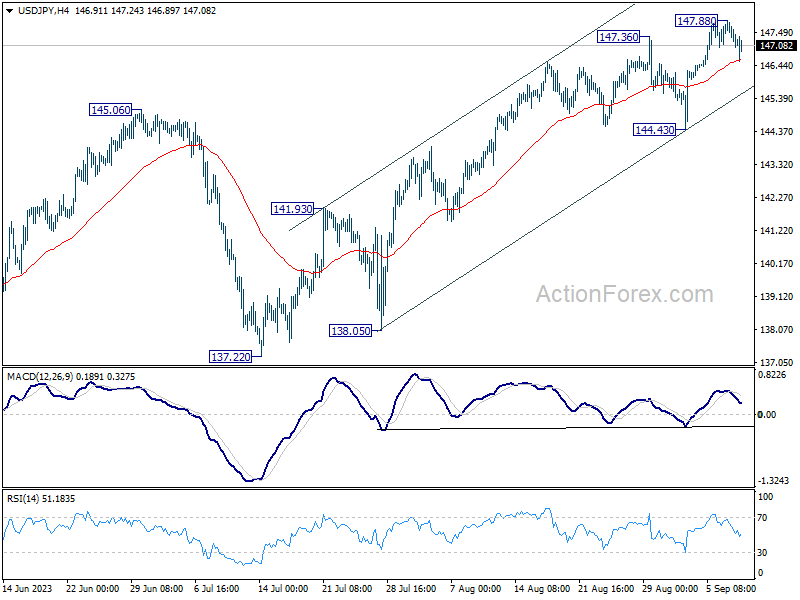
Intraday bias in USD/JPY remains neutral for consolidation below 147.88. While deeper retreat could be seen, outlook will stay bullish as long as 144.43 support holds. On the upside, above 147.88 will resume larger rally from 127.20, to retest 151.93 high.
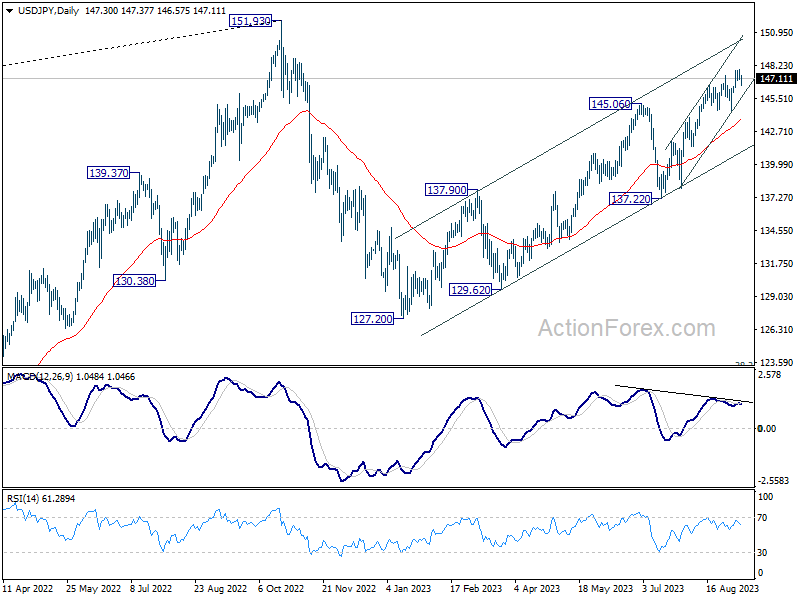
In the bigger picture, overall price actions from 151.93 (2022 high) are views as a corrective pattern. Rise from 127.20 is seen as the second leg of the pattern and could still be in progress. But even in case of extended rise, strong resistance should be seen from 151.93 to limit upside. Meanwhile, break of 137.22 support should confirm the start of the third leg to 127.20 (2023 low) and below.
Exaggerated
Apple lost almost $200bn in market valuation in just two days on the news that China would ban iPhone usage in government offices and state-backed companies. Of course, China is one of Apple’s biggest markets; the company makes roughly a fifth of its revenue from China and it would be a shame to lose market share in such a huge marketplace, but the market has certainly overreacted to the latest news, because Chinese government staff could already not show up at work with their iPhones. So, the chances are that, if you are a government worker in China, you already didn’t have an iPhone! In this respect, an analyst at Wedbush highlighted that the ban would affect around half a million iPhones over the roughly 45 mio that he expects the company to sell in China over the next 12 months. That’s around a 1% hit. Another analyst at Evercore ISI said that the government wouldn’t got too hard on Apple either, as even if Apple moves production toward India, today, most iPhones are still assembled in China, and making Apple angry would cause many job losses, and that Xi is not in a position to afford today. Unfortunately for Apple, its iPhones lost market share from 20% to 16% between the first and the second quarter of this year, but iPhones market share stands at 65% of the smartphones worth more than $600 in China, according to IDC – cited by the WSJ. Huawei, on the other hand, stands for around 18% of the sales of iPhones of a higher price range. Therefore, the latest Apple selloff could be an opportunity for buying a dip. Apple lost almost 3% yesterday, after falling more than 3.5% the day before. The share price is now below $180 per share. 38 analysts on CNN’s business survey point at a median price expectation of around $200 for Apple shares for the next 12-months. The high estimate goes up to $240 per share.
Beyond Apple
When a tech giant like Apple, with a market cap of nearly $2.8 trillion sneezes, the whole market catches a cold. The S&P500 fell for the third day to 4451 yesterday, while Nasdaq 100 slipped below its 50-DMA. Apple selloff also affected suppliers and other mega cap stocks. Qualcomm for example fell more than 7%, while Foxconn remained little impacted by the news.
Zooming out, the US small caps were also under pressure yesterday, the Russell 2000 fell below its 100-DMA and came close to the 200-DMA, as the latest data showed that the US jobless claims fell to the lowest levels since February, defying the latest softness in jobs data. Other data also showed that the labor unit cost didn’t fall as much as expected in Q2. But happily, the US treasuries were not much affected by the latest jobless claims data. The US 2-year yield fell below 5%, although the US dollar index extended its advance toward fresh highs since last March.
The selloff in the Japanese yen slowed against the US dollar. The USDJPY pushed below the 147 mark this morning despite a slower than expected GDP print in Japan in the Q2. Capital expenditure fell 1%, private consumption declined 0.6%, making the case for a softer Bank of Japan (BoJ) more plausible. But the Japanese officials dared traders to continue buying the USDJPY to 150, saying that they would intervene.
The EURUSD sees more hesitation into the 1.07 mark, and into next week’s European Central Bank (ECB) meeting. The base case is a no rate hike, and yesterday’s morose growth figures came to cement the no change expectation. But the economic weakness may have little impact on inflation. Any bad surprise in German inflation due this morning could convince some ECB doves that the European policymakers may announce another 25bp hike when they meet next week.
Interesting data from Sweden today
Market movers today
Today, we get the final German inflation figures. This will hold more information on what lies behind the still quite sticky core inflation in August.
In Sweden, we get lots of interesting data with GDP, production value indicator, and consumption indicator.
The 60 second overview
Overnight, New York Fed president John Williams noted that "I think we've gotten monetary policy in a very good place in terms of we have a restrictive stance of policy" prior to the Fed blackout period commencing tomorrow before the Fed meeting on 20 September. Also, Dallas Fed president Lorie Logan said that "another skip could be appropriate when we meet later this month" but that "skipping does not imply stopping". We and markets expect the Fed to be on hold later this month with markets pricing 2bp for the meeting. The US economy continues to show underlying strength with labour markets still strong. Yesterday, Q2 unit labour cost growth was revised up slightly more than anticipated (2.2%; from 1.6%) and productivity growth picked up significantly from Q1 despite the revision.
Yesterday we received wage figures for Q2 in the euro area. Wage growth measured as compensation per employee increased 5.5% y/y like in the first quarter. While the wage growth is clearly not compatible with the 2% inflation target, it does not point to an imminent wage-price spiral. For an in-depth analysis of the recent changes in the euro area macro environment see our latest euro area macro monitor: Euro Area Macro Monitor: Bye-bye two speed economy. Hello contraction, 7 September.
Equities: Global equities were lower yesterday in a much more classic risk-off rotation than we have seen for long. This also includes lower yields one a day when jobless claims came in rock-solid. Defensives outperformed the group of cyclicals by more than 1% although it is hard to find a direct macro or monetary policy announcement that justifies the magnitude of defensive rotations. Tech led the sell-off, and the size of the sector explains part of the weak cyclical performance yesterday. Again, this was not macro-driven but was a consequence China's decision to expand the iPhone ban to state firms and agencies. Please note most (geo)-political driven sell-offs are typically short-lived compared to macro or monetary driven sell-offs. In US yesterday, Dow +0.2%, S&P 500 -0.3%, Nasdaq -0.9% and Russell 2000 -0.99%. Asian markets are mostly lower this morning after a set of lacklustre Japanese macro data. Futures in US and Europe are flat and mixed this morning.
FI: Global bond yields rallied on the back of weaker sentiment in the equity market and the belief that both the Federal Reserve and ECB are done hiking in this environment. Several of the Federal Reserve officials have recently indicated that US monetary policy is in "a good place". A recent survey on ECB shows that economists are uncertain whether ECB will hike next week or in October. We still believe in 25bp at the meeting in September and then ECB is done. We also expect the Fed to be on hold for now.
FX: EUR/USD is trading around the 1.07 mark as the USD continues its grind higher with both initial and continuing claims declining more-than-expected in the US yesterday. EUR/DKK rose further yesterday and broke the 7.46038 central rate for the first time since 2020. EUR/GBP ended the day broadly unchanged with the BoE's Decision Maker Panel survey showing that both wage growth and inflation expectations have ticked lower the past month.
Credit: The skittish equity markets from Wednesday continued on Thursday, but credit markets roughly held firm on the back of a small rally in the rates space. Itrax main was broadly unchanged at 72.1bp (0.2bp wider) while Itrax Xover widened 1.7bp to close at 403.3bp.
USD/CHF Daily Outlook
Daily Pivots: (S1) 0.8911; (P) 0.8926; (R1) 0.8942; More....
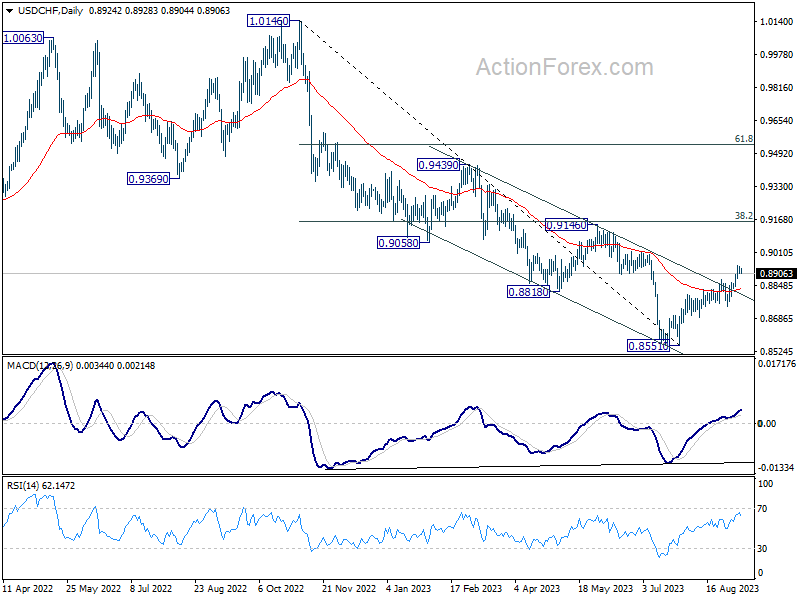
Intraday bias in USD/CHF is turned neutral first with current retreat. Some consolidations could be seen. But further rally is expected as long as 0.8743 support holds. On the upside, above 0.8943 will resume the rally from 0.8551 to 0.9146 cluster resistance next.
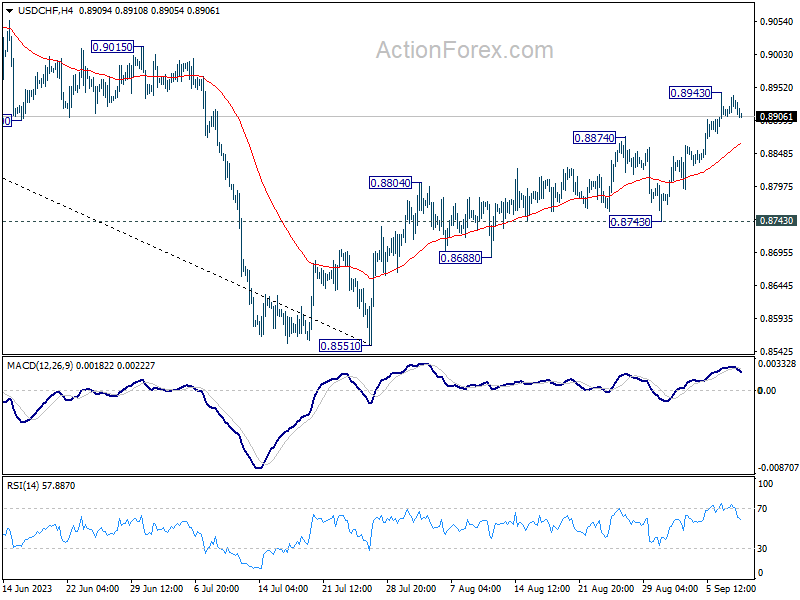
In the bigger picture, rebound from 0.8551 medium term bottom is currently seen as a correction to the downtrend from 1.0146 (2022 high). Further rally would be seen to 0.9146 cluster resistance (38.2% retracement of 1.0146 to 0.8551 at 0.9160). Strong resistance could be seen there to limit upside, at least on first attempt.
Dollar Rally Pauses, Yuan Slides to Year’s Low in Subdued Markets
Asian market trading is subdued today, with Dollar retreating as its recent rally began to lose steam. Notably, overnight remarks from Fed officials didn't provide any fresh cues, reinforcing expectations of a pause in rate hike this month. However, the door remains open for a subsequent rate hike, contingent on incoming data. All eyes now turn to the forthcoming CPI release next week, which could steer the greenback towards its next significant move.
Japanese Yen, fresh off the heels of more verbal interventions by Japanese officials, sought to claw back some losses, albeit with limited success. Momentum waned swiftly, curtailing the currency's rebound. Wile Copper and Chinese Yuan evidenced marked weakness, the Australian dollar held steady within a constricted range, but staying the week's laggard. Canadian Dollar hovered in mixed territory, with investors casting their gaze towards upcoming Canadian employment data. Meanwhile, European currencies floated without a clear directional bias, although British Pound displayed a slightly softer undertone.
Offshore Chinese Yuan emerged as a notable mover in the session, plunging to its lowest level this year. PBoC facilitated this decline by setting its reference rate at a two-month low, showcasing its receptiveness to a lower exchange rate, a stance that contrasts a viewpoint expressed in the state-backed Securities Times. The publication tried to talk up Yuan with an the optimistic view on economic recovery
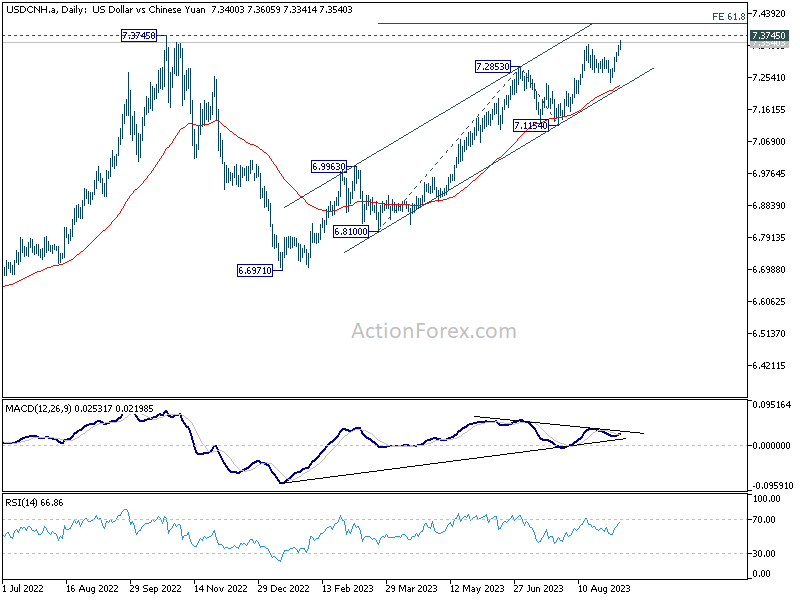
From a pure technical perspectively, USD/CNH is now on track to 7.3756 (2022 high) and possibly above. But strong resistance could emerge at 61.8% projection of 6.8100 to 7.2853 from 7.1154 at 7.4091 to limit upside. A critical juncture to observe would be the authorities' response as USD/CNH approaches 7.4 mark.
In Asia, at the time of writing, Nikkei is down -1.40%. China SSE is down -0.24%. Singapore Strait Times is down -0.53%. Japan 10-year JGB yield is down -0.0099 at 0.648.Overnight, DOW rose 0.17%. S&P 500 dropped -0.32%. NASDAQ dropped -0.89%. 10-year yield dropped -0.0030 to 4.260.
BoC Macklem concerned that inflation progress has slowed
BoC Governor Tiff Macklem said in a speech overnight that 2% inflation target is now in sight". However, he cautioned, "we are not there yet and we are concerned progress has slowed". Also, "monetary policy still has work to do".
In a bid to harmonize the potentially conflicting risks of "under- and over-tightening," BoC opted to hold policy rate at 5% this week. Macklem didn't rule out the possibility of further rate hike, mentioning that such a step might become necessary "if inflationary pressures persist."
As Canada navigates a period riddled with economic uncertainties, the central bank adopts a vigilant stance, closely monitoring an array of indicators to assess the trajectory of inflation. Macklem highlighted the multifaceted nature of the factors affecting inflation data month on month, distinguishing between temporary influences and those with a potential for a lasting impact.
Fed Williams: Still an open question as we go forward
New York Fed President John Williams, engaged in a discussion moderated by Bloomberg yesterday, where he noted that while is "pretty clear we're restrictive" on monetary policy, there remains "still an open question as we go forward."
Williams expressed optimism that "things are moving in the right direction and we've got policy in a good place." However, he insisted on the continuous need to be "data-dependent" and closely watch economic developments to make informed decisions regarding monetary policy trajectory.
He urged for sustained focus on comprehensive data analysis, stating, "We'll have to keep watching the data carefully analyzing all of that and really asking ourselves the question: is this sufficiently restrictive."
Fed Goolsbee foresees change in rate debate focus
Chicago Fed President Austan Goolsbee expressed a cautious optimism in an interview with Marketplace Radio yesterday, noting that the focal point of discussions surrounding interest rates might soon shift.
Goolsbee acknowledged "overall level of inflation is still above where we want to be." Despite the circumstances, he demonstrated a semblance of confidence that "There's a growing confidence that we can pull it off."
However, he asserted that the achievement wasn't set in stone, adding a note of caution: "that's not a guarantee."
Goolsbee foresees a change in narrative in the coming times. Instead of deliberating on the scale of rate hikes, he envisaged that the discourse would gravitate towards the duration for which rates should be maintained at the established levels to steer the economy back on the desired path.
Putting it succinctly, he remarked, "We are very rapidly approaching the time when our argument is not going to be about how high should the rates go."
Elaborating on this, he stated, "it's going to be an argument of how long do we need to keep the rates at this position before we're sure that we're on the path back to the target."
Fed Logan: Skipping in Sep does not imply stopping
Dallas Fed President Lorie Logan remains unconvinced that the central bank has fully "extinguished excess inflation", and "there is work left to do."
With the upcoming FOMC meeting slated for September 19-20, Logan noted "another skip could be appropriate." However, she was quick to add that "skipping does not imply stopping," suggesting that further policy actions might still be on the table.
Logan expressed a consciousness of the dual risks presented at this junction: the peril of sustained high inflation and the danger of dampening the economy too much.
With this in mind, she emphasized, "In coming months, further evaluation of the data and outlook could confirm that we need to do more to extinguish inflation."
Japan cash earnings growth slows to 1.3% yoy, real wages down for 16th month
In July, Japan experienced slowdown in growth of labor cash earnings, recording increase of 1.3% yoy, a figure notably below expectation of 2.4% yoy. This decline comes in the wake of a 2.3% yoy surge in June and a 2.9% yoy hike in May.
Drilling down into the details, while the base annual salary grew 1.6% yoy, outpacing June's 1.3% yoy rise, overtime pay experienced a reduced uplift of 0.5% yoy, a significant deceleration from the 1.9% yoy in June.
One of the more concerning revelations is the continued drop in real wages, which adjusted for inflation, decreased by -2.5% yoy, a deepening from June's -1.6% yoy decline. This marks the 16th consecutive month of falling real wages, spotlighting inability of salaries to keep pace with escalating prices, thereby exacerbating the financial strain on households.
Corroborating this trend is separate data published earlier this week which highlighted a pronounced drop in household spending in July, plummeting -5.0% yoy, marking its most substantial decline in close to two and a half years.
USD/JPY dips briefly after Japan Suzuki's verbal intervention
Japan's Finance Minister Shunichi Suzuki said today that the government is closely watching the currency market's developments with a "heightened sense of urgency." His comments reverberate a growing concern amidst Japanese policymakers about the recent depreciation of Yen.
Suzuki emphasized that "appropriate action" would be taken to counter any excessive volatility, without ruling out any options. The finance minister stressed the government's position that currency movements should remain stable and echo the economic fundamentals Additionally, he rejected the notion that the government has set specific intervention levels in mind.
This vigilance is echoed by Vice Minister of Finance for International Affairs, Masato Kanda, who warned on Wednesday that "all options are on the table" if such fluctuating trends persist, signaling a high readiness to intervene to maintain market stability.
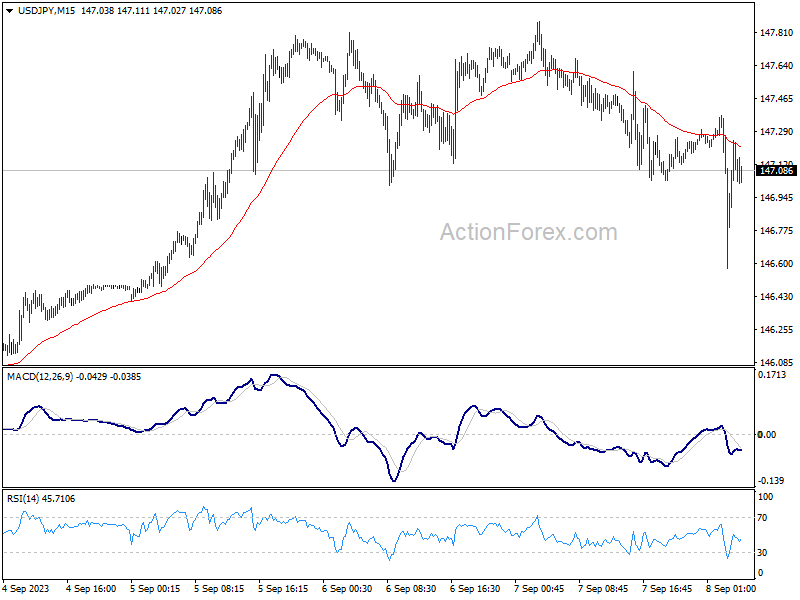
Following the minister's comments, USD/JPY spiked lower to 146.57, but it rapidly recuperated, reclaiming 147 handle shortly after. The current downturn from 147.88 is perceived as a short-term correction as of now. 55 4H EMA is furnishing support at present, with no overt signs pointing towards a trend reversal in the USD/JPY just yet.
Looking ahead
Germany CPI final and France industrial production will be released in European session. Later in the day, major focus will be on Canada employment.
USD/CHF Daily Outlook
Daily Pivots: (S1) 0.8911; (P) 0.8926; (R1) 0.8942; More....
Intraday bias in USD/CHF is turned neutral first with current retreat. Some consolidations could be seen. But further rally is expected as long as 0.8743 support holds. On the upside, above 0.8943 will resume the rally from 0.8551 to 0.9146 cluster resistance next.
In the bigger picture, rebound from 0.8551 medium term bottom is currently seen as a correction to the downtrend from 1.0146 (2022 high). Further rally would be seen to 0.9146 cluster resistance (38.2% retracement of 1.0146 to 0.8551 at 0.9160). Strong resistance could be seen there to limit upside, at least on first attempt.
Economic Indicators Update
| GMT | Ccy | Events | Actual | Forecast | Previous | Revised |
|---|---|---|---|---|---|---|
| 23:30 | JPY | Labor Cash Earnings Y/Y Jul | 1.30% | 2.40% | 2.30% | |
| 23:50 | JPY | Bank Lending Y/Y Aug | 3.10% | 2.80% | 2.90% | |
| 23:50 | JPY | GDP Q/Q Q2 F | 1.20% | 1.40% | 1.50% | |
| 23:50 | JPY | GDP Deflator Y/Y Q2 F | 3.50% | 3.40% | 3.40% | |
| 06:00 | EUR | Germany CPI M/M Aug F | 0.30% | 0.30% | ||
| 06:00 | EUR | Germany CPI Y/Y Aug F | 6.10% | 6.10% | ||
| 06:45 | EUR | France Industrial Output M/M Jul | 0.20% | -0.90% | ||
| 12:30 | CAD | Net Change in Employment Aug | 20.0K | -6.4K | ||
| 12:30 | CAD | Unemployment Rate Aug | 5.60% | 5.50% | ||
| 12:30 | CAD | Capacity Utilization Q2 | 82.50% | 81.90% | ||
| 14:00 | USD | Wholesale Inventories Jul F | -0.10% | -0.10% |
No Significant Changes to Our Australia Growth Forecasts
We have lifted our growth forecast for 2023 from 1% to 1.2% and for 2024 from 1.4% to 1.6%.We see no marked change to the key themes behind our forecasts.
The Australian economy expanded by 0.4% in the June quarter with annual growth slipping from 2.4% to 2.1%.
That was in line with our expectations particularly in light of the partial data we had seen leading up to the announcement.
However, the March quarter result was upgraded from 0.2% to 0.4%.
After reviewing our forecast for GDP growth in 2023 in light of the June quarter data we have lifted our forecast for 2023 from 1% to 1.2% reflecting the March upgrade.
Apart from that we see no reason for any further changes to the GDP forecasts for 2023. Household consumption growth is set to print at 0.3% for both the September and December quarters. This ongoing insipid consumption growth reflects contracting real disposable income as the rising cost of living; an increasing tax burden and higher mortgage rates weigh on households.
Over the course of the next year to June 2024 we expect consumer spending will grow by only 0.8% even as interest rates are expected to remain on hold. Average mortgage rates are set to rise further as cheap fixed rate loans mature and are refinanced at much higher variable rates. While this profile reaches its highest intensity in the second half of 2023 there will still be more modest increases in average rates in the first half of 2024.
The RBA’s recognition of that insipid growth in the year to June 2024 is one factor supporting our call that the first rate cut will come at the August meeting.
In recognition of the resilience of the labour market we recently revised up our profile for employment growth in the second half of 2023, boosting household income growth and consumption. We saw no reason for any further upward revision and also maintain our expectation that the labour market will weaken in the first half of 2024 (-0.2% employment growth compared to 0.6% growth in the labour force and a rise in the unemployment rate from 3.7% to 4.5%).
That expected deterioration in the labour market will also resolve some of the mismatch between hours worked and output as firms cut back employment in the face of weak productivity and profitability.
That weakening in the labour market will slow the growth in labour income weighing on consumer spending while the pressures from higher rates and rising tax burden will continue.
We have lifted our forecast for growth in 2024 from 1.4% to 1.6% due to a modest uplift in growth in the second half.
We confirm our expectation that consumer spending will slow to 0.1% per quarter in the first half of 2024 but pick up from 0.7% growth to 0.9% in the second half.
As we have seen in the US a potential risk to this view is if the labour market held up in 2024 lifting incomes and consumption.
The labour market is expected to stabilise in the second half of 2024 around an unemployment rate of 4.5%. We have revised up our forecast for household spending in the second half of 2024 from 0.7% to 0.9%, reflecting an upgraded view on the positive impact on consumption of the introduction of the Stage3 tax cuts; the beginning of the RBA’s rate cut cycle; and some potential for further fiscal stimulus.
For businesses, the June quarter national accounts revealed a significant deterioration in profitability. This was in the broader context of a downturn in national income. Recall that as global commodity prices climbed to record highs in mid-2022, Australia’s annual nominal GDP growth accelerated to 12% in the June quarter 2022 and was still elevated at 9.5% in the March quarter 2023. However, with commodity prices receding from their highs, the terms of trade fell by 7.9% in the June quarter 2023 and nominal GDP contracted by -1.2% in the period, such that annual growth slowed to 3.6%. Company profits took a hit, contracting by 8.6% in the June quarter, to be 6.8% below the level of a year ago. Falling company profits went beyond the mining sector, with non-mining profits reportedly down by around 5% in the latest quarter.
Businesses are expected to respond to the ongoing soft demand conditions with a substantial slowing in plant and equipment investment in the second half of 2023 and 2024. Over the year to the June quarter 2024, plant and equipment investment is expected to contract by 13% following a lift of 6.3% in the year to June 2023. Overall, business investment is forecast to contract by 2.7%, with the drag from equipment being partly offset by solid conditions in infrastructure (+5.4%) and commercial building work (+3.3%).
Cliff Notes: The Enduring Impact of Inflation
Key insights from the week that was.
Q2 GDP for Australia came in as anticipated at 0.4% (2.1%yr). One of the key themes of the report was ongoing weakness in the consumer, household spending eking out a 0.1% gain in Q2. While it was encouraging to see gross disposable incomes rise 1.8% in the quarter, the impact of higher interest costs, tax payments and price increases was material, leaving households’ real disposable income down 0.1% in Q2 and –3% over 2022-23. Households once again had to draw-down on their savings to fund spending, the savings ratio falling from 3.6% to 3.2%. That discretionary spending declined –0.5% as consumption of essentials rose 0.5% highlights the degree of pressure on households’ budgets and the trade-offs having to be made.
With the cash rate now at its peak and inflation gradually abating, real discretionary spending capacity will remain under pressure but likely improve at the margin. Regarding other areas of the domestic economy, business investment rose in response to generous tax incentives and the improved availability of goods, a rise in equipment spending driving the 2.1% gain in new business investment overall. While the outlook for the private sector is clouded, public investment’s strength likely has further to run given the sizeable pipeline of work.
On trade, Australia’s current account surplus narrowed from $12.5bn in Q1 to $7.7bn in Q2. This was primarily driven by a pull-back in the terms of trade, -7.8% in Q2. In real terms however, the lift in export volumes (+4.3%) outpaced that of imports (+0.7%), leading net exports to contribute a sizeable 0.8ppts to GDP growth in Q2.
As discussed by Chief Economist Bill Evans, the RBA’s decision to leave policy unchanged for a third consecutive month was hardly a surprise given the constructive data flow of late. Given the growing evidence around moderating wage pressures, persistent weakness in consumer spending and some tentative signs of a softening in labour market conditions, the Board’s concern over upside risks to inflation should continue to fade. Westpac remains of the view that as these dynamics evolve and growth holds firmly below trend, there will be scope for the RBA to shift towards a rate cut cycle beginning in August 2024, to ensure GDP growth can sustainably return to trend as inflation nears target in 2025.
Offshore, North America was the focus.
The Bank of Canada kept rates steady at 5.0% at their September meeting, but voiced a hawkish bias. Of note, the statement mentioned they are “prepared to increase the policy interest rate further if needed”. This is in contrast to their January meeting statement when the Bank believed the hiking cycle had most likely been concluded, commenting "If economic developments evolve broadly in line with the MPR outlook, [the] Governing Council expects to hold the policy rate at its current level while it assesses the impact of the cumulative interest rate increases." September’s more hawkish tone points to greater sensitivity to upside inflation risks which is likely to remain until inflation risks fully abate. The statement also referred to persistent underlying inflation pressures which pushed headline inflation from 2.8%yr in June to 3.3%yr in July. The Canadian economy meanwhile contracted 0.2% annualised in Q2, bringing the annual growth rate down to +1.1%yr at June compared to the BoC's forecast of 1.7%yr back in July. Weak growth should see inflation cool over the months ahead, allowing the central bank to remain on hold. However, there are risks the CPI will remain stubbornly above target.
The US Federal Reserve's September Beige Book and the August ISM non-manufacturing survey was consistent with a sanguine outlook for the US economy. The Beige Book reported that consumer spending on tourism was strong while non-essential retail spending slowed. Auto sales were an exception; however, this strength was seen as a consequence of improved supply. Many districts reported that spending was likely being financed by credit versus income, arguing for a pull-back in consumption growth soon, particularly given the recent rise in consumer credit delinquencies and as student loan repayments recommence. Job growth was also seen as subdued across the nation, and contacts in nearly all districts signalled an intention to slow wage growth “in the near term”. For business, profit margins reportedly fell in several districts, highlighting an emerging lack of pricing power amongst businesses.
The ISM non-manufacturing PMI for August was an above expectations result, the headline index rising to 54.5 with gains across the board except for the backlog of orders. These results and the optimism reported by respondents implies moderate to solid growth can continue for the foreseeable future. Notably, the prices paid component of ISM services increased 2.1pts after an even larger jolt higher in the manufacturing PMI prices series last week. The market took both results as a signal of renewed US consumer inflation risk. However, per the Beige Book, if businesses are increasingly finding it difficult to pass cost increases on, the impact on CPI inflation should be negligible, or at least slow to come through. Lastly, ISM services employment saw a 4pt gain, but the PMI index remained below the long run average. On a multi-month view, this survey is still consistent with job creation slowing to a rate consistent with balance between demand and supply.
This week, we also updated our US growth outlook (PDF 41KB) following stronger than expected consumption growth in June and July. Annual growth in 2023 and 2024 has been revised up from 1.0%yr in both years to 2.0%yr and 1.3%yr. Our early estimate for 2025 is also benign at 1.5%yr. Less downside risk for GDP growth argues for the FOMC taking their time in easing policy. So, while we still expect the first rate cut from the FOMC in March 2024, the pace of rate cuts is no longer expected to accelerate thereafter. Instead we see only one 25bp cut per quarter through to the end of 2025, when the fed funds rate is forecast to be 3.375%, a level modestly above our estimate of neutral. Higher for longer US interest rates will have implications for the Australian dollar. AUD/USD is now seen at USD0.66 end-2023, USD0.70 end-2024 and USD0.73 end-2025. Our New Zealand team subsequently also revised their forecasts for NZD/USD and the NZ 10-year yield.
Technical Outlook and Review
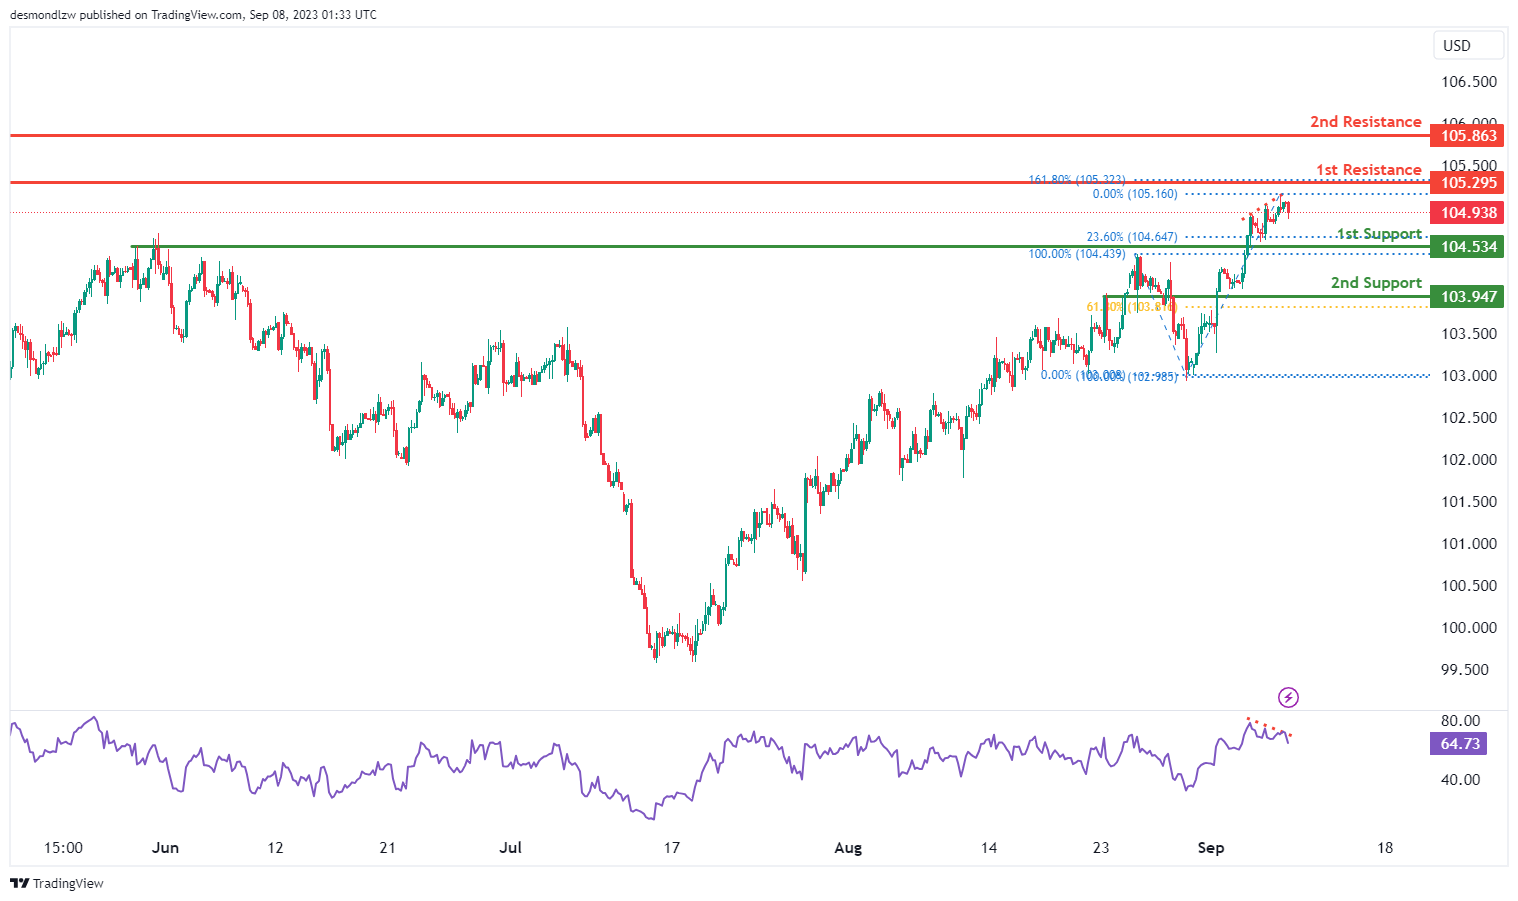
DXY:
The DXY chart presently demonstrates a bearish momentum, indicating a predisposition for further downward movement.
The 1st support level at 104.53 and the 2nd support level at 103.94 are both recognized as overlap supports, underlining their significance in potentially halting price declines.
Conversely, on the resistance side, the 1st resistance at 105.29 is classified as a swing high resistance, while the 2nd resistance at 105.86 also functions as a swing high resistance.
Furthermore, it is worth noting that the Relative Strength Index (RSI) is exhibiting bearish divergence in comparison to the price. This observation implies an increased likelihood of a swift and substantial price decline in the near term.
EUR/USD:
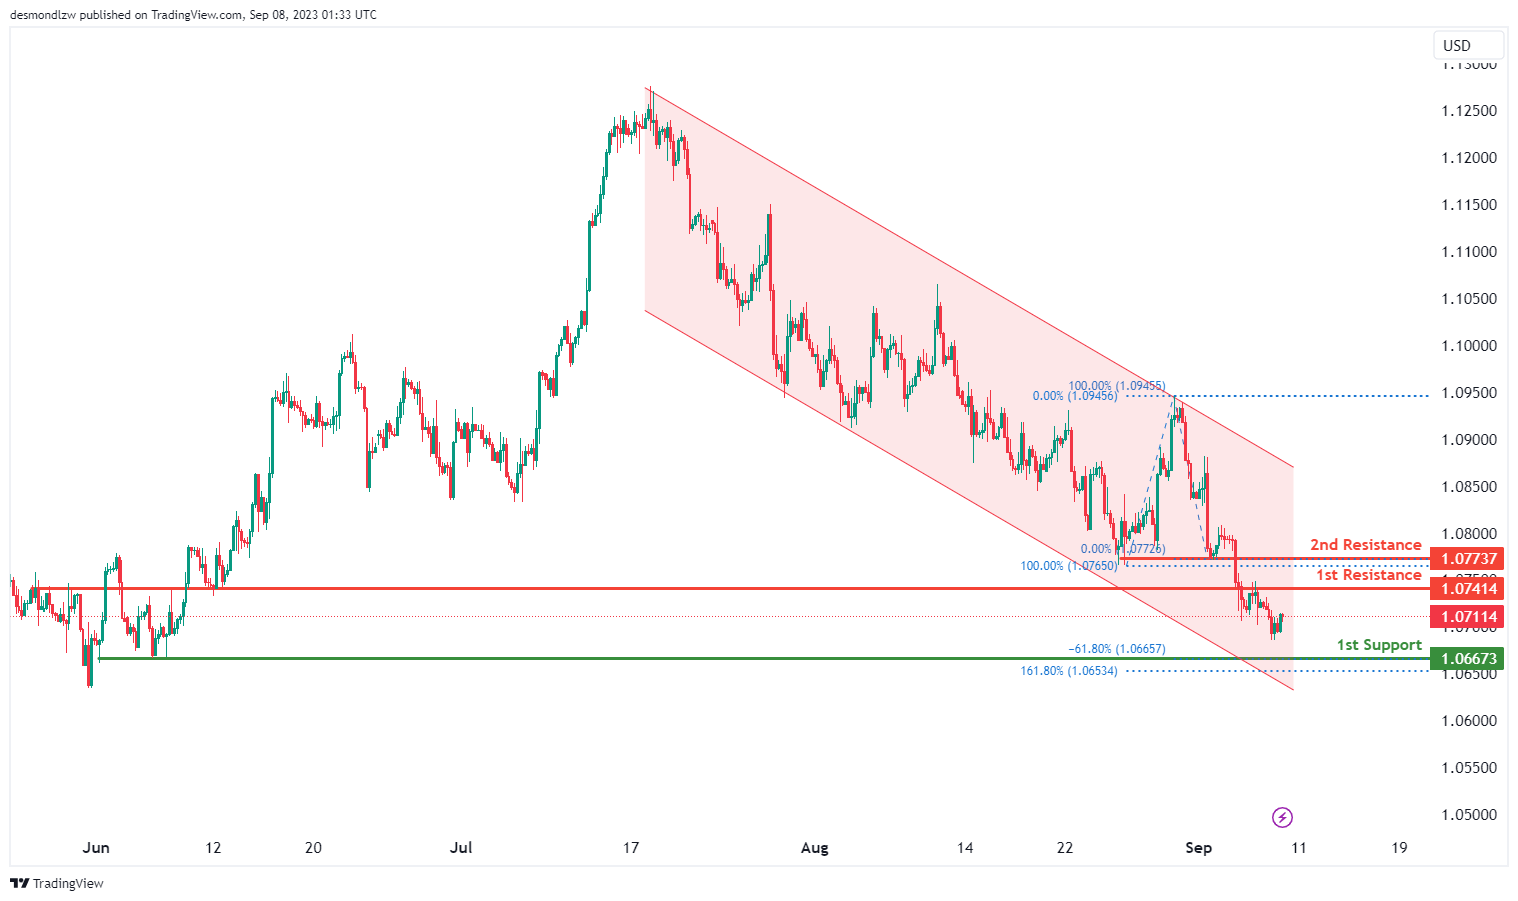
The EUR/USD chart currently maintains a bearish momentum, as indicated by its position within a bearish descending channel.
There’s a potential for a bearish continuation towards the first support level at 1.0667. This support is significant due to its alignment with swing low support, the presence of the 161.80% Fibonacci Extension, and the -61.8% Fibonacci Expansion, indicating a strong Fibonacci confluence.
On the resistance side, the first resistance at 1.0741 is identified as an overlap resistance, while the second resistance at 1.0773 also functions as a pullback resistance. These levels could potentially act as barriers to any bullish movements.
EUR/JPY:
The instrument EUR/JPY currently exhibits a bearish overall momentum on the chart.
In this context, there is a potential for price to have a bearish reaction off the 1st resistance level and drop towards the 1st support.
The 1st support level at 157.10 is considered strong because it represents multi-swing low support.
Additionally, there is a 2nd support level at 156.54, which is significant as it represents an overlap support.
On the resistance side, the 1st resistance level at 157.89 is noteworthy because it serves as an overlap resistance and aligns with both a 50% Fibonacci Retracement and a 61.80% Fibonacci Projection, indicating Fibonacci confluence.
Furthermore, the 2nd resistance level at 158.50 is considered significant as it represents multi-swing high resistance and aligns with a 50% Fibonacci Retracement.
EUR/GBP:
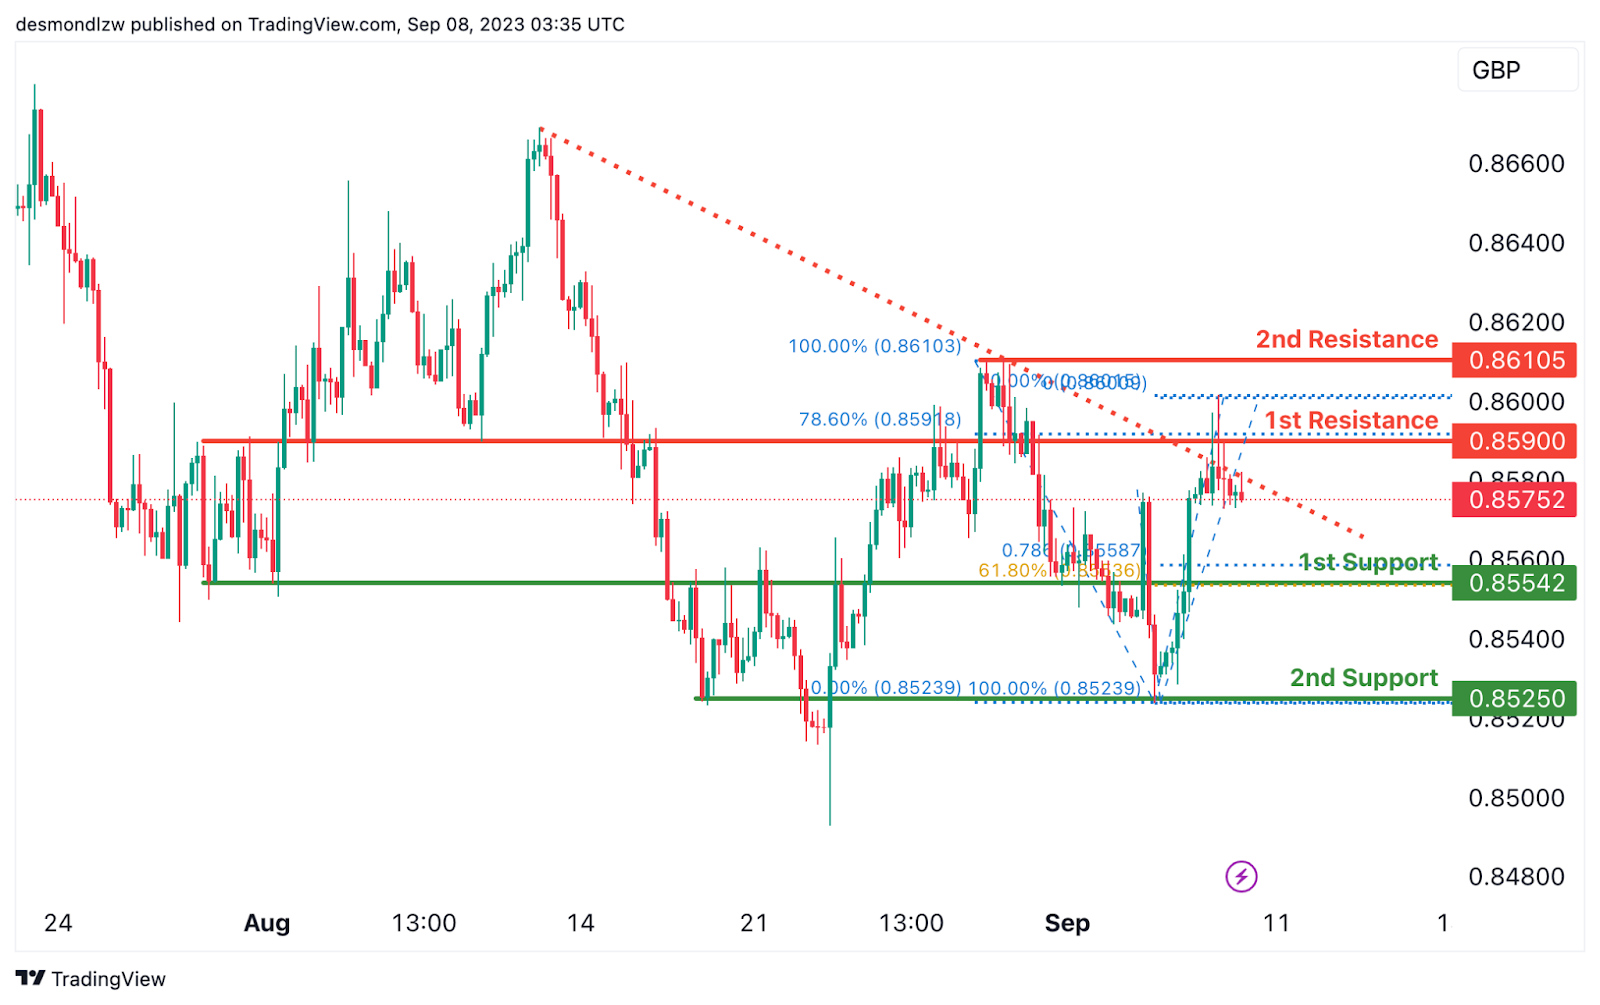
The instrument EUR/GBP currently has a bearish overall momentum, and this momentum is influenced by the fact that the price is below a major descending trend line, indicating a bearish bias.
In this scenario, there’s a potential for price to continue in a bearish direction towards the 1st support level.
The 1st support level at 0.8554 is considered strong as it represents a pullback support, aligning with the 61.80% Fibonacci Retracement and it coincides with the 78.6% Fibonacci Projection, indicating Fibonacci confluence.
Additionally, there is a 2nd support level at 0.8525, which is significant as it represents an overlap support.
On the resistance side, the 1st resistance level at 0.8590 is noteworthy because it serves as an overlap resistance and aligns with a 78.60% Fibonacci Retracement.
Furthermore, the 2nd resistance level at 0.8610 is considered significant as it represents a swing high resistance.
GBP/USD:
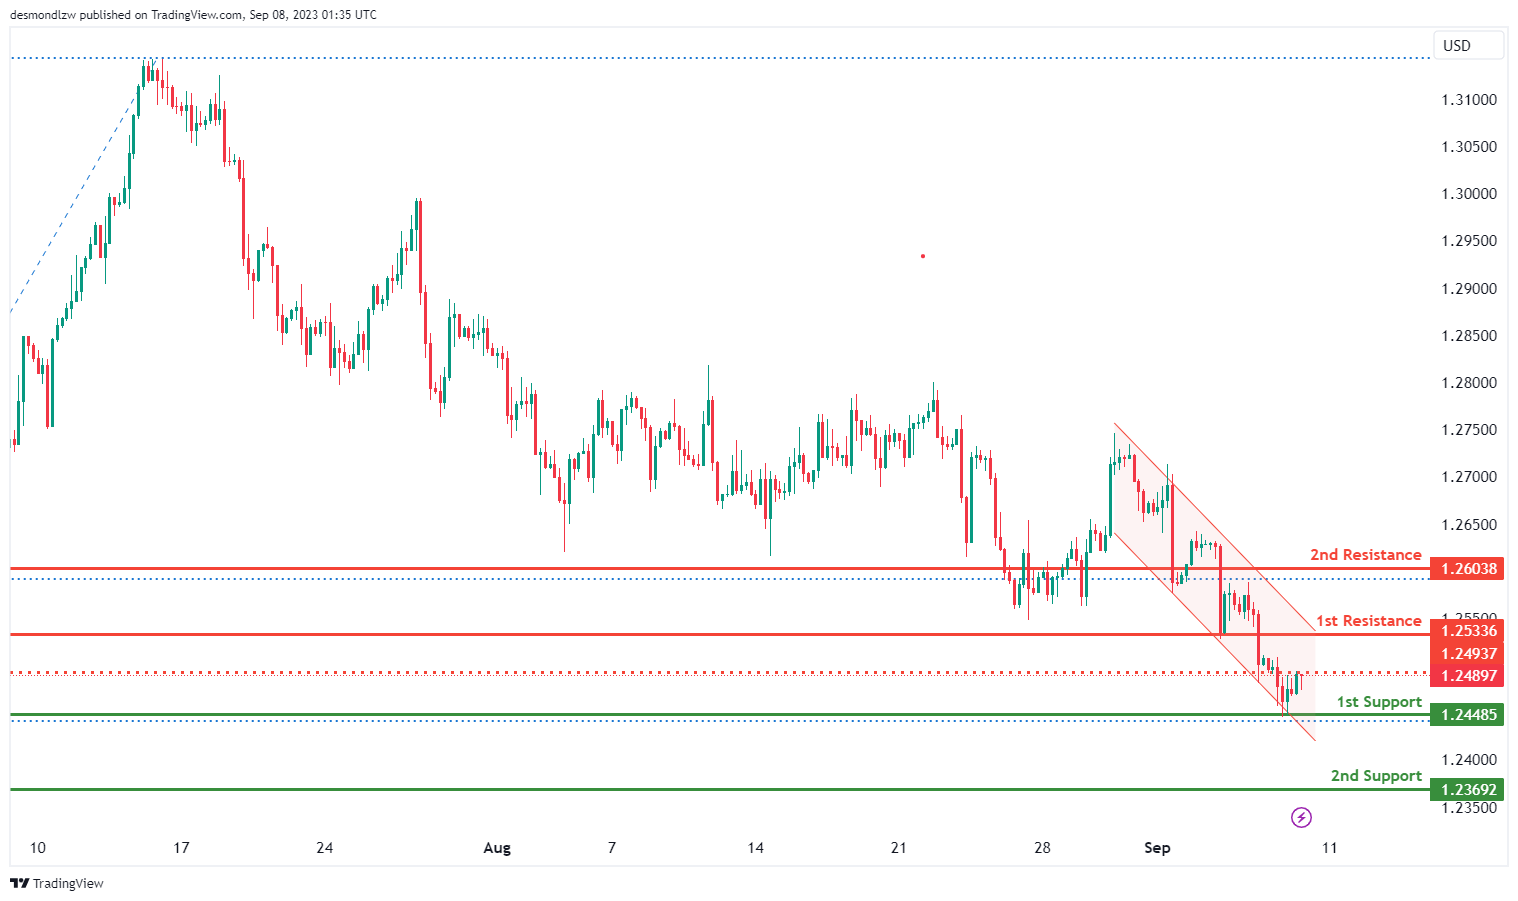
The GBP/USD chart currently exhibits a bearish momentum, characterized by its position within a descending channel.
In the short term, there’s a possibility that the price could rise towards the first resistance level at 1.2533 before potentially reversing off it and dropping towards the first support level at 1.2448.
The first support at 1.2448 is identified as an overlap support and aligns with the 127.20% Fibonacci Expansion, adding to its significance as a potential area of price support.
Another first support at 1.2369 is marked as an overlap support, suggesting that historical price action has found support in this area.
On the resistance side, the first resistance at 1.2533 is designated as a pullback resistance, while the second resistance at 1.2603 is also identified as an overlap resistance. Additionally, there’s an intermediate resistance at 1.2495, marked as a pullback resistance
GBP/JPY:
The instrument GBP/JPY currently has a bullish overall momentum, suggesting that buyers are in control of the market.
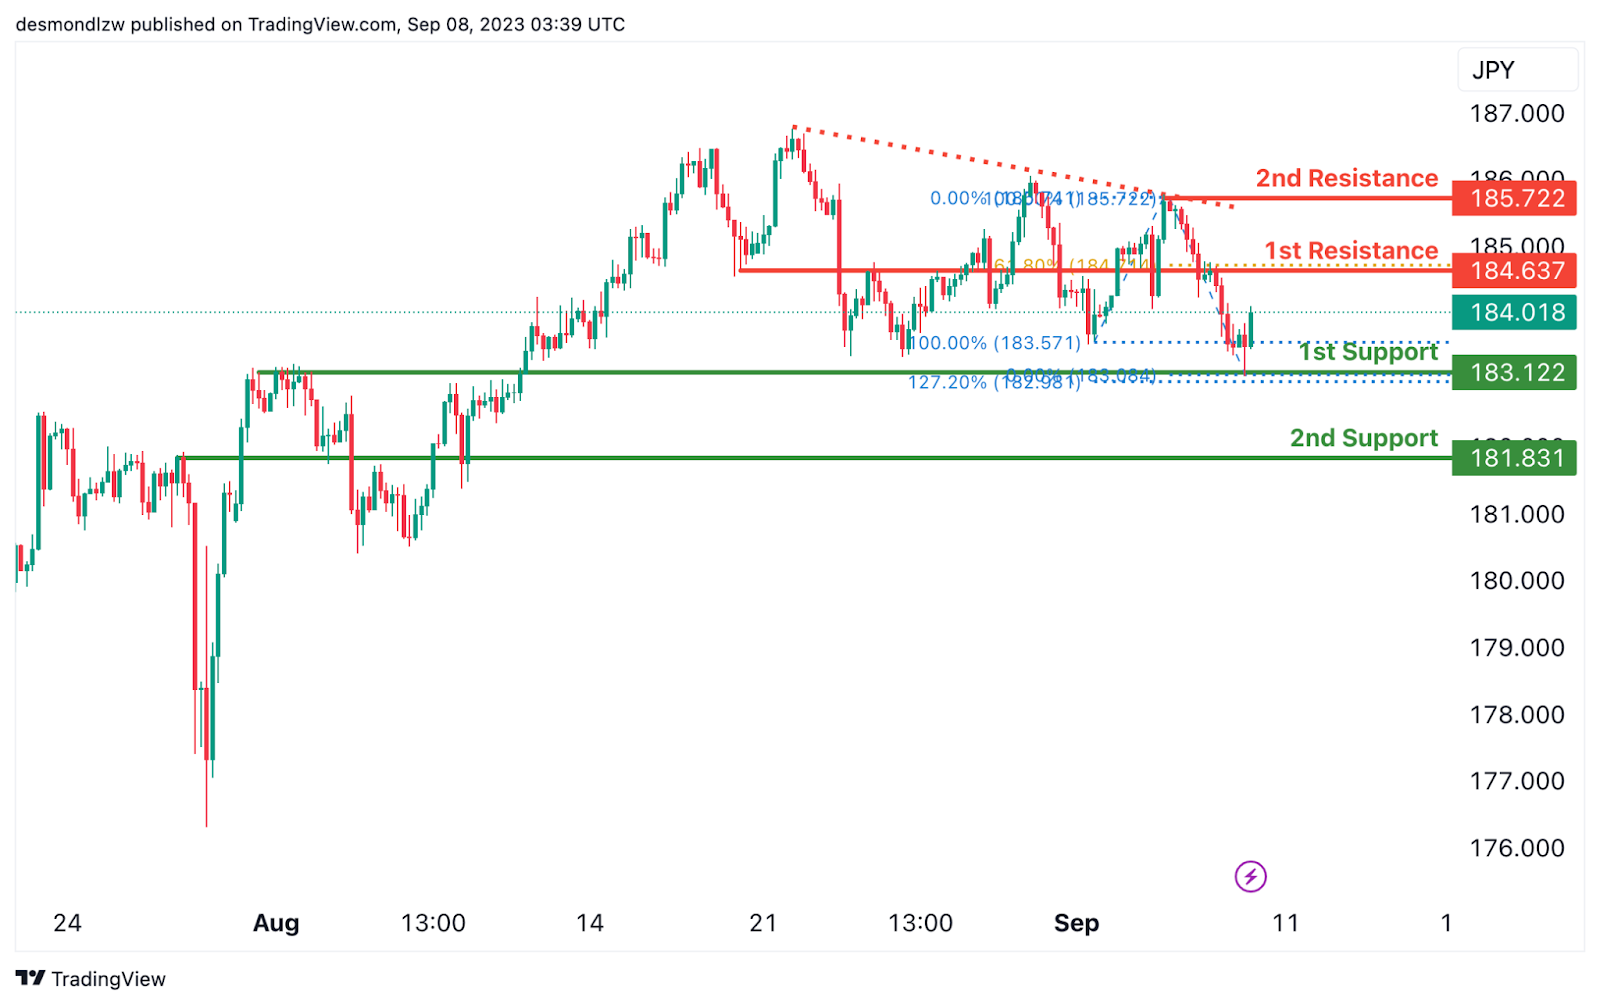
In this scenario, there’s a potential for price to continue its bullish move towards the 1st resistance level.
The 1st support level at 183.12 is considered strong as it represents an overlap support and it aligns with the 127.20% Fibonacci Extension, indicating a potential extension of the previous uptrend.
Additionally, there is a 2nd support level at 181.83, which is significant as it represents an overlap support.
On the resistance side, the 1st resistance level at 184.63 is noteworthy because it serves as an overlap resistance and aligns with a 61.80% Fibonacci Retracement, indicating a potential reversal point.
Furthermore, the 2nd resistance level at 185.72 is considered significant as it represents a swing high resistance.
USD/CHF:
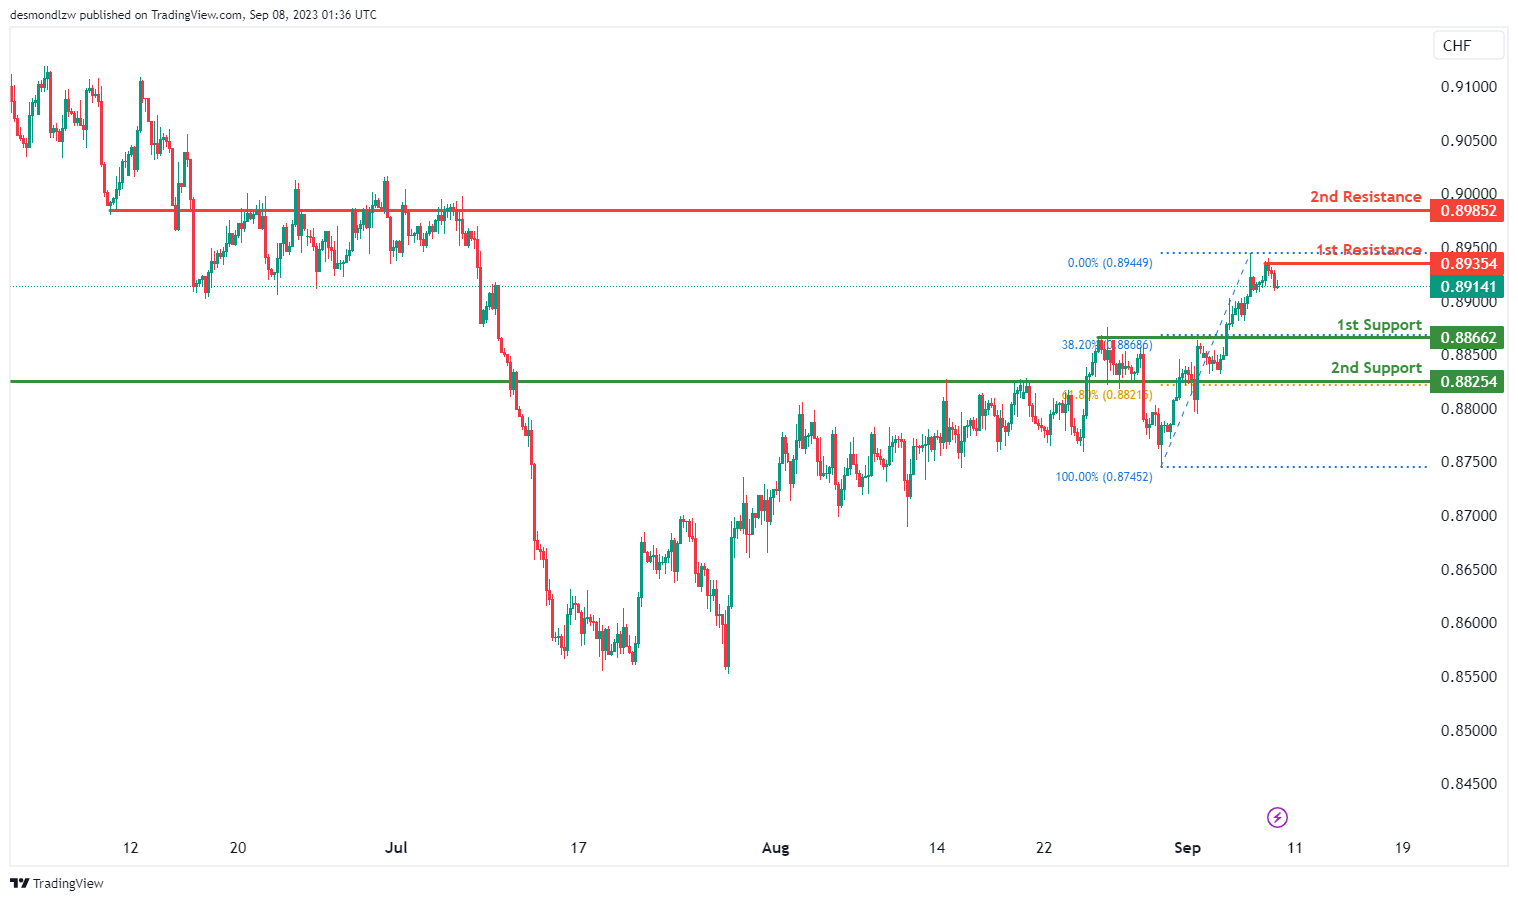
The USD/CHF chart currently demonstrates a bearish overall momentum, suggesting a potential downward trend in price movement.
There’s a likelihood of a bearish continuation towards the first support level at 0.8866, which is identified as a pullback support and aligns with the 38.20% Fibonacci Retracement level.
The second support level at 0.8825 is also noted as an overlap support, aligning with the 61.80% Fibonacci Retracement, reinforcing its importance as a potential area of price support.
On the resistance side, the first resistance at 0.8935 is considered significant as it represents swing high resistance. Furthermore, the second resistance at 0.8985 is identified as an overlap resistance, making it a noteworthy zone for potential price reactions. These resistance levels may act as barriers to any potential bullish movements.
USD/JPY:
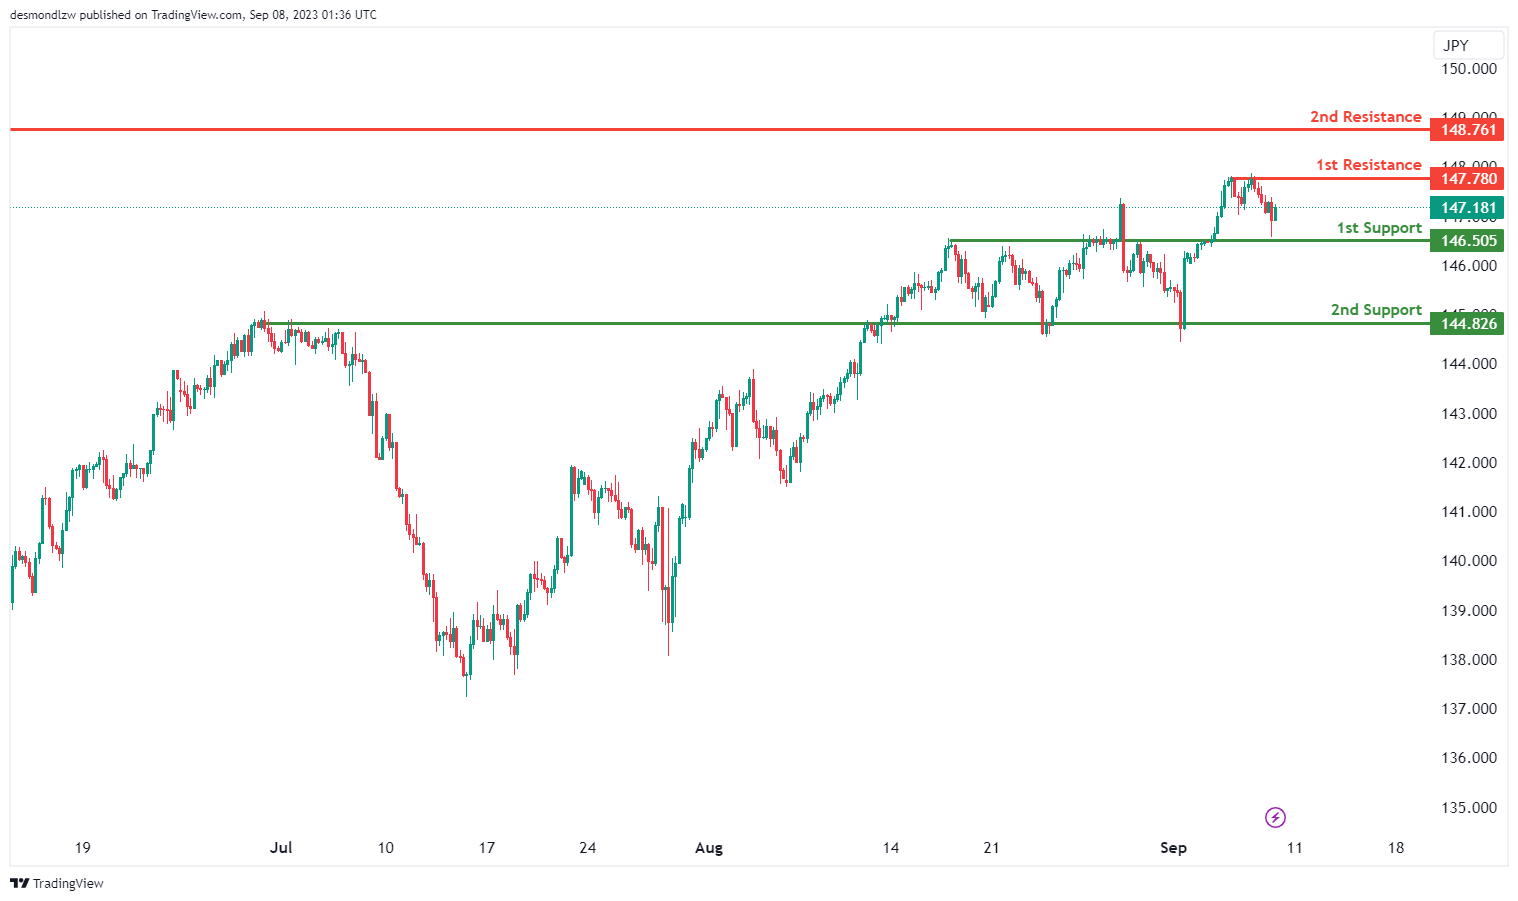
The USD/JPY chart currently maintains a bearish overall momentum. There’s a potential scenario where the price could rise towards the first resistance level at 148.76 in the short term before potentially reversing off it and dropping towards the first support.
The first support at 146.50 is identified as an overlap support, indicating historical instances of price finding support around this level. Similarly, the second support at 144.82 is also noted as an overlap support, further reinforcing its significance as a potential area of price support.
On the resistance side, the first resistance at 148.76 is considered significant as it represents swing high resistance. Additionally, the second resistance at 148.76 is also identified as swing high resistance.
USD/CAD:
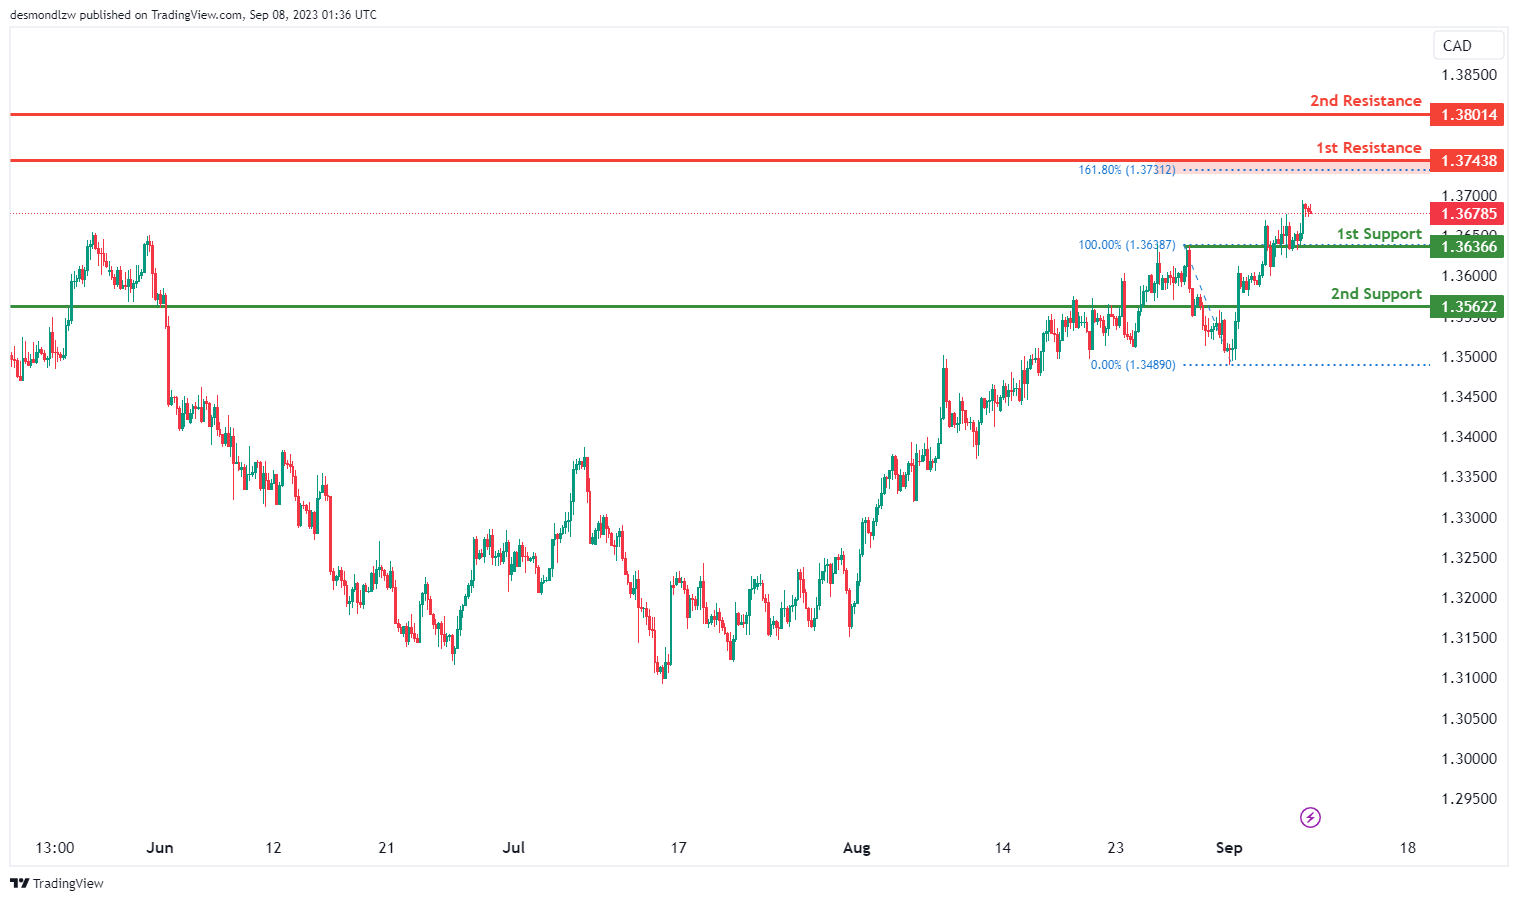
The USD/CAD chart currently indicates a bullish overall momentum, suggesting a potential upward trend in price movement.
There’s a possibility of a bullish continuation towards the first resistance level at 1.3743. This resistance is identified as an overlap resistance and aligns with the 161.80% Fibonacci Extension, signifying a strong potential resistance zone.
On the support side, there are two levels to watch. The first support at 1.3636 is considered significant as it represents an overlap support. Additionally, the second support at 1.3562 is noted as a pullback support, reinforcing its role as a potential area of price support.
Furthermore, the second resistance at 1.3801 is identified as an overlap resistance, which could act as a barrier to any potential bullish movements.
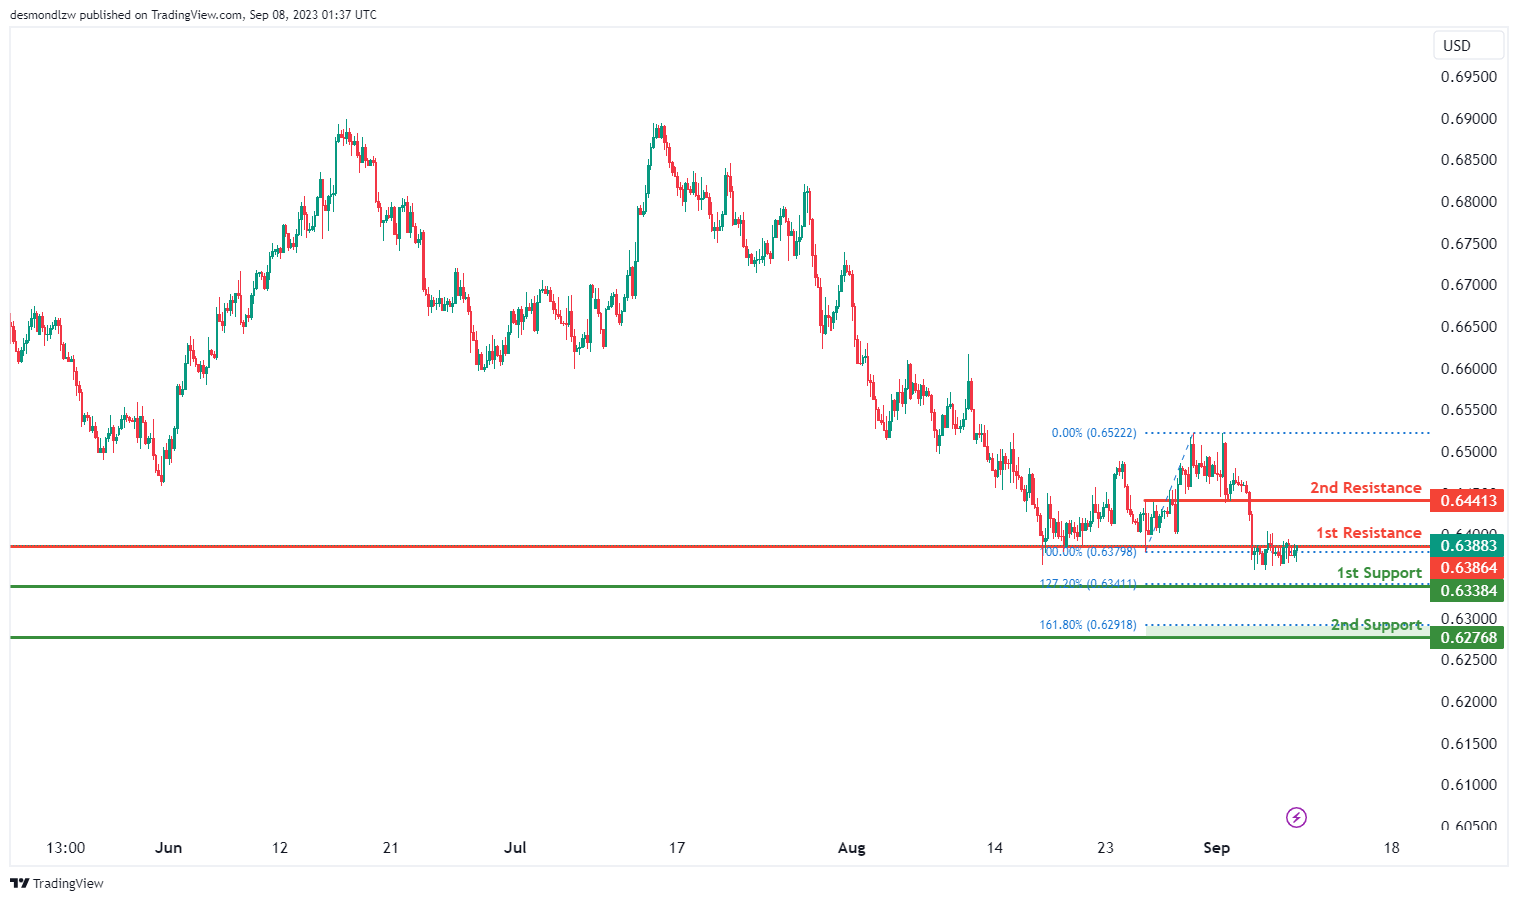
AUD/USD:
The AUD/USD chart currently reflects a neutral overall momentum, indicating a lack of a clear trend in price movement.
There’s a possibility that the price could oscillate within a range defined by the first support level at 0.6338 and the first resistance level at 0.6386.
The first support at 0.6338 is identified as an overlap support and is also aligned with the 127.20% Fibonacci Projection, potentially making it a significant level for price support.
Additionally, the second support at 0.6277 is noted as a pullback support and aligns with the 161.80% Fibonacci Projection, further reinforcing its role as a potential area of price support.
On the resistance side, the first resistance at 0.6386 is considered significant as it represents an overlap resistance, while the second resistance at 0.6441 is marked as a pullback resistance.
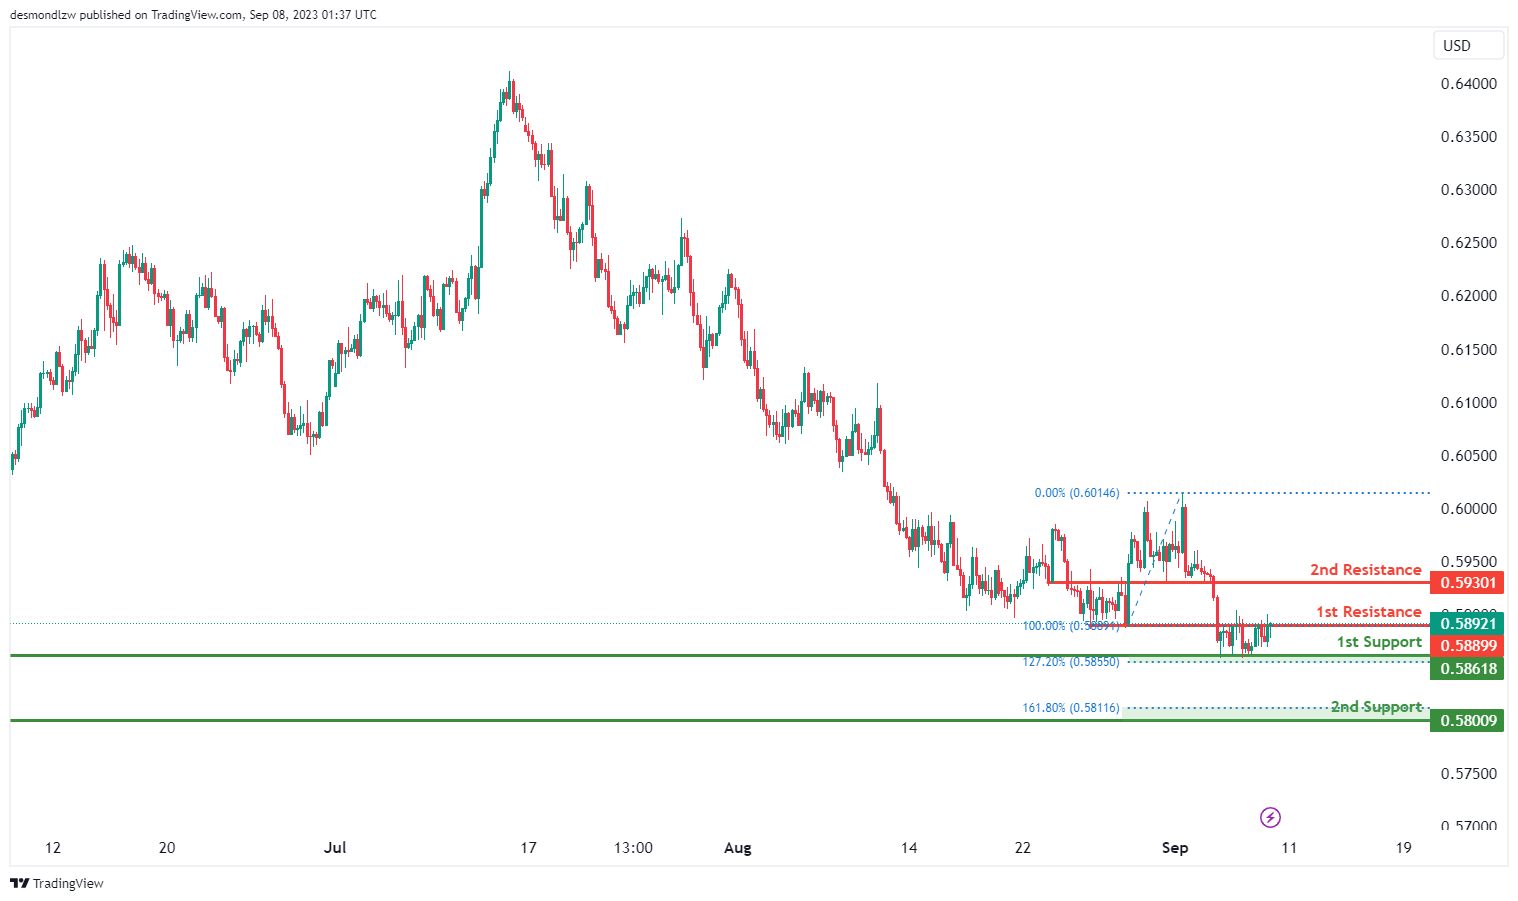
NZD/USD
The NZD/USD chart currently exhibits a neutral overall momentum, indicating a lack of a clear trend in price movement.
There’s a potential scenario where the price may fluctuate within a range defined by the first support level at 0.5800 and the first resistance level at 0.5889.
The first support at 0.5800 is identified as an overlap support and is also aligned with the 127.20% Fibonacci Extension, potentially making it a significant level for price support.
Similarly, the second support at 0.5861 is noted as an overlap support and aligns with the 161.80% Fibonacci Extension, reinforcing its role as a potential area of price support.
On the resistance side, the first resistance at 0.5889 is considered significant as it represents an overlap resistance, while the second resistance at 0.5930 is marked as a pullback resistance.
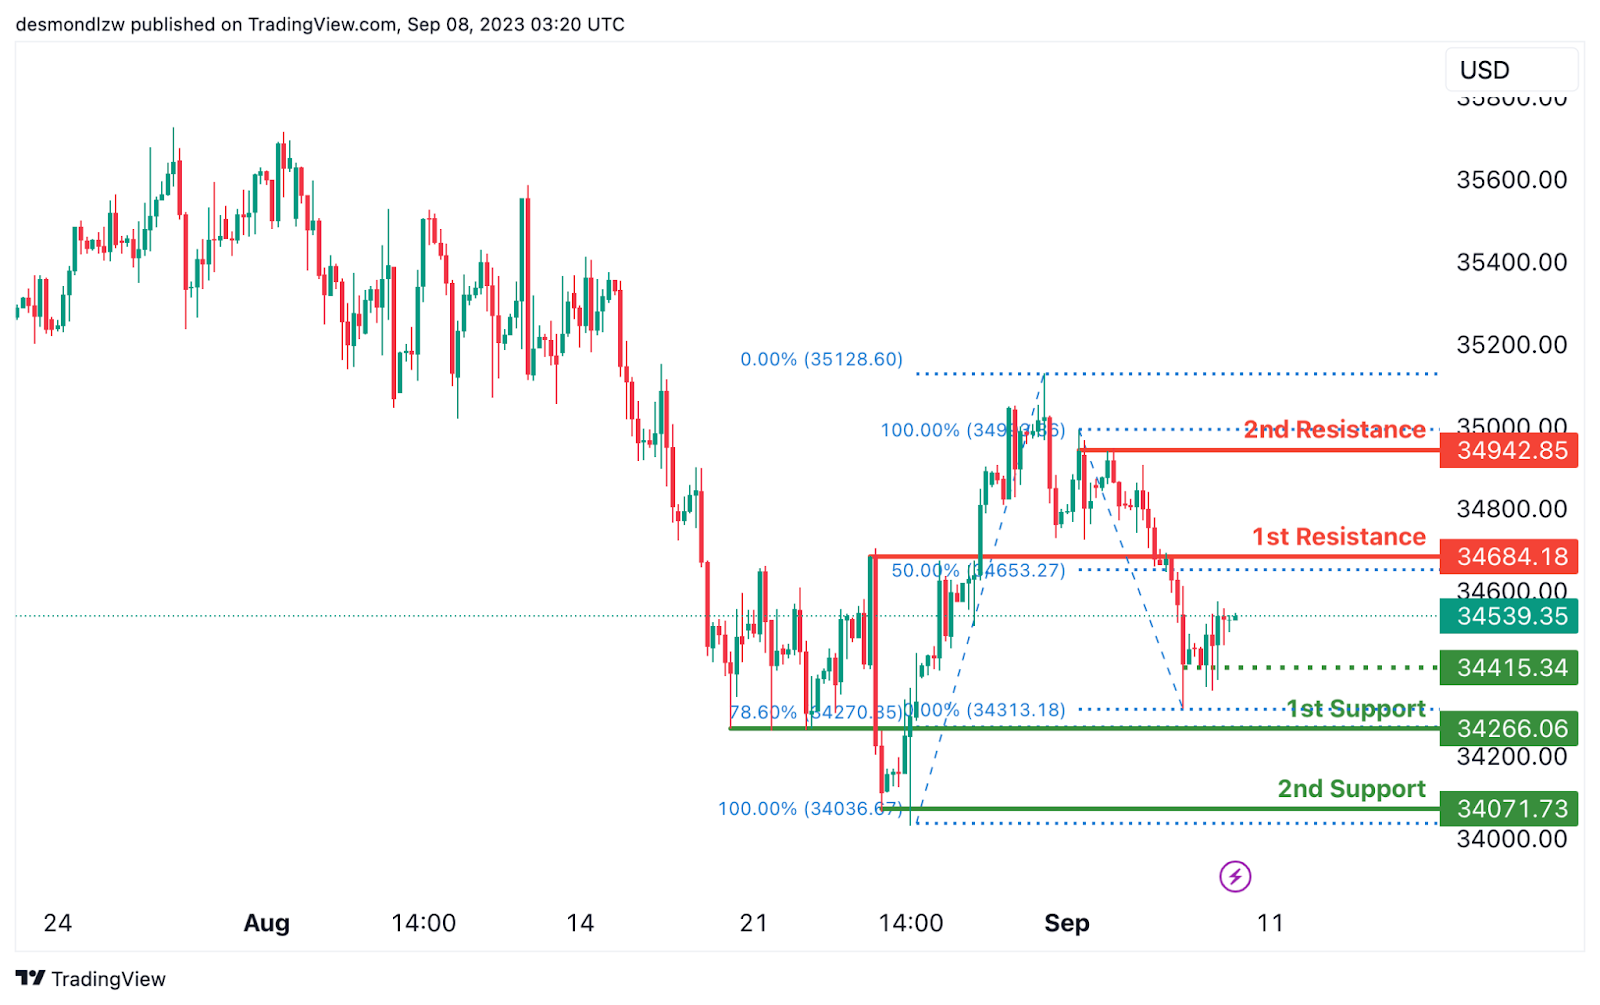
DJ30:
The instrument DJ30 (Dow Jones Industrial Average) currently exhibits a bullish overall momentum on the chart.In this context, there is a potential for price to continue its bullish movement towards the 1st resistance level.
The 1st support level at 34266.06 is considered strong because it represents pullback support and aligns with a 78.60% Fibonacci Retracement.
Additionally, there is a 2nd support level at 34071.73, which is significant as it represents swing low support.
On the resistance side, the 1st resistance level at 34684.18 is noteworthy as it serves as pullback resistance and aligns with a 50% Fibonacci retracement.
Furthermore, the 2nd resistance level at 34942.85 is considered significant as it represents multi-swing high resistance.
An intermediate support level at 34415.34 is also present, which serves as swing low support.
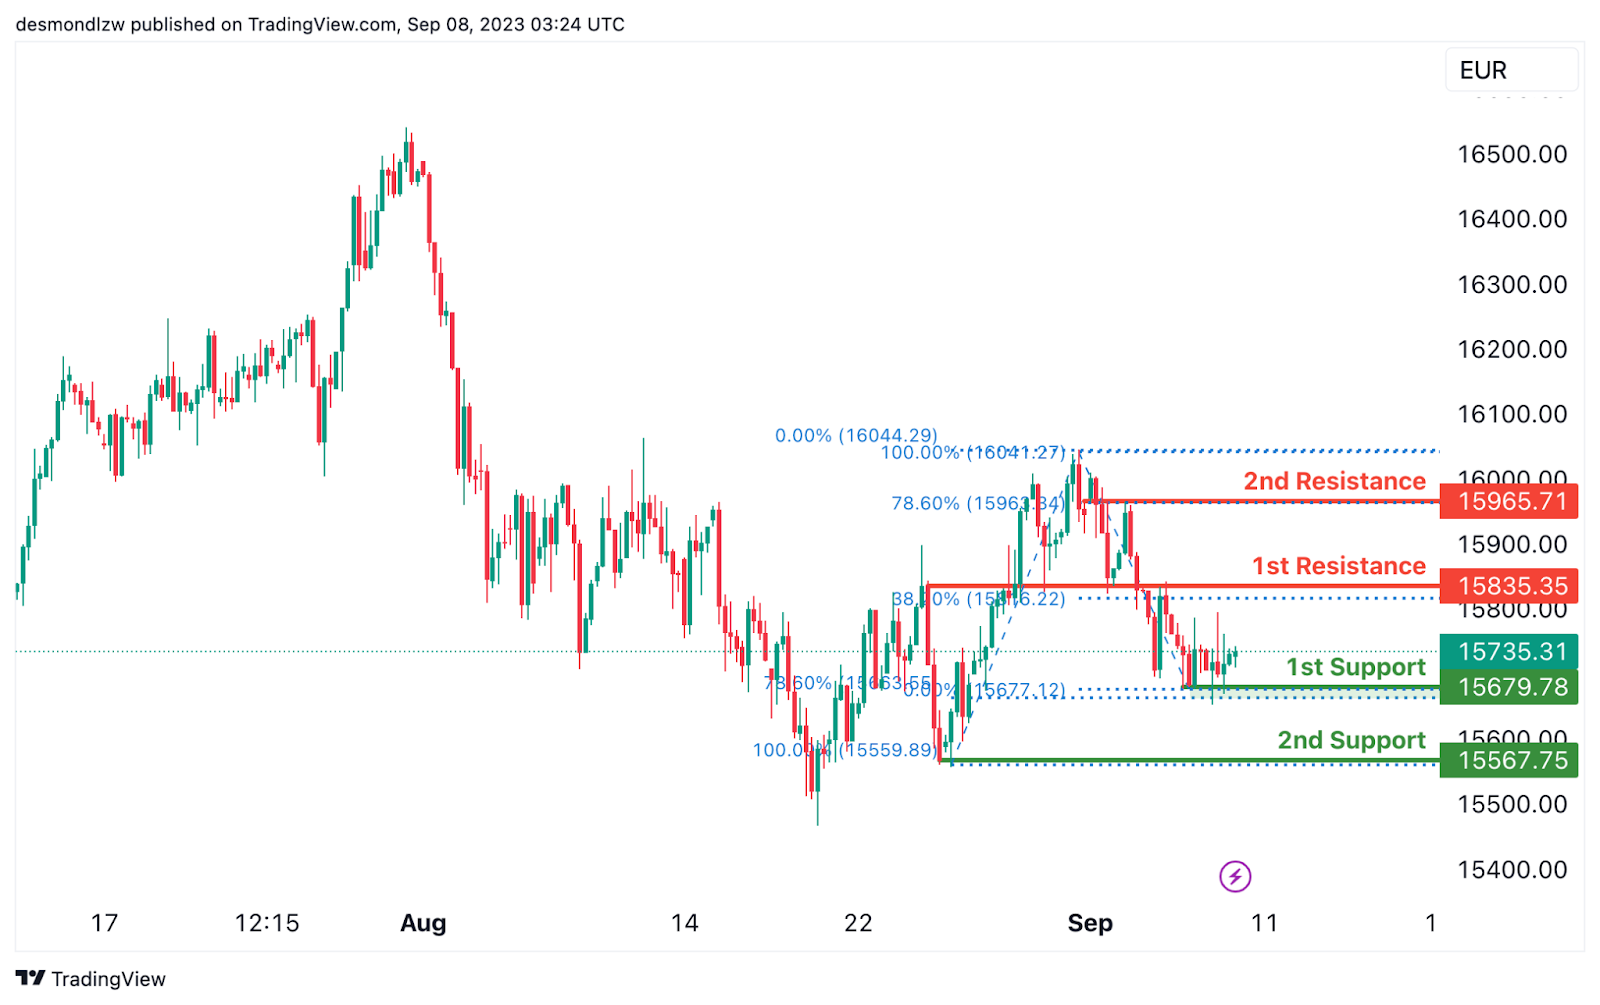
GER30:
The instrument GER30 currently shows a bullish overall momentum on the chart.
In this scenario, there is a potential for the price to continue its bullish movement towards the 1st resistance level.
The 1st support level at 15679.78 is considered strong because it represents swing low support and aligns with a 78.60% Fibonacci Retracement.
Additionally, there is a 2nd support level at 15567.75, which is significant as it represents swing low support.
On the resistance side, the 1st resistance level at 15835.35 is noteworthy because it serves as overlap resistance and aligns with a 38.20% Fibonacci Retracement.
Furthermore, the 2nd resistance level at 15965.71 is considered significant as it represents overlap resistance and aligns with a 78.60% Fibonacci Retracement.
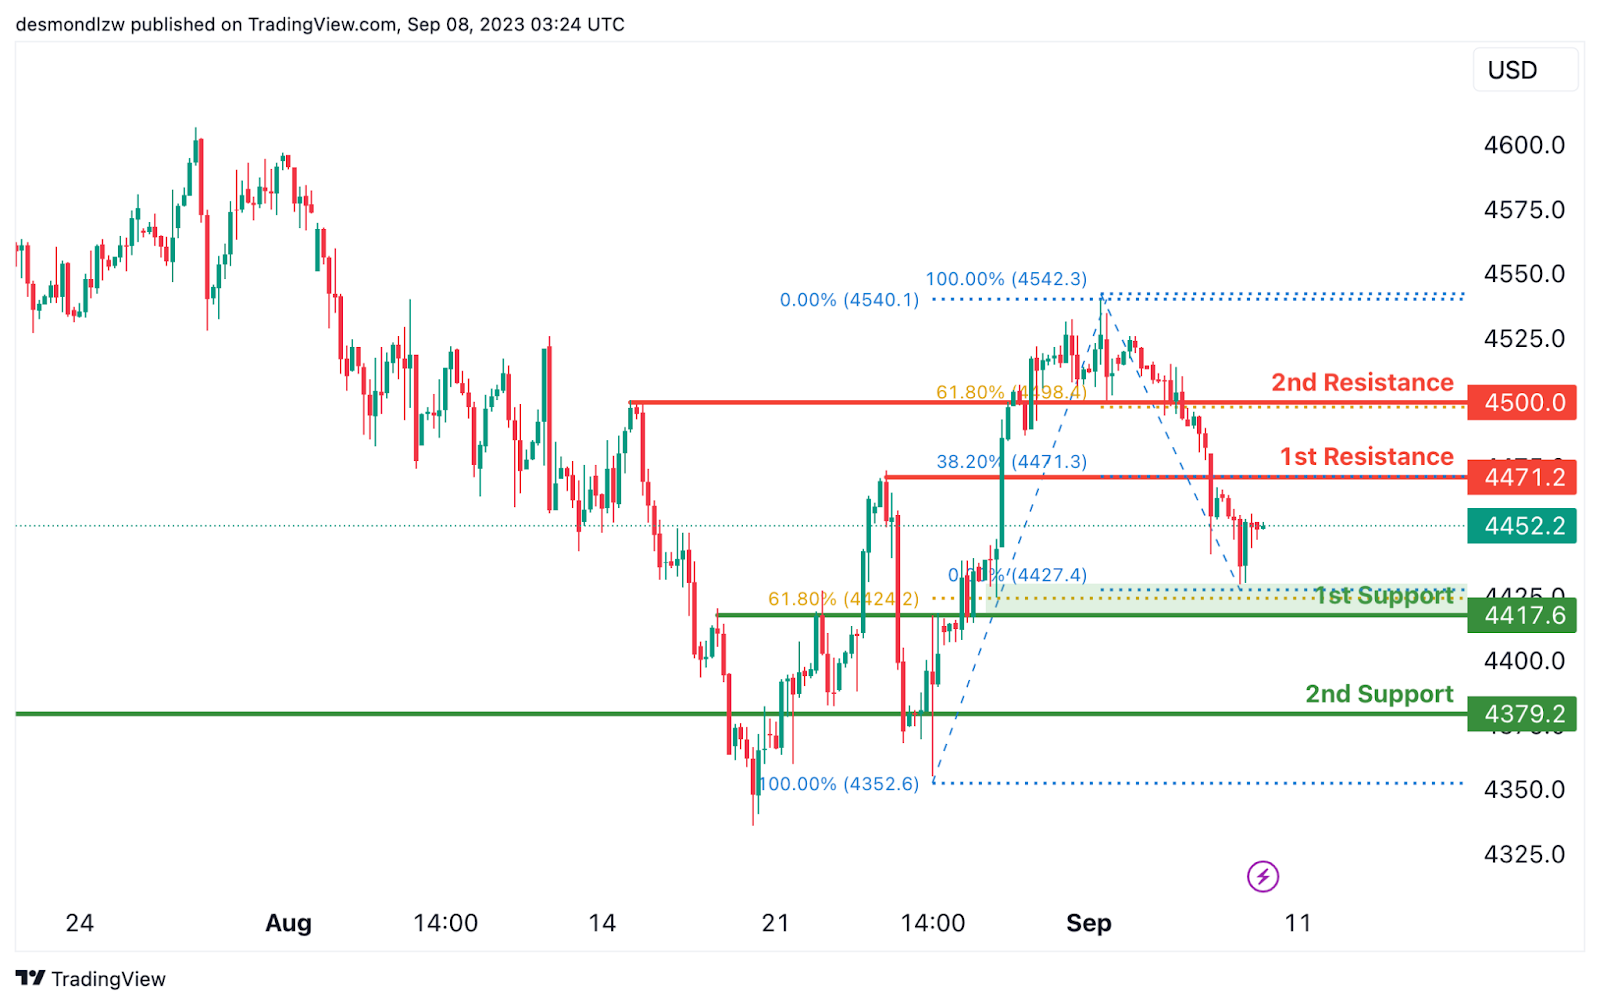
US500
The instrument US500 (S&P 500) currently exhibits a bullish overall momentum on the chart.
In this context, there is a potential for price to continue its bullish movement towards the 1st resistance level.
The 1st support level at 4417.6 is considered strong because it represents pullback support and aligns with a 61.80% Fibonacci Retracement.
Additionally, there is a 2nd support level at 4379.2, which is significant as it represents pullback support.
On the resistance side, the 1st resistance level at 4471.2 is noteworthy because it serves as pullback resistance and aligns with a 38.20% Fibonacci Retracement.
Furthermore, the 2nd resistance level at 4500.0 is considered significant as it represents pullback resistance and aligns with a 61.80% Fibonacci Retracement.
BTC/USD:
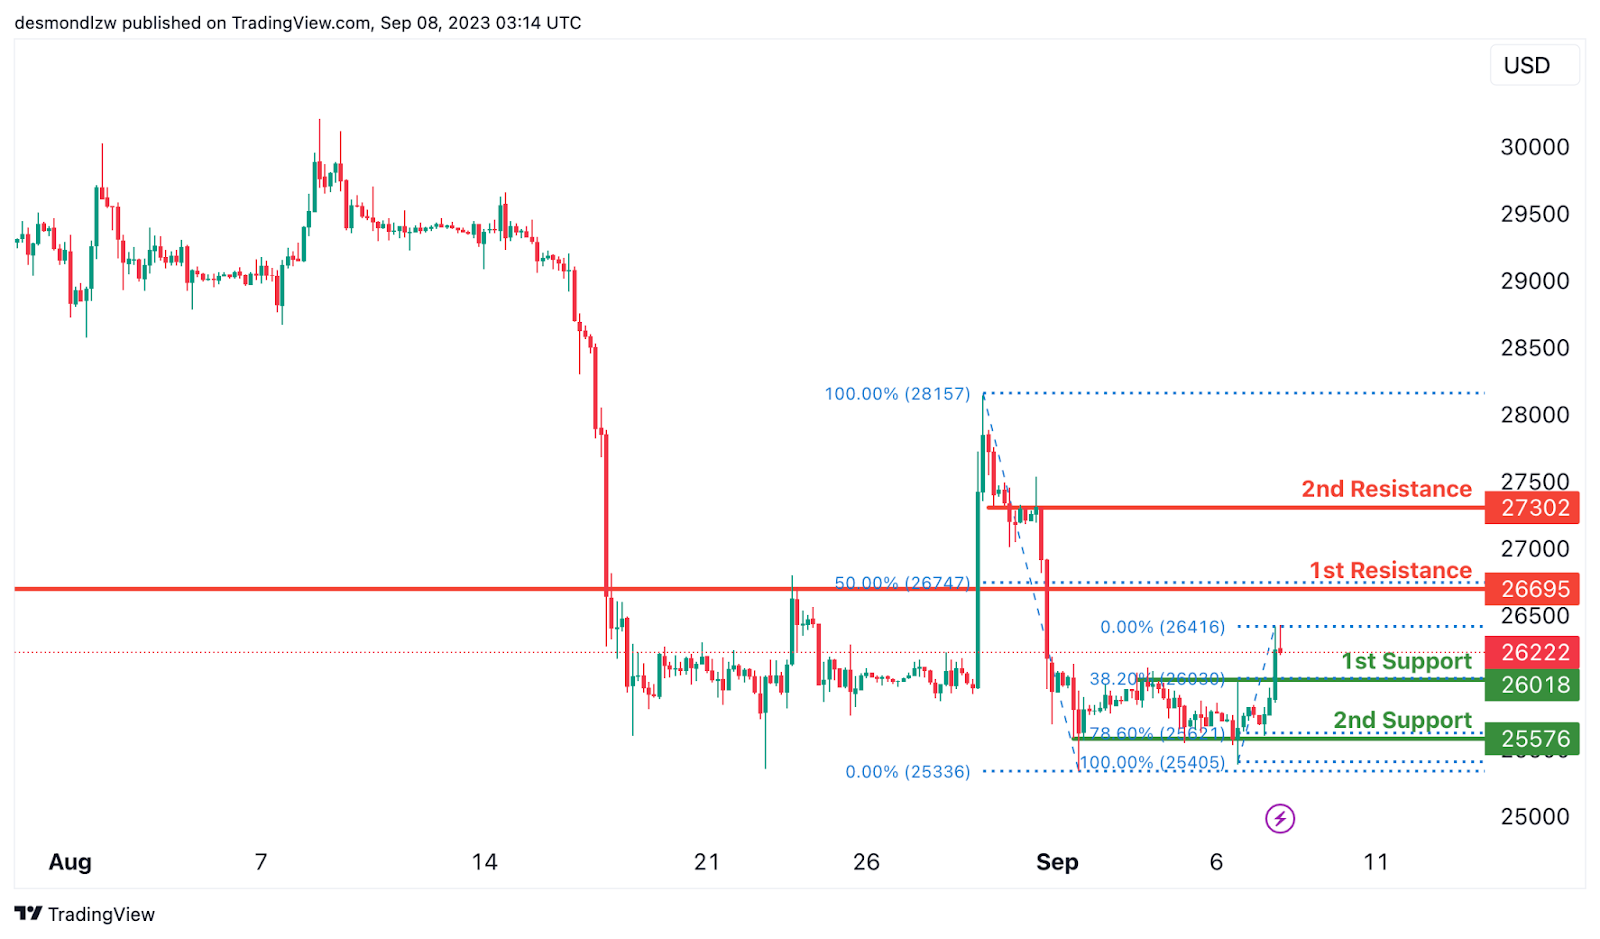
The instrument BTC/USD currently reflects a bullish overall momentum on the chart.
In this scenario, there is a potential for price to temporarily drop further in the short term towards the 1st support level at 26018 before bouncing from that level and potentially rising towards the 1st resistance at 26695.
The 1st support level at 26018 is considered strong because it represents pullback support and aligns with a 38.20% Fibonacci Retracement.
Additionally, there is a 2nd support level at 25576, which is significant as it represents multi-swing low support and aligns with a 78.60% Fibonacci Retracement.
On the resistance side, the 1st resistance level at 26695 is noteworthy because it serves as pullback resistance and aligns with a 50% Fibonacci Retracement.
Furthermore, the 2nd resistance level at 27302 is considered significant as it represents overlap resistance.
ETH/USD:
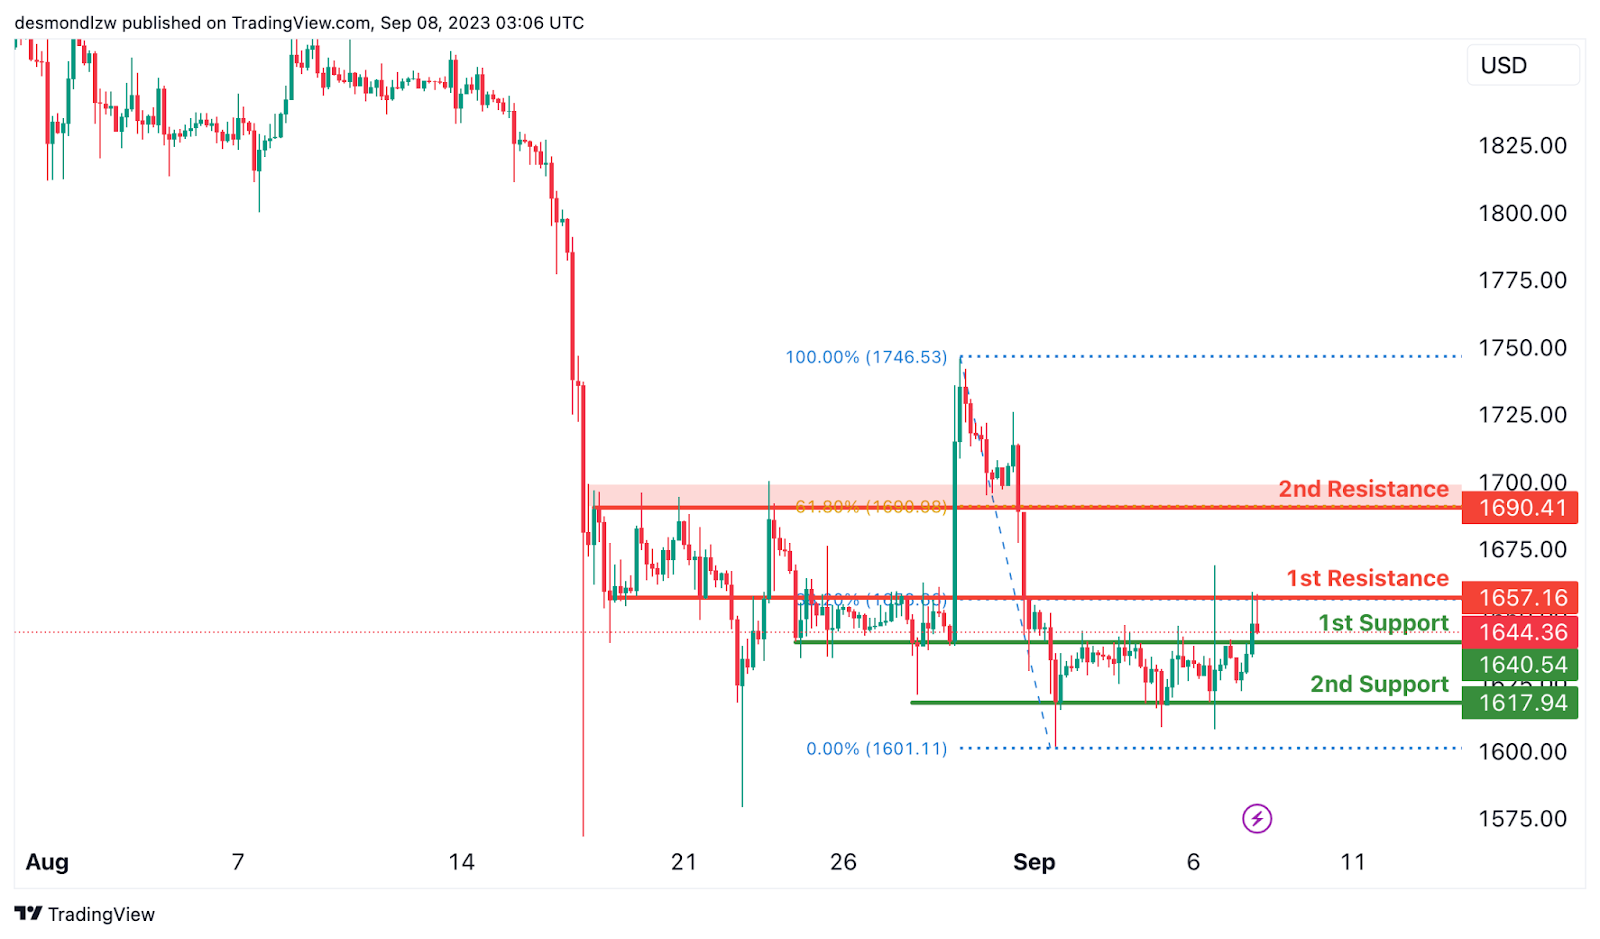
The instrument ETH/USD currently reflects a bullish overall momentum on the chart.
In this scenario, there is a potential for the price to experience a short-term drop towards the 1st support level at 1640.54 before bouncing from that level and potentially rising towards the 1st resistance at 1657.16.
The 1st support level at 1640.54 is considered strong because it represents overlap support.
Additionally, there is a 2nd support level at 1617.94, which is significant as it represents swing low support.
On the resistance side, the 1st resistance level at 1657.16 is noteworthy because it serves as overlap resistance and aligns with a 38.20% Fibonacci Retracement.
Furthermore, the 2nd resistance level at 1690.41 is considered significant as it represents pullback resistance and aligns with a 61.80% Fibonacci Retracement.
WTI/USD:
The WTI chart currently demonstrates a bearish overall momentum, indicating a potential downward trend in price movement.
There’s a likelihood of a bearish continuation towards the first support level at 84.05, which is identified as a pullback support.
Additionally, the second support at 81.64 is noted as an overlap support, suggesting that historical price action has found support in this area.
On the resistance side, the first resistance at 87.15 is marked as an overlap resistance and aligns with the 161.80% Fibonacci Projection, as well as the 61.80% Fibonacci Projection. This confluence of Fibonacci levels adds to its significance as a potential resistance zone.
Furthermore, the second resistance level at 89.26 is considered significant as it represents an overlap resistance, potentially acting as a barrier to any bullish movements in the WTI price.
a href="https://www.actionforex.com/wp-content/uploads/2023/09/icmarkets2023090726.png">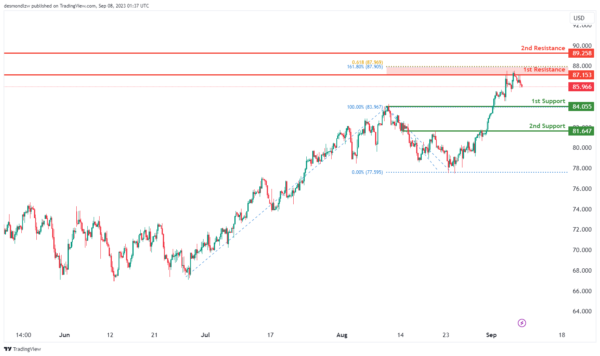
XAU/USD (GOLD):
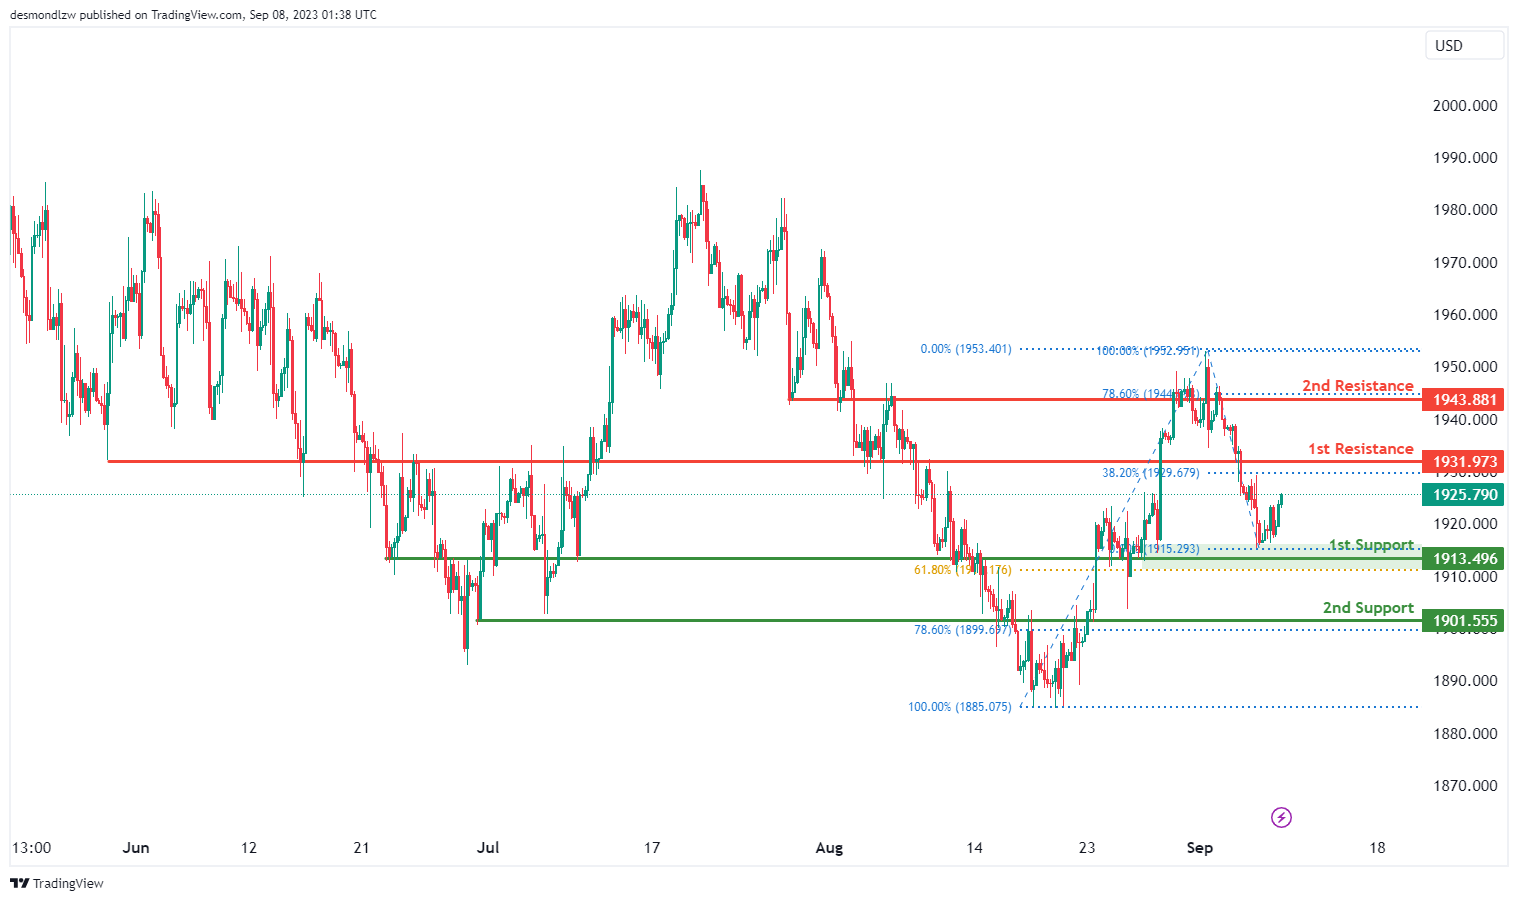
The XAU/USD chart currently displays a bullish overall momentum, suggesting a potential upward trend in price movement. There’s a likelihood of a bullish continuation towards the first resistance.
The first support at 1913.49 is considered strong as it represents an overlap support and aligns with the 61.80% Fibonacci Retracement level, reinforcing its significance as a potential area of price support. Similarly, the second support at 1901.55 is also noted as an overlap support, aligning with the 78.60% Fibonacci Retracement, further enhancing its importance as a potential support zone.
On the resistance side, the first resistance at 1931.97 is marked as a pullback resistance and aligns with the 38.20% Fibonacci Retracement, making it noteworthy. The second resistance at 1943.88 is identified as an overlap resistance and aligns with the 78.60% Fibonacci Retracement, further enhancing its potential as a resistance level.