Sample Category Title
USD/CAD Analysis: How the Bank of Canada Decision Affected the National Currency
Yesterday it became known that the Bank of Canada (BOC) decided to keep the rate at 5% — the highest level in 22 years.
Here are the key takeaways from CEO Tiff Macklem's press conference:
→ excess demand is declining, but the BOC is remaining concerned about persistence of high inflation;
→ the labor market is gradually calming down, but wage growth remains high;
→ second-quarter GDP contraction attributed to a noticeable slowdown in consumption growth, a slowdown in housing market growth and the impact of wildfires across the country.
Although the decision to leave the rate unchanged is a move that economists expected in a Bloomberg survey, there has been some spike in volatility in the foreign exchange market. The first emotional reaction of market participants led to the depreciation of the CAD against other currencies. But at the end of the day, the Canadian dollar strengthened — apparently, market participants still see positive in the prospects of the Canadian economy, taking into account the statements of the head of the Bank of Canada.
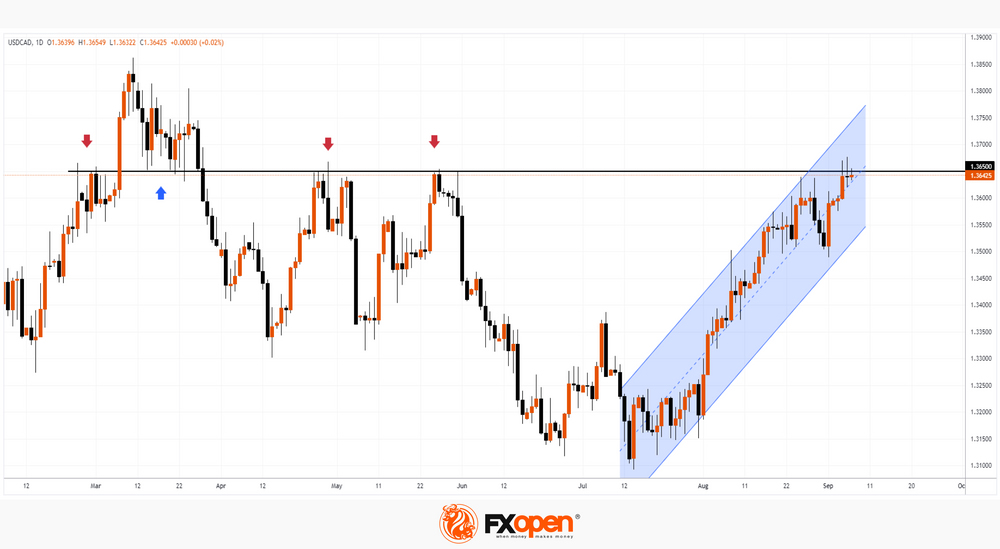
At the same time, an interesting situation is emerging on the USD/CAD chart – the rate has declined from the important level of 1.365, from which reversals were repeatedly formed earlier this year (as the arrows show). What can we say about the formation of another bearish reversal?
→ Long upper shadows on candles on September 5-6;
→ the two tops inside yesterday only slightly exceeded the top on September 5, which may indicate demand exhaustion and bear traps.
However, USD/CAD is in an uptrend (shown by the blue channel). And a scenario is not ruled out, in which the resistance of 1.365 will only cause a rollback within the channel. In this case, testing of its lower bound may occur.
This article represents the opinion of the Companies operating under the FXOpen brand only. It is not to be construed as an offer, solicitation, or recommendation with respect to products and services provided by the Companies operating under the FXOpen brand, nor is it to be considered financial advice.
Japanese Yen Takes Aim at 148
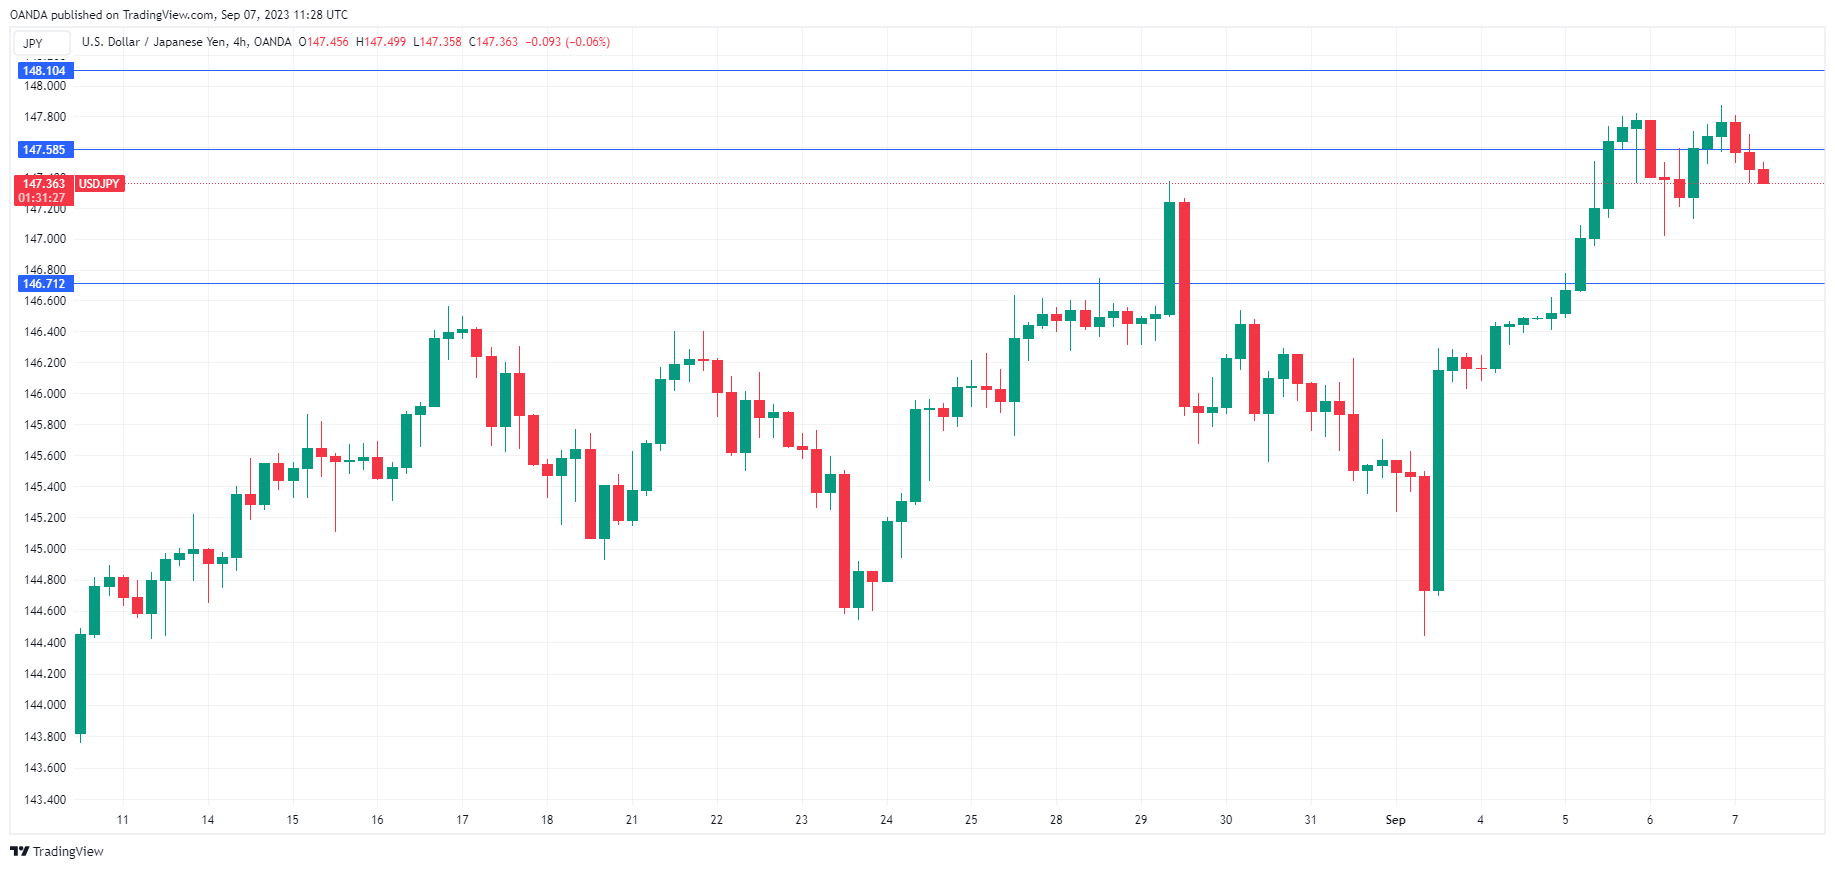
The Japanese yen is slightly higher on Thursday. In the European session, USD/JPY is trading at 147.39, down 0.19%.
The yen can’t seem to find its footing and has dropped close to 1% this week. Earlier today, the yen fell as low as 147.87, closing in on the 148 line which has held since October 2022.
Bank of Japan policy makers don’t make public statements or hold interviews nearly as much as Fed members, and I must admit to being pleasantly surprised at seeing that two BoJ officials had made public comments in as many days. I have found the Fed to be considerably more transparent than the BoJ, and the more we hear from BoJ policy makers, the better, especially during a time of expectations of a shift in BoJ policy.
On Wednesday, Bank of Japan member Hajime Takata said that the BoJ needed to “patiently maintain” its massive monetary stimulus, noting that the central bank would need a year to determine whether recent wage increases were sustained. The BoJ has insisted that it will not tighten policy until it sees evidence that inflation is sustainable, such as higher wage growth.
What was more interesting was that Takata said that Japan’s economy is “finally seeing early signs of achieving the BoJ’s 2% inflation target”. This may not be a ringing endorsement that the target is close, but at least is an acknowledgment of broad inflationary pressures, which the BoJ has tended to downplay despite core CPI exceeding the 2% target for 16 consecutive months.
On Thursday, BoJ member Junko Nakagawa had a more dovish message, saying that the central bank needed to maintain its ultra-loose monetary policy and argued that there was an “equal degree of upside and downside risks to the inflation outlook”, which made it difficult to determine when inflation might hit 2% in sustainable manner.
The BoJ next meets on September 22nd and the markets will be looking for hints of a shift in policy, which could have major ramifications on the direction of the Japanese yen.
USD/JPY Technical
- USD/JPY is testing support at 147.58. Below, there is support at 146.71
- 1.4810 and 1.4893 are the next resistance lines
BoE Decision Maker Panel indicates easing inflation expectations
In the latest release of BoE Decision Maker Panel survey data for August, there is a tangible shift in business expectations pointing towards a decrease in both output price inflation and CPI inflation over the coming year, albeit with a lingering high degree of uncertainty.
According to the report, firms anticipate a fall in output price inflation over the next year, with the year-ahead output price inflation envisioned to be 4.9% in the three months leading up to August. This projection denotes a dip of -0.5% in comparison to the data gathered in the three months to July.
One-year ahead CPI inflation expectations lowered to 4.8% in August, a significant reduction from the 5.4% foreseen in July. Furthermore, when casting the net wider to encompass a three-year period, August data records a slight decrease to 3.2%, down by a marginal -0.1% from July's expectations.
In the realm of wage growth, there is a persistence of the previously noted trend with expectations for the year ahead holding steady at 5.0% in August. Despite this, it is essential to note that the figure is overshadowed by the realized wage growth reported at a higher 6.9% for both single month data and the cumulative data for the three months to August.
However, amidst these optimistic projections, businesses seem to be grappling with considerable uncertainty. A substantial 53% of firms expressed that they are facing high to very high levels of uncertainty, a statistic that has remained unchanged from July.
Dollar Index Outlook: Bulls Remain Firmly in Play
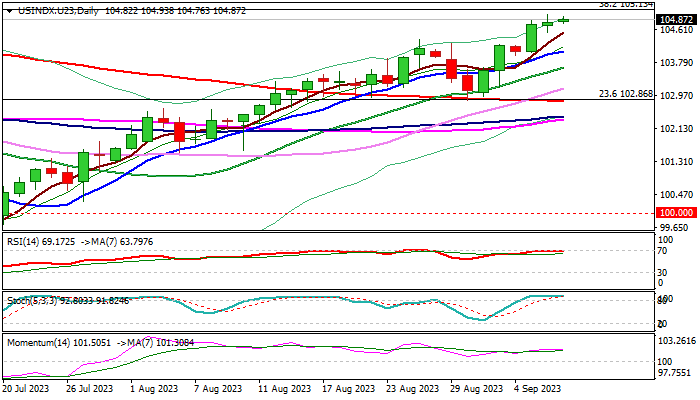
The dollar index holds firm tone in early Thursday’s trading and pressuring 105.00 round figure barrier, ahead of more significant resistances at 105.13/47 (Fibo 38.2% retracement of 114.72/99.20 / weekly cloud base).
Wednesday’s better than expected US Aug non-manufacturing data improved the sentiment, along with signs of easing inflation, modest economic growth and slower labor growth, which add to growing hopes that the US economy will remain resilient and avoid worse scenarios.
Better performance of the US economy in comparison to other major economies also makes dollar more attractive for investors, together with signals that the Fed is likely to keep high interest rates for extended period.
Uninterrupted uptrend which extends into eighth consecutive week, approached key resistances (105.13/47), as well as 105.85 (Mar 5 lower top), break of which would spark fresh acceleration higher and expose initial targets at 106.22 (daily cloud top) and 106.96 (50% retracement of 114.72/99.20).
Be aware of possible headwinds here as barriers are significant and daily studies overbought, with dips to find ground above daily Tenkan-sen (103.91) to keep bulls intact.
Only break below 102.82 (200DMA/Aug 30 higher low) would sideline bulls and signal reversal.
Res: 105.13; 105.47; 105.85; 106.96.
Sup: 104.37; 103.91; 103.67; 103.13.
WTI Oil Futures Jump to Fresh 9-month High
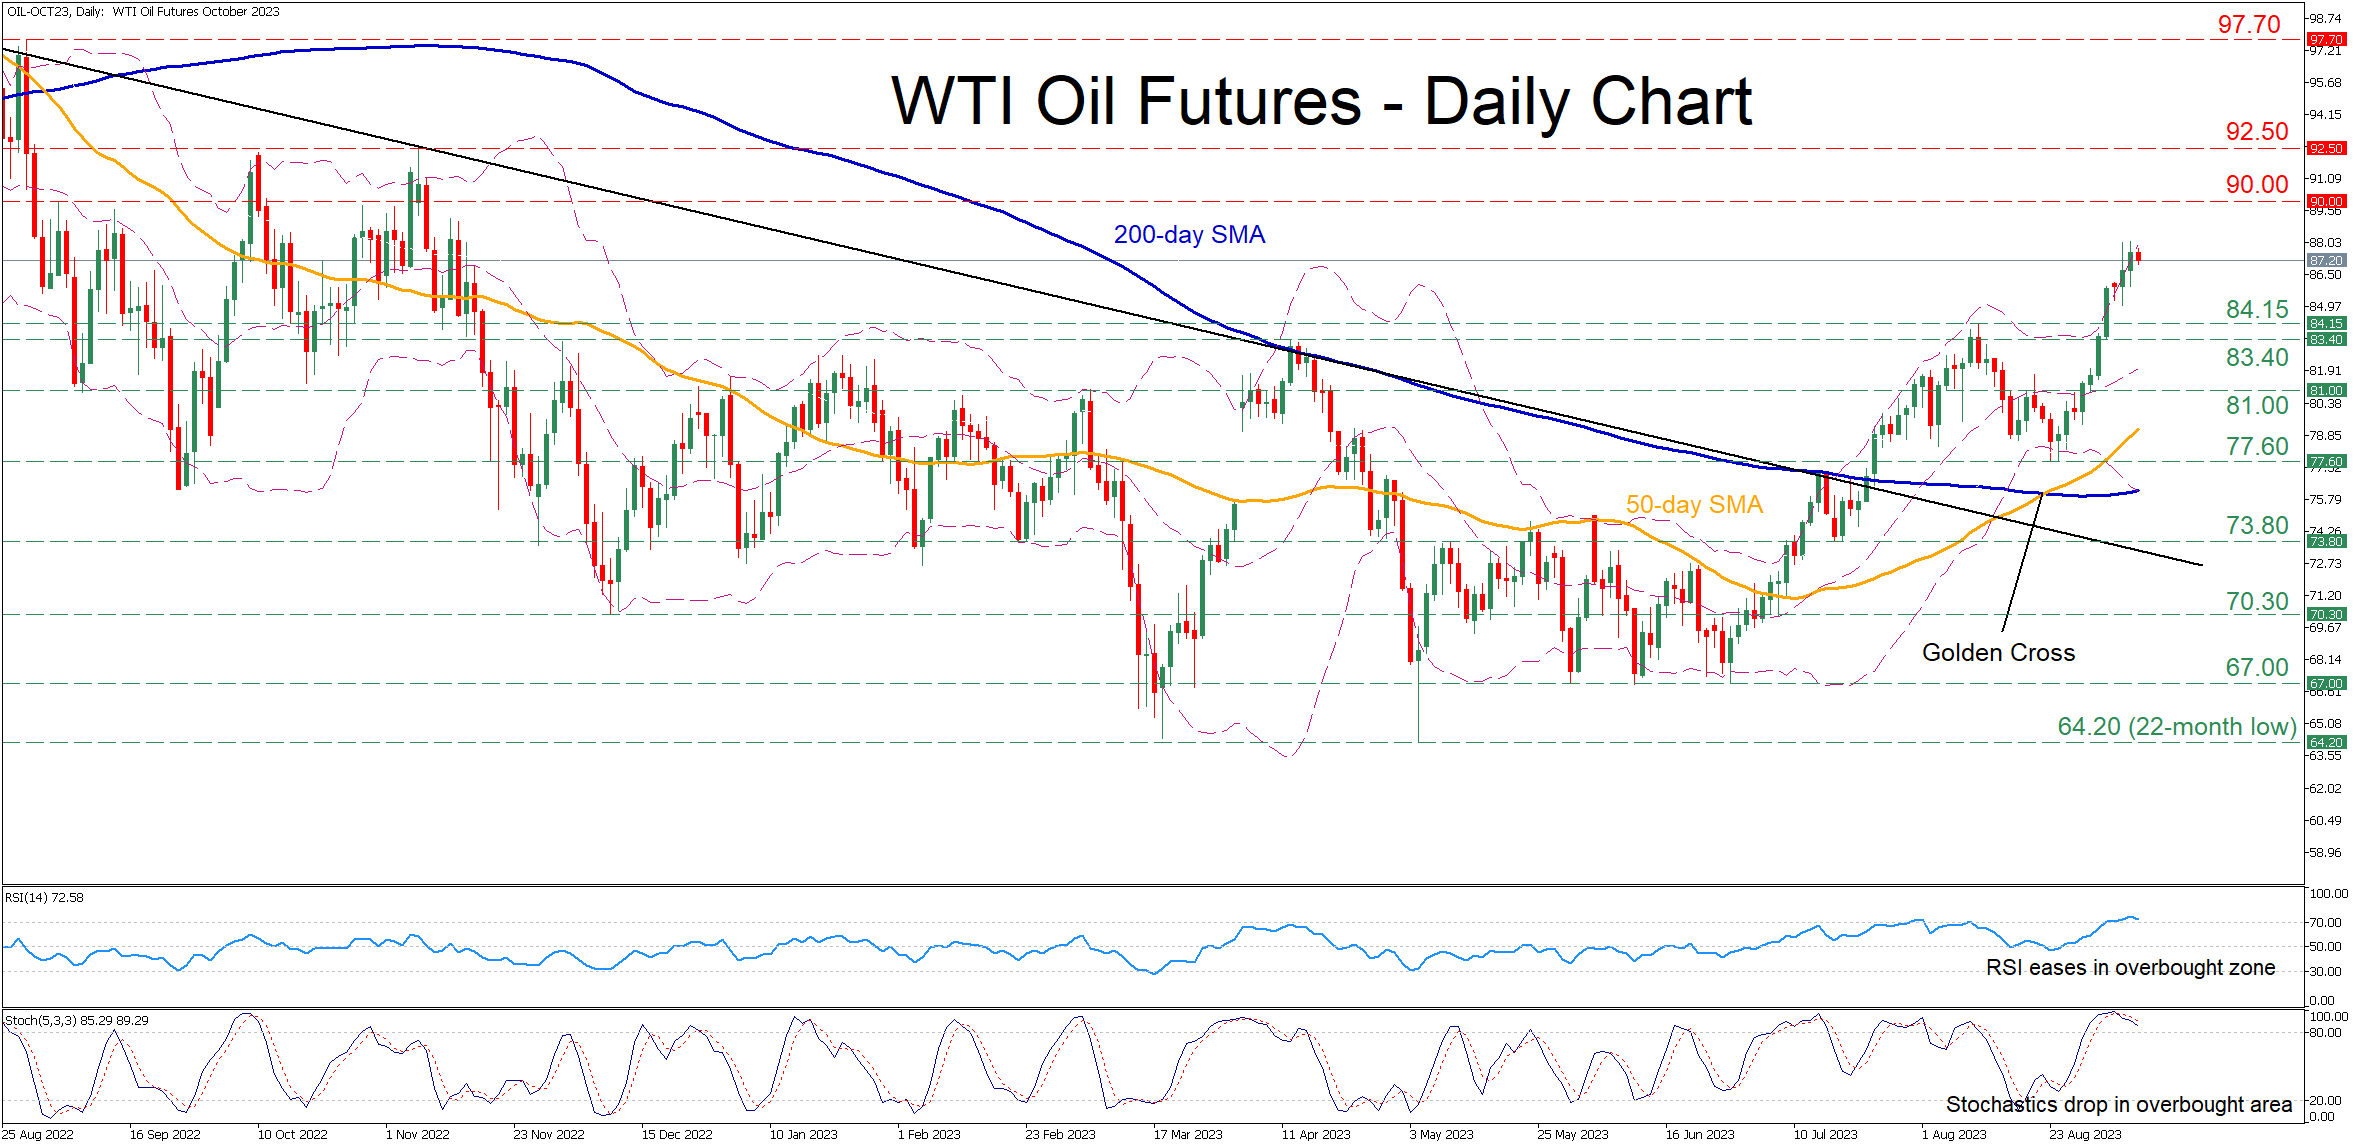
WTI oil futures (October delivery) have been in a steady advance since early July, generating a structure of higher highs and higher lows. Moreover, in yesterday’s session, the price climbed to a fresh nine-month peak of 88.08 before paring some gains.
The momentum indicators currently suggest that the recent rally could be overstretched as both the RSI and the stochastic oscillator are within their overbought territories, while the price is trading near the upper Bollinger band. Hence, a potential downside correction might be on the cards.
Should the bulls attempt to push the price higher, initial resistance could be found at the 90.00 psychological mark, which also held strong in September 2022. Further advances could then cease at the November 2022 high of 92.50. Piercing through that wall, oil prices may then challenge the August 2022 peak of 97.70.
On the flipside, if buying interest fades and the price corrects to the downside, a series of previous resistance zones such as 84.15, 83.40 and 81.00 may serve as support regions in the future. Sliding beneath the latter, the price could face the August low of 77.60.
In brief, WTI oil futures have been exhibiting persistent strength lately, recording consecutive multi-month peaks. Nevertheless, a downside correction should not be ruled out as the latest advance has reached overbought conditions.
USDCHF Opens the Door to More Upside
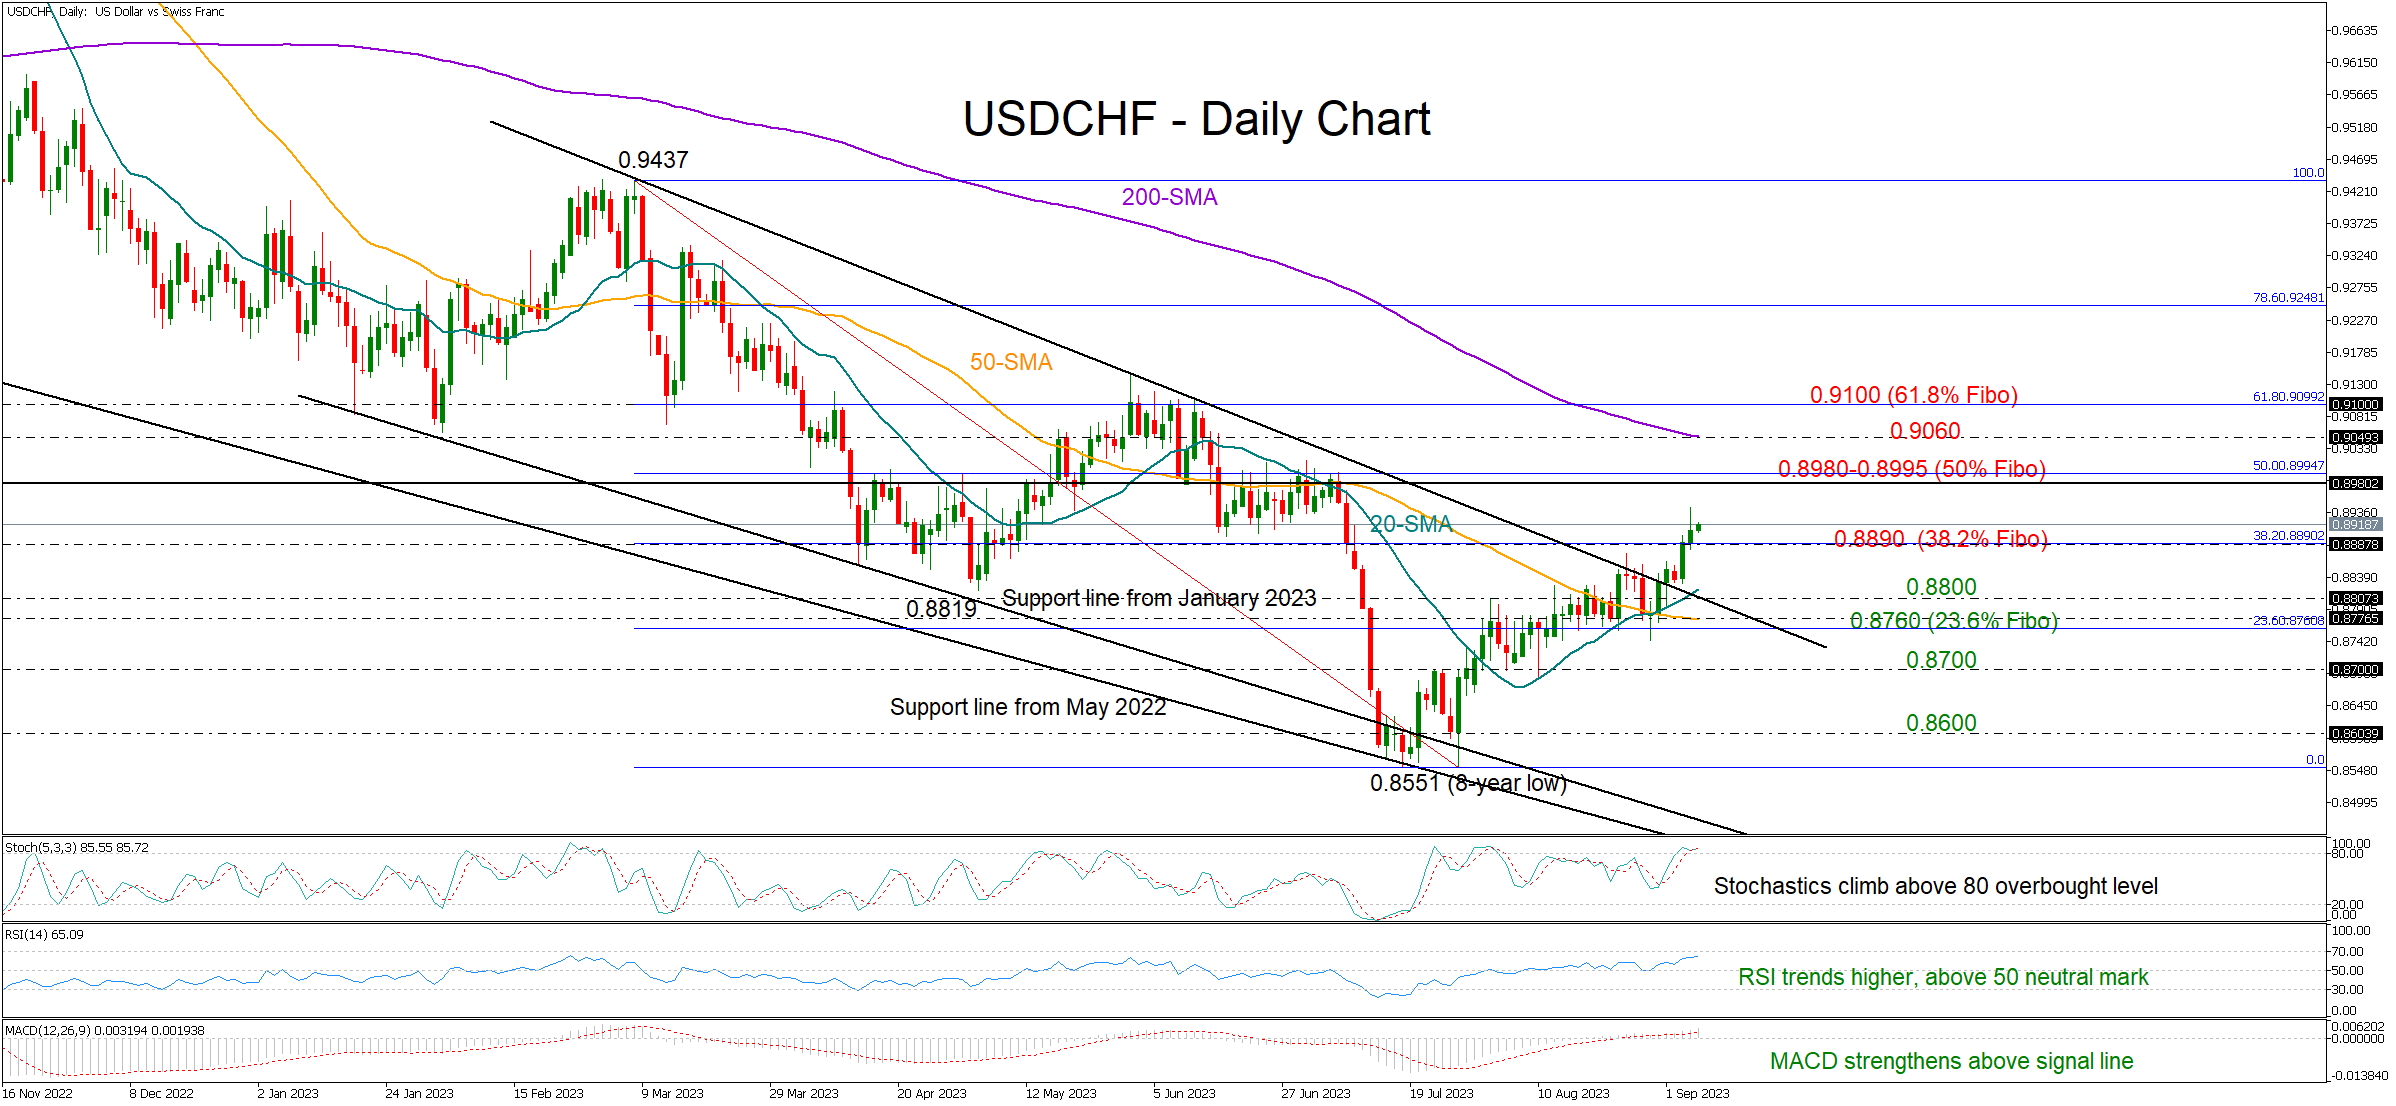
USDCHF stepped above the 0.8890 restricted zone on Wednesday, fueling hopes that the recovery could pick up momentum during the next sessions.
The technical indicators are endorsing the bullish scenario as the RSI and the MACD are clearly trending higher and above their neutral marks. The stochastic oscillator is sloping upwards too, though it has already crossed above its 80 overbought level, feeding speculation that additional gains could soon take halt.
The 0.8980-0.8995 region, which encapsulates the 50% Fibonacci level of the 0.9437-0.8551 downtrend, could be the next challenge. Then, a successful move above the 200-day simple moving average (SMA) at 0.9060 would be the first in almost a year, and hence might be of psychological importance. Still, only a decisive close above the 61.8% Fibonacci mark of 0.9100, which cooled down upside pressure in June and April, would indicate a bullish trend reversal in the short-term picture.
In the event the bulls show signs of fatigue quickly, with the price sliding back below the 38.2% Fibonacci of 0.8890. the focus will turn to the 20-day SMA and the broken resistance trendline near 0.8800. Should the price dive below the 50-day SMA and the 23.6% Fibonacci of 0.8760 too, the sell-off could extend to 0.8700. A steeper decline could test the 0.8600 number.
Summing up, USDCHF is expected to welcome more buying in the short-term, shifting the spotlight to the key bar of 0.8995.
Nikkei 225 Reaches Psychological Level at 33,000
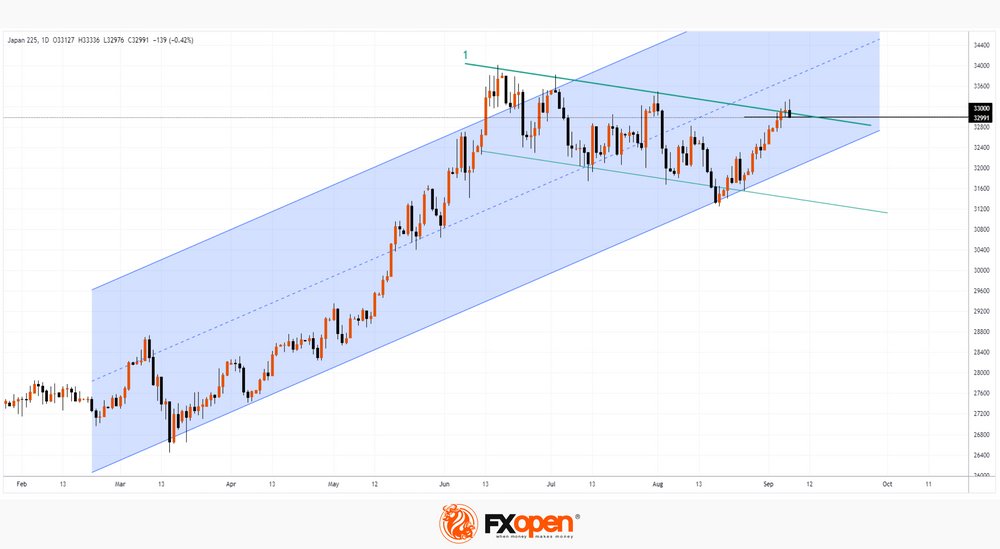
In 2023, Japan's stock market is in a bullish trend (shown by the blue channel) as the country has an ultra-loose monetary policy (unlike other G7 countries that are fighting inflation). As a result, the cheap yen helps Japanese companies, which are largely export-oriented, to develop. According to the Cabinet of Japan, GDP in the second quarter of 2023 increased by 2% compared to the same quarter of the previous year.
The growth of the Japanese stock market from the beginning of the year to today is about 28%. And on Sept. 5, the Nikkei 225 closed above the psychological 33,000 level. Yahoo Finance reports that Kenji Abe, Daiwa Securities equity strategist, predicts the Nikkei could gradually rise to 35,000 after a strong reporting season this summer.
Bearish arguments:
→ the level of 33,000 points can serve as psychological resistance. After the Doji candle on September 6 (which can be interpreted as the uncertainty of market participants in the continuation of growth), the price dropped on the morning of September 7, which confirms the weakening of demand.
→ line (1), built on the highs of summer, can provide resistance.
However, the bullish argument is that the line (1) is an element of the flag technical analysis pattern. If the pattern works, then we should expect its breakdown and the continuation of the trend in 2023. How likely this scenario is can be judged by the depth of the rollback from the line (1), which is already looming on the chart.
This article represents the opinion of the Companies operating under the FXOpen brand only. It is not to be construed as an offer, solicitation, or recommendation with respect to products and services provided by the Companies operating under the FXOpen brand, nor is it to be considered financial advice.
GBP/JPY Daily Outlook
Daily Pivots: (S1) 184.08; (P) 184.88; (R1) 185.50; More...
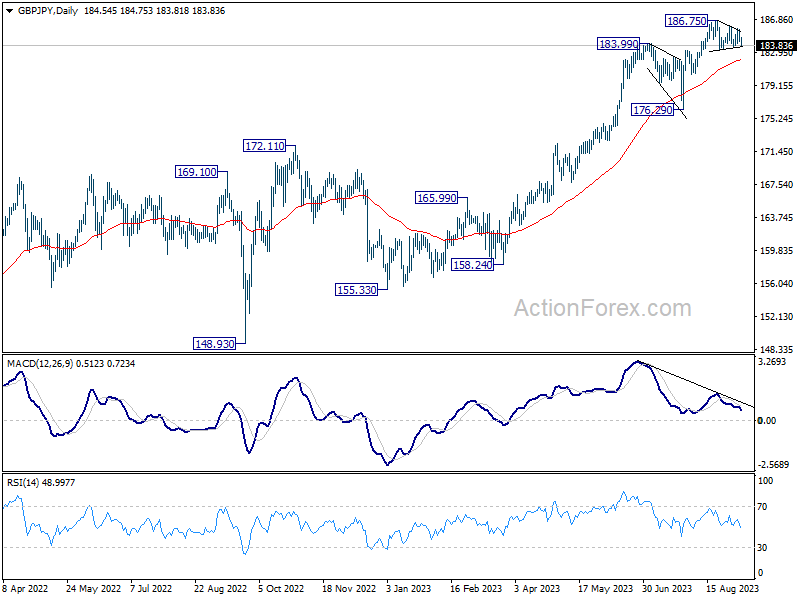
GBP/JPY is still bounded in sideway trading and intraday bias remains neutral. On the upside, above 186.04 will argue that larger up trend is ready to resume through 186.75. On the downside, however, break of 183.51 will bring deeper correction to 55 D EMA (now at 182.16).
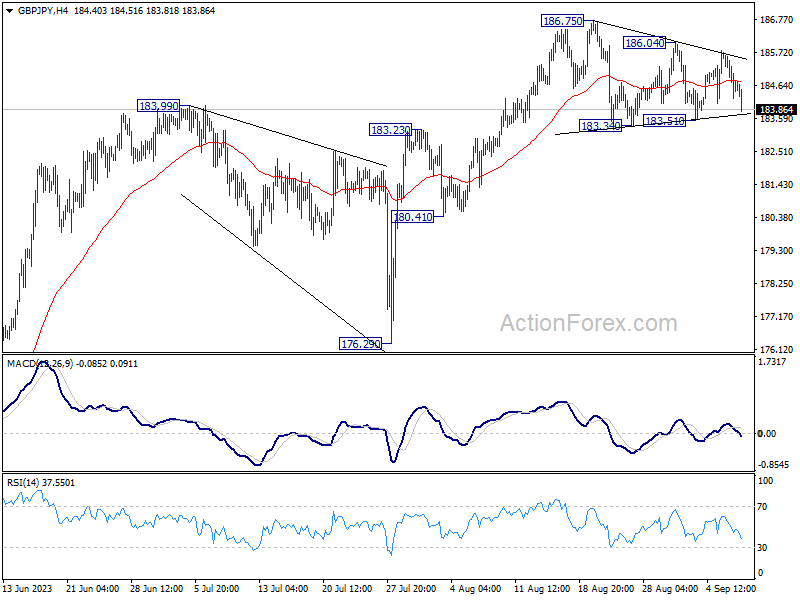
In the bigger picture, up trend from 123.94 (2020 low) is in progress. Next target is 195.86 (2015 high). This will remain the favored case as long as 176.29 support holds, even in case of deeper pull back.
EUR/JPY Daily Outlook
Daily Pivots: (S1) 157.95; (P) 158.21; (R1) 158.65; More....
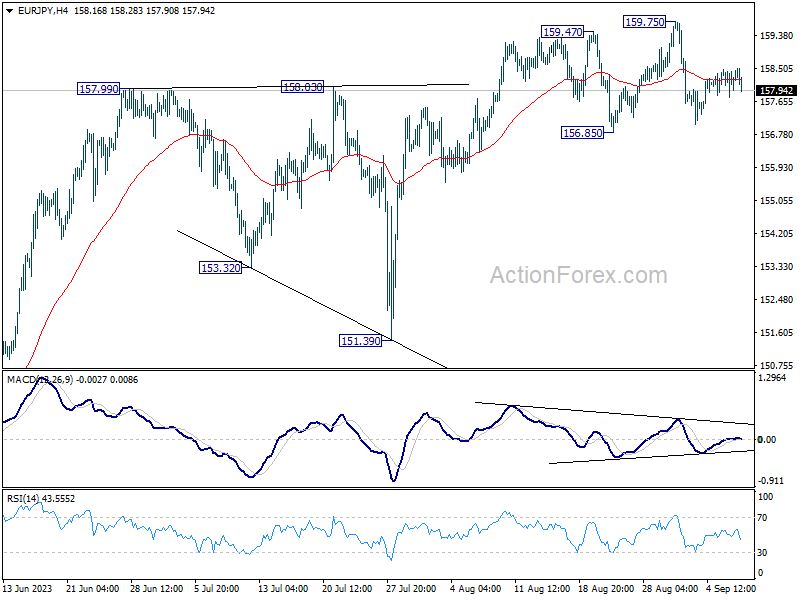
EUR/JPY is still bounded in range trading and intraday bias remains neutral. On the downside, break of 156.85 will turn bias back to the downside deeper fall towards 151.39 support. On the upside, break of 159.75 will resume larger up trend instead.
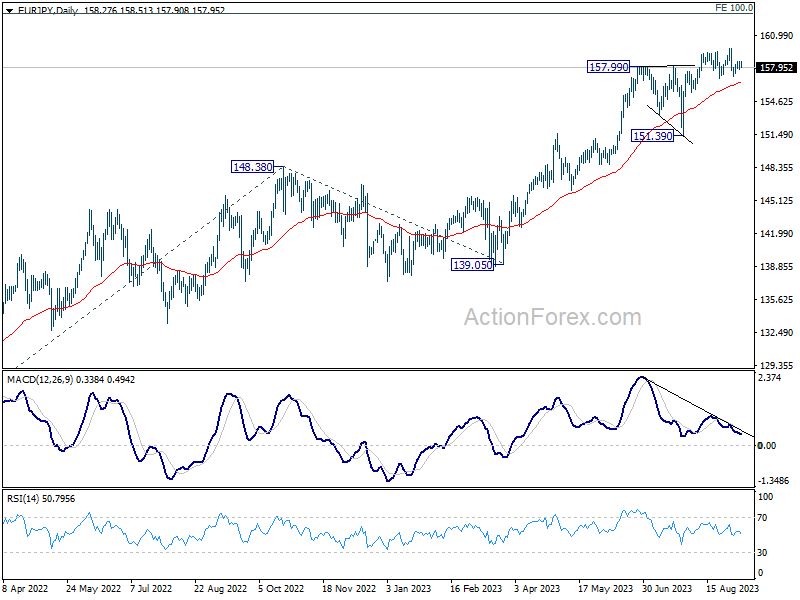
In the bigger picture, rise from 114.42 (2020 low) is in progress. Next target is 100% projection of 124.37 to 148.38 from 139.05 at 163.06. Sustained break there will pave the way to retest long term resistance at 169.96. This will remain the favored case as long as 151.39 support holds, even in case of deep pull back.
EUR/GBP Daily Outlook
Daily Pivots: (S1) 0.8544; (P) 0.8561; (R1) 0.8593; More...
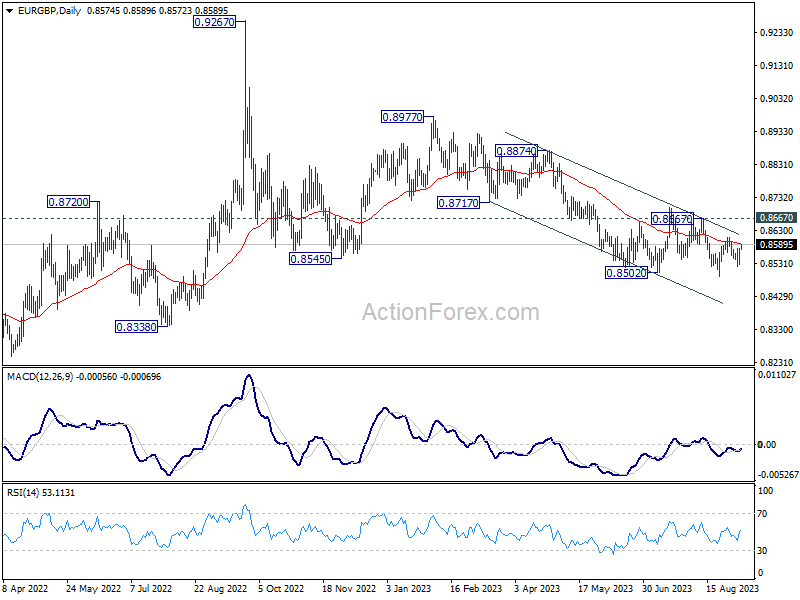
Intraday bias in EUR/GBP is turned neutral with current strong rebound. On the upside, above 0.8609 will resume the rebound from 0.8491. But near term outlook will stay bearish as long as 0.8667 resistance holds. On the downside, below 0.8522 will bring retest of 0.8491 low.
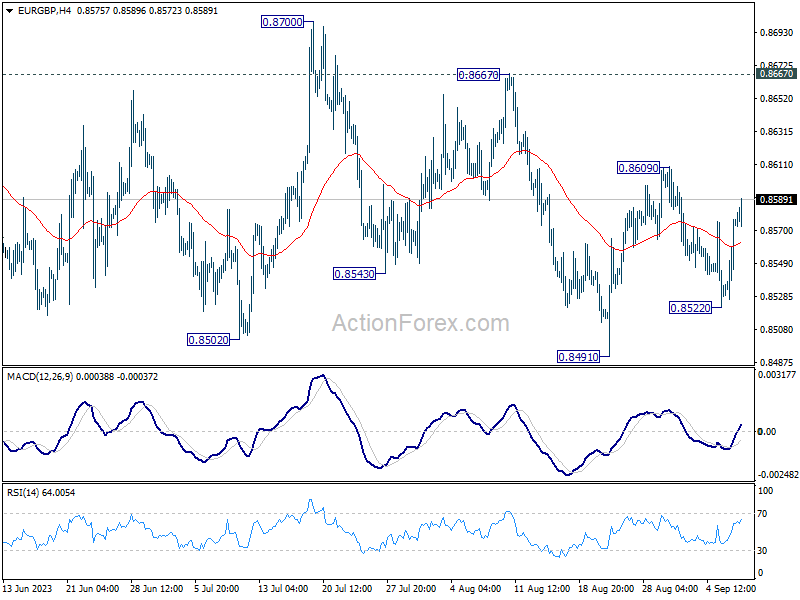
In the bigger picture, the down trend from 0.9267 (2022 high) is seen as part of the long term range pattern from 0.9499 (2020 high). Further decline is in favor as long as 0.8667 resistance holds. Break of 0.8491 will resume the fall towards 0.8201 (2022 low).