

Sample Category Title
WTI Oil Outlook: Extended Production Cuts to Further Underpin Price
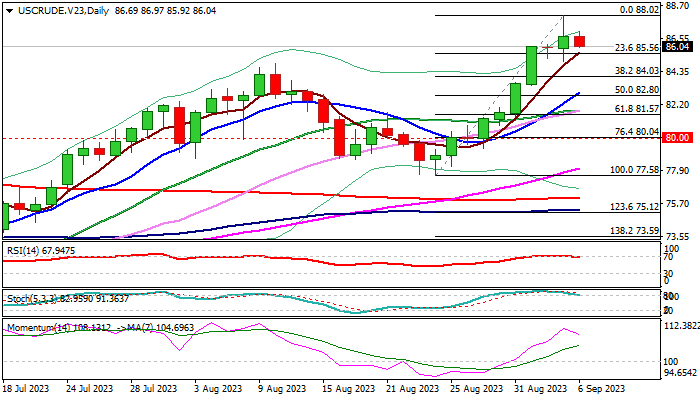
WTI oil price edged lower in early Wednesday’s trading, after advancing 0.9% on Tuesday and hitting new 2023 high ($88.02), underpinned by decision of Saudi Arabia and Russia to extend its voluntarily output cuts in the fourth quarter.
The decision for extended supply reduction is expected to keep the oil market tight, although the positive impact on the price was partially offset by signals that two key oil producers will be reviewing its decision on a monthly basis.
Persisting demand concerns also weigh on oil price as recent weaker than expected global economic data warn that the EU and US economies feel stronger negative impact from high borrowing cost, while economic growth in China, world’s biggest oil importer, is still to gain desired pace in post-Covid recovery.
Short-term picture is overall positive, but overbought conditions on daily chart (14-d momentum and RSI are about to reverse from overbought territory) is likely to trigger some profit taking and push the price lower.
Tuesday’s daily candle with long both shadows generated initial indecision signal, which may add to the scenario of pullback.
Dips should ideally find footstep above $84.00 zone (Fibo 38.2% of $77.58/$88.02 upleg) to mark a healthy condition ahead of fresh push higher, with deeper dips not to exceed $82.80 (50% retracement / rising 10DMA) to keep larger bulls intact, for push through the recent top and acceleration towards psychological $90 barrier.
Conversely, violation of $82.80 pivot would risk deeper correction and expose strong supports at $80.00 (psychological) and $78.70 (top of rising and thickening daily cloud).
Release of US crude inventories reports (API due today and EIA on Wednesday) are also expected to provide fresh signals.
Res: 88.02; 90.00; 93.72; 94.53.
Sup: 85.56; 85.00; 84.03; 82.80.
USD/CAD Rises to 22-Week High, BoC Decision Looms
- Bank of Canada expected to hold rates at 5.0%
- US to release ISM Services PMI
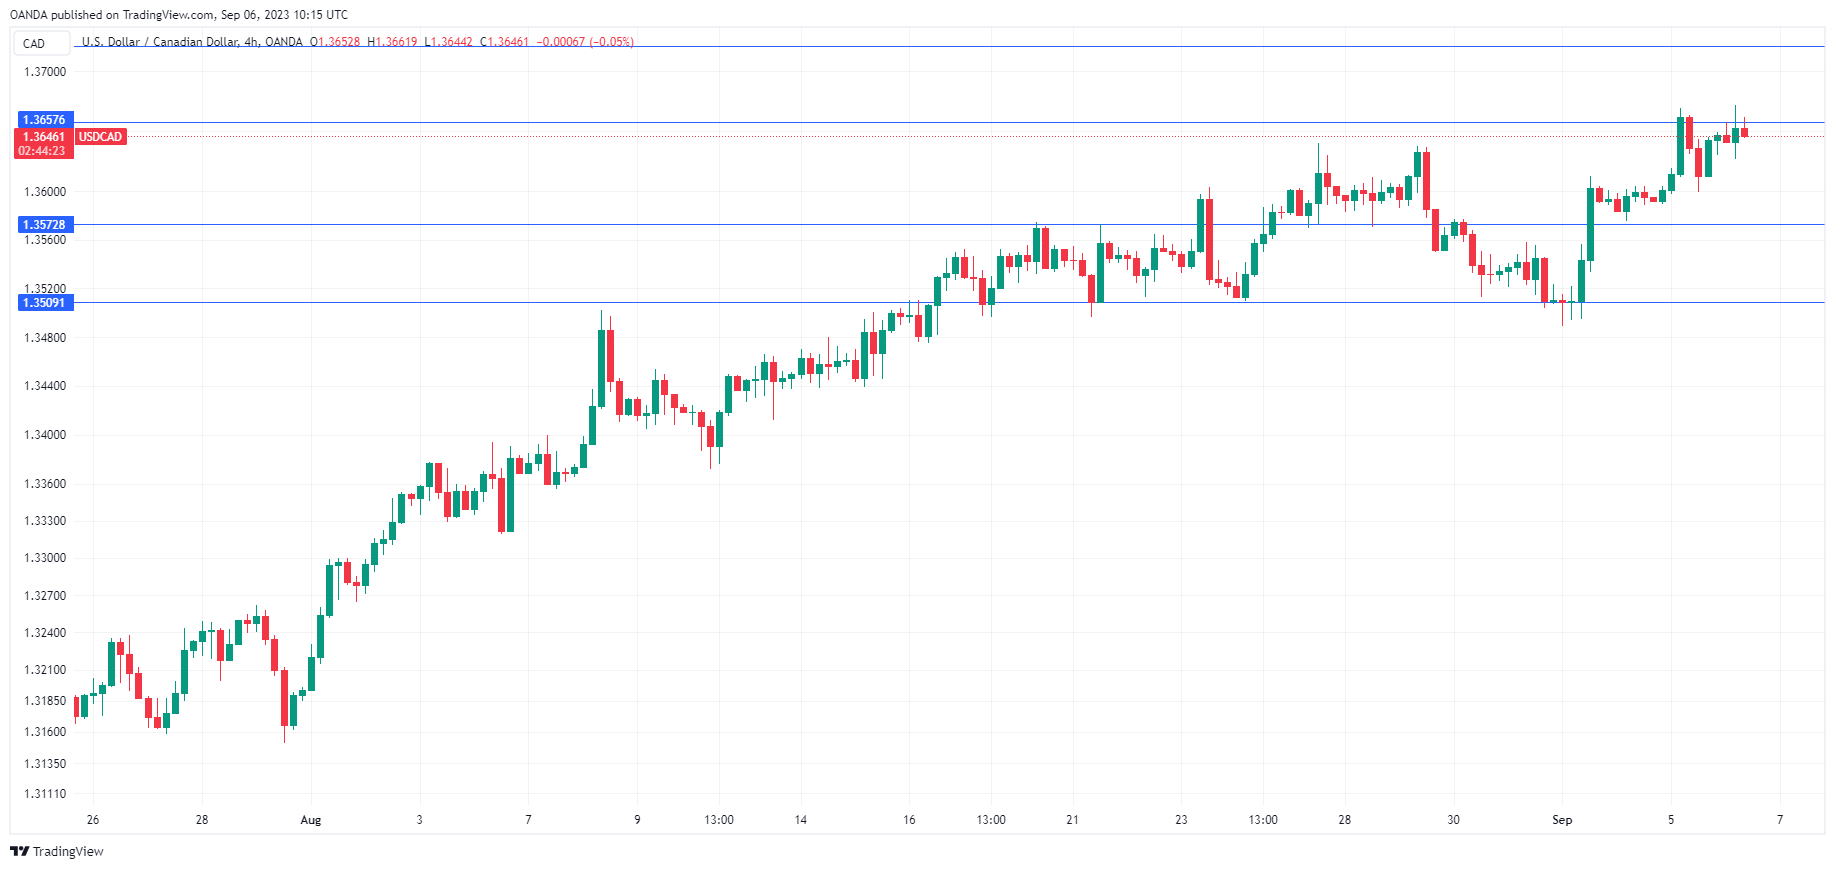
USD/CAD is trading quietly in Europe at 1.3651, up 0.06%. I expect to see stronger movement in the North American session, with the Bank of Canada making its rate announcement and the US releasing the ISM Services PMI which is expected to show little change.
Bank of Canada widely expected to hold rates
The Bank of Canada is virtually certain to hold rates at today’s meeting, with just a 6% probability of a rate hike, according to the TMX Group. That would leave the benchmark cash rate at an even 5.0%.
BoC Governor Macklem would certainly like to call it quits on the central bank’s aggressive tightening cycle and perhaps he can look for advice from his peers at the Federal Reserve and the Reserve Bank of Australia. Both the US and Australian economies have seen inflation fall significantly, but Jerome Powell at the Fed and Peter Lowe at the RBA have sent the markets a hawkish message that inflation isn’t beaten and the door is open for further rate hikes if necessary. The markets have taken a more dovish stance and are already looking ahead to possible rate cuts.
Macklem appears to face the same challenge of acknowledging that rate hikes have cooled the economy and curbed inflation while sounding credible about keeping open the option of further rate hikes. Last week’s GDP report indicated that the economy contracted by 0.2%, compared to the BoC’s forecast of 1.5% growth. The BoC has hiked repeatedly in order to lower inflation but there are concerns that the rate hikes in June and July may have tilted the risk toward a recession.
The Federal Reserve is widely expected to pause at the September 20th meeting. The pause could signal that rates have finally peaked, although don’t expect any Fed members to publicly state that the rate-tightening cycle is over.
Federal Reserve Governor Christopher Waller said on Tuesday that the Fed can afford to “proceed carefully” with rate hikes, given that inflation has been falling, and if the downtrend continues, “we are in pretty good condition”.
USD/CAD Technical
- USD/CAD tested resistance at 1.3657 earlier. The next resistance line is 1.3721
- 1.3573 and 1.3509 are providing support
Australian Dollar Steadies After Solid GDP
- Australian GDP unchanged at 0.4%
- RBA holds rates at 4.10%
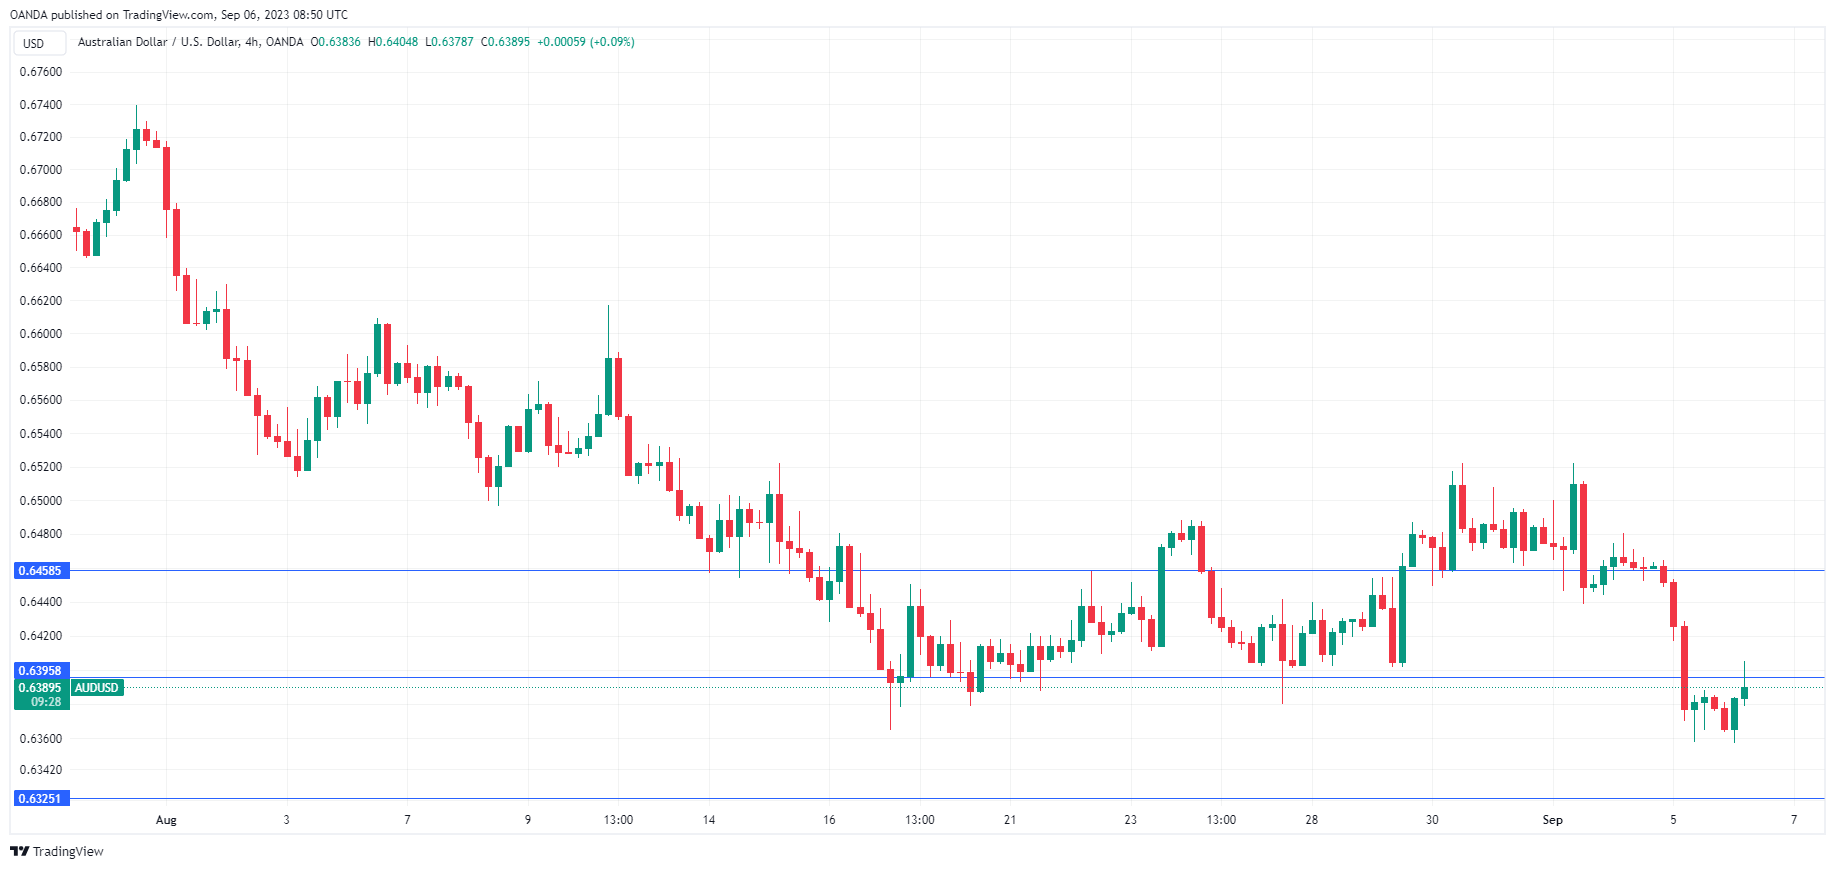
The Australian dollar has edged higher on Wednesday, after sustaining sharp losses a day earlier. In the European session, AUD/USD is trading at 0.6391, up 0.19%.
Australia’s GDP holds steady in Q2
The Australian economy grew by 0.4% q/q in the second quarter, unchanged from the upwardly revised reading in the first quarter and matching the consensus. On an annualized basis, GDP expanded 2.1% in the second quarter, compared to an upwardly revised 2.4% in the previous quarter.
The GDP data didn’t knock anyone off their seats, but Australia’s economy has now posted growth for seven straight quarters despite weak global economic conditions. Still, household consumption was weak, falling from 0.3% to 0.1% and the household savings ratio fell from 3.6% to 3.2%. These lower readings reflect the squeeze that higher interest rates and inflation are having on households.
The Reserve Bank of Australia held rates at 4.10% on Tuesday, as expected. The RBA has maintained rates for three straight months and Governor Lowe’s swan song included the usual rhetoric about inflation remaining too high and the door remained open for further rate hikes if needed. The markets are more dovish than the RBA and have priced in a 70% chance of no further hikes from the RBA, with cuts likely to begin in late 2024.
The Federal Reserve is widely expected to pause at the September 20th meeting. The benchmark cash rate is currently in a range of 5.25%-5.50%, and a pause could signal that rates have finally peaked, although don’t expect any Fed members to publicly state that the rate-tightening cycle is over.
Inflation hasn’t been beaten and core CPI, which is a better gauge of underlying inflation than headline CPI, rose 4.2% in July, about double the Fed’s target of 2%. Federal Reserve Governor Christopher Waller said on Monday that the Fed can afford to “proceed carefully” with rate hikes, given that inflation has been falling, and if the downtrend continues, “we are in pretty good condition”.
AUD/USD Technical
- AUD/USD tested resistance at 0.6395 earlier. Above, there is resistance at 0.6458
- There is support at 0.6325 and 0.6274
Speculators Have Lost Interest in the Crypto Market
Market picture
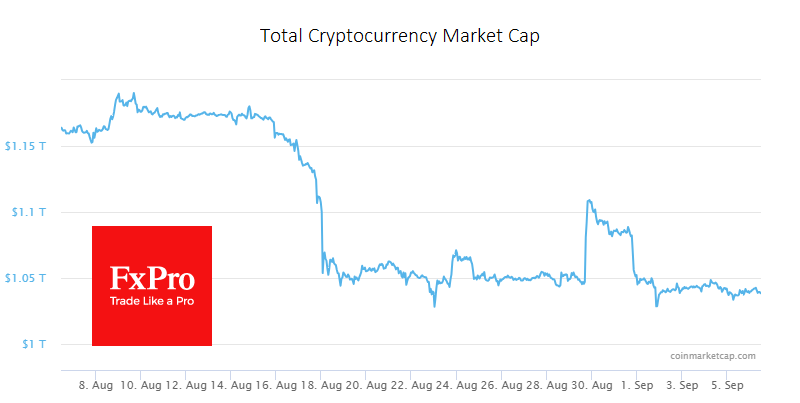
Crypto is out of volatility mode, moving in a narrow range of around $1.04 trillion over the last 24 hours, with little change in the total cap. This could be another pause before a new step down the ladder, as we have seen since July, or a preparation for further growth. We are now leaning towards the first option.
Bitcoin has stabilised around $25.7K, lower than it was at the end of last week. This dip looks like speculators trying to find demand to push the price higher. However, we believe that buyers will remain on the sidelines until the $25K level is reached. This has been the critical level for the last 14 months, and we do not expect a real bull-bear battle until this level is reached.
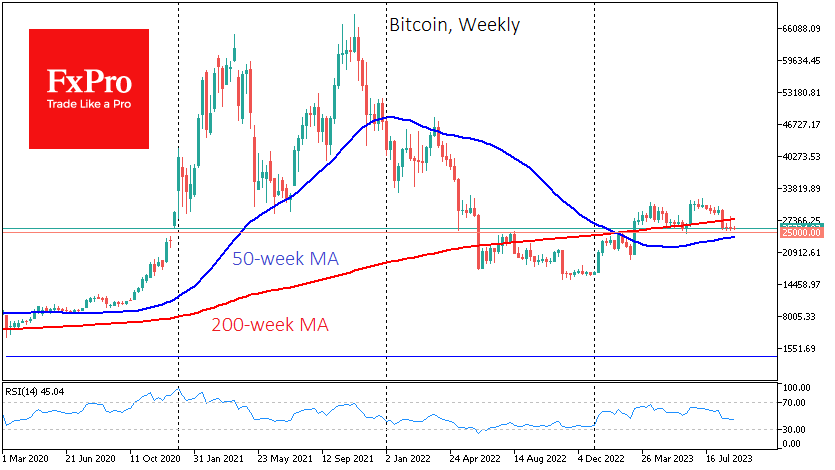
On the monthly timeframe, Bitcoin confirmed an overbought stochastic exit in August, which could be a sign of disappointment for the bulls, notes Fairlead Strategies. The signal generated often indicates the passing of a local top, as happened in late 2017 and early 2021.
News background
User activity on crypto exchanges is at its lowest since late 2022, according to CCData estimates. It said that the number of Bitcoin transactions on centralised exchanges has fallen by more than 60% since October last year.
Since 2022, lawyers, consultants and other professionals have made more than $700 million from the bankruptcy of five major crypto companies, including FTX, The New York Times calculated by analysing court records.
Payments giant Visa will launch payments in stablecoins based on the Solana blockchain. The company will start testing USDC on the Ethereum network in 2021. The choice of Solana is due to faster and cheaper transactions compared to the ETH blockchain.
Centralisation of nodes is one of Ethereum’s fundamental problems, but an ideal solution may only emerge in 10-20 years, said Vitalik Buterin, the platform’s co-founder. He says the answer lies in making nodes cheaper and easier to maintain.
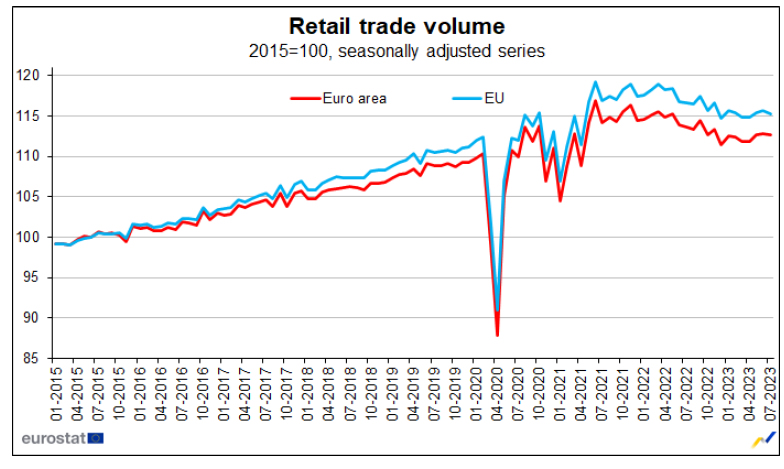
Eurozone retail sales down -0.2% mom in Jul, EU fell -0.3% mom
Eurozone retail sales volume fell -0.2% mom in July, matched expectations. Volume of retail trade decreased by -1.2% mom for automotive fuels, while it increased by 0.4% mom for food, drinks and tobacco and by 0.5% mom for non-food products.
EU retail sales decreased -0.3% mom. Among Member States for which data are available, the largest monthly decreases in the total retail trade volume were registered in Denmark and Ireland (both -2.3%), the Netherlands (-1.4%) and Luxembourg (-1.3%). The highest increases were observed in Portugal (+1.1%), Sweden (+1.0%) and Cyprus (+0.8%).
ECB Knot: A further hike still a possibility, but not a certainty
ECB Governing Council member Klaas Knot made it clear that reaching 2% inflation target by the end of 2025 is non-negotiable. "I continue to think that hitting our inflation target of 2% at the end of 2025 is the bare minimum we have to deliver," said Knot.
Knot didn't rule out the possibility of further tightening on at September 14 meeting. "We've reached the finessing phase of the tightening cycle," he noted. "Tightening—a further hike—is still a possibility, but not a certainty."
The ECB member also underscored the importance of wage growth in achieving the central bank's inflation target. According to him, "It's quite crucial in the disinflation process toward 2% by the end of 2025 that wage growth decelerates visibly."
Knot expressed concerns about current wage agreements, stating that they are "still pretty far off longer-run compatibility with a 2% inflation target plus half a percent productivity growth."
ECB Villeroy: Keeping rates sufficiently long counts more than hikes
ECB Governing Council member Francois Villeroy de Galhau refrained from detailing specific plans for the upcoming September 14 meeting. But he added, "I'm convinced we are close or very close to the high point of interest rates."
Also, "In our fight against inflation, maintaining rates for a sufficiently long period now counts for more than further significant rises", he said.
Villeroy also weighed in on inflation and economic growth trends, asserting that inflation passed its peak at the start of the year." He added that recent fluctuations in oil prices "should not change the underlying dis-inflationary trend." i
As for growth, Villeroy offered a measured outlook. "For the entire euro zone, we don't see a recession today," he noted. "The picture for France and the euro zone is slightly positive growth, slower growth," Villeroy added.
USDJPY Smashes Through Heavy Resistance
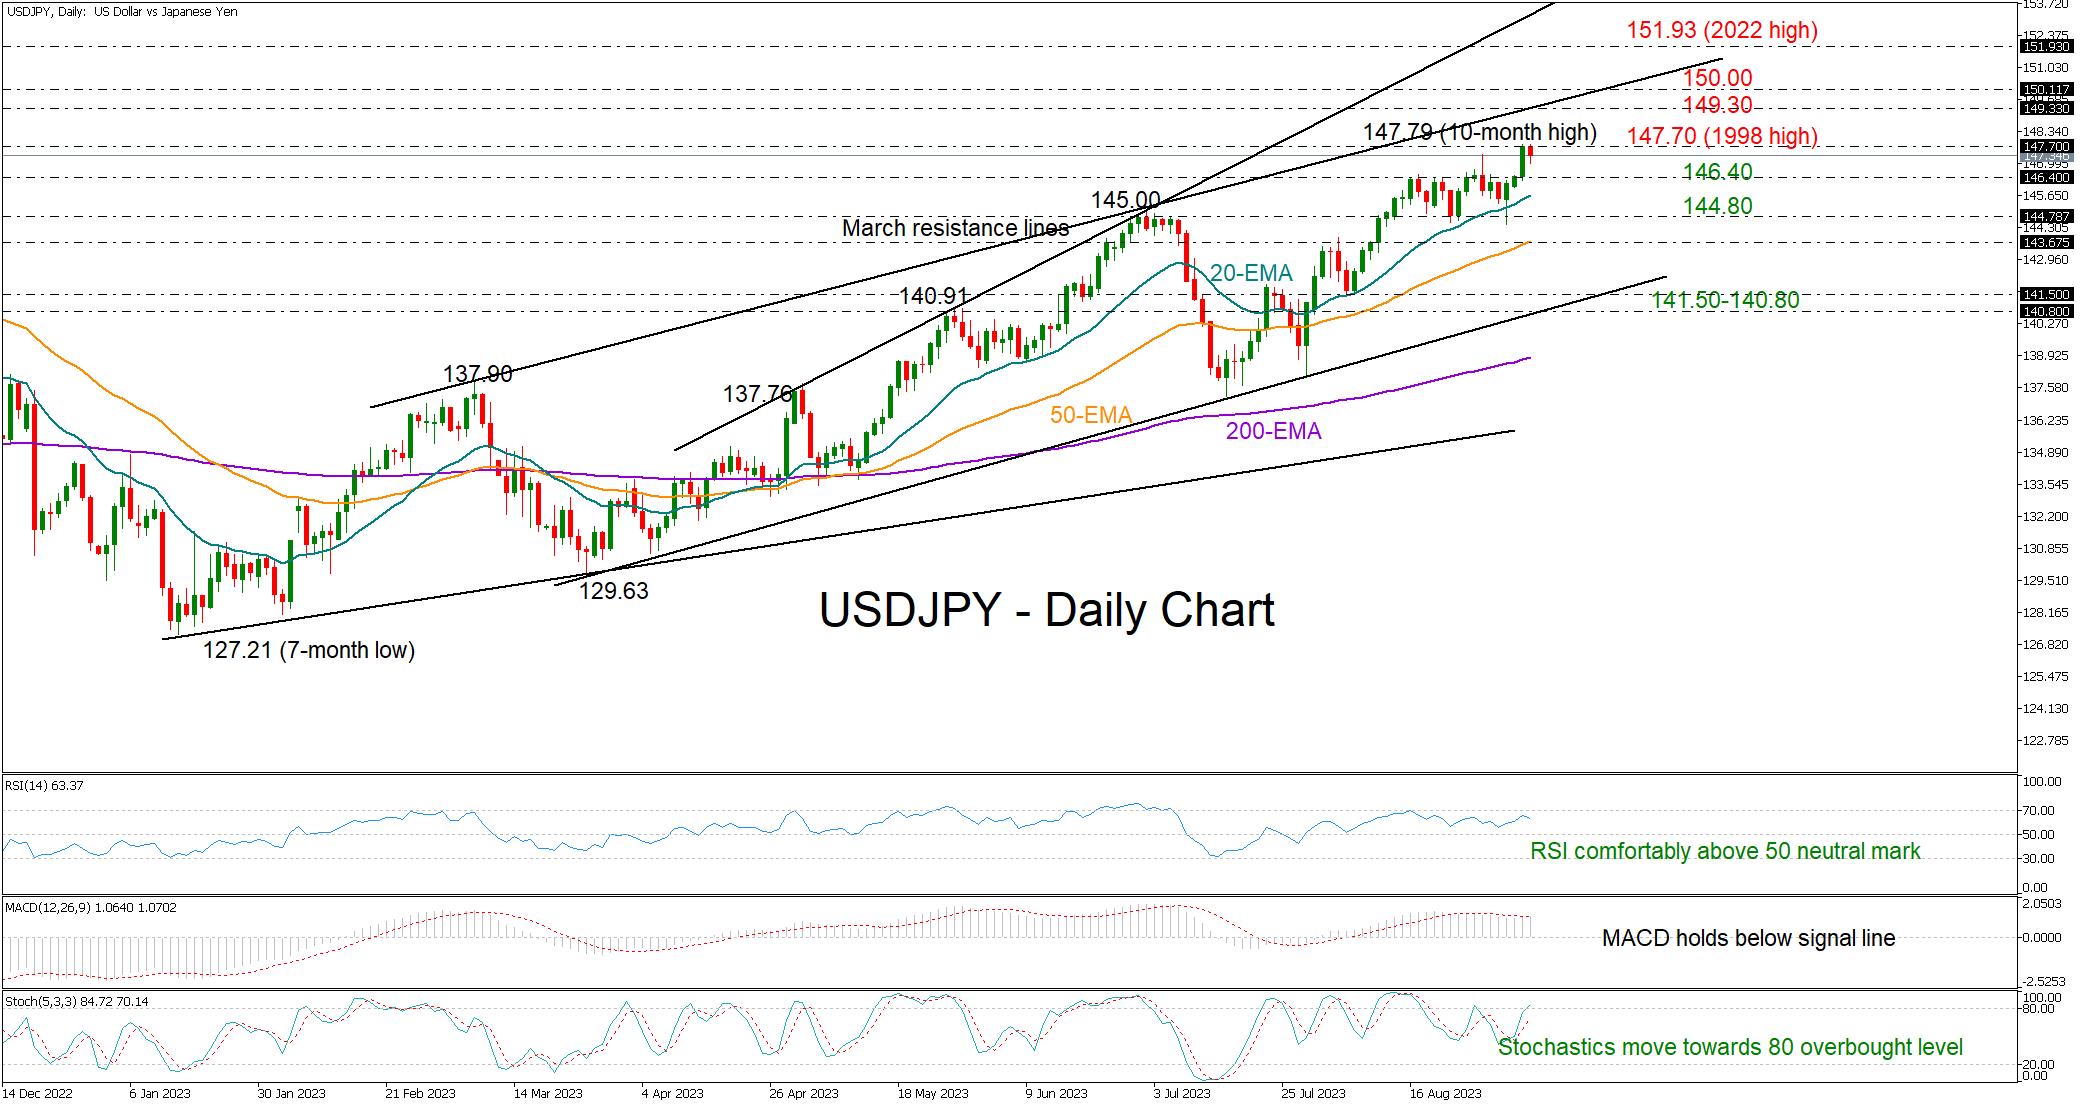
USDJPY finally snapped the 146.40 bar after a three week-long battle, stretching its uptrend towards the 147.70 constraining area for the first time since November 2022. Notably, this is where the pair peaked in 1998.
Despite Tuesday’s quick bounce in the price, the MACD could not climb above its red signal line. On the other hand, the RSI is hovering comfortably above its 50 neutral mark, while the stochastic oscillator has resumed its positive slope, witnessing persisting buying interest.
The upward-sloping exponential moving averages (EMA) are embracing the positive trend in the market.
If the bulls pierce through the 147.70 barricade, the next challenge could arise near the tentative ascending line from March 2023 at 149.30. The 150.00 psychological mark could come into consideration as well before traders target the 32-year high of 151.93 printed in October 2022.
On the downside, the 146.40 area could turn into a support region if the current weakness in the price continues. The 20-day EMA might also block the way down ahead of the 144.80 level. If the sell-off extends below the 50-day EMA, the next stop could be within the 140.80-141.50 zone, where the ascending trendline from March 2023 is located.
In brief, USDJPY has upgraded its 2023 bullish outlook above a tough resistance, boosting hopes for a continuation higher.
NZDUSD Extends Retreat to Fresh 2023 low
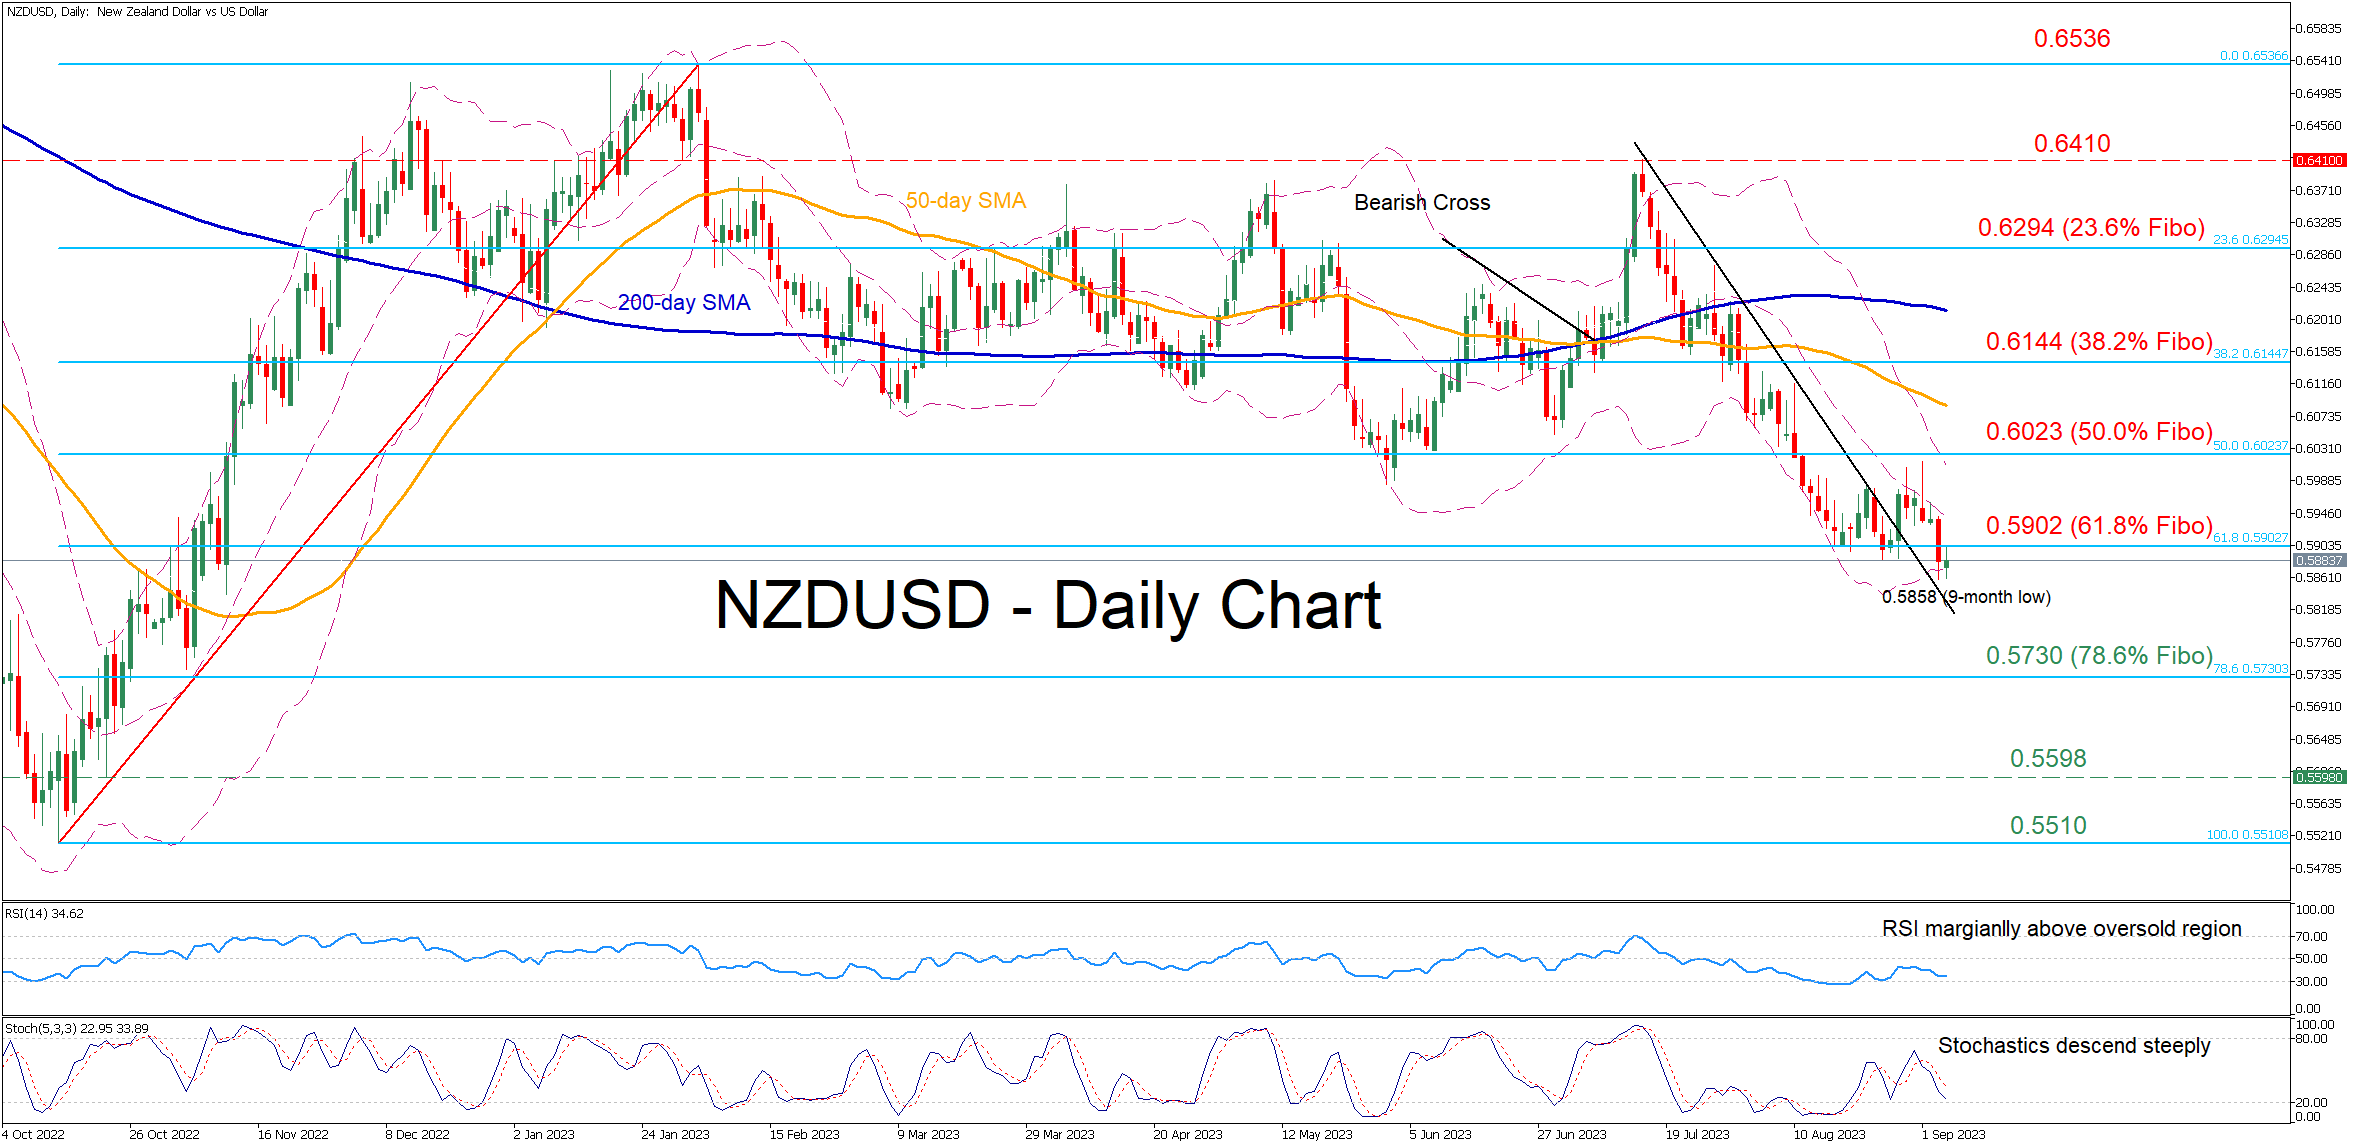
NZDUSD has been stuck in a steep downtrend after posting a fresh five-month high of 0.6410 in mid-July. Despite trading flat for the past two weeks, the pair dropped to a fresh nine-month bottom of 0.5858 in yesterday’s session before paring back some losses.
The momentum indicators are heavily tilted to the bearish side. The RSI is hovering near its 30-oversold mark, while the stochastic oscillator is also negatively charged near its 20-oversold territory.
Should the downward spike extend, the price could initially face 0.5730, which is the 78.6% Fibonacci retracement of the 0.5510-0.6536 upleg. A violation of that zone could pave the way for the October 2022 support of 0.5598. Further declines could then come to a halt at the October 2022 bottom of 0.5510.
On the flipside, bullish actions may encounter immediate resistance at the 61.8% Fibo of 0.5902. Piercing through that wall, the pair could advance towards the 50.0% Fibo of 0.6023 before the 38.2% Fibo of 0.6144 gets tested. Even higher, the 23.6% Fibo of 0.6294 might curb the pair’s upside.
Overall, NZDUSD sank to a fresh 2023 low after a hard battle around the 61.8% Fibo of 0.5902. For the bulls to regain some confidence, the price needs to reclaim that region.
EUR/USD Nosedives While USD/JPY Surged Further
EUR/USD started a fresh decline from 1.0940. USD/JPY is rising and might climb further toward the 148.80 resistance zone.
Important Takeaways for EUR/USD and USD/JPY Analysis Today
- The Euro started a fresh decline below the 1.0860 support zone.
- There is a key bearish trend line forming with resistance near 1.0760 on the hourly chart of EUR/USD at FXOpen.
- USD/JPY climbed higher above the 146.10 and 147.00 levels.
- There is a connecting bullish trend line forming with support near 147.20 on the hourly chart at FXOpen.
EUR/USD Technical Analysis
On the hourly chart of EUR/USD at FXOpen, the pair started a fresh decline from the 1.0940 zone. The Euro declined below the 1.0860 support zone against the US Dollar.
The pair even settled below the 1.0805 zone and the 50-hour simple moving average. A low is formed near 1.0707 and the pair is now consolidating losses near the 23.6% Fib retracement level of the recent decline from the 1.0808 swing high to the 1.0707 low.
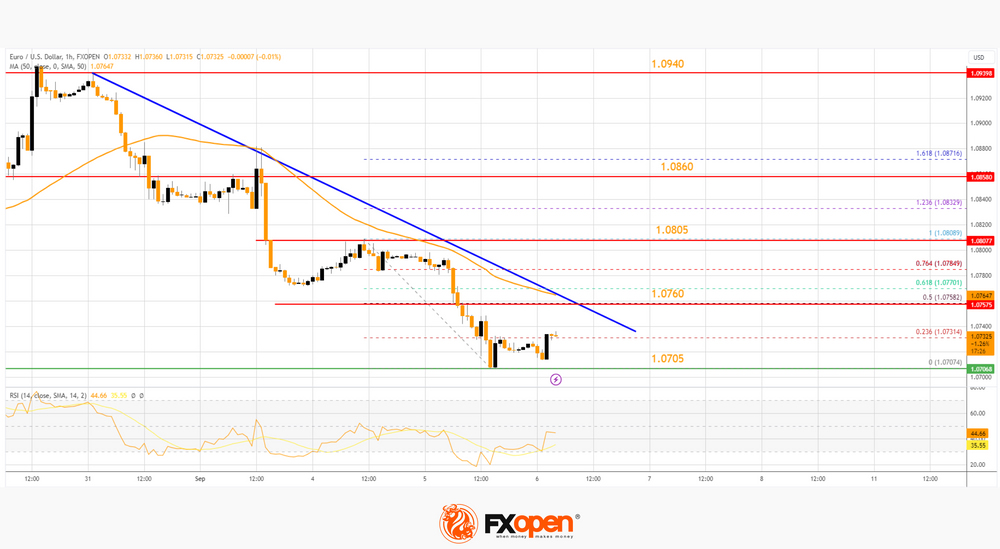
On the upside, the pair is now facing resistance near the 50-hour simple moving average at 1.0760 and a key bearish trend line. It is close to the 50% Fib retracement level of the recent decline from the 1.0808 swing high to the 1.0707 low.
The next major resistance is near 1.0805. The main resistance is now near 1.0860. An upside break above 1.0860 could set the pace for another increase. In the stated case, the pair might rise toward 1.0940.
If not, the pair might resume its decline. The first major support on the EUR/USD chart is near 1.0705. The next key support is at 1.0680. If there is a downside break below 1.0680, the pair could drop toward 1.0635. The next support is near 1.0620, below which the pair could start a major decline.
USD/JPY Technical Analysis
On the hourly chart of USD/JPY at FXOpen, the pair started a decent increase from the 144.70 zone. The US Dollar gained bullish momentum above 146.10 against the Japanese Yen.
It settled above the 50-hour simple moving average and 147.00. A high is formed near 147.80 and the pair is now correcting gains. On the downside, the first major support is near the trend line at 147.20.
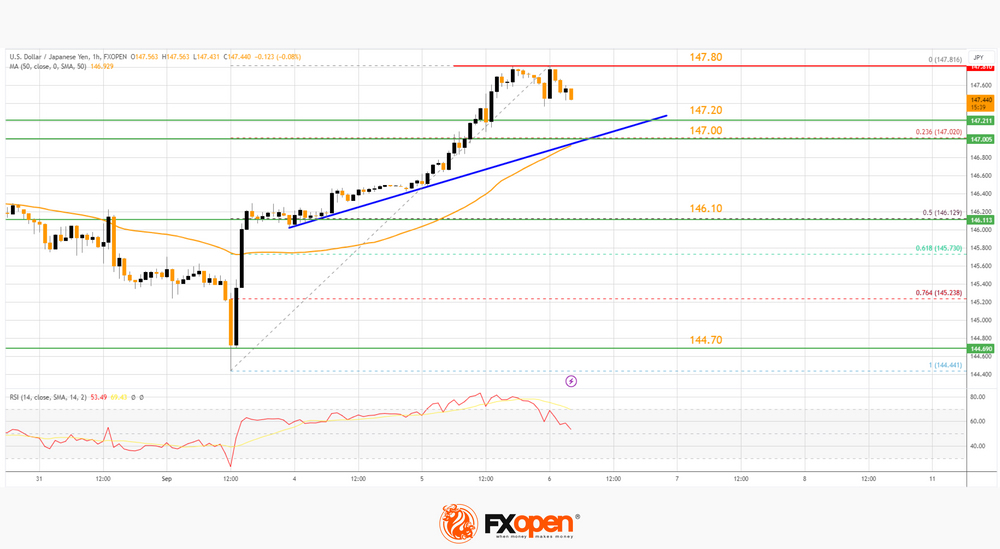
The next major support is near the 23.6% Fib retracement level of the upward move from the 144.44 swing low to the 147.81 high at 147.00 and the 50-hour simple moving average. If there is a close below 147.00, the pair could decline steadily.
In the stated case, the pair might drop toward the 50% Fib retracement level of the upward move from the 144.44 swing low to the 147.81 high at 146.10. The next stop for the bears may perhaps be near the 144.70 region.
Immediate resistance on the USD/JPY chart is near 147.80. The first major resistance is near 148.00. If there is a close above the 148.00 level and the RSI moves above 60, the pair could rise toward 148.80. The next major resistance is near 149.20, above which the pair could test 150.00 in the coming days.
This article represents the opinion of the Companies operating under the FXOpen brand only. It is not to be construed as an offer, solicitation, or recommendation with respect to products and services provided by the Companies operating under the FXOpen brand, nor is it to be considered financial advice.