

Sample Category Title
GBP/USD Daily Outlook
Daily Pivots: (S1) 1.2517; (P) 1.2577; (R1) 1.2625; More...
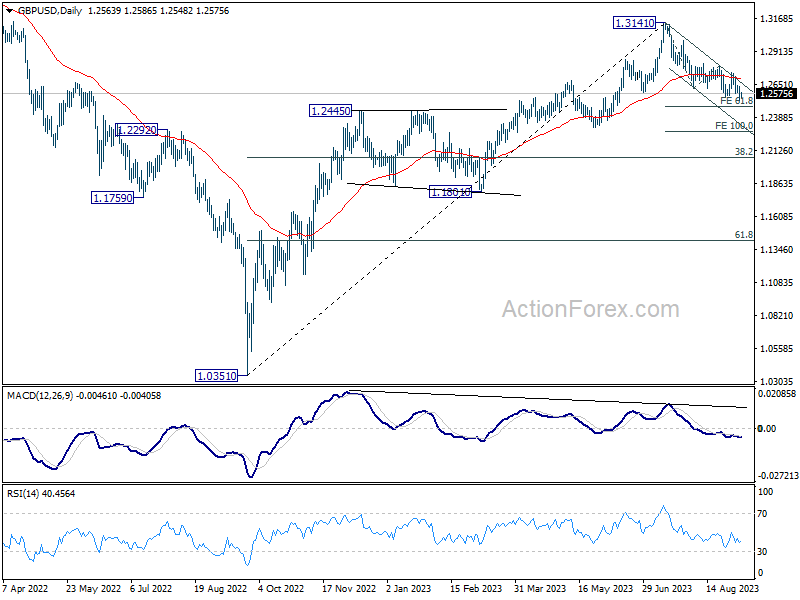
Intraday bias in GBP/USD stays on the downside at this point. Fall from 1.3141 should target 61.8% projection of 1.3141 to 1.2618 from 1.2799 at 1.2476. Firm break there could prompt downside acceleration to 100% projection at 1.2276. On the upside, above 1.2641 minor resistance will turn intraday bias neutral first.
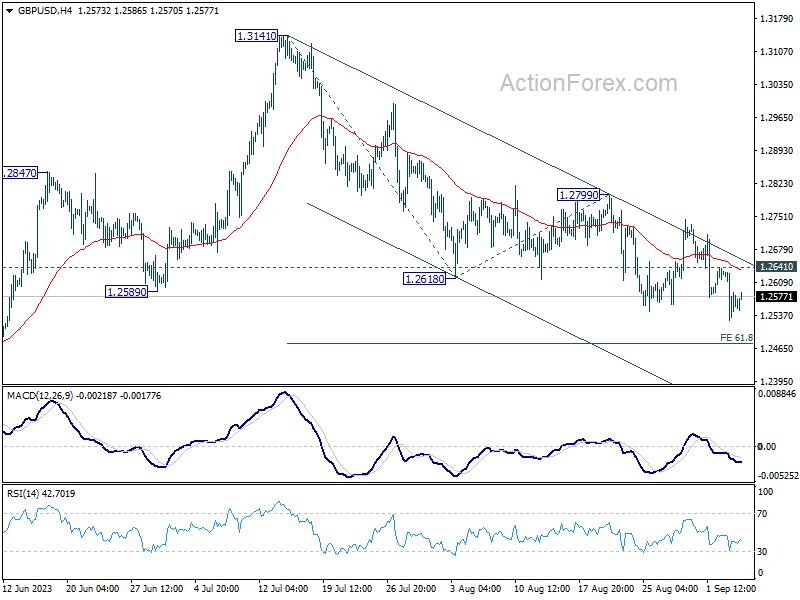
In the bigger picture, fall from 1.3141 medium term top is seen as a correction to up trend from 1.0351 (2022 low). Deeper decline would be seen to 38.2% retracement of 1.0351 to 1.3141 at 1.2075. Strong support would be seen there to bring rebound on first attempt. But outlook will be neutral at best as long as 1.3141 resistance holds, and consolidation from there is set to extend, until further development.
USD/CHF Daily Outlook
Daily Pivots: (S1) 0.8855; (P) 0.8879; (R1) 0.8919; More....
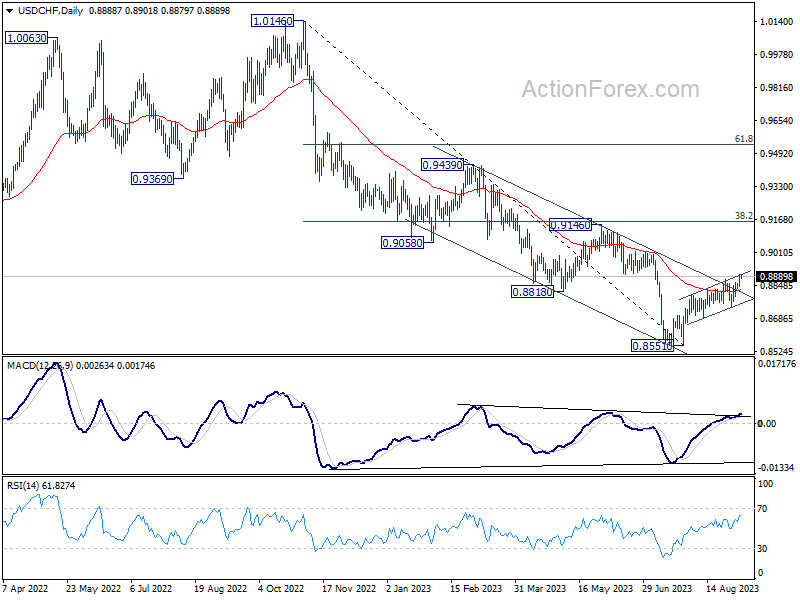
Intraday bias in USD/CHF remains on the upside at this point. Current rise from 0.8551 should target 0.9146 cluster resistance. On the upside, below 0.8831 minor support will turn intraday bias neutral first. But risk will stay on the upside as long as 0.8743 support holds.
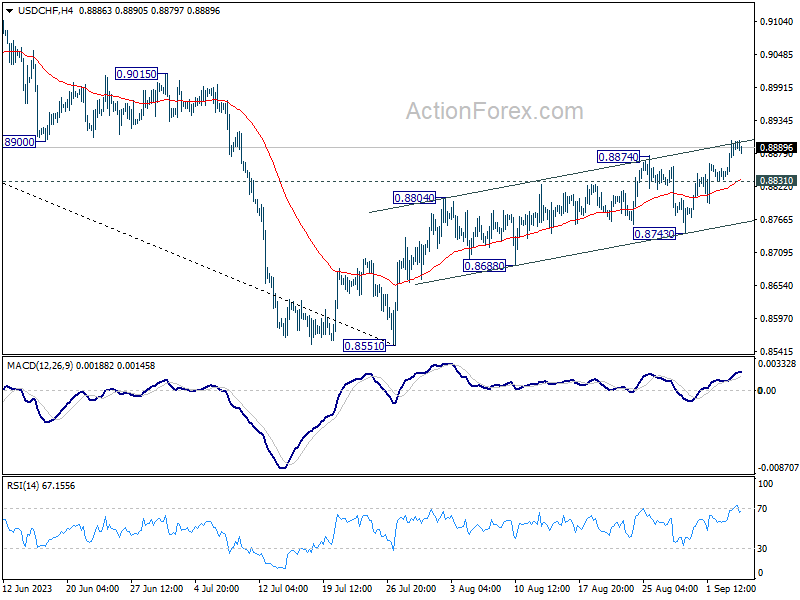
In the bigger picture, rebound from 0.8551 medium term bottom is currently seen as a correction to the downtrend from 1.0146 (2022 high). Further rally would be seen to 0.9146 cluster resistance (38.2% retracement of 1.0146 to 0.8551 at 0.9160). Strong resistance could be seen there to limit upside, at least on first attempt.
Oil Prices Rise to New Year-Highs and Verbal JPY Intervention
Market movers today
In Germany, we receive factory orders for July. The June figures beat all expectations with an increase of 7% m/m. However, the positive surprise was driven by a base effect from a large drop in May together with a large increase in major orders in June; the latter was likely due to a large order from the aerospace company Airbus. Excluding major orders, German factory orders declined 2.6% m/m, which is more in line with the dire readings from other activity indicators such as the PMIs. Due to the large one-off increase last month, we will likely see a decline today in the July figures.
Today also brings the July retail sales for the euro area. Retail sales in real terms has been weak this year and surprised on the downside in June. The latest increases in consumer confidence should give some support to the figures, but consensus is looking for a 0.2% m/m decline.
In the US, we get ISM non-manufacturing. Leading data indicates they will be on the weak side.
In Poland, we expect the central bank to cut the base rate to 6.5% from 6.75%.
Overnight, we also get trade balance figures from China, where weak exports have caught attention lately.
The 60 second overview
Yesterday Saudi Arabia announced that it is extending its 1mb/d unilateral output cut through the rest of the year. This sent oil prices to new year-highs with Brent briefly trading above USD 90/bbl. On the one hand, markets and economies now need to deal with the consequences of a higher oil price. On the other hand, markets and economies, and in particular oil importers, should find comfort in the fact that by keeping its oil production at a very low level Saudi Arabia has only managed to increase oil prices so much. We think it reveals that demand is weak, e.g. due to weak growth in Europe and China, and it shows that other producers are gaining market shares. For example the US likely will produce record amounts of crude this year and new producers, e.g. Guyana, are emerging. Furthermore, the USD is on the rise again, which dampens oil demand outside US. We doubt Saudi Arabia will cut production further; however, it may opt to extend cuts into 2024. But for the reasons above, we doubt it will have great impact on oil prices. We keep our forecast for Brent to average USD 80/bbl the next year.
The USD/JPY rapid rise since the latter part of last week, from below 145 to above 147.5, spurred verbal intervention from the Japanese authorities overnight. Vice finance minister for international affairs Masato Kanda stated that "if these moves continue, the government will deal with them appropriately without ruling out any options". Following the announcement USD/JPY dropped below 147.50 but later hit a 10-month high at 147.80. At the time of writing, the cross is trading at 147.50. The Japanese authorities last intervened in October 2022 of an estimated USD 62bn. If authorities resort to actual intervention this may cap the topside in USD/JPY in the near term but we still expect that the main drivers of USD/JPY to be more fundamental, such as an exit from the accommodative monetary policy. Overnight, Bank of Japan (BoJ) board member Takata said that there are positive signs that will support the BoJ's objective of a 2% inflation target although he stated that "we need to continue patiently with large-scale easing as uncertainties are extremely high." Likewise, we expect central banks in advanced economies likely not to be far from turning dovish. See FX markets comment below for further details.
Equities: Global equities were lower yesterday with Japanese stocks going against the trend. It is the same picture today with Japan outperforming other markets in Asia. Japan currently holds the loosest monetary policy and the strongest macro momentum in the western world. This has benefited the equity market and in our opinion will continue to do so. Yes, Japanese CPI is rising and above target (currently 3.4% y/y) but in our minds it makes sense to continue with an extraordinary loose monetary policy as structural deflation scare takes more than just 12 months to battle.
In the rest of the world, it is interesting to see energy and tech outperforming together while utilities, materials and industrial are lower and the worst performers. Again, this very muddy sector picture just shows that there is no clear narrative in equities driven by one dominating macro factor. In US yesterday, Dow -0.6%, S&P 500 -0.4%, Nasdaq -0.1% and Russell 2000 -2.1%.
FI: Global rates were subject to a selling pressure all through yesterday. The long end was the underperformers as markets had to digest the supply from especially Austria in the 10y and 30y areas. While ECB's Lane in an interview on 31 August said that the recent inflation release was welcoming it was not enough to support EGBs on the day.
FX: Yesterday, the sour sentiment, mainly from China, supported the USD with the DXY index hitting the highest level since March and EUR/USD breaking below 1.0750. USD/JPY rose above 147.5 in yesterday's session, triggering verbal intervention from the Japanese authorities overnight. The cyclically sensitive SEK ran into to a double-whammy yesterday after weak PMI services, where China fell to 51.8 and Sweden to 49.0. Saudi Arabia's announcement yesterday of extending its 1mb/d unilateral output cut through the rest of the year sent oil prices to a new year-high briefly above USD90/bbl.
Credit: Softish equity markets set the tone on Tuesday, but credit market were somewhat more directionless. Itrax Main widened 0.3bp to close at 69.7bn, while Itrax Xover widened 0.9bp to close at 392.2bp. Primary market supply continued to be ample, which (among others) was exemplified by a USD2.35bn multi-tranche offering by cigarette-giant Phillip Morris.
Rising Oil Prices Give Off a Foul Smell
Released yesterday, the European services PMI data came in softer than expected in all major euro area locations. The data showed that services sector in Italy and Spain slipped into the contraction zone in August - a month of big summer holidays where people flock to Italian and Spanish cities and beaches. The soft PMI data fueled the European Central Bank (ECB) doves and pushed the EURUSD under a bus yesterday; the pair fell to the lowest levels since the beginning of June and flirted with the 1.07 support on idea that the ECB can’t raise interest rates next week when the economic picture is souring at speed. But I believe that it can. The ECB can announce another 25bp hike when it meets next week, or a faster reduction of its balance sheet, or the end of remuneration of banks’ minimum reserves to tighten financial conditions, because the latest inflation figures from the Eurozone showed stagnation, instead of further easing, and the ECB will allow economic weakness to some extent to fight inflation. The most recent inflation expectations in the Eurozone showed that the next 12-month expectations remained steady at 3.4%, but the three-year inflation expectations spiked to 3.4%, and there is no reason for inflation expectations to continue easing when energy prices are going up toward the sky.
More cuts
Brent crude rallied past the $90pb yesterday, as US crude advanced above the $88pb mark as Saudi Arabia and Russia announce that they prolong their supply cuts. Saudi Arabia will continue reducing its own unilateral supply by 1mbpd to the end of the year, while Russia will be cutting 300’000 bpd. The kneejerk reaction to the news was a sharp jump in oil prices but the news was not a shocker per se, investors knew that something was cooking. What surprised the market, however, is the timeline: cuts are announced for another 3 months.
The million barrel question now is: is $100pb back on the table? It’s unsure, and the road that could lead crude oil prices toward the $100pb psychological mark will likely be bumpy, because higher energy prices have already started being reflected in inflation and inflation expectations. As a result, the central banks, including the Fed, will have little choice but to keep their monetary policies sufficiently tight to prevent an uptick in inflation. That could mean further rate hikes, or keeping the rates at restrictive levels for longer, in which case, oil prices make a U-turn and cheapen due to recession and global demand concerns.
And when global demand worries kick in, and prices cheapen, Saudi will be losing money considering that the kingdom is shouldering the supply cut strategy for OPEC alone. For now, the demand outlook remains strong despite the slowing China and suffering Europe, but if it weakened, Saudi could easily change its mind, and the kingdom has a history of making sharp U-turns on its decision when winds turn against them.
‘Hell of a good week of data’
Interestingly, higher oil prices don’t seem to bother some Federal Reserve (Fed) members. Christopher Waller said at a CNBC interview yesterday that last week was a ‘hell of a good week of data’ which will allow the Fed ‘to proceed carefully’ with its next decisions. ‘We can just sit there, wait for the data, and see if things continue’ he said. They could also pray while waiting for the data to deteriorate, as higher energy prices won’t be any less problematic for the Fed.
Anway, both the US 2-year and 10-year yields jumped yesterday, because many companies flooded the market with debt sales. The US saw $36bn bond sales yesterday, the highest ytd. The S&P500 fell 0.42%, while Nasdaq eked out a small gain as Tesla jumped more than 4.5% on news that its China-made EV deliveries rose 9.3%, comforting investors that the price cuts in China may be playing in favour of the company.
Technical Outlook and Review
DXY:
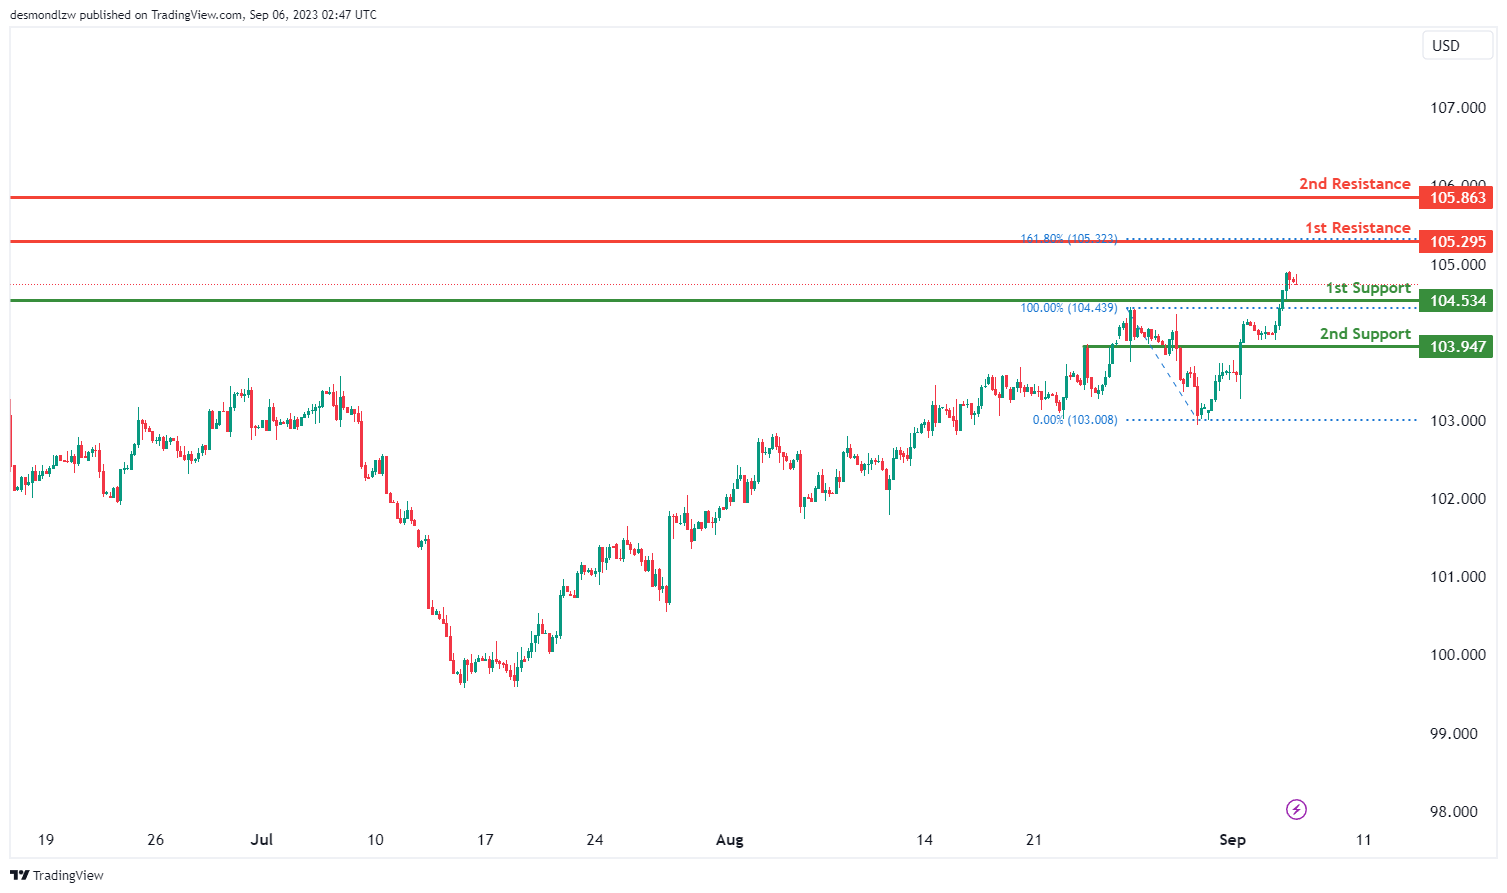
The DXY chart is currently characterized by a bullish overall momentum, indicating the potential for an upward trend in price movement.
There’s the possibility of a bullish continuation towards the 1st resistance level at 105.29, which is considered a significant level due to its alignment with a swing high resistance and the presence of the 161.80% Fibonacci Extension.
Support levels include the 1st support at 104.53, which is seen as a pullback support, and the 2nd support at 103.94, recognized as an overlap support.
Additionally, the 2nd resistance at 105.86 is marked as a swing high resistance, suggesting a potential area of resistance should the price continue its bullish movement.
EUR/USD:
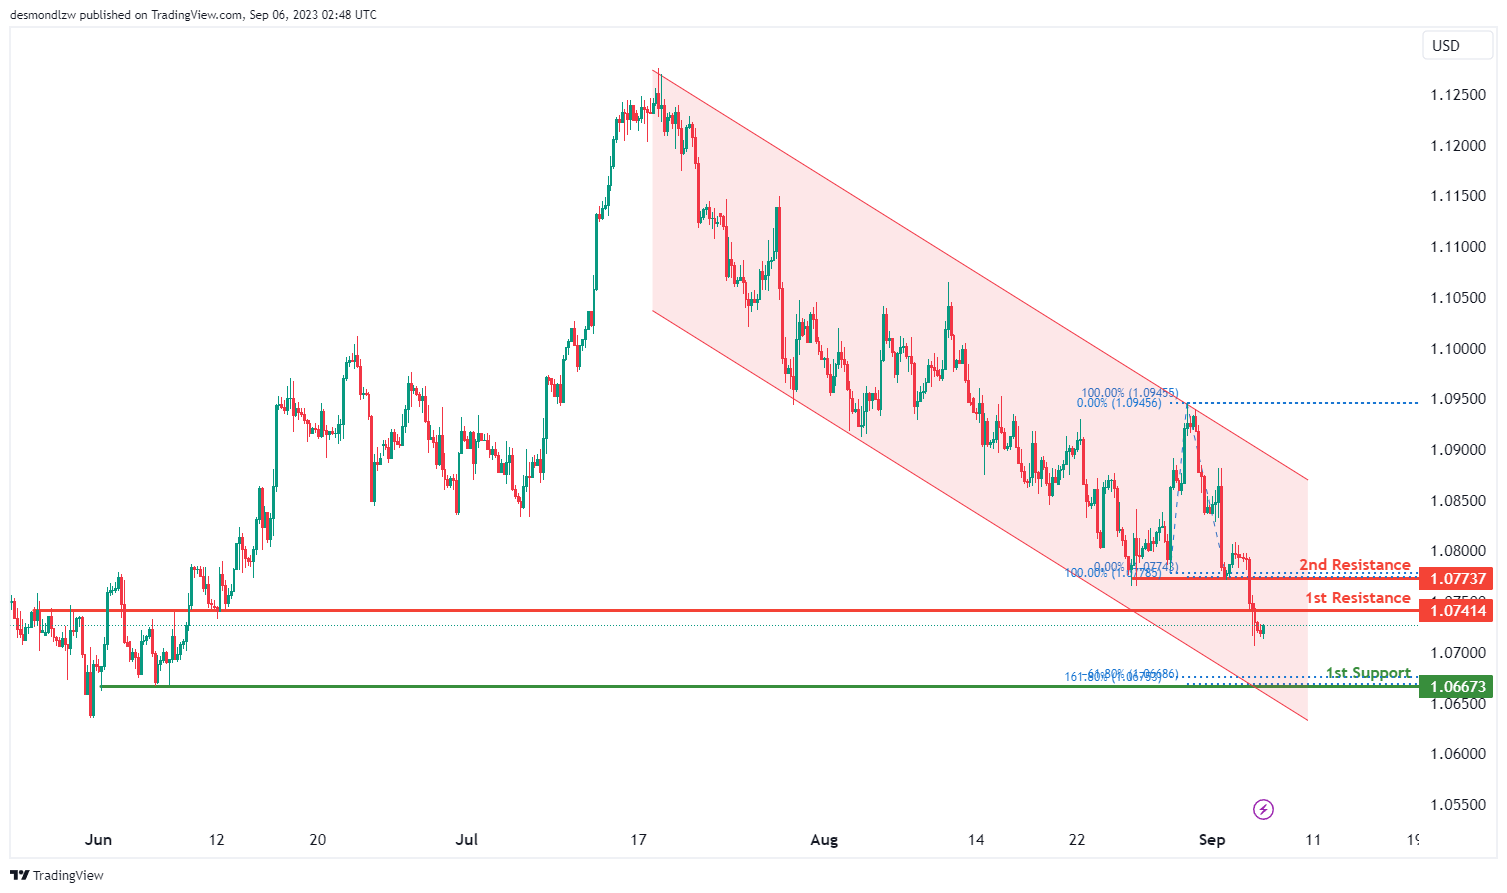
The EUR/USD chart currently exhibits a bearish momentum, characterized by its position within a descending channel.
There’s potential for a bearish continuation towards the 1st support level at 1.0667. This support is significant due to its alignment with a swing low support, the presence of the 161.80% Fibonacci Extension, and the -61.8% Fibonacci Expansion, indicating a strong Fibonacci confluence.
On the resistance side, the 1st resistance at 1.0741 is identified as a pullback resistance, while the 2nd resistance at 1.0773 also acts as a pullback resistance. These levels could potentially serve as barriers to any bullish movement.
EUR/JPY:
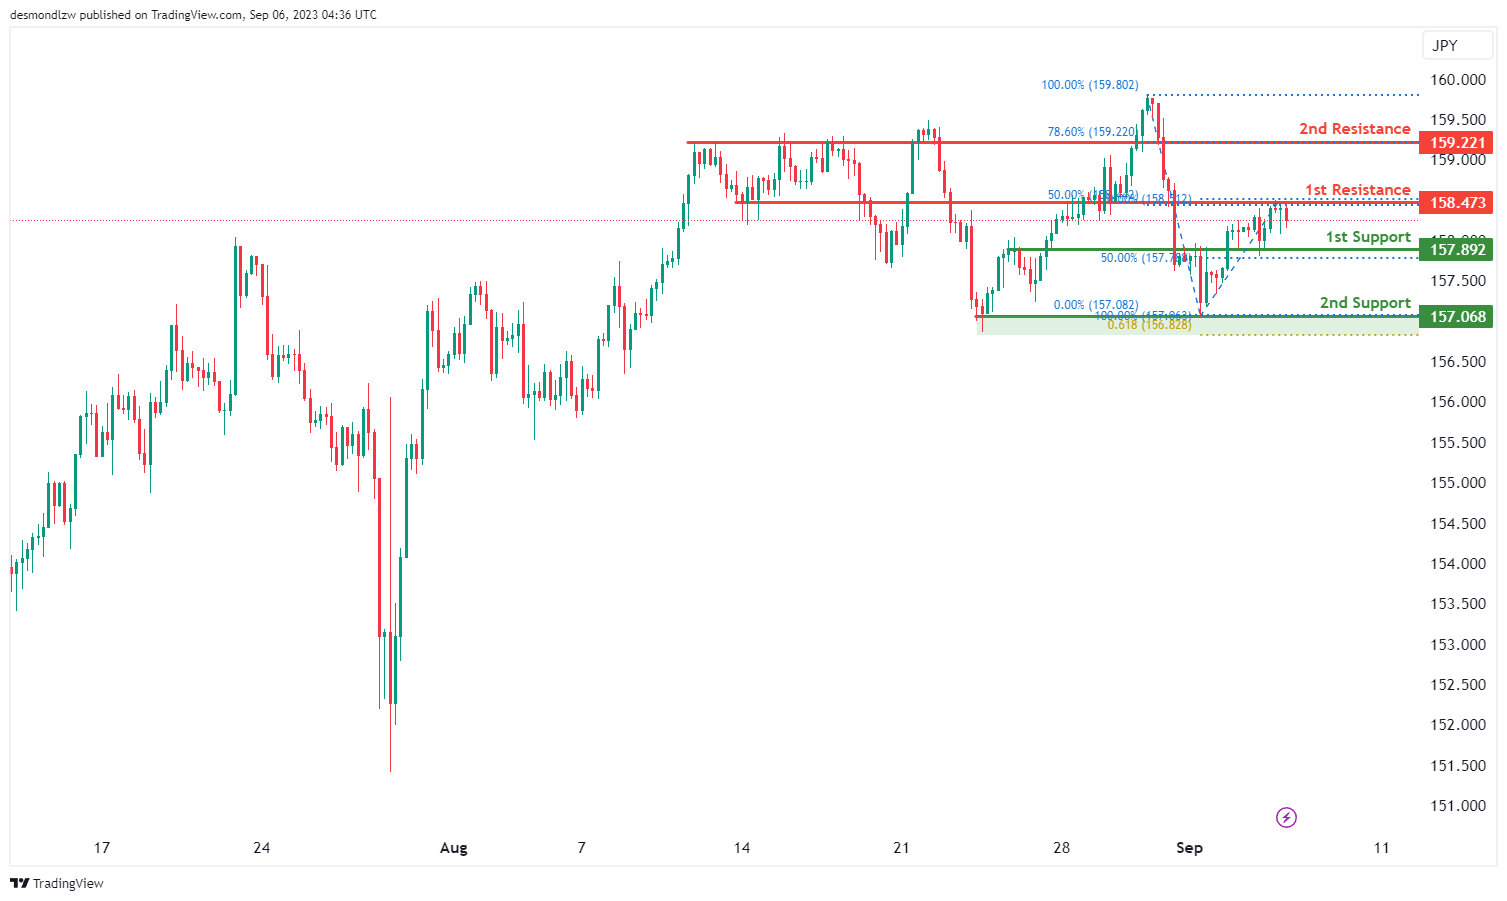
The instrument EUR/JPY currently exhibits a neutral overall momentum on the chart.
In this context, there is a potential scenario where the price could fluctuate between the 1st resistance level at 158.47 and the 1st support level at 157.89.
The 1st support level at 157.89 is considered good because it represents overlap support and aligns with a 50% Fibonacci Retracement. Additionally, there is a 2nd support level at 157.06, which is significant as it represents multi-swing low support and aligns with a 61.80% Fibonacci Projection.
On the resistance side, the 1st resistance at 158.47 is noteworthy because it serves as overlap resistance and aligns with a 50% Fibonacci Retracement.
Furthermore, the 2nd resistance level at 159.22 is considered significant as it represents overlap resistance and aligns with a 78.60% Fibonacci Retracement.
EUR/GBP:
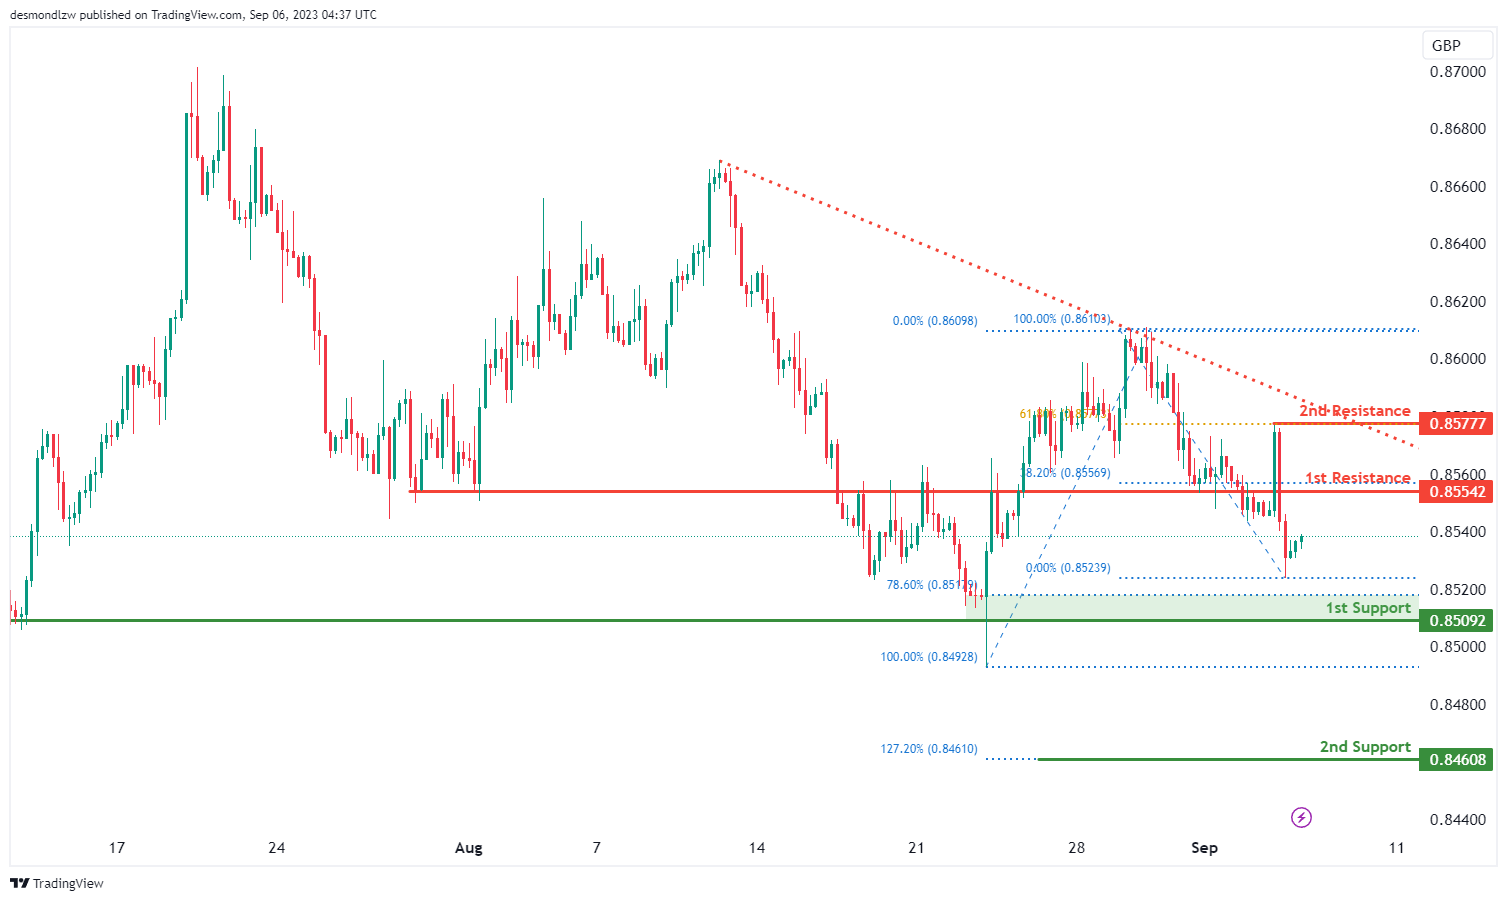
The instrument EUR/GBP currently displays a bearish overall momentum on the chart, primarily influenced by the fact that the price is below a major descending trend line, indicating a bearish trend is in place.
In this context, there is a potential short-term scenario where the price could rise towards the 1st resistance level at 0.8554 before reversing off it and subsequently dropping towards the 1st support level at 0.8509.
The 1st support level at 0.8509 is considered strong as it represents multi-swing low support and aligns with a 78.60% Fibonacci Retracement.
Additionally, there is a 2nd support level at 0.8460, which is significant as it represents swing low support and aligns with a 127.20% Fibonacci Extension.
On the resistance side, the 1st resistance at 0.8554 is noteworthy because it serves as overlap resistance and aligns with a 38.20% Fibonacci Retracement.
Furthermore, the 2nd resistance level at 0.8577 is considered significant as it represents swing high resistance and aligns with a 61.80% Fibonacci Retracement.
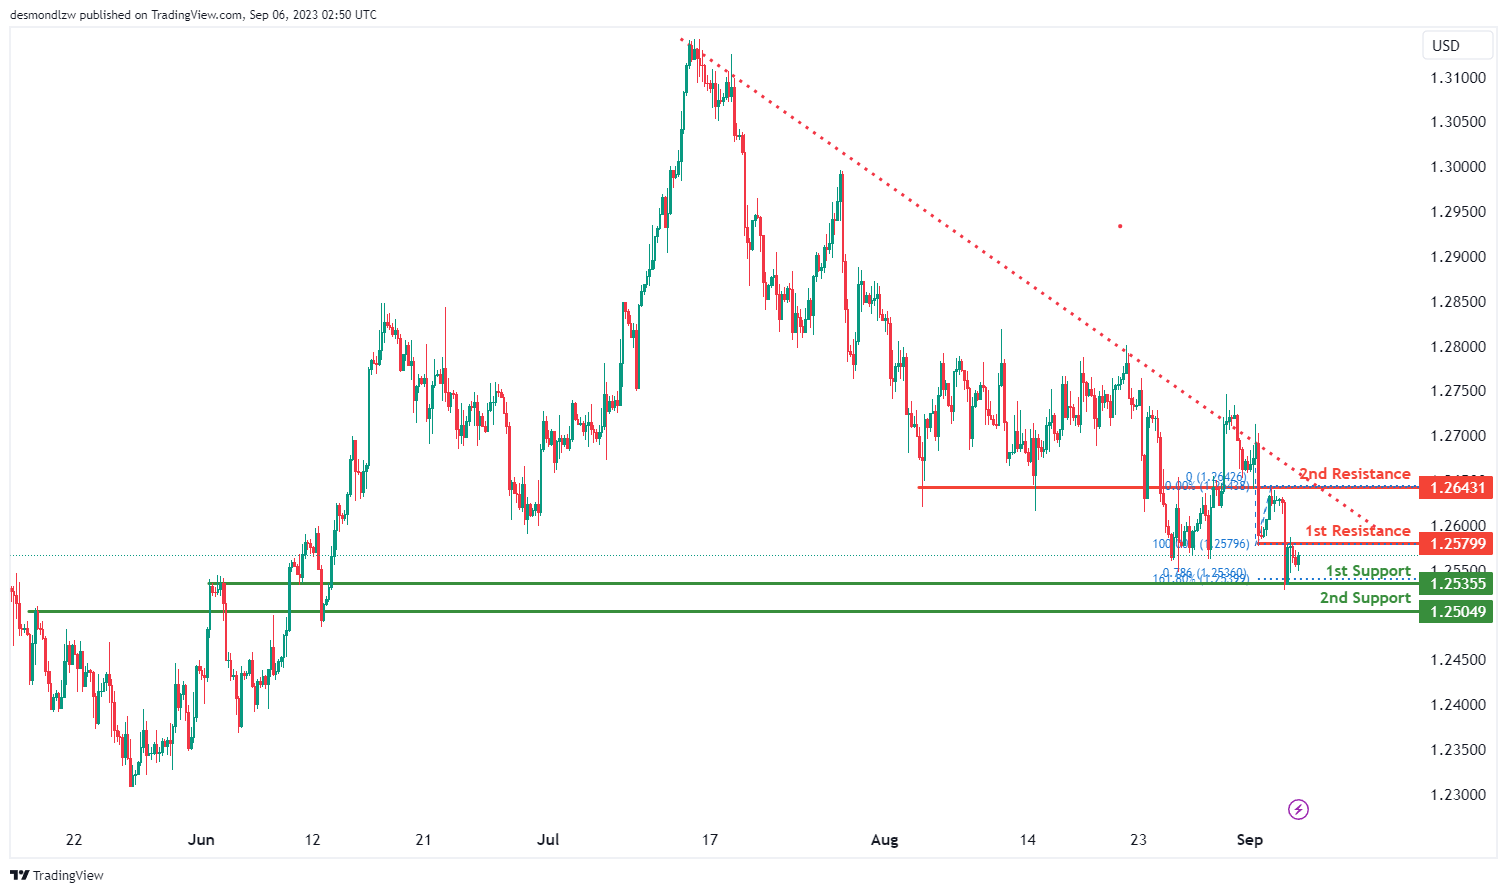
GBP/USD:
The GBP/USD chart currently maintains a bearish momentum, with price positioned below a significant descending trend line, indicating a potential for continued bearish movement.
There’s a likelihood of a bearish reaction at the 1st resistance level, potentially leading to a decline towards the 1st support.
The 1st support at 1.2535 is identified as a multi-swing low support and aligns with the 78.60% Fibonacci Projection and the 161.80% Fibonacci Extension, signifying a strong Fibonacci confluence, thereby adding to its significance as a potential support level.
Another 1st support at 1.2504 is marked as an overlap support, indicating historical instances of price finding support around this level.
Looking at resistance levels, the 1st resistance at 1.2579 is designated as an overlap resistance, while the 2nd resistance at 1.2643 also functions as an overlap resistance. These levels could act as barriers to any bullish movements.
GBP/JPY:
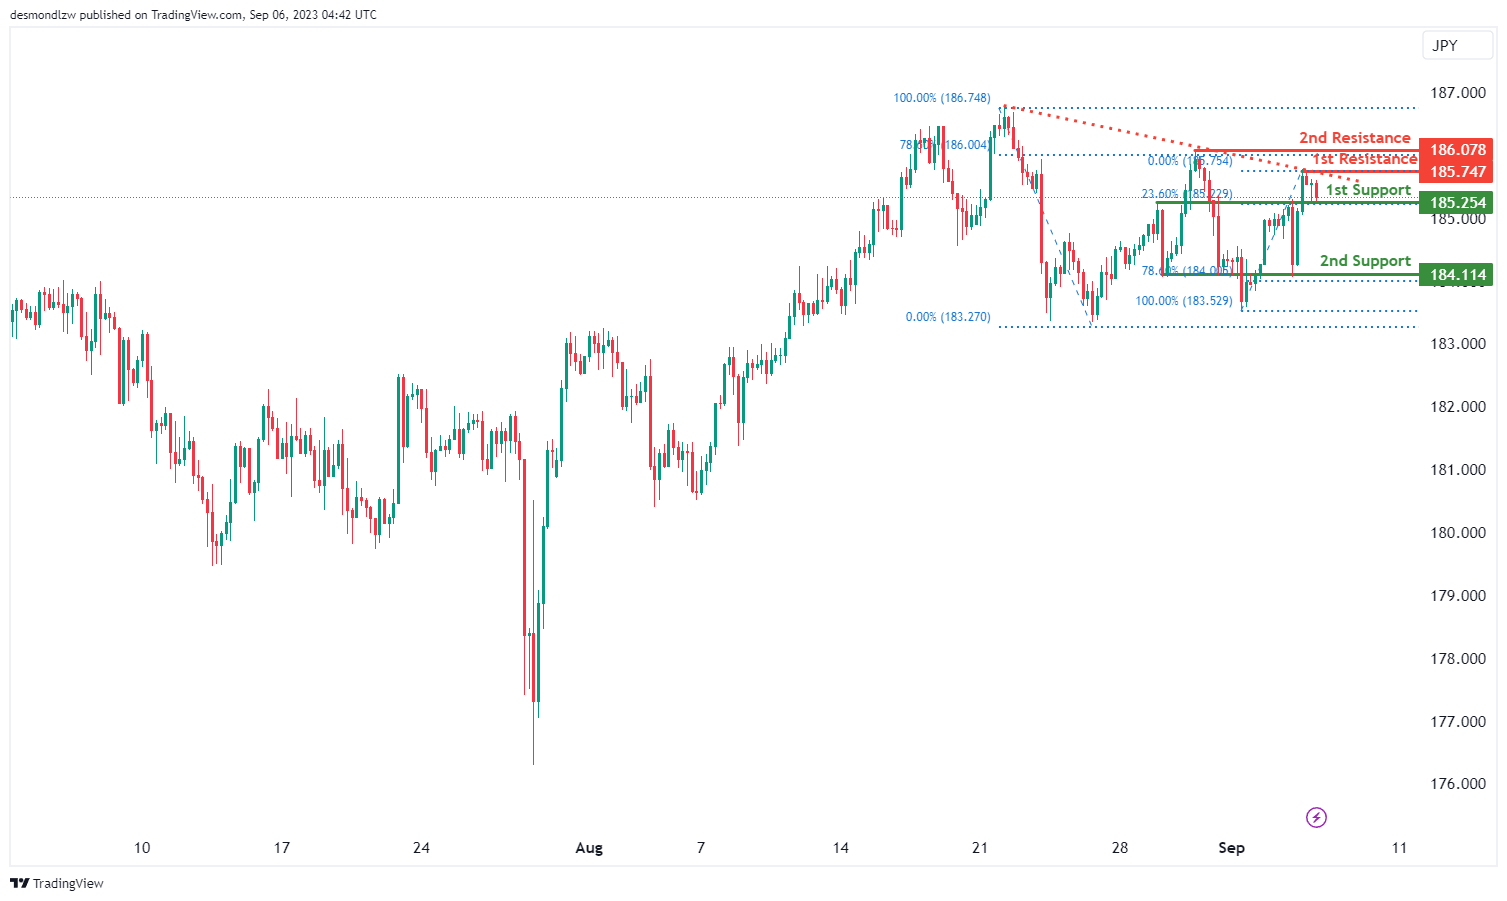
The instrument GBP/JPY currently exhibits a neutral overall momentum on the chart.
In this context, there is a potential scenario where the price could fluctuate between the 1st resistance level at 185.74 and the 1st support level at 185.25.
The 1st support level at 185.25 is considered good because it represents pullback support and aligns with a 23.60% Fibonacci Retracement. Additionally, there is a 2nd support level at 184.11, which is significant as it represents overlap support and aligns with a 78.60% Fibonacci Retracement.
On the resistance side, the 1st resistance at 185.74 is noteworthy because it serves as swing high resistance.
Furthermore, the 2nd resistance level at 186.07 is considered significant as it represents swing high resistance and aligns with a 78.60% Fibonacci Retracement.
USD/CHF:
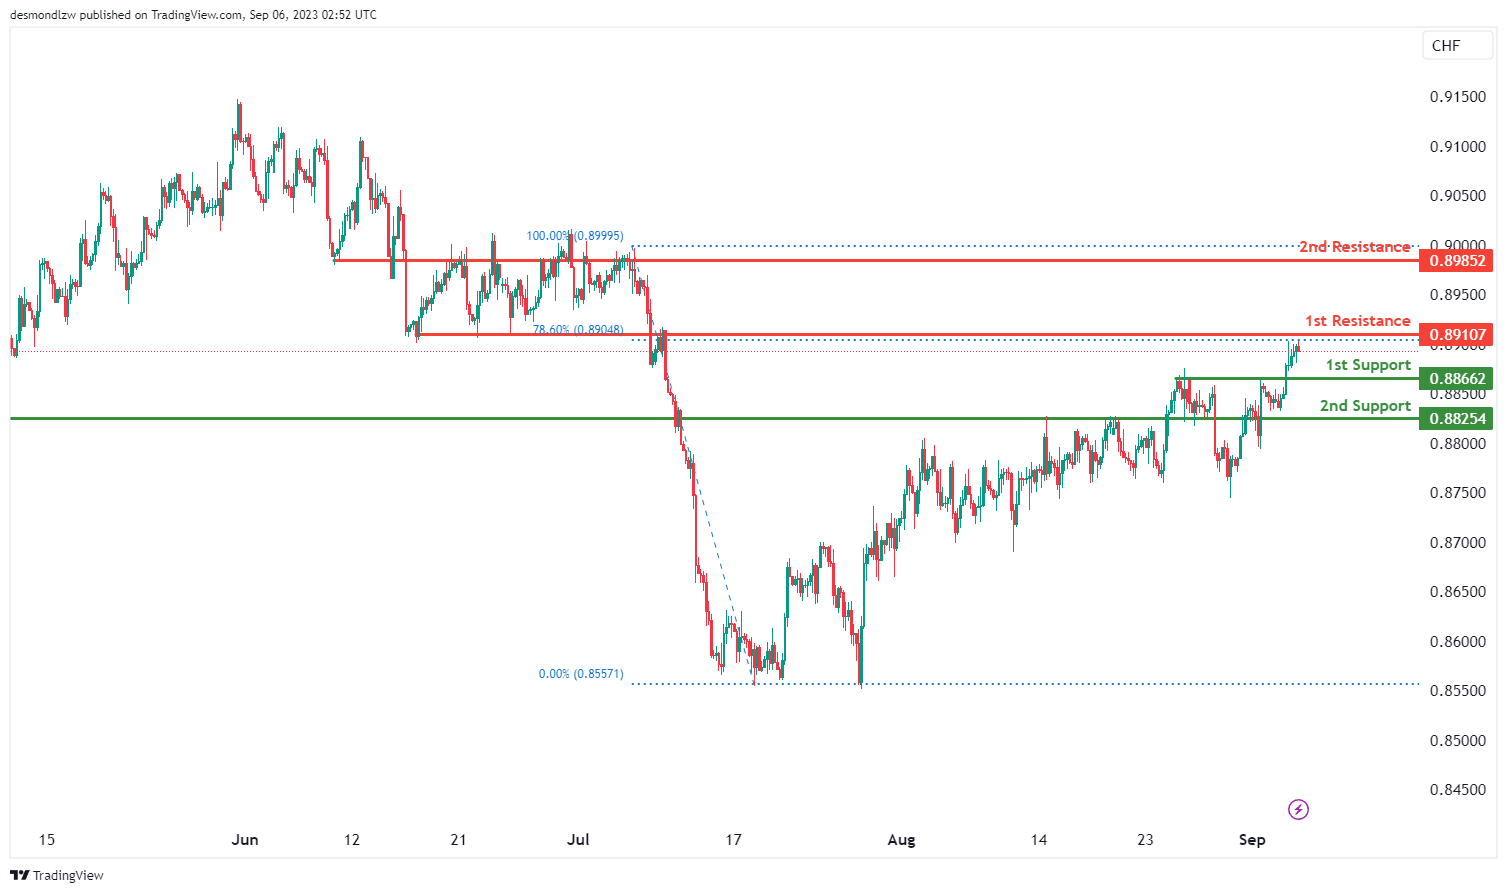
The USD/CHF chart currently exhibits a bearish momentum, indicating a potential downward trend in price movement.
There’s a possibility of a bearish reaction at the 1st resistance level, potentially leading to a drop towards the 1st support.
The 1st support at 0.8866 is identified as a pullback support, while the 2nd support at 0.8825 also functions as a pullback support, reinforcing their significance as potential areas of price support.
On the resistance side, the 1st resistance at 0.8910 is marked as an overlap resistance, and the 2nd resistance at 0.8985 is also identified as an overlap resistance. These resistance levels may act as barriers to any bullish moves.
USD/JPY:
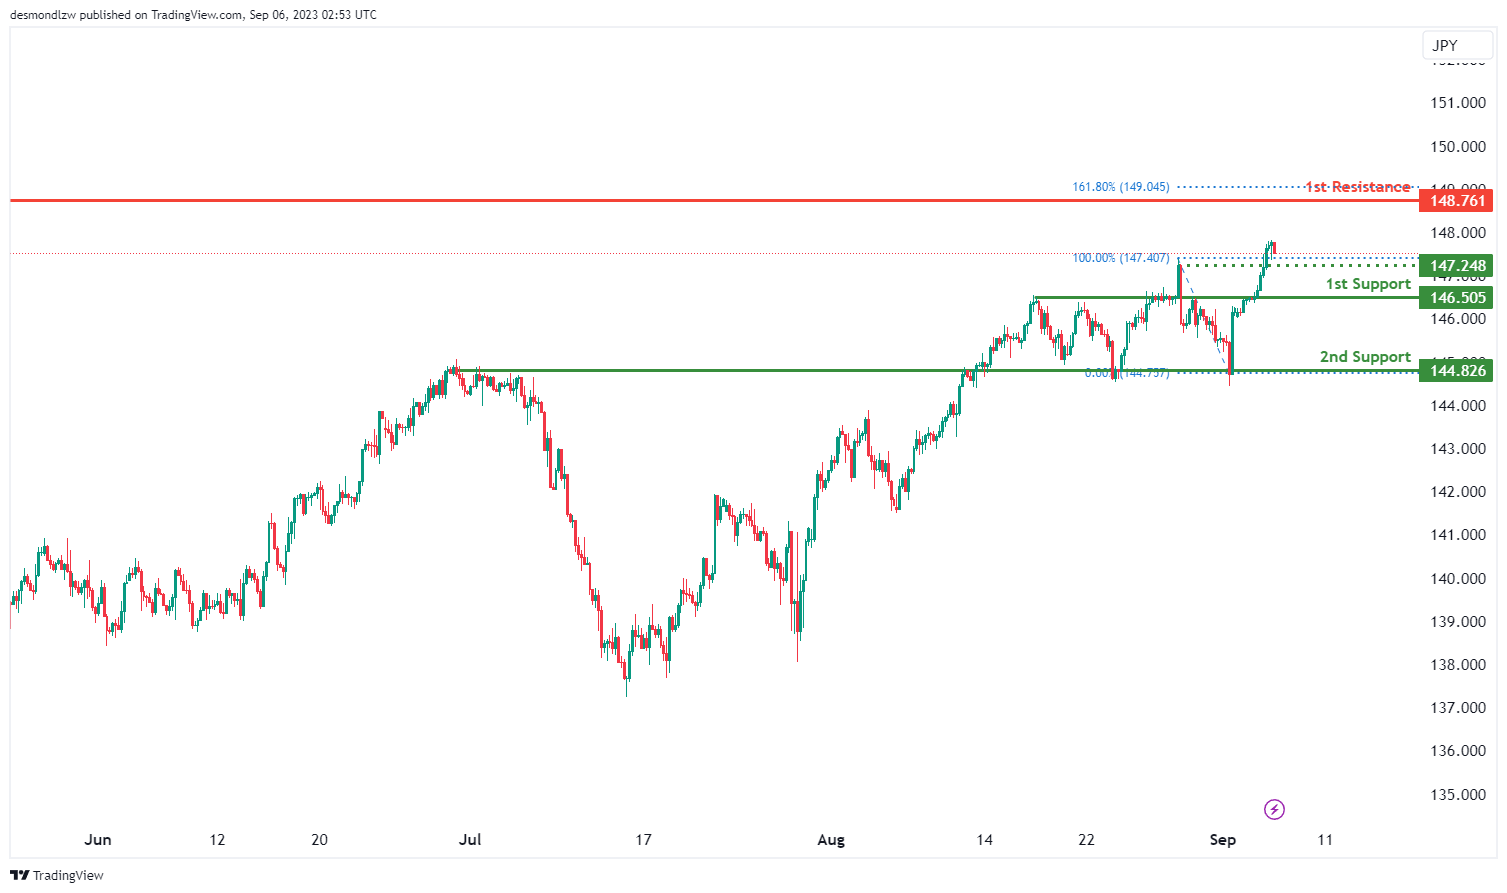
The USD/JPY chart currently exhibits a bullish overall momentum, indicating a potential upward trend in price movement.
There’s a possibility of a bullish continuation towards the 1st resistance level at 148.76.
The 1st support at 146.50 is identified as a pullback support, while the 2nd support at 144.82 is considered an overlap support. These support levels may provide a foundation for potential price increases.
The 1st resistance at 148.76 is marked as a swing high resistance and is also aligned with the 161.80% Fibonacci Extension, further enhancing its significance as a potential barrier to bullish movement. An intermediate support level at 147.24 is also noted.
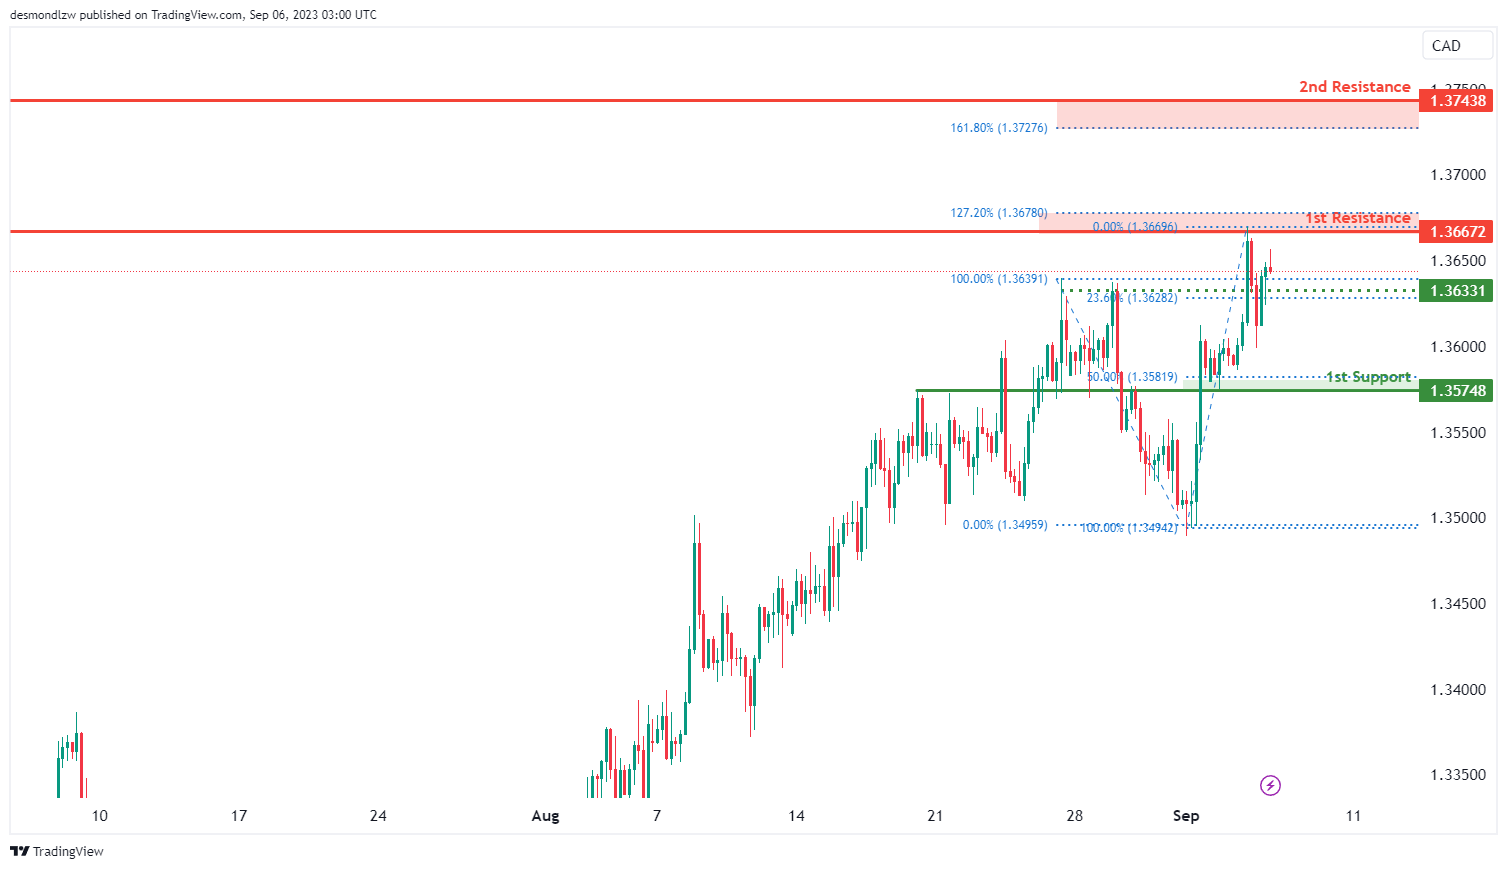
USD/CAD:
The USD/CAD chart currently demonstrates an overall bullish momentum, indicating an upward trend in its price movement. In this scenario, there is potential for a short-term drop towards the intermediate support level.
The intermediate support level at 1.3633 which is identified as a pullback support that aligns with the 23.60% Fibonacci retracement level. Further below, the 1st support level at 1.3575 is identified as an overlap support that aligns with the 50.00% Fibonacci retracement level.
To the upside, the 1st resistance level at 1.3667 is identified as a swing-high resistance that aligns with the 127.20% Fibonacci extension level. Additionally, the 2nd resistance level at 1.3744 is marked as an overlap resistance that aligns with the 161.80% Fibonacci extension level.
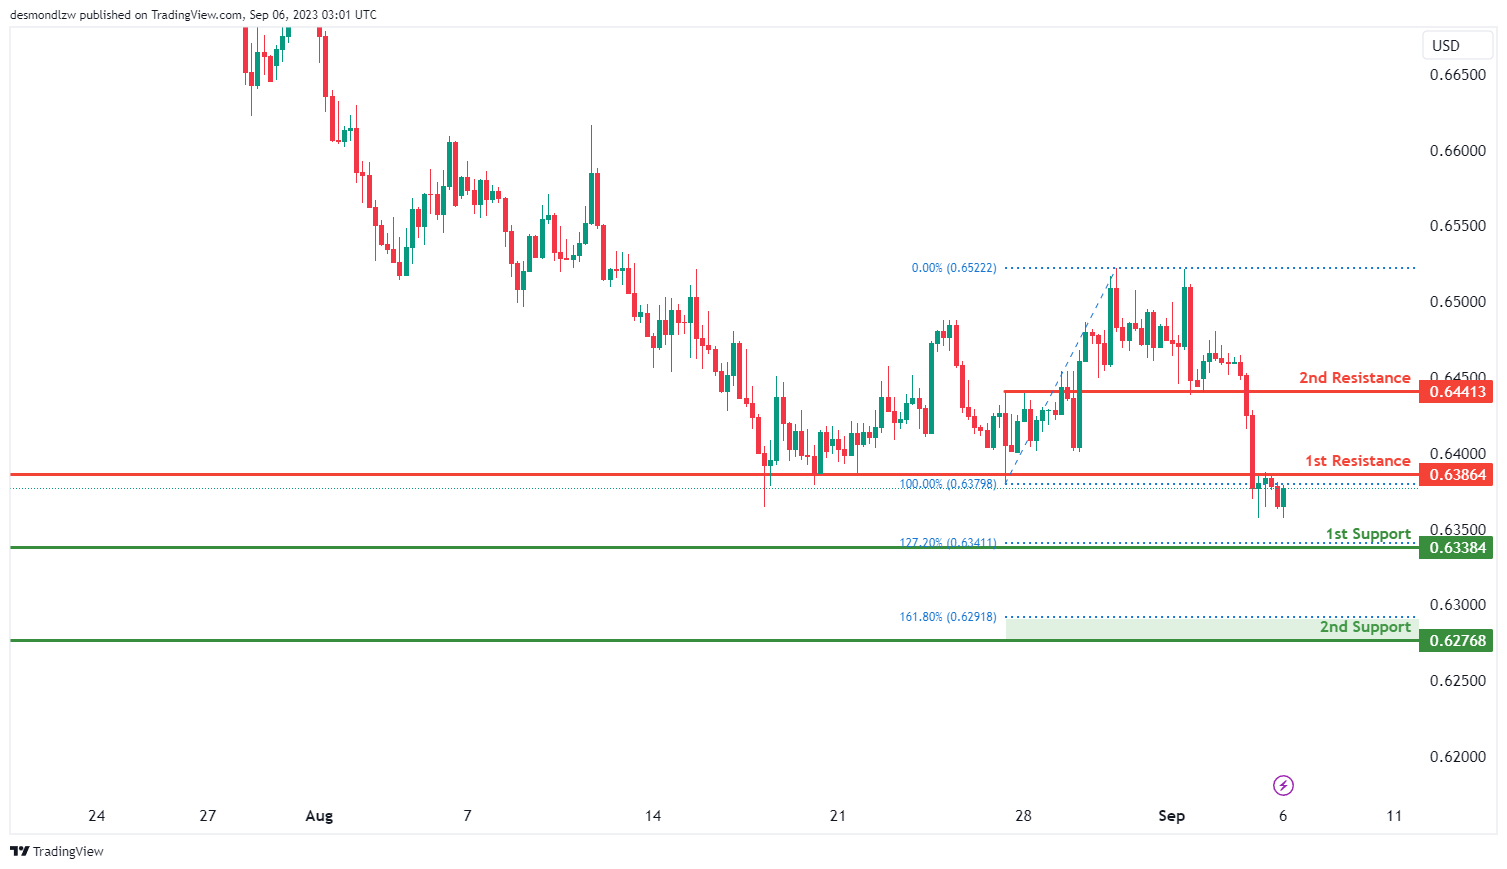
AUD/USD:
The AUD/USD chart currently exhibits an overall bearish momentum, indicating a potential downward trend in its price movement. In this scenario, there’s a likelihood of a bearish reaction occurring off the 1st resistance level at 0.6386, potentially leading to a decline towards the 1st support level.
The 1st support level at 0.6338 is identified as an overlap support that aligns with the 127.20% Fibonacci projection level. Additionally, the 2nd support level at 0.6277 is identified as a pullback support that coincides with the 161.80% Fibonacci projection level.
To the upside, the 1st resistance level at 0.6386 is marked as an overlap resistance. Similarly, the 2nd resistance level at 0.6441 is also identified as an overlap resistance, further emphasizing its potential significance as a level where price could face resistance.
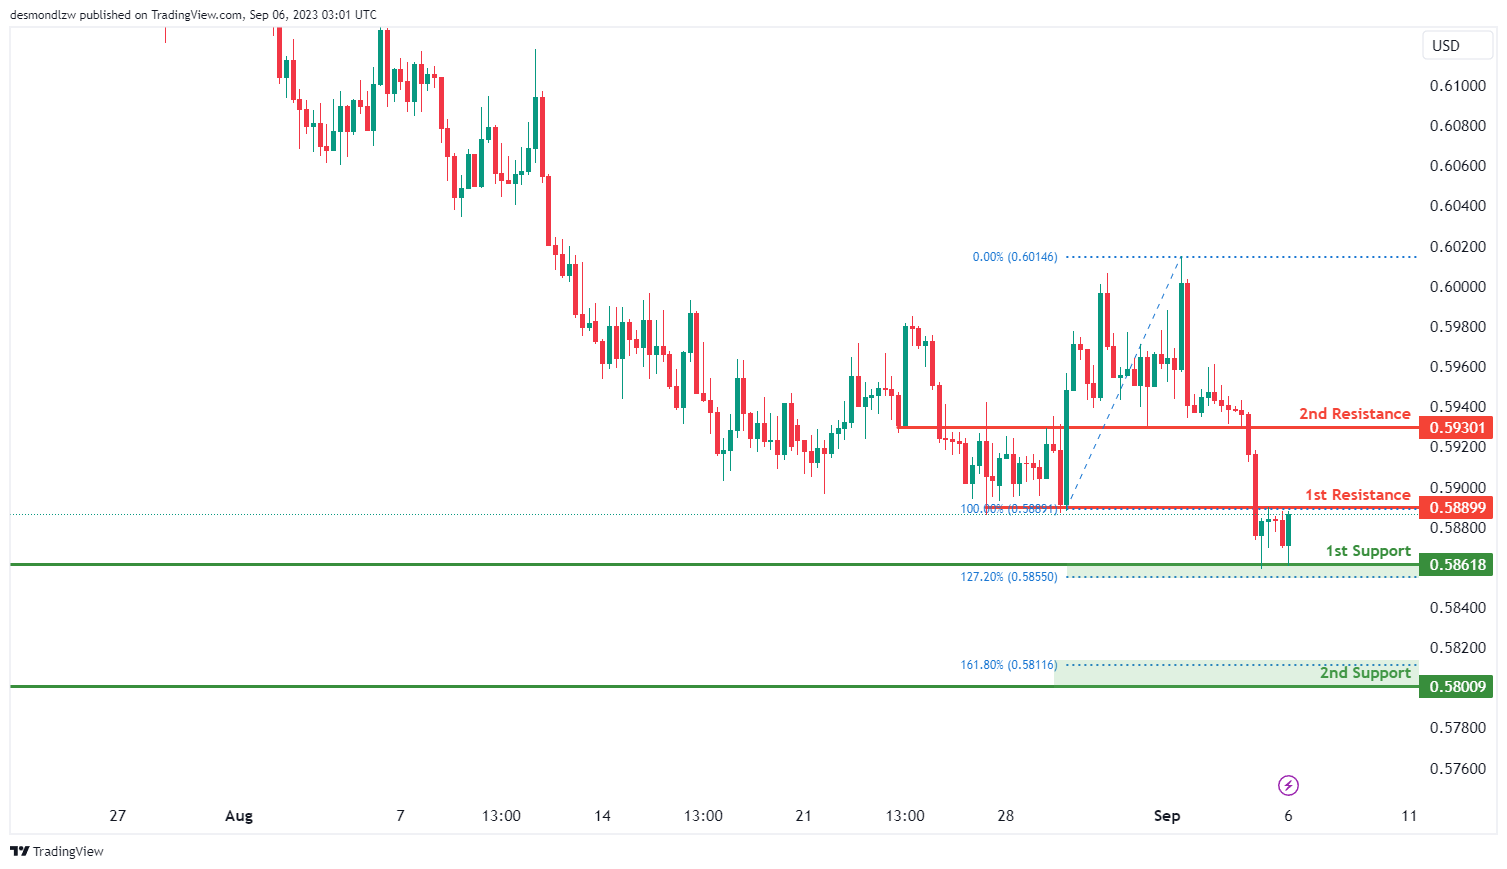
NZD/USD
The NZD/USD chart currently indicates an overall bearish momentum, suggesting a downward trend in its price movement. In this scenario, there is potential for a bearish reaction emerging from the 1st resistance level at 0.5889, leading to a possible decline towards the 1st support level.
The 1st support level at 0.5862 is identified as an overlap support that aligns with the 127.20% Fibonacci extension level. Similarly, the 2nd support level at 0.5801 is also identified as an overlap support that coincides with the 161.80% Fibonacci extension level.
To the upside, the 1st resistance level at 0.5889 is marked as an overlap resistance while the 2nd resistance level at 0.5930 is also identified as an overlap resistance, further emphasizing its potential significance as a level where price could face resistance.
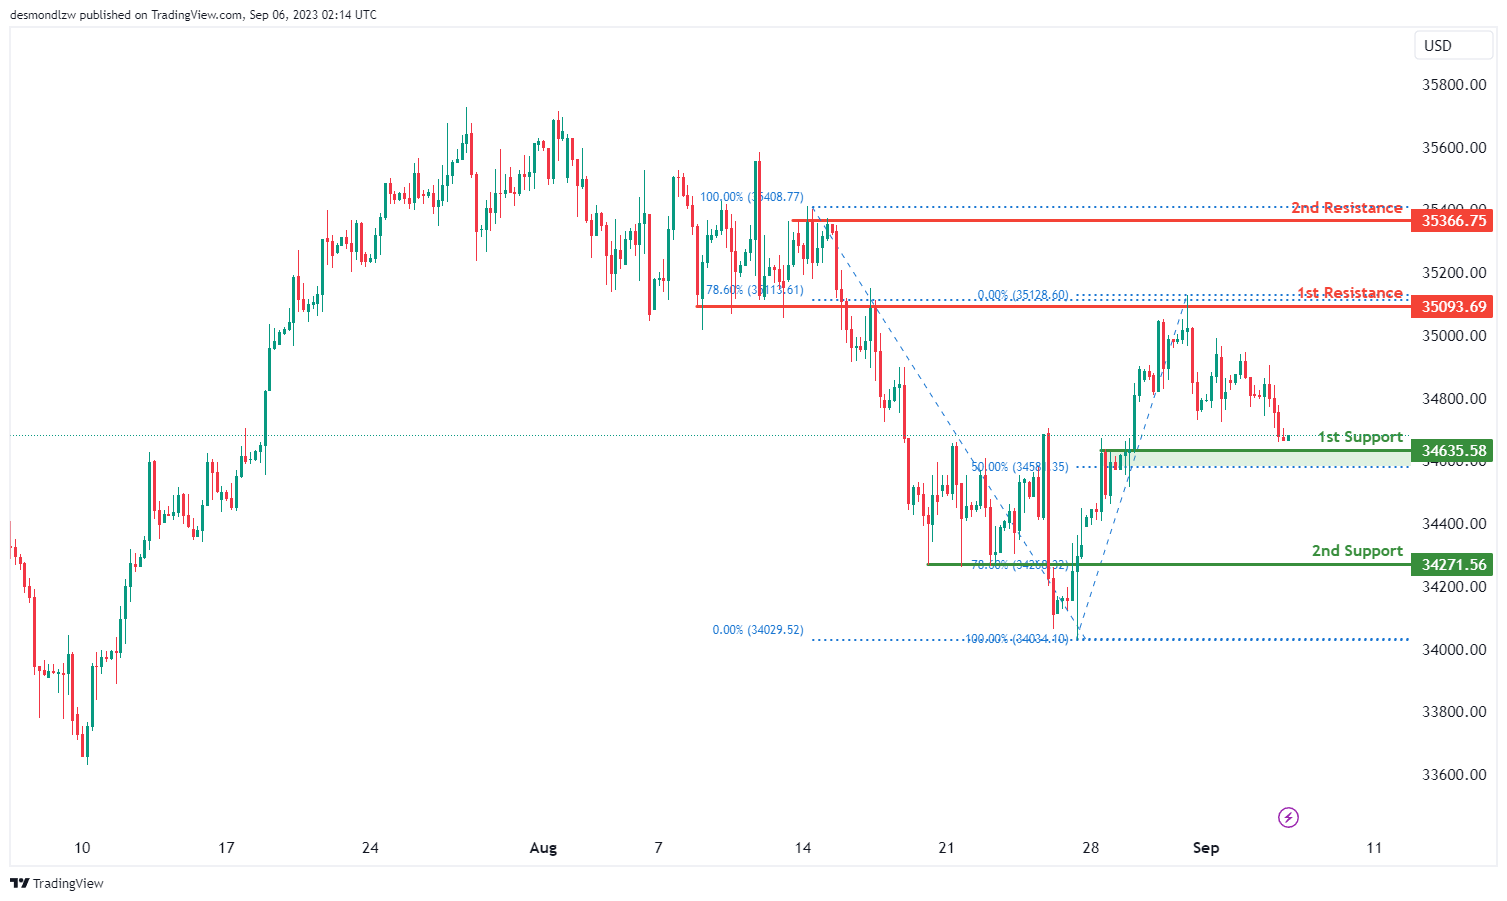
DJ30:
The instrument DJ30 currently exhibits a bullish overall momentum on the chart.
There is a potential scenario where the price could make a bullish bounce off the 1st support level at 34635.50 and subsequently move towards the 1st resistance level at 35093.60.
The 1st support level at 34635.50 is considered strong because it represents overlap support and aligns with a 50% Fibonacci Retracement.
Additionally, there is a 2nd support level at 34271.50, which is also significant as it represents pullback support and aligns with a 78.60% Fibonacci Retracement.
On the resistance side, the 1st resistance at 35093.60 is notable because it serves as overlap resistance and aligns with a 78.60% Fibonacci Retracement.
Furthermore, the 2nd resistance level at 35366.70 is considered significant as it represents multi-swing high resistance.
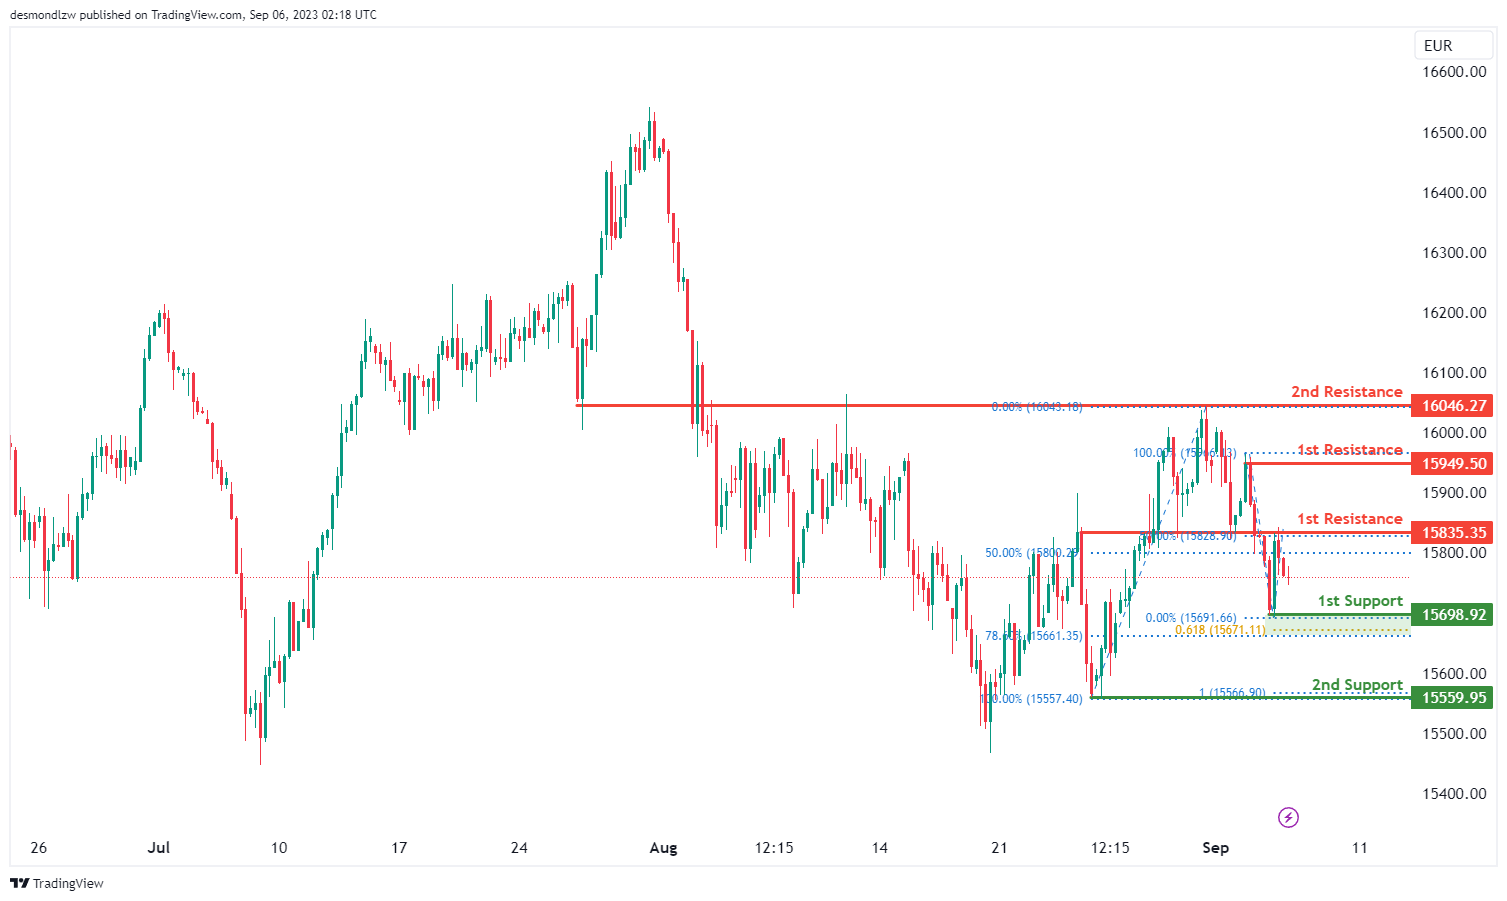
GER30:
The instrument GER30 currently reflects a bullish overall momentum on the chart.
However, there is a potential short-term scenario where the price could drop further to the 1st support level at 15698.9 before bouncing from there and subsequently rising towards the 1st resistance level at 15835.3.
The 1st support level at 15698.9 is considered strong because it represents swing low support and aligns with a 78.60% Fibonacci Retracement and a 61.80% Fibonacci Projection, indicating Fibonacci confluence.
Additionally, there is a 2nd support level at 15559.9, which is significant as it represents swing low support and aligns with a 100% Fibonacci Projection.
On the resistance side, the 1st resistance at 15835.3 is noteworthy because it serves as swing high resistance and aligns with a 50% Fibonacci Retracement.
Furthermore, the 2nd resistance level at 16046.2 is considered significant as it represents overlap resistance.
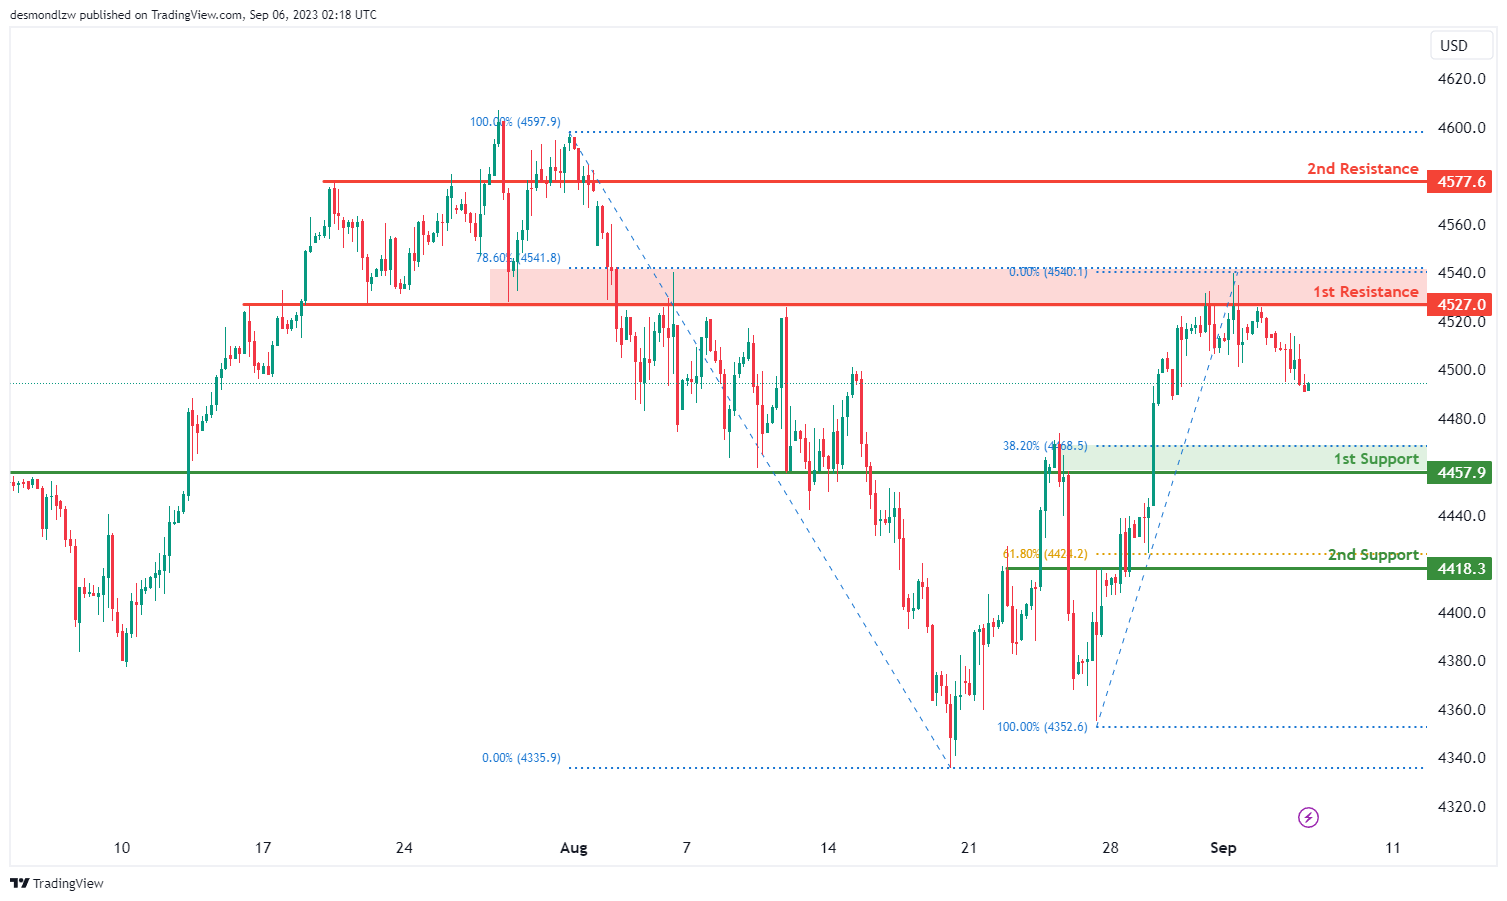
US500
The instrument US500 (S&P 500) currently demonstrates a bearish overall momentum on the chart.
There is a potential scenario where the price could continue its bearish movement towards the 1st support level at 4457.9.
The 1st support level at 4457.9 is considered strong because it represents pullback support and aligns with a 38.20% Fibonacci Retracement.
Additionally, there is a 2nd support level at 4418.3, which is also significant as it represents pullback support and aligns with a 61.80% Fibonacci Retracement.
On the resistance side, the 1st resistance at 4527.0 is noteworthy as it serves as overlap resistance and aligns with a 78.60% Fibonacci Retracement.
Furthermore, the 2nd resistance at 4577.6 is considered significant as it represents overlap resistance.
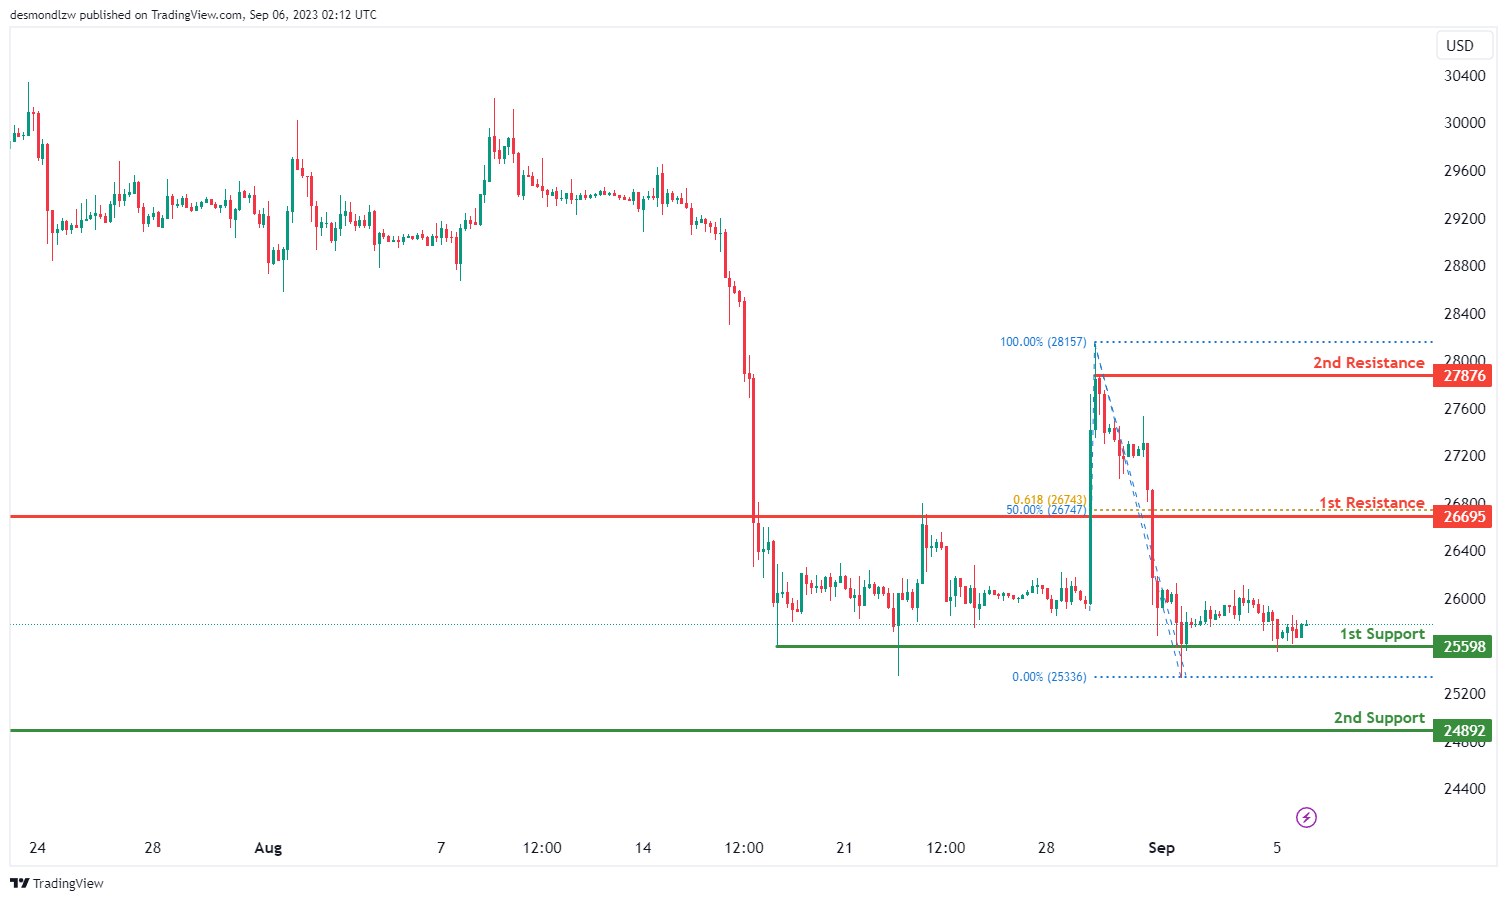
BTC/USD:
The instrument BTC/USD currently reflects a bullish overall momentum on the chart.
Price is potentially set to make a bullish move, bouncing off the 1st support level at 25598. This support level is considered good because it represents multi-swing low support.
There is also a 2nd support level at 24892, which is significant as it represents swing low support.
On the resistance side, the 1st resistance at 26695 is seen as a strong point because it serves as a pullback resistance and aligns with both a 50% Fibonacci Retracement and a 61.80% Fibonacci Projection, indicating Fibonacci confluence.
Furthermore, the 2nd resistance at 27876 is considered significant as it represents swing high resistance.
Overall, the chart suggests a bullish momentum, with the potential for a bullish bounce off the 1st support level, leading towards the 1st resistance level for BTC/USD.
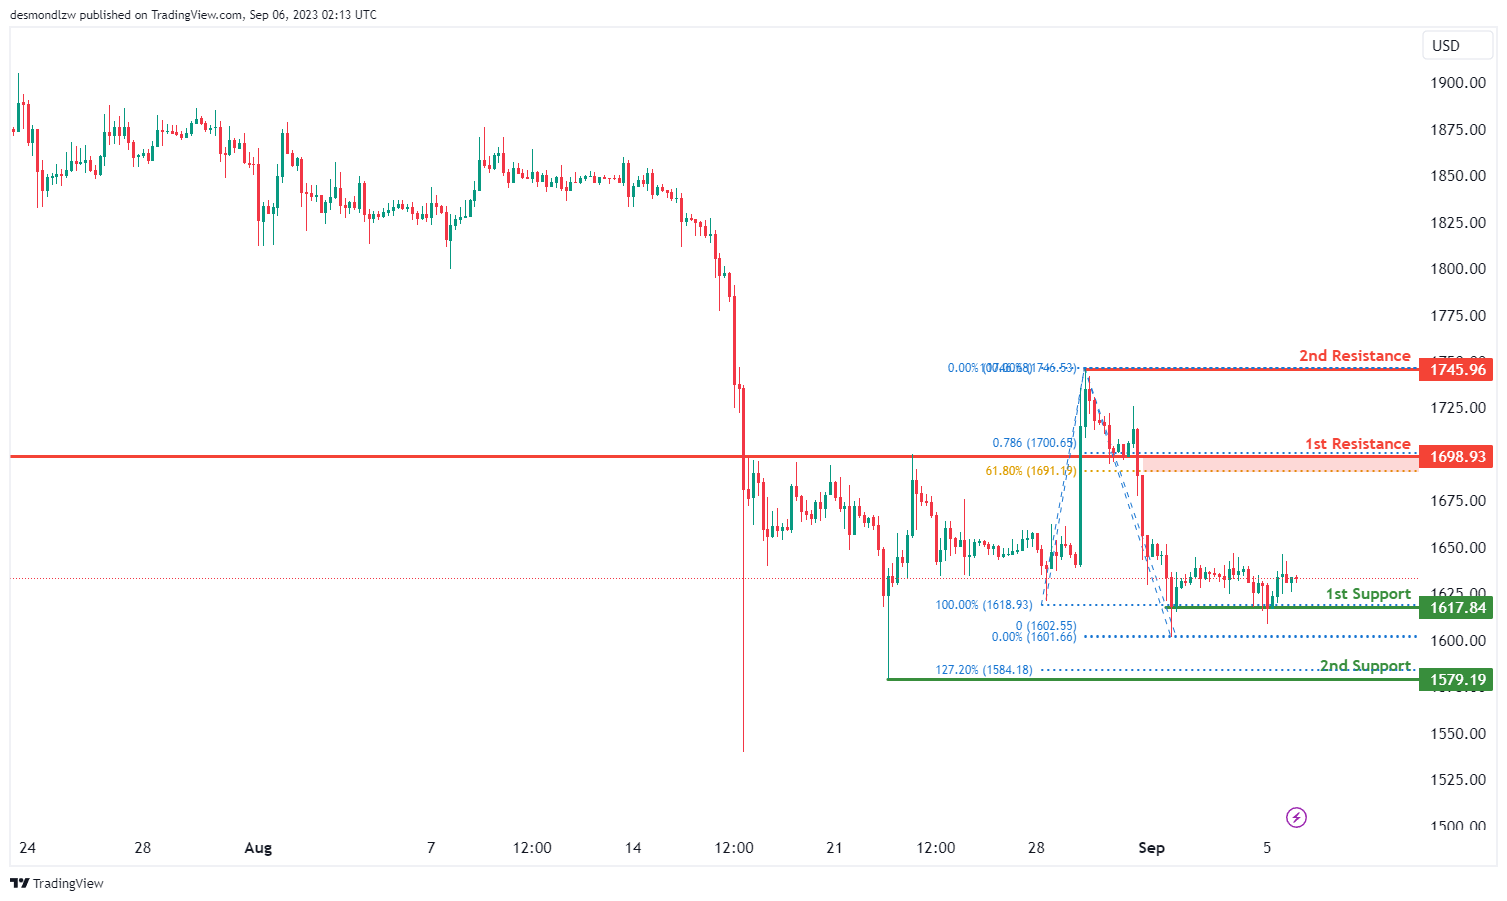
ETH/USD:
The instrument ETH/USD currently demonstrates a bullish overall momentum on the chart.
There’s a potential scenario where the price could make a bullish move by bouncing off the 1st support level at 1617.84. This support level is considered strong because it represents multi-swing low support.
Additionally, there is a 2nd support level at 1579.19, which is significant as it represents swing low support and aligns with a 127.20% Fibonacci Extension.
On the resistance side, the 1st resistance at 1698.93 is notable as it serves as a pullback resistance and aligns with both a 61.80% Fibonacci Retracement and a 78.60% Fibonacci Projection, indicating Fibonacci confluence.
Furthermore, the 2nd resistance at 1745.96 is considered significant as it represents swing high resistance.
Overall, the chart suggests a bullish momentum, with the potential for a bullish bounce off the 1st support level, leading towards the 1st resistance level for ETH/USD.
WTI/USD:
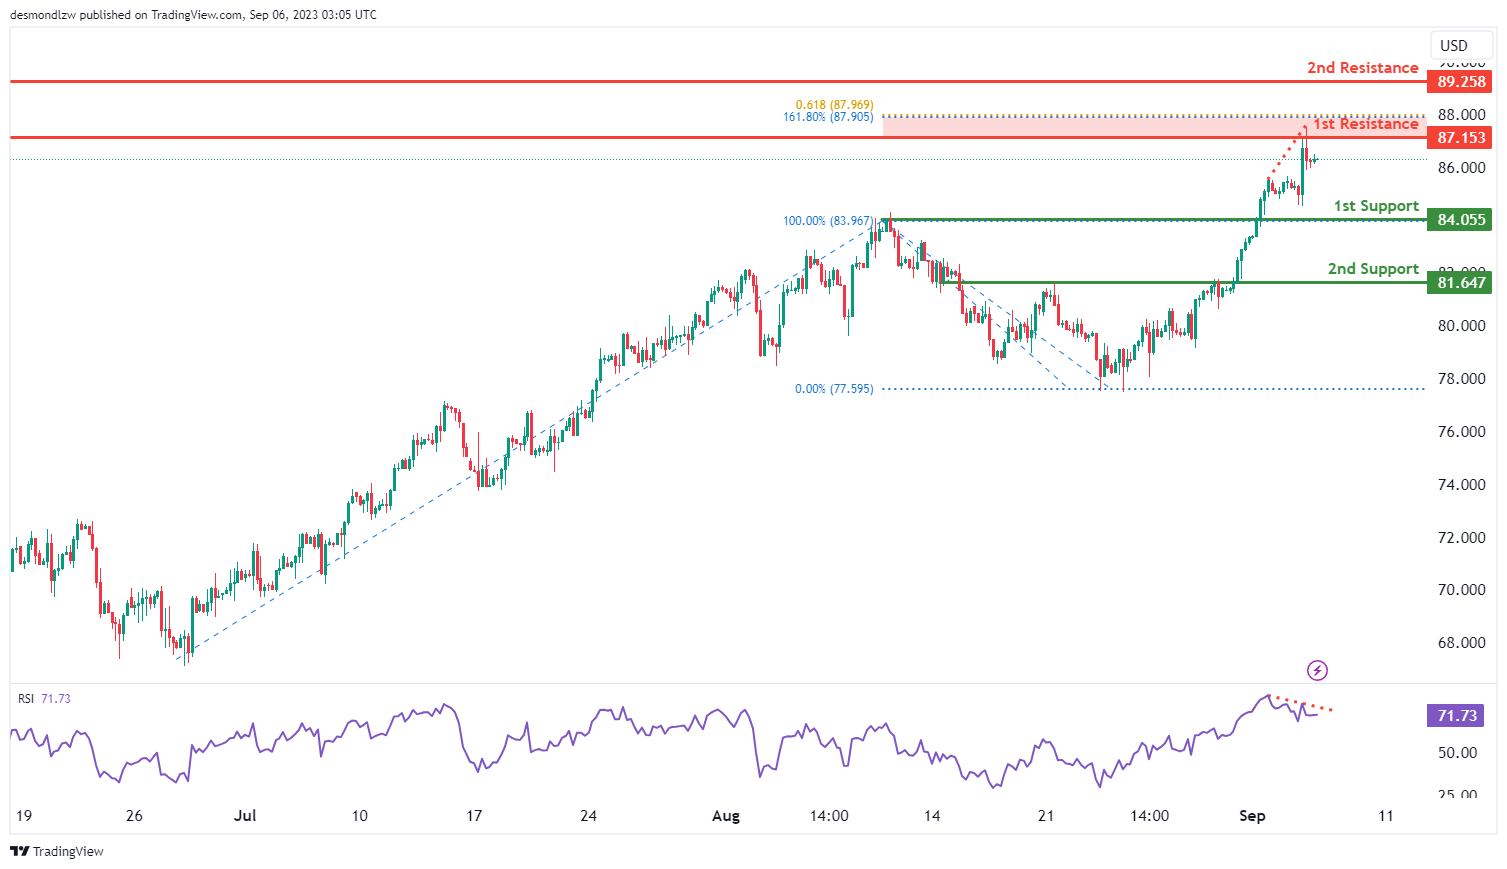
The WTI chart currently exhibits an overall bullish momentum, indicating an upward trend in its price movement. Within this context, there’s potential for the price to experience a bullish continuation towards the 1st resistance level at 87.15.
The 1st resistance level at 87.15 is identified as an overlap resistance that aligns with a confluence of Fibonacci levels i.e. the 161.80% extension and the 61.80% projection levels. Furthermore, the 2nd resistance level at 89.26 is also identified as an overlap resistance.
To the downside, the 1st support level at 84.06 is identified as a pullback support while the 2nd support level at 81.65 is identified as an overlap support.
It is also important to note that the Relative Strength Index (RSI) is displaying bearish divergence compared to the price. This divergence suggests the possibility of a reversal occurring soon, which should be considered when evaluating the overall bullish momentum.
XAU/USD (GOLD):
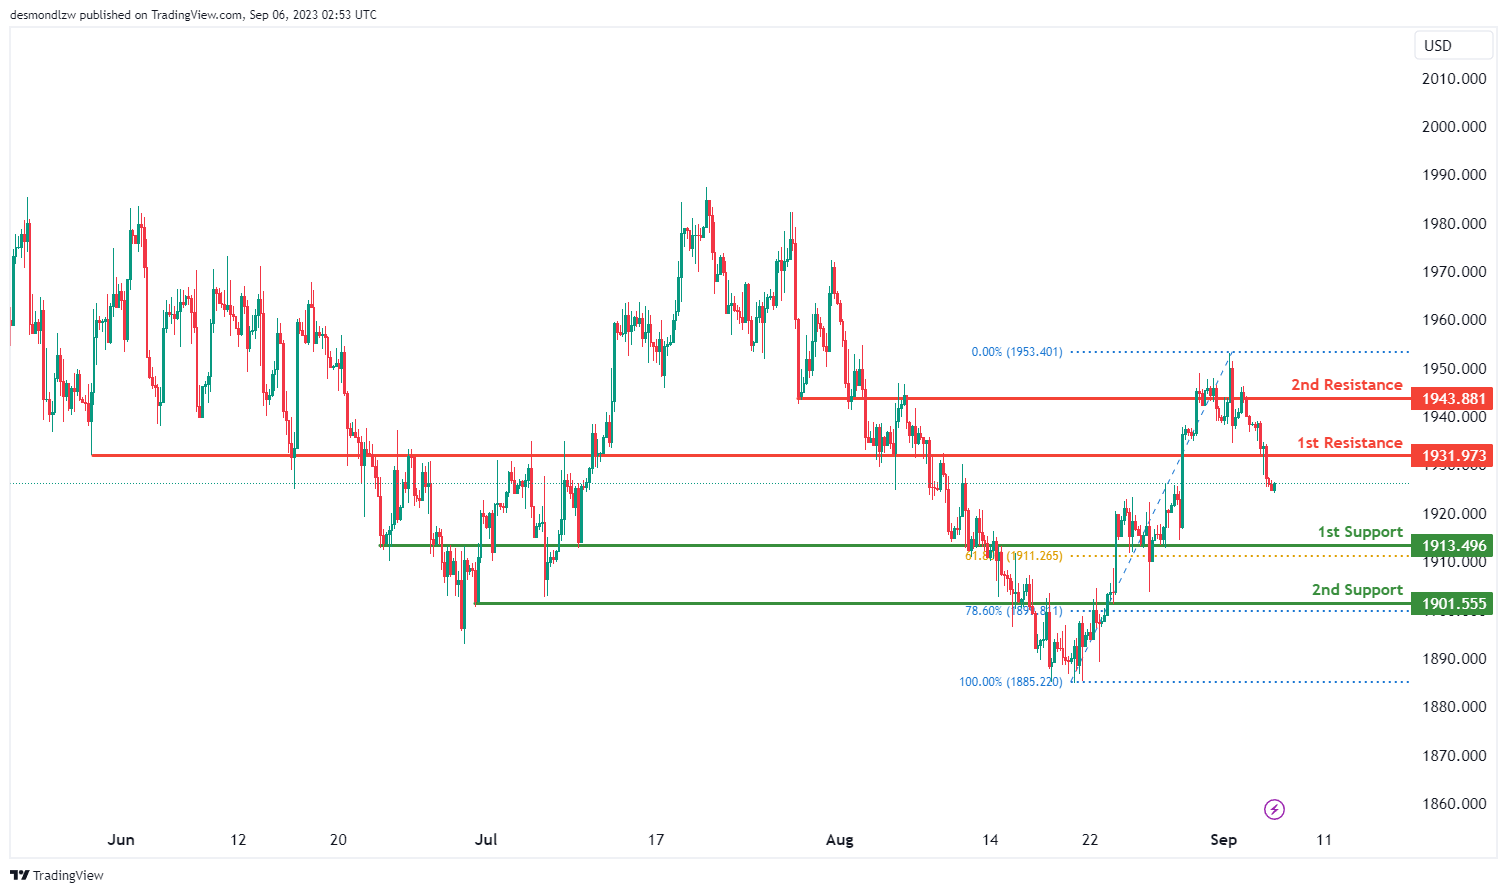
The XAU/USD chart currently displays a bearish overall momentum, indicating a potential downward trend in price movement.
There’s a likelihood of a bearish continuation towards the 1st support level at 1913.49, which is identified as an overlap support, particularly aligned with the 61.80% Fibonacci Retracement.
The 2nd support level at 1901.55 is also noted as an overlap support, and it aligns with the 78.60% Fibonacci Retracement, reinforcing its importance as a potential area of price support.
On the resistance side, the 1st resistance at 1931.97 is considered a pullback resistance, while the 2nd resistance at 1943.88 is marked as an overlap resistance. These levels may act as barriers to any potential bullish movements.
USD/JPY Daily Outlook
Daily Pivots: (S1) 146.82; (P) 147.31; (R1) 148.22; More...
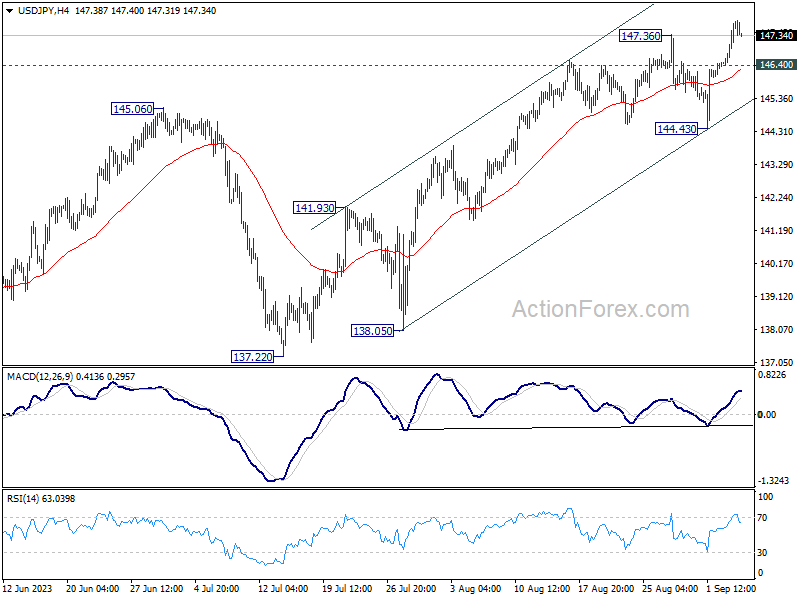
Intraday bias in USD/JPY remains on the upside at this point. Current rally is part of the whole rise from 127.20, and should target a test on 151.93 high. On the downside, below 146.40 minor support will turn intraday bias neutral first. But near term outlook will stay bullish as long as 144.43 support holds, in case of retreat.
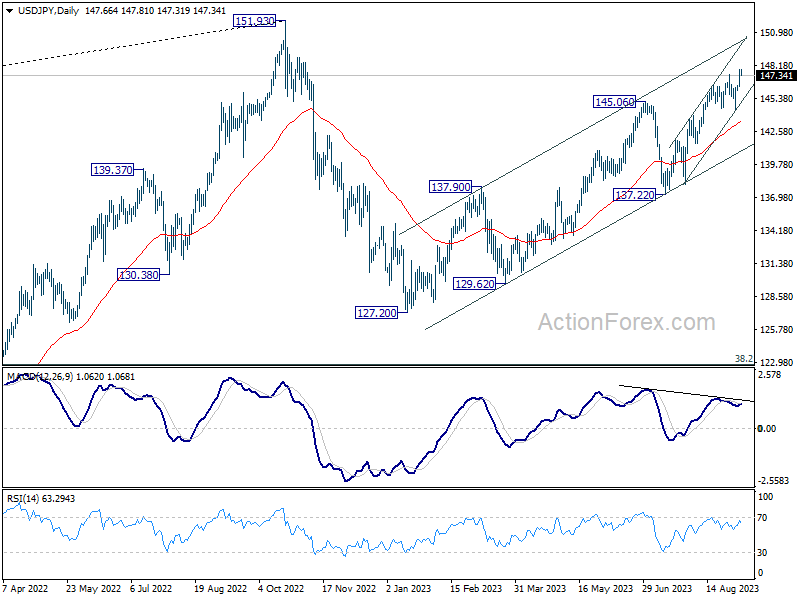
In the bigger picture, overall price actions from 151.93 (2022 high) are views as a corrective pattern. Rise from 127.20 is seen as the second leg of the pattern and could still be in progress. But even in case of extended rise, strong resistance should be seen from 151.93 to limit upside. Meanwhile, break of 137.22 support should confirm the start of the third leg to 127.20 (2023 low) and below.
Dollar Rally Looks at ISM Services for Fresh Catalyst, Canadian Awaits BoC Hold
Forex markets have found a moment of stability in today's Asian trading session, with Dollar taking a breather as it looks for fresh catalysts to continue this week's rally. All eyes are now on the upcoming ISM Services data, which could prove pivotal for Dollar's trajectory.
Services sector has emerged as the main engine of growth for US economy this year, overshadowing the manufacturing sector that has slipped into contraction. Whether we're discussing jobs growth, inflation, or consumer spending, the services sector remains the cornerstone of economic resilience. A strong showing in ISM Services data could extend Dollar's rally, underpinning the narrative of a resilient US economy amid global uncertainties.
Conversely, a surprising downturn in services could put the brakes on the Dollar, aligning it more closely with slowing economic trends observed in Eurozone and UK.
As of now, Dollar reigns as this week's strongest performer, followed by the Sterling and Swiss Franc. On the flip side, Australian Dollar has emerged as the weakest, with New Zealand Dollar not far behind. Yen's decline has decelerated after Japan's verbal intervention but still ranks as the third weakest performer this week. Meanwhile, Euro and Canadian Dollar are trading mixed, with traders keenly watching today's BoC rate decision where a hold on interest rates is widely expected.
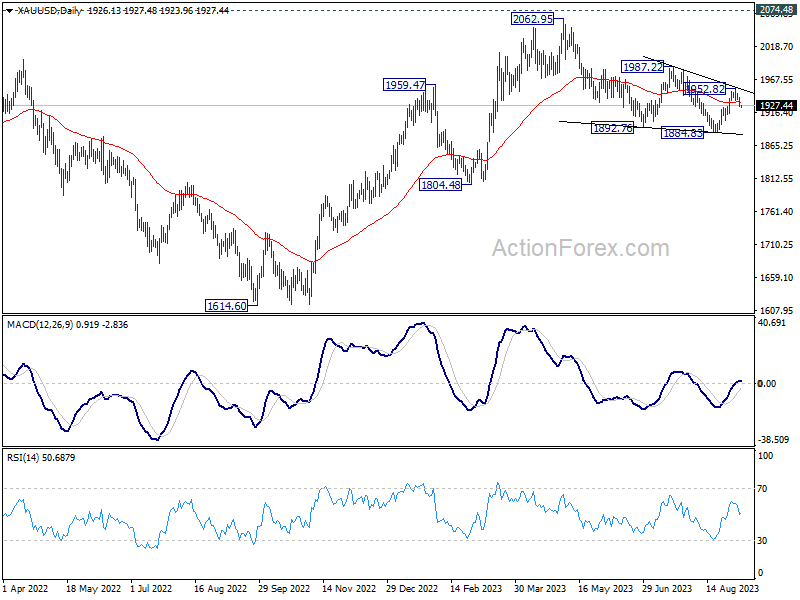
Technically speaking, both Gold and Silver have experienced significant declines this week, largely due to Dollar's strength. Gold appears to have completed its rebound at 1952.82 from 1844.83. Corrective pattern from 2062.95 is likely extending with another falling leg towards 1884.83 support again in the near term.
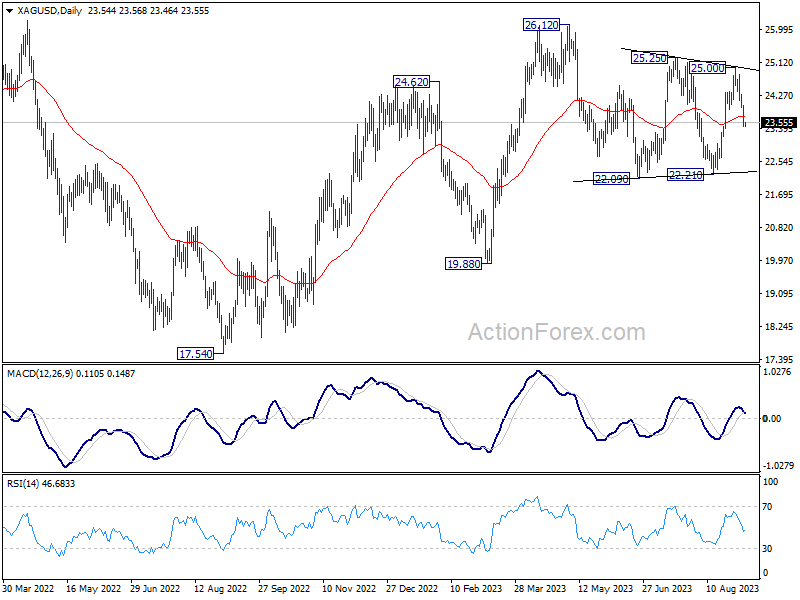
Silver's scenario echoes Gold's, having completed its rebound at 25.00 from 22.21. Further fall towards 22.21 seems imminent. Both Gold and Silver are likely to remain under pressure as long as their respective resistance levels at 1952.82 and 25.00 hold.
Overnight, DOW dropped -0.56%. S&P 500 dropped -0.42%. NASDAQ dropped -0.08%. 10-year yield rose 0.091 to 4.376. In Asia, at the time of writing, Nikkei is up 0.41%. Hong Kong HSI is down -0.78%. China Shanghai SSE is down -0.32%. Singapore Strait Times is down -0.21%. Japan 10-year JGB yield is up 0.0012 at 0.659.
Japan's Kanda flags "high urgency" as Dollar bears 148 Yen
Japan's Vice Minister of Finance for International Affairs, Masato Kanda, issued a strong warning as Dollar approaches 148 yen, marking a high for this year.
Kanda stated, "We are closely monitoring the situation, with a high sense of urgency. If such moves continue, the government will take appropriate measures, and all options are on the table."
These remarks are the first significant warning since the Ten dropped below the 145-per-dollar mark in mid-August. Since then, Japanese authorities had been relatively silent.
With the declared "high sense of urgency", Japan has effectively put currency traders on alert for potential intervention or other policy moves. The "all options are on the table" comment raises the possibility of multiple policy actions, ranging from more verbal warnings to more market interventions to curb yen's fall.
BoJ's Takata signals new dawn in wage-price cycle
BoJ board member Hajime Takata highlighted in a speech today the significant shifts in firms' behavior on price-setting and wages, leading to a budding "virtuous cycle between wages and prices" in Japan.
The existence of the virtuous wage-price cycle, if it sustains, could give BoJ more room to navigate its monetary policy and prompt an exit from the ultra-loose monetary policy, particularly if it's accompanied by "proactive and forward-looking efforts by firms" and appropriate "policy responses by the government."
"My understanding is that, on the whole, firms' price-setting behavior has changed from that observed during the deflation period," Takata said. This shift in behavior indicates that Japanese firms, traditionally cautious in raising prices, are beginning to pass on increased costs to consumers.
The significant point here is not merely the change but also the why of the change. According to Takata, firms' new willingness to adjust selling prices upwards is "likely because consumption has been solid even when prices have been rising, underpinned by standby funds that accumulated during the pandemic and by pent-up demand."
Another key takeaway is the substantial change in firms' wage-setting behavior. "As reflected in the results of the annual spring labor-management wage negotiations this year, firms' wage-setting behavior has changed, leading to wage increases and moves to pass on higher wage costs to selling prices," Takata highlighted. This wage growth has, in turn, boosted consumer sentiment, potentially setting the stage for a self-sustaining cycle of growth and inflation.
What financial markets should keep an eye on are the upcoming annual spring labor-management wage negotiations. Takata expects a "relatively high wage growth rate," given that labor shortages and high inflation rates are likely to continue.
Australia GDP grew 0.4% qoq on capital investment and services exports
Australia's GDP saw 0.4% qoq growth in Q2, aligning perfectly with market expectations. This marks the seventh consecutive quarter of economic growth for the nation. The economy exhibited resilience with a 3.4% annual growth rate for 2022-23 financial year, comfortably surpassing 10-year pre-pandemic average of 2.6%.
However, it wasn't all good news: nominal GDP dropped by -1.2% qoq in the June quarter. GDP implicit price deflator also fell -1.5%, primarily due to -7.9% decline in terms of trade. Export prices fell by -8.2%, exceeding -0.3% fall in import prices. Despite this, domestic price growth remained stable at 1.2%, buoyed by increases in household rents, food prices, and the cost of capital goods, which escalated due to Australian Dollar's depreciation.
The positive quarterly GDP numbers were largely driven by two key factors: capital investment and the exports of services. Total gross fixed capital formation surged by 2.4%, reflecting growth in both public and private investment sectors.
Services exports soared 12.1%, with a significant push coming from 18.5% uptick in travel services.
Net trade in goods added 0.5% to GDP, with 2.5% rise in goods exports led mainly by mining commodities.
Household spending, on the other hand, remained rather muted, contributing just 0.1T to the GDP growth with modest 0.1% increase.
BoC to pause today after surprised Q2 GDP contraction
BoC is widely anticipated to maintain its current interest rate of 5.00% today. This expected pause in rate adjustments comes on the heels of surprising economic contraction in Canada, with the GDP shrinking at an annualized rate of -0.2% in Q2. The contraction signals the onset of economic slowdown, a stark contrast to the relatively robust performance seen in previous quarters.
Although July's inflation rate of 3.3% remains well above BoC's target, weakening economic backdrop is likely to bolster policymakers' confidence that inflation will gradually fall back to target over time. The slower economy could apply downward pressure on prices, providing the central bank with some breathing room to keep rates unchanged for now.
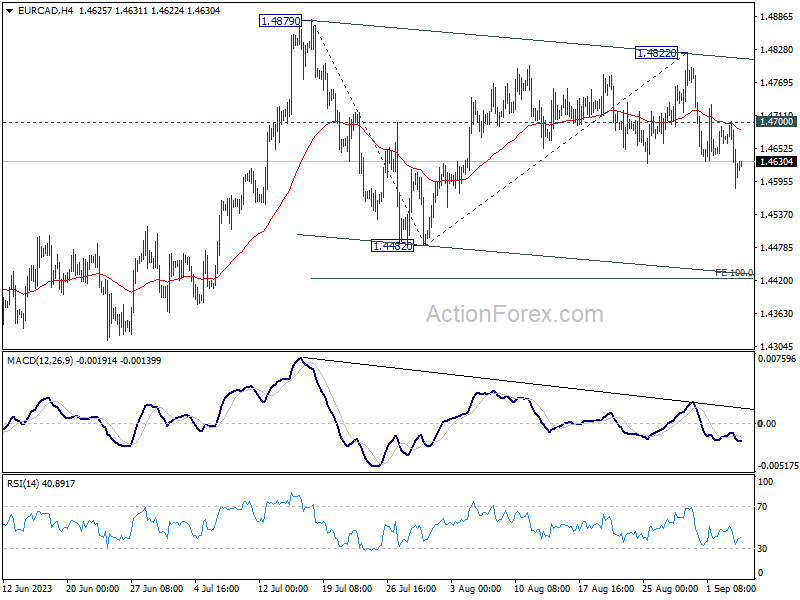
EUR/CAD's decline since last week suggests that recovery from 1.4482 has completed at 1.4822 already, ahead of 1.4879 resistance. For now, price actions from 1.4879 are seen as a consolidation pattern only, and thus, rise from 1.4280 should resume after this pattern completes. Hence, while deeper fall is in favor in the near term as long as 1.4700 resistance holds, downside should be contained by 100% projection of 1.4879 to 1.4482 from 1.4822 at 1.4425.
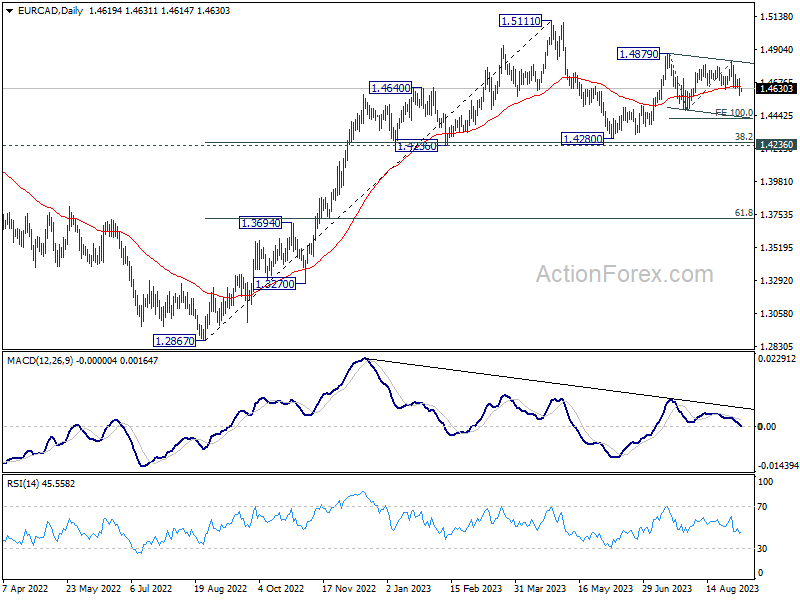
On a broader scale, price actions from 1.5111 are seen as a corrective pattern only and the up trend from 1.2867 is not over. The lingering question is whether the rise from 1.4280 constitutes the second leg of a medium-term pattern or signifies a resumption of the upward trend. More clarity on this could emerge once the current consolidation phase from 1.4879 completes.
Looking ahead
Germany factory orders, UK PMI construction and Eurozone retail sales will be released in European session. US ISM services will be the main event later in the day, together with BoC rate decisions. Both US and Canada will also publish trade balance. Fed will also release Beige Book economic report.
USD/JPY Daily Outlook
Daily Pivots: (S1) 146.82; (P) 147.31; (R1) 148.22; More...
Intraday bias in USD/JPY remains on the upside at this point. Current rally is part of the whole rise from 127.20, and should target a test on 151.93 high. On the downside, below 146.40 minor support will turn intraday bias neutral first. But near term outlook will stay bullish as long as 144.43 support holds, in case of retreat.
In the bigger picture, overall price actions from 151.93 (2022 high) are views as a corrective pattern. Rise from 127.20 is seen as the second leg of the pattern and could still be in progress. But even in case of extended rise, strong resistance should be seen from 151.93 to limit upside. Meanwhile, break of 137.22 support should confirm the start of the third leg to 127.20 (2023 low) and below.
Economic Indicators Update
| GMT | Ccy | Events | Actual | Forecast | Previous | Revised |
|---|---|---|---|---|---|---|
| 01:30 | AUD | GDP Q/Q Q2 | 0.40% | 0.40% | 0.20% | |
| 06:00 | EUR | Germany Factory Orders M/M Jul | -4.30% | 7.00% | ||
| 08:30 | GBP | Construction PMI Aug | 49.8 | 51.7 | ||
| 09:00 | EUR | Eurozone Retail Sales M/M Jul | -0.20% | -0.30% | ||
| 12:30 | CAD | Labor Productivity Q/Q Q2 | -0.10% | -0.60% | ||
| 12:30 | CAD | Trade Balance (CAD) Jul | -3.5B | -3.7B | ||
| 12:30 | USD | Trade Balance (USD) Jul | -67.9B | -65.5B | ||
| 12:30 | USD | Goods Trade Balance Jul | $-91.2B | |||
| 13:45 | USD | Services PMI Aug F | 51 | 51 | ||
| 14:00 | USD | ISM Services PMI Aug | 52.6 | 52.7 | ||
| 14:00 | CAD | BoC Interest Rate Decision | 5.00% | 5.00% | ||
| 18:00 | USD | Fed's Beige Book |
Research China – Downside Risks Return
Research China - Downside risks return
- Financial stress has increased again and put focus again on whether China is heading for a deeper financial and economic crisis.
- While we do see a rising risk of this happening (25% probability), our baseline scenario remains that China has the tools to avert such an outcome and will use them to the extend needed. Yet, due to the recent weak data and rise in financial stress we recently revised down our forecast to 4.8% growth this year and 4.2% in 2024.
- China has already turned up the volume on policy measures such as easing of mortgage policies, tax cuts and infrastructure spending and we expect the government to do more if needed to keep growth close to the target of 5% this year.
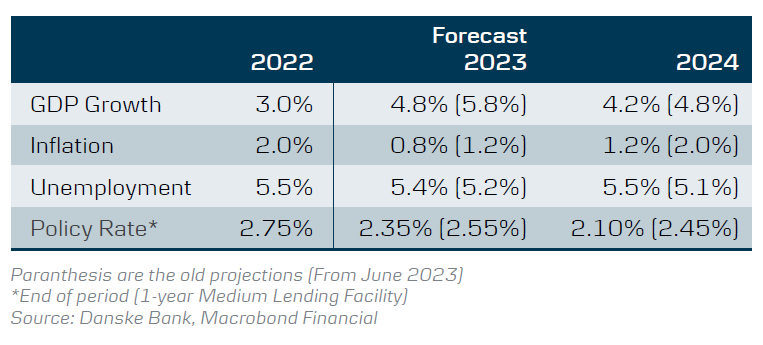
Financial stress has increased again with another major developer, Country Garden, at brink of default. Contagion to the shadow banking system has also come to the surface with a big trust company, Zhongrung International Trust Co missing payments. On top of this economic data has disappointed across the board with both consumer spending, home sales and exports undershooting expectations in recent months. Taking these developments into account we have revised down growth to 4.8% this and 4.2% next year. In our baseline scenario we expect policy makers to step up stimulus as broadly signalled following the Politburo meeting in late July and to take more measures to improve financing channels for developers and lift home sales. We also expect them to provide the necessary lifelines to local governments and facilitate a restructuring of major shadow banking entities in distress. We believe they will still strive to reach their 5% target and do what is necessary to at least put a floor under growth so it does not fall below 4-4½%.
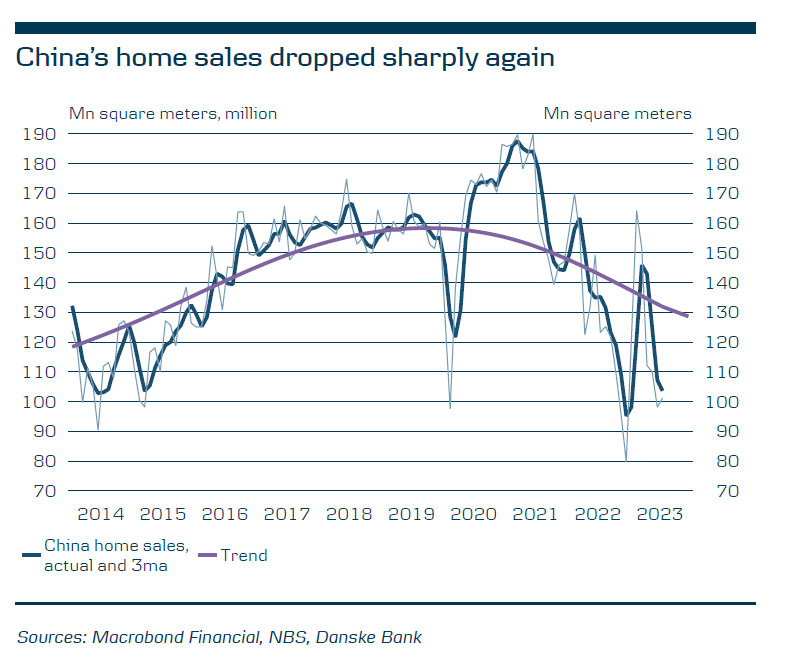
Half of the economy already in recession
Of China's different growth engines, housing and exports are the weak spots both being in recession. Together they constitute close to 50% of the economy. Private consumption and infrastructure investments have underpinned growth so far but there is a risk that the weakness in housing spreads to household spending, which would add further downward pressure on demand. It is crucial that Chinese policy makers step up further in stimulating housing to avoid this negative spiral. There is little China can do about the weak exports as a devaluation would risk creating more uncertainty and instability and China is unlikely to go down that path. China consumer prices fell into deflation in July as they declined 0.3% y/y. However, it was driven by energy and food and the core inflation that excludes these components were up 0.8% y/y. Hence, we are not yet seeing broad based deflation in China. We look for overall inflation to turn positive again over the next 6-9 months but that inflation generally stays low as demand is set to undershoot supply for some time.
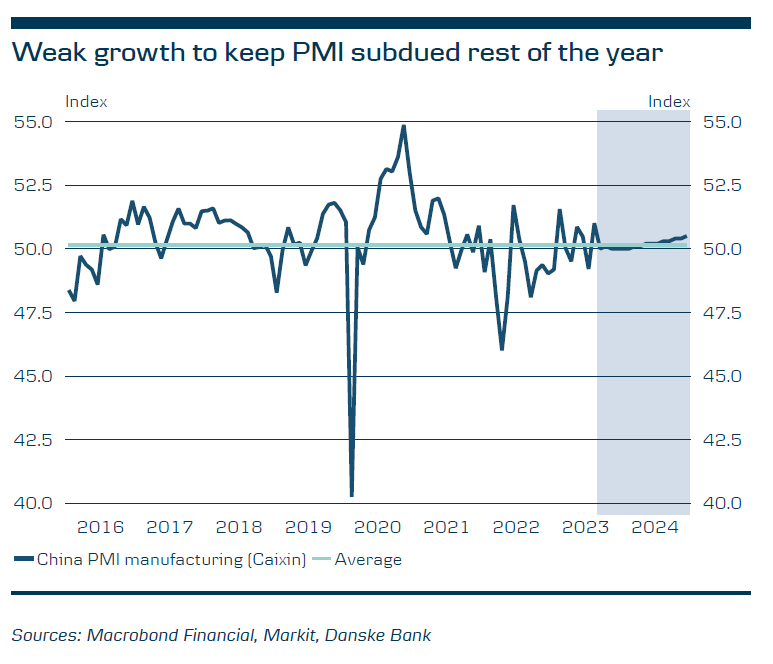
China's tool box is not exhausted yet
In early September China took new steps to support the economy by lowering mortgage rates and reducing the required down payments for house purchases. Early indications are that it has already spurred some home buyer interest but if needed China can ease more via these tools. Funding channels for developers can also be improved and on Friday18 August, PBOC and financial regulators met with bank executives telling them to direct more lending to support an economic recovery. China is also likely to cut Reserve Requirement Ratios (RRR) for banks to free up more liquidity to buy credit bonds and increase lending. The RRR for small and medium sized banks is 7.75% while it is 10.75% for large banks and thus has plenty of room to be lowered. Finally, if needed, China could opt for quantitative easing (QE) with PBOC buying bonds directly in the market. This would serve as a strong signal that they step in as lender of last resort.
China in a painful rebalancing of the economy
China is currently in a painful rebalancing where it needs to continue to wean itself off the reliance on housing as a structural demand driver and instead transition into an economy, where private consumption and high-tech manufacturing are the main drivers. Chinese leaders seem increasingly willing to pay a price to growth in the coming years from the lower levels of activity in the housing sector in order to achieve this rebalancing and get more capital allocated to more productive parts of the economy, not least high-tech manufacturing. The challenge is, though, to avoid that the decline in housing is so steep that it pulls down the consumer and investments with it. This is the risk China is currently facing and why we expect somewhat stronger measures to lift housing from the current depressed levels but not being so strong that they risk creating a new bubble.
Elliott Wave View: DAX Looking to Extend Lower in Double Three
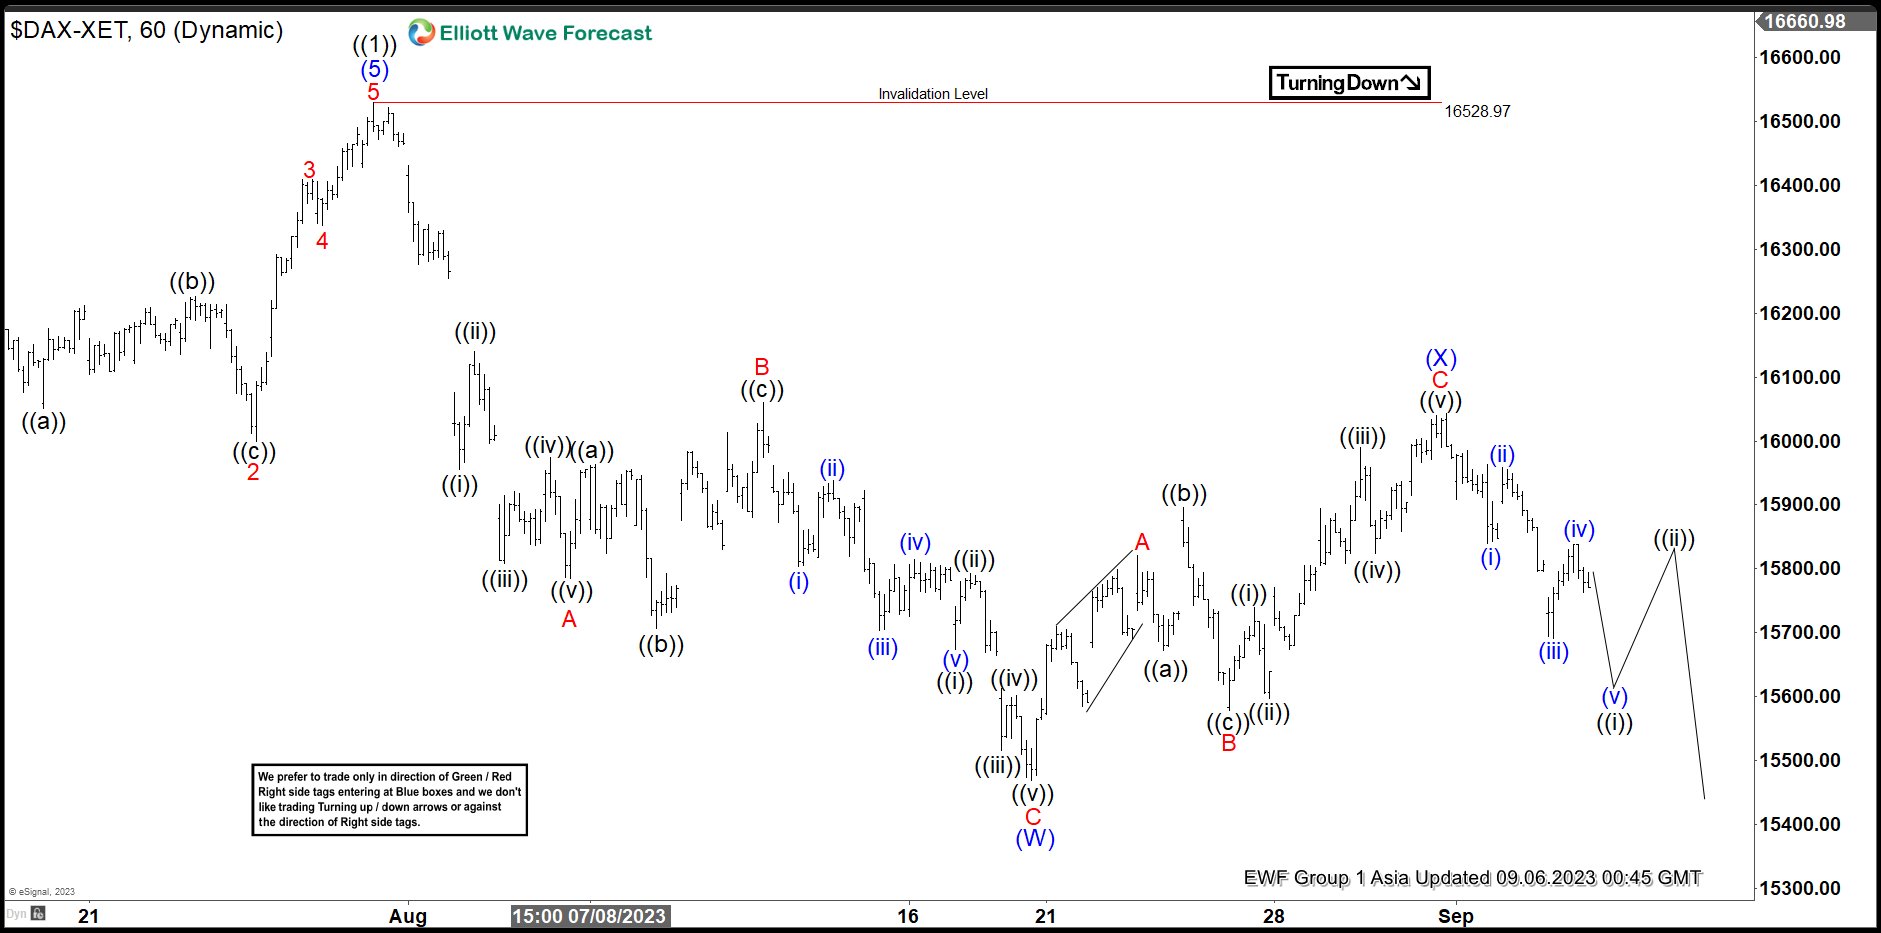
DAX ended cycle from September 28, 2022 low with wave ((1)) at 16528.97 as the 1 hour chart below shows. Index is currently in wave ((2)) pullback to correct the larger degree from September 2022 low. Internal subdivision of wave ((2)) is unfolding as a double three Elliott Wave structure. Down from wave ((1)), wave A ended at 15784.52. Wave B rally ended at 16060.27 as an expanded Flat. Index resumed lower again in wave C towards 15468.65 which completed wave (W).
Index then turned higher in wave (X) with internal subdivision as a zigzag Elliott Wave structure. Up from wave (W), wave A ended at 15820.95 and pullback in wave B ended at 15578.97. Index then extended higher in wave C towards 16042.66 which completed wave (X). DAX has turned lower in wave (Y) but still needs to break below wave (W) at 15468.65 to rule out any double correction. Down from wave (X), another leg lower is expected to end wave ((i)). Afterwards, it should rally in wave ((ii)) before turning lower again. Near term, as far as pivot at 16528.97 high stays intact, expect the Index to extend lower.
DAX 60 Minutes Elliott Wave Chart
DAX Elliott Wave Video
https://www.youtube.com/watch?v=4_bMF25IaTo
Japan’s Kanda flags “high urgency” as Dollar bears 148 Yen
Japan's Vice Minister of Finance for International Affairs, Masato Kanda, issued a strong warning as Dollar approaches 148 yen, marking a high for this year.
Kanda stated, "We are closely monitoring the situation, with a high sense of urgency. If such moves continue, the government will take appropriate measures, and all options are on the table."
These remarks are the first significant warning since the Ten dropped below the 145-per-dollar mark in mid-August. Since then, Japanese authorities had been relatively silent.
With the declared "high sense of urgency", Japan has effectively put currency traders on alert for potential intervention or other policy moves. The "all options are on the table" comment raises the possibility of multiple policy actions, ranging from more verbal warnings to more market interventions to curb yen's fall.