

Sample Category Title
AUD/USD: Aussie Dollar Loses Ground as RBA Stays Pat for the Third Month
Australian dollar was sharply lower on Tuesday (down nearly 1.3% in Asian / European session), after the Reserve Bank of Australia kept interest rates unchanged at 4.1% for the third consecutive month.
The RBA argued its decision by brighter outlook for pushing the inflation towards the central bank’s target, as they have a firmer grip on prices which adding to speculations that tightening cycle was over.
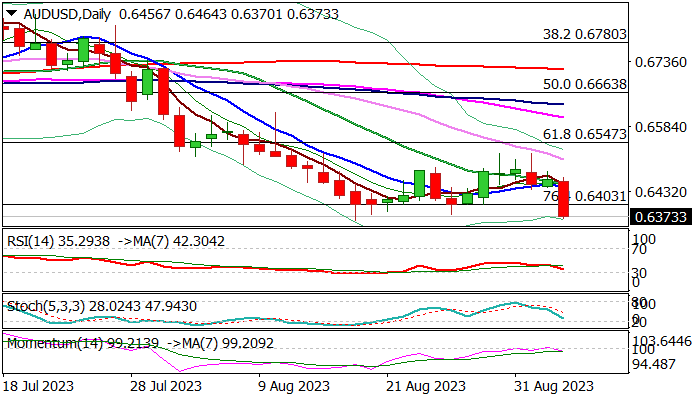
Aussie dollar was sold in immediate reaction and hit three-week low, pressuring key near-term support at 0.6364 (2023 low, posted on Aug 17).
Fresh bears look for eventual close below cracked Fibo support at 0.6403 (76.4% retracement of 0.6170/0.7157) after three consecutive attacks failed here.
Technical picture on daily chart is firmly bearish, with close below 0.6403 and break of recent spike low at 0.6364, to add to bearish signal and unmask 0.6170 target.
Res: 0.6403; 0.6445; 0.6488; 0.6521.
Sup: 0.6364; 0.6304; 0.6267; 0.6244.
Swiss Franc Hits Two-Month Low after Weak GDP
- Swiss GDP stagnates in Q2
- Manufacturing, exports decline
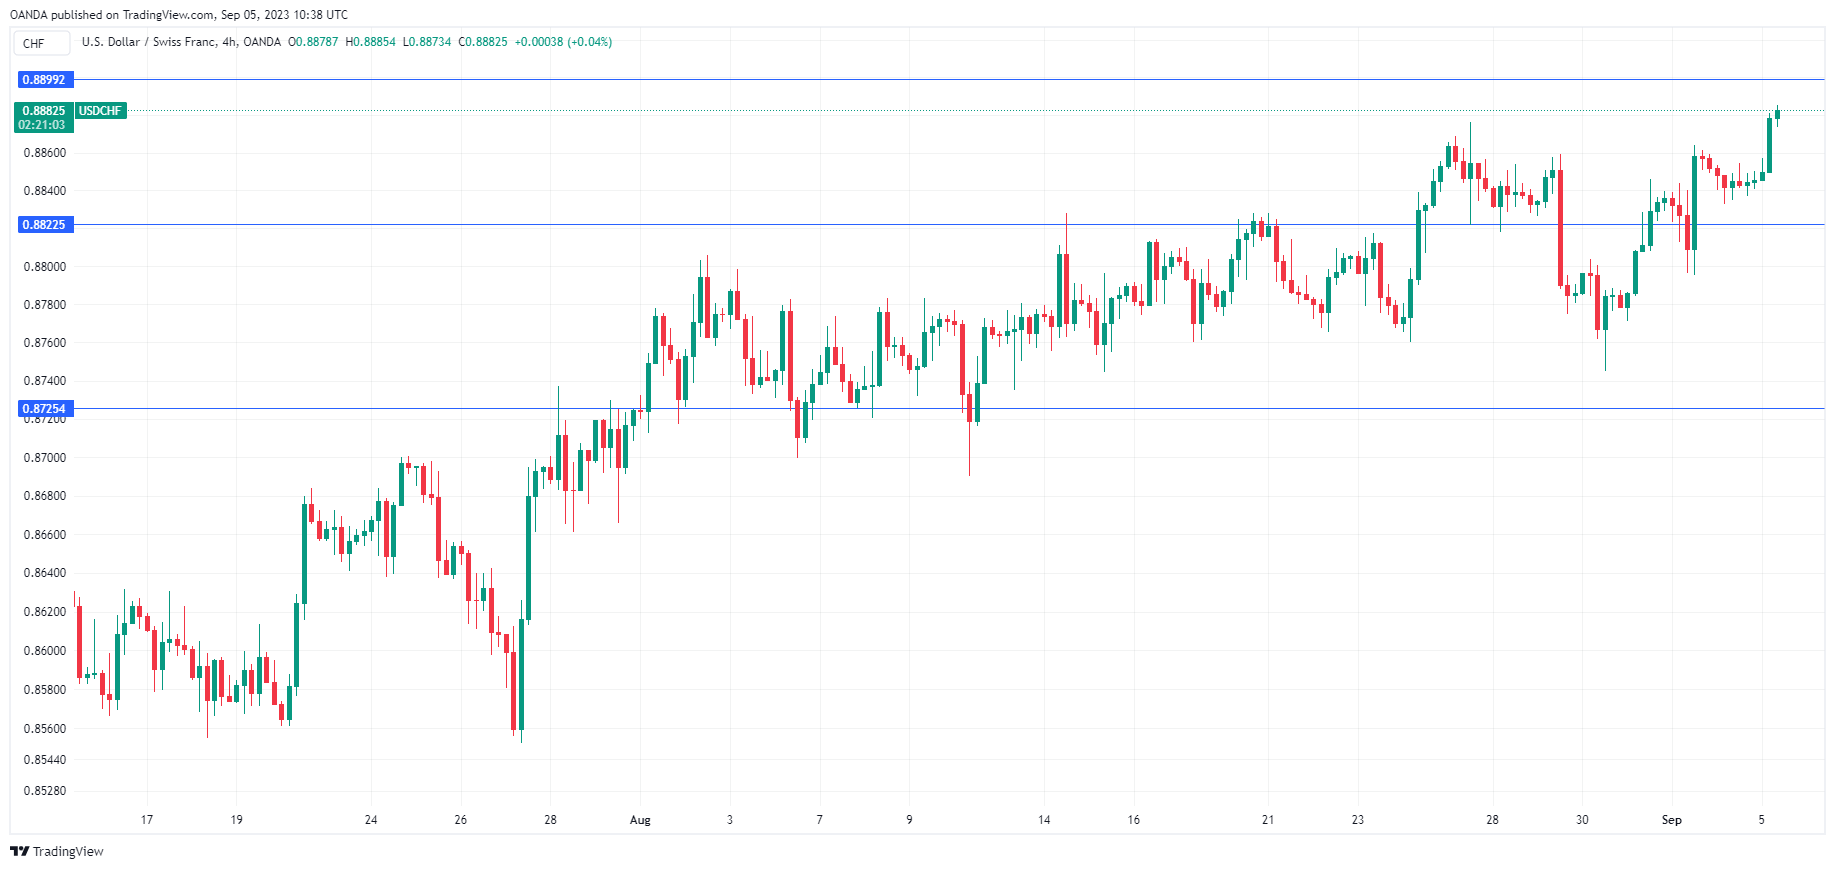
The Swiss franc is in negative territory on Tuesday. In the European session, USD/CHF is trading at 0.8884, up 0.44%. The Swissie has lost over 1% since Wednesday and is trading at its lowest level seen mid-July.
The driver behind today’s losses was a disappointing Swiss GDP release for the second quarter. The economy flatlined in Q2, compared to a robust 0.9% gain q/q in the first quarter (adjusted for sporting events). Most of the GDP components pointed to a grim picture. Manufacturing fell 2.9% q/q, capital goods investment declined by 3.7% q/q and exports of goods slipped by 1.2% q/q.
Switzerland’s economy, which ran like a Swiss watch for decades, has fallen victim to weak global demand and high interest rates. Manufacturing is struggling and business and consumer confidence remain weak. ING is projecting growth of just 0.7% in 2023 and 0.6% in 2024, compared to 2.7% in 2022.
Despite these pressing problems, Switzerland has kept inflation at very low levels. August inflation was unchanged at 1.6%, within the Swiss National Bank’s target range of 0%-2%. The SNB hasn’t been shy about intervening in the foreign exchange market to stabilize the exchange rate, which has helped to control external inflationary pressures.
The SNB has raised rates by 250 basis points in the current tightening cycle, with the cash rate currently at 1.75%. SNB Chair Thomas Jordan has backed up his hawkish rhetoric about containing inflation with five straight rate hikes (the central bank only meets on a quarterly basis). The SNB meets next on September 21st and is expected to raise rates by a quarter of a point.
USD/CHF Technical
- USD/CHF is putting pressure on resistance at 0.8899. Above, there is resistance at 0.8941
- 0.8822 and 0.8725 are providing support
AUD/USD Falls Sharply after the Decision of the Reserve Bank of Australia
The Reserve Bank of Australia (RBA) kept interest rates at 4.10% for the third month today, fueling rumors that the tightening cycle is over. Although according to Reuters, the majority of economists polled by the agency expect another increase by the end of the year after the release of the inflation report for the third quarter.
In the words of RBA chief Philip Lowe today:
→ data indicate that inflation could return to the 2-3% target range at the end of 2025;
→ the labor market remains strong and the economy operates at a high level of capacity utilization, although its development has slowed down;
→ further tightening is still acceptable if inflation is to be suppressed, which stands at 4.9% in July (at an 18-month low).
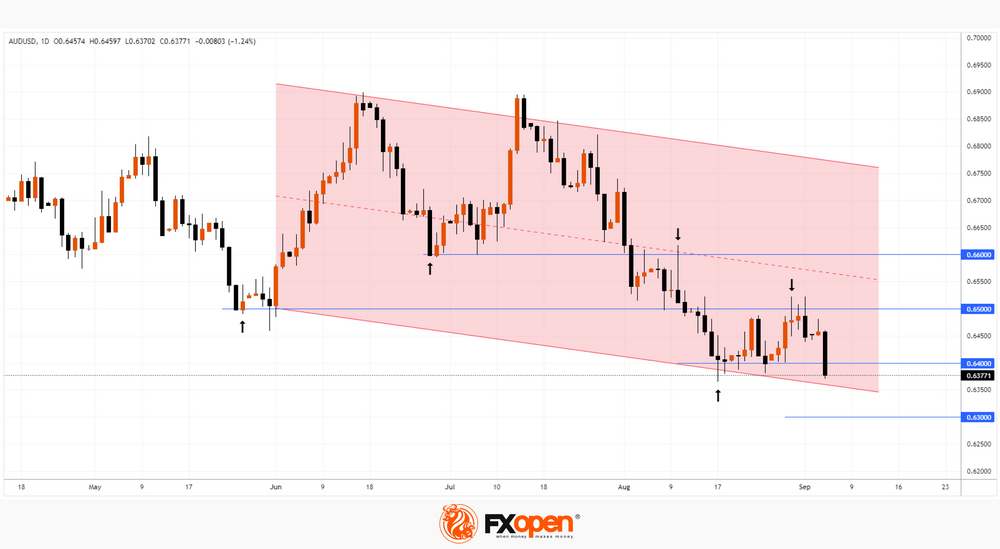
Reacting to the results of the RBA meeting, the AUD/USD rate fell to the lows of the year, to the level of 0.637.
The bullish argument is that the market may find support for the lower boundary of the descending channel. However, the price fell below the 0.64 level. It is possible that now it will work as a resistance on the principle of mirror levels — the chart shows that this was the case with the levels of 0.66 and 0.65. Following this sequence, the next bearish target is 0.63.
This article represents the opinion of the Companies operating under the FXOpen brand only. It is not to be construed as an offer, solicitation, or recommendation with respect to products and services provided by the Companies operating under the FXOpen brand, nor is it to be considered financial advice.
Australian Dollar Sinks after RBA Pause, GDP Next
- RBA holds rates for third straight time
- AUD/USD slides 1.3%
- Australian GDP expected to slow in second quarter
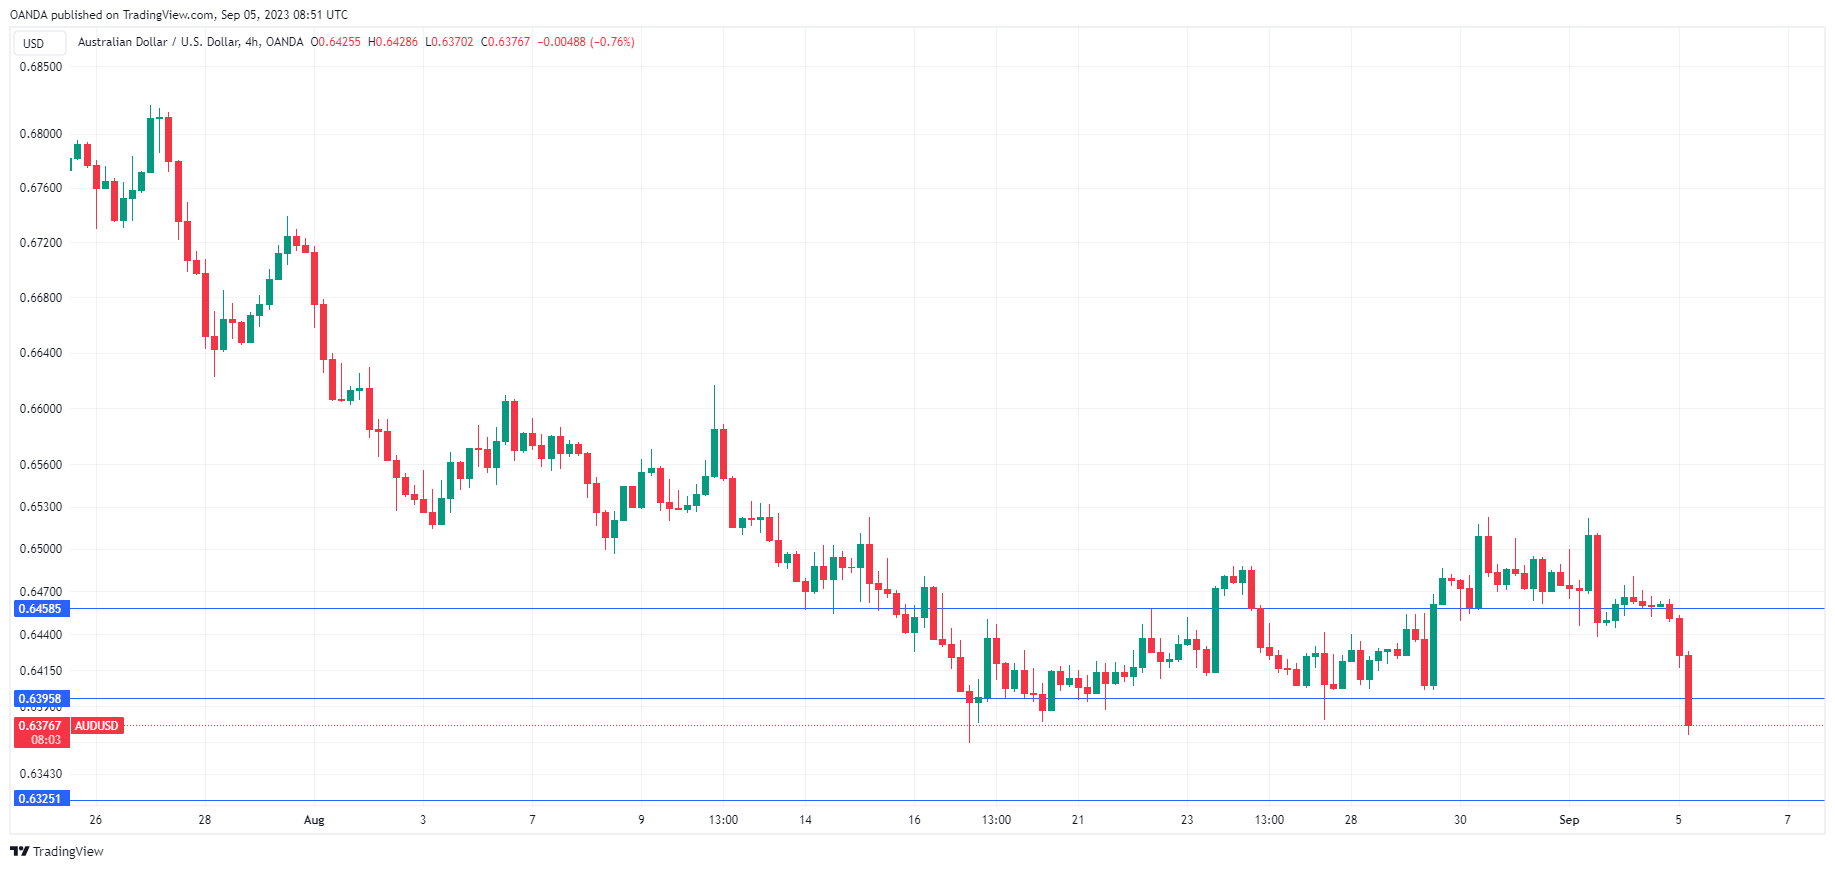
The Australian dollar has plunged on Tuesday after the Reserve Bank of Australia held rates at today’s policy meeting. In the European session, AUD/USD is trading at 0.6373, down 1.36%.
RBA holds rates, as expected
The RBA held interest rates at today’s meeting for a third straight time, maintaining the official cash rate at 4.10%. This was the final meeting chaired by Governor Philip Lowe, with some calling the pause a parting gift for mortgage owners.
The decision was widely expected, and Lowe’s rate statement was a repeat of what we’ve heard before. Lowe stated that inflation had “passed its peak” but was “still too high and will remain so for some time yet”. Lowe again kept open the possibility of further tightening, depending on the data. In a nutshell, inflation is headed in the right direction but more work lies ahead in order to bring inflation back down to the 1%-3% target range.
There were no surprises from the RBA, but that didn’t prevent the Aussie from taking a huge tumble, with the Australian dollar currently very close to an 11-month low against the US dollar. The fact that the central bank has extended its pause for a third straight time boosts the view that the RBA is done with rate hikes, barring some catastrophic economic data, has made the Australian dollar a less attractive investment. The markets will now be looking for clues about possible rate cuts, which could come sometime in 2024.
Investors will now shift their attention from the RBA hold to the GDP report for the second quarter. The economy grew by a respectable 2.3% in Q1 but is expected to slow to 1.8% in the second quarter. A reading below 1.8% will likely put further downward pressure on the shaky Australian dollar.
AUD/USD Technical
- AUD/USD pushed below support at 0.6458 and is testing support at 0.6395. Below, there is support at 0.6325
- There is resistance at 0.6458 and 0.6525
GBPUSD Downtrend Could Stay in Play
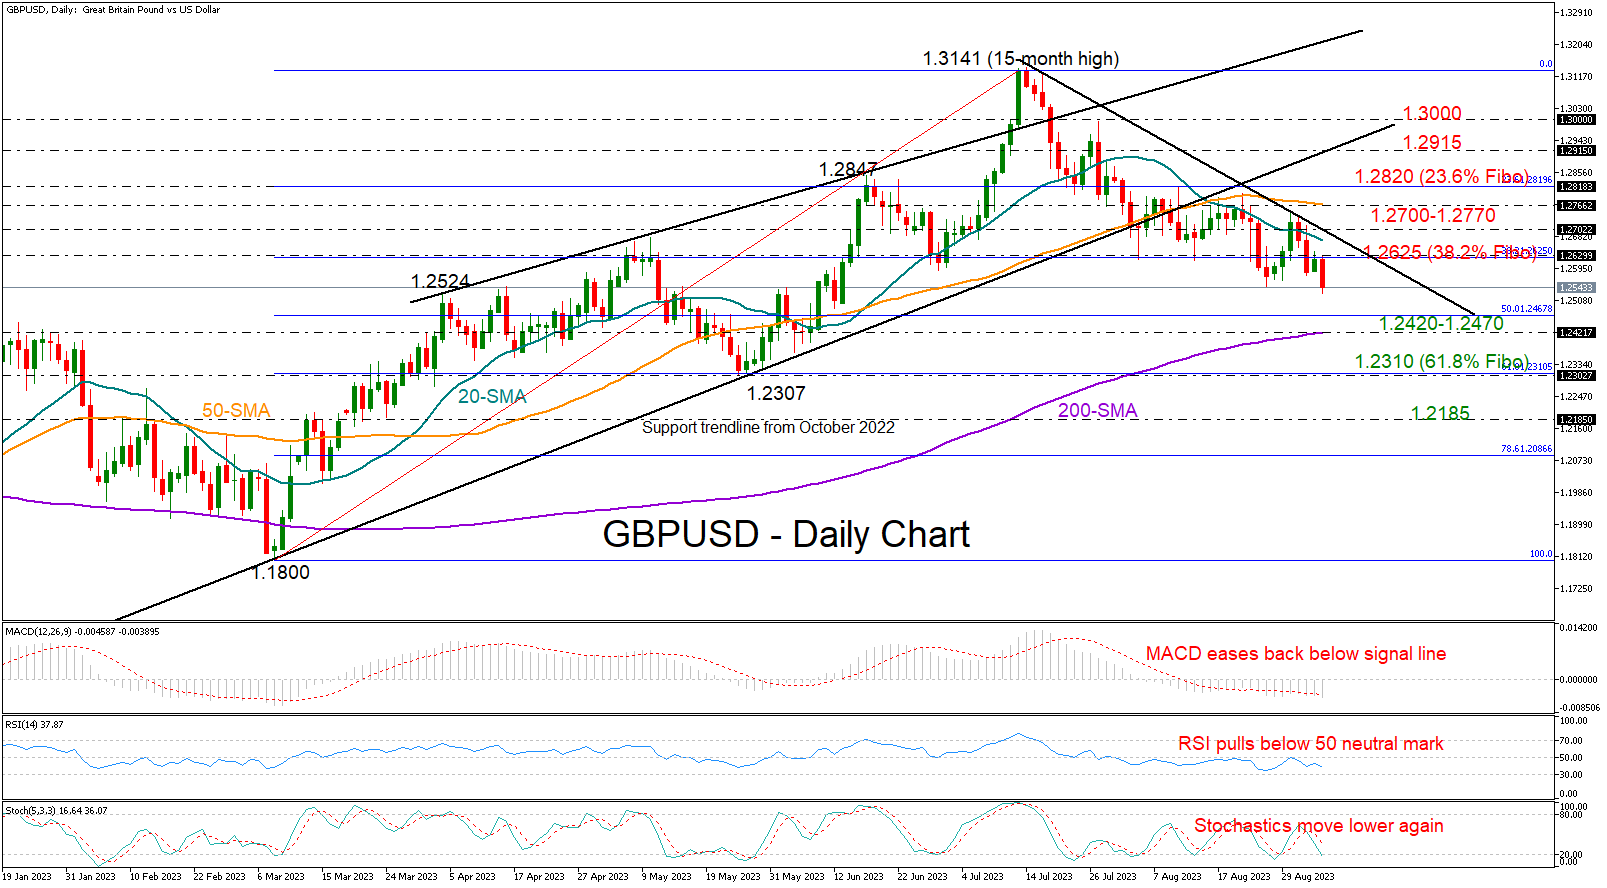
GBPUSD returned to the red zone on Tuesday, plunging to a new two-and-a-half-month low of 1.2527 after Monday’s bullish efforts evaporated immediately near the 1.2625 constraining area.
The trend has been negative since July and the bearish crossing of the 20- and 50-day SMAs is causing concern for the near future. Moreover, the technical indicators are pointing to a continuous decline as the RSI has reversed course back to the downside below its 50 neutral mark, and the MACD has plunged below its red signal line.
Selling forces could take a breather somewhere between the 50% Fibonacci mark of the 1.1800-1.3141 uptrend at 1.2470 and the 200-day SMA at 1.2420. If the bears breach that border, the downtrend could gain another leg to 1.2300, where the 61.8% Fibonacci is located. Running lower, the pair may next test the 1.2185 barrier.
On the upside, the 38.2% Fibonacci number of 1.2625 and the 20-day SMA could cap any potential increases. The bulls will have to drive above the 1.2700 round level too in order to reach the 50-day SMA at 1.2770. Then, the 23.6% Fibonacci of 1.2820 could prevent an extension towards the broken support trendline from October 2022.
In short, GBPUSD remains attractive to sellers as the pair keeps trading within a bearish environment. The next stop could be within the 1.2420-1.2470 region.
EUR/USD: Signals of Bearish Continuation After Limited Recovery
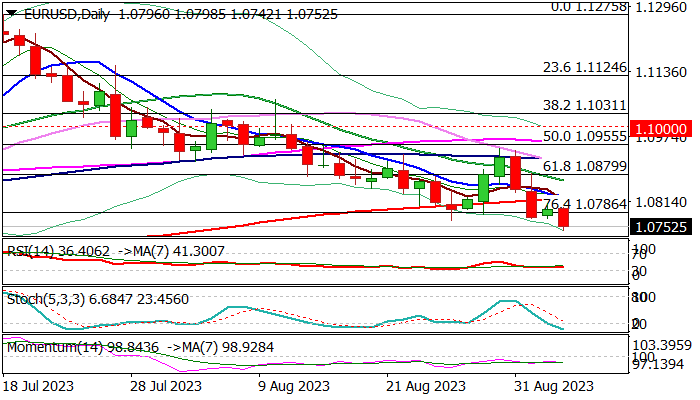
The Euro lost traction on Tuesday and fell to 2 ½ month low, after Monday’s recovery attempts proved to be just a mild consolidation.
Renewed risk aversion and series of weaker than expected Aug services PMI data from Eurozone member countries, soured the sentiment and add fresh pressure on euro.
Negative momentum is strengthening on daily chart, MA’s remain in bearish setup (diverging 10/200DMA’s on track to for a death cross) and repeated close below Fibo support at 1.0786 (76.4% of 1.0635/1.1275 rally) contribute to negative near-term outlook.
Bears eye psychological support at 1.0700, violation of which will risk extension towards key support at 1.0635 (May 31 low).
However, bears may face increased headwinds from oversold conditions, with upticks to be capped by 200DMA (1.0817) to keep bears intact and offer better selling opportunities.
Only return above 1.0880 (broken 61.8%) would question bears.
Res: 1.0786; 1.0817; 1.0880; 1.0917.
Sup: 1.0733; 1.0700; 1.0667; 1.0635.
Crypto Slipping Down
Market picture
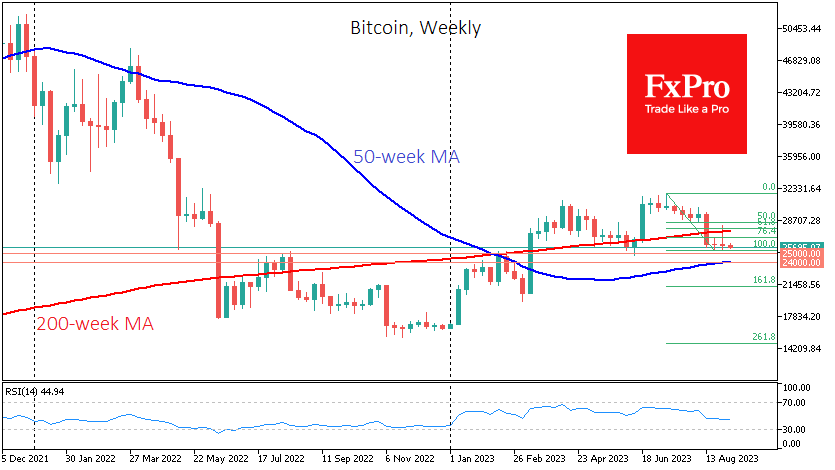
The crypto market capitalisation declined by 0.66% to $1.038 trillion, showing several waves of decline with increasingly lower local lows. This is a sure sign that the bears are in control, and the pressure seems to be coming from the stock market, as the institutional favourites that are losing the most so far are Bitcoin (-1.1%), Ethereum (-0.9%) and XRP (-0.7%).
The first cryptocurrency is settling increasingly firmly in the territory below $26K. Since March, Bitcoin has been repeatedly bought on dips to this level, but it seems the support doesn’t look as strong now. A failure under $25.4K would signal the end of the corrective rebound to $28K and open the way to $21.5K. However, potentially strong support could come as early as $24K, where the 50-week moving average passes.
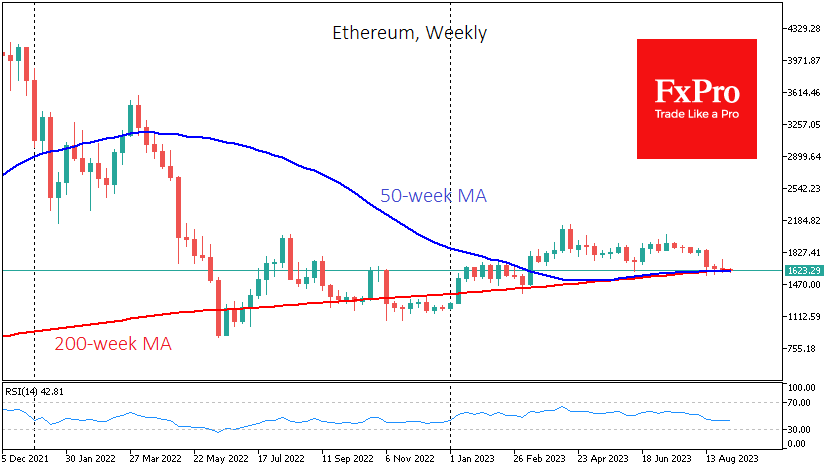
Ethereum has already intertwined the 50 and 200-week MAs and has regularly received support on dips under them over the past four weeks. It’s an open question how durable that support will be. It’s worth being prepared that a consolidation under $1600 would trigger a deeper sell-off.
News background
According to CoinShares, investment in crypto funds fell by $11 million last week; outflows have been down for 6 of the previous seven weeks. At the same time, trading volumes were 90% above average since the beginning of the year.
According to IntoTheBlock, crypto whales have invested more than $1.5bn in Bitcoin in the past two weeks, with purchases following BTC’s sharp drop in mid-August.
After the court ruling in the Grayscale case, the SEC has no choice but to approve applications to launch spot bitcoin-ETFs, JP Morgan believes. At the same time, the regulator may approve several applications at once. But that takes time to prepare, so the SEC postponed its decision until October.
The activity of a wallet linked to the bankrupt FTX exchange has raised fears of a potential cryptocurrency sell-off in the making. On 24 August, FTX announced plans to “sell, stack and hedge” $3 billion worth of its cryptocurrencies.
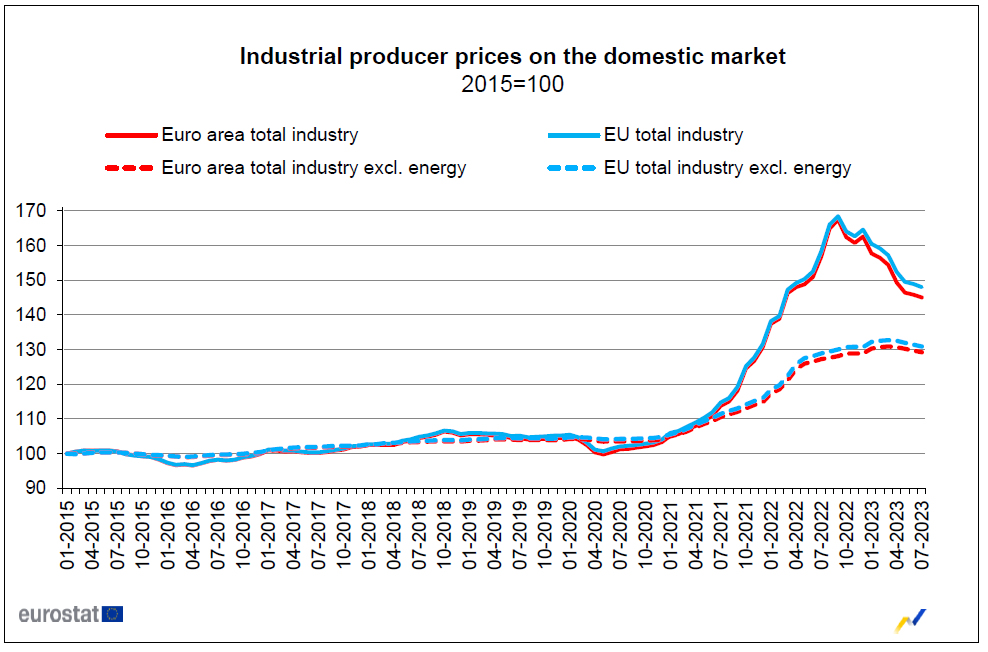
Eurozone PPI down -0.5% mom, -7.6% yoy in Jul
Eurozone PPI fell -0.5% mom -7.6% yoy in July, versus expectation of -0.6% mom, -7.6% yoy. For the month, Industrial producer prices decreased by -1.2% mom for intermediate goods and by -0.9% mom in the energy sector, while prices increased by 0.1% mom for non-durable consumer goods and by 0.2% mom for both capital goods and durable consumer goods. Prices in total industry excluding energy decreased by -0.4% mom.
EU PPI was down -0.6% mom, -6.6% yoy. The largest monthly decreases in industrial producer prices were recorded in Ireland (-8.1%), the Netherlands (-2.6%) and Sweden (-1.8%), while the highest increases were observed in Latvia (+2.2%), Slovakia (+1.7%) and Croatia (+1.3%).
Major Currency Pairs Correcting in a Weakly Volatile Market
The beginning of the current five-day period turned out to be rather sluggish for the major currency pairs. The US employment report published last week was ambiguously received by market participants. The dollar first fell and then sharply strengthened. However, yesterday, there was no continuation of the uptrend for the greenback; most likely, the passivity of investors was associated with the weekend in the US and Canada. A lot of important foundation is expected in the coming trading session; one should be prepared for a possible surge in volatility.
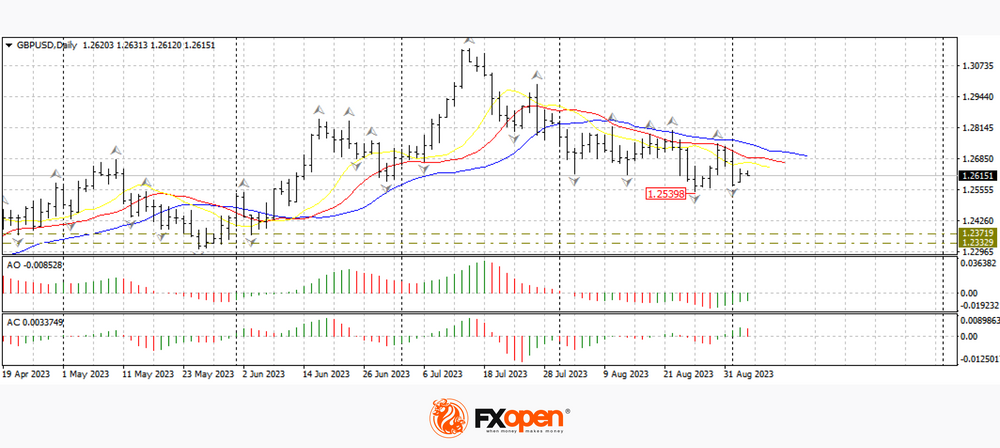
GBP/USD
The British currency failed to strengthen above the alligator lines on the daily timeframe last week, thus failing another reversal attempt. The rebound from 1.2750 led to losses of more than 150 pp. Last week, the pair traded below 1.2600. Yesterday, the buyers managed to correct the price - 1.2640, but since no strong reversal combinations have been formed, GBP/USD will most likely continue to decline towards the lower fractals at 1.2570-1.2540. If this range turns into resistance, there may be a new downward momentum towards 1.2400-1.2200. Cancellation of the downward scenario may be considered only after the price stays above 1.2750.
Today at 11:30 GMT+3, we are waiting for data on the composite index of business activity (PMI) of the UK for August; also, at this time, the index of business activity in the services sector will be released.
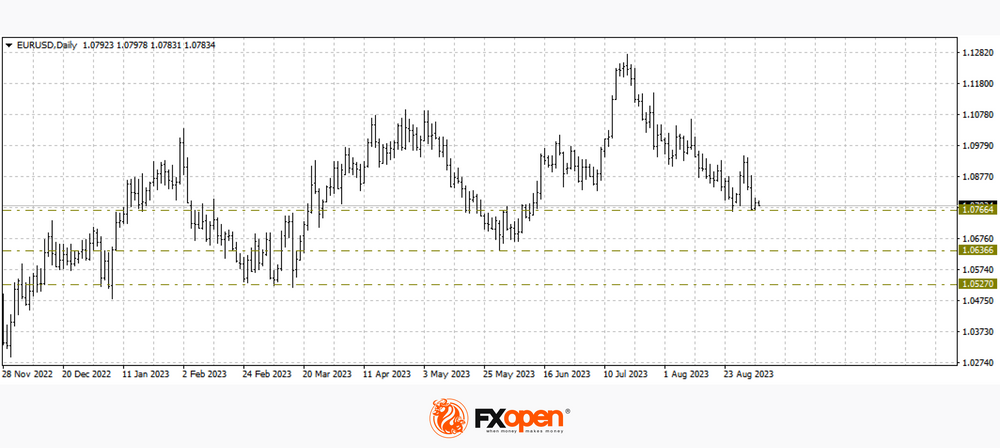
EUR/USD
We can also see the breakdown of the ascending combination in the EUR/USD pair. Buyers of the single European currency failed to stay above 1.0900, and at the moment, the price is trading below 1.0800. If there are no fundamental prerequisites for a reversal in the coming trading sessions, the pair's decline may intensify. The nearest supports are located at 1.0600-1.0500, and their breakdown may bring the price back to parity.
Today, it is worth paying attention to the publication of data on the index of business activity in the eurozone services sector for August. ECB President Christine Lagarde and ECB representative Isabel Schnabel are also scheduled to speak.
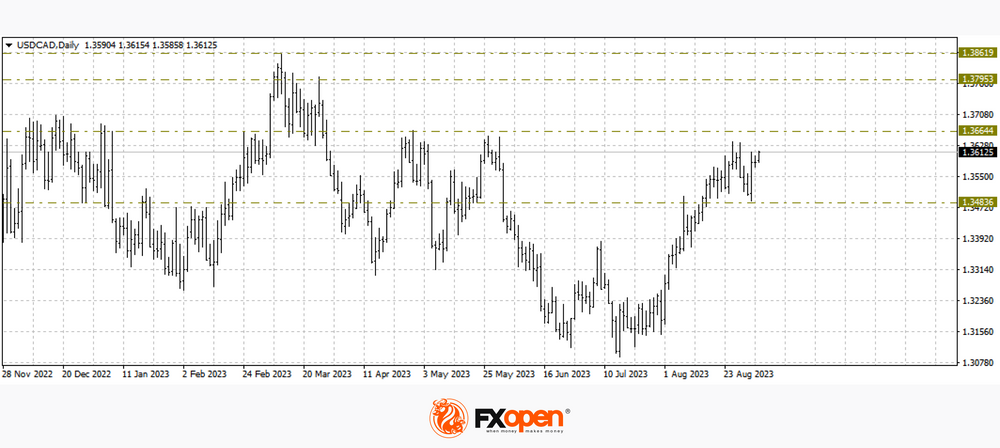
USD/CAD
The USD/CAD currency pair is again trading above 1.3600. This is the third attempt to overcome the important resistance, which has been beyond the control of greenback buyers since April of this year. In this case, the range of 1.3640-1.3620 is vital since the variants of breakdown with upward movement and rebound with the subsequent development of a downward correction are equivalent.
Tomorrow is important for the pricing of the pair, a meeting of the Bank of Canada is scheduled at 17:00 GMT+3.
This article represents the opinion of the Companies operating under the FXOpen brand only. It is not to be construed as an offer, solicitation, or recommendation with respect to products and services provided by the Companies operating under the FXOpen brand, nor is it to be considered financial advice.
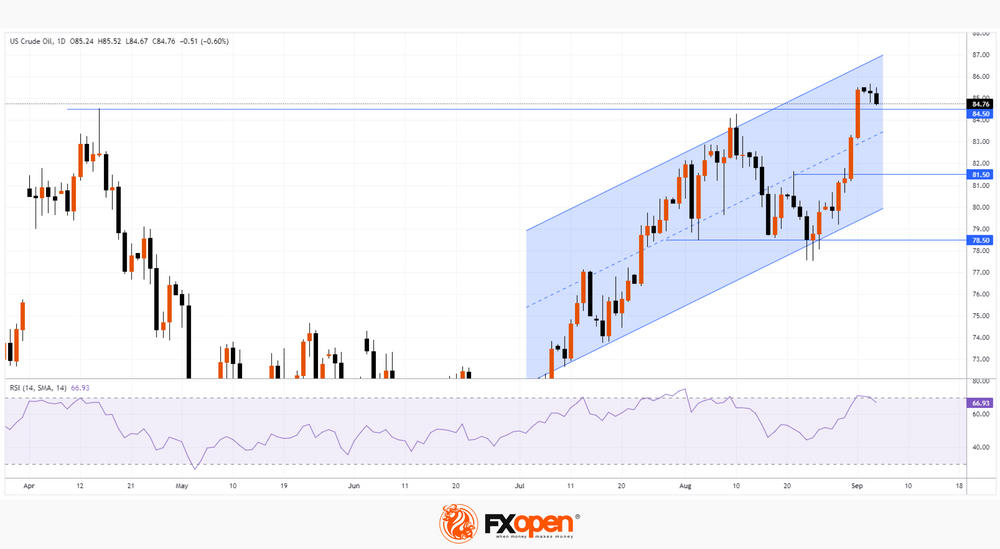
Price of Oil Sets Maximum of the Year
Yesterday, the price of WTI oil rose above USD 85.50 per barrel. This has not happened since November 2022.
On August 24, we wrote that the price of oil could find support for growth from the lower border of the rising channel, as well as from the level of USD 78.50. Since then, the price of WTI oil has risen by more than 9%. Fundamentally this contributed to:
→ the policy of limiting production by OPEC+ countries;
→ expectations that the Chinese economy will recover thanks to the incentives of the authorities.
According to Trafigura, a large company trading mainly in metals and energy resources, investment in the development of the oil industry is not enough, and a price of up to USD 88 can be considered fair in the current circumstances.
Bullish arguments:
→ the price of oil has not yet reached the upper limit of the rising channel, leaving the potential for updating the highs of the year;
→ the level at 81.50, which worked as a resistance, can now provide support;
→ support can also be provided by the median line of the uplink.
Bearish arguments:
→ rising oil prices are unfavorable for large economies, including the United States, which are struggling with high inflation. We can expect steps from governments aimed at lowering prices;
→ after 2 weeks of rapid growth (and especially on August 31 and September 1), a pullback would be a logical development for a market that is “overheated”. The RSI indicator indicates overbought.
This article represents the opinion of the Companies operating under the FXOpen brand only. It is not to be construed as an offer, solicitation, or recommendation with respect to products and services provided by the Companies operating under the FXOpen brand, nor is it to be considered financial advice.