

Sample Category Title
USD/CAD Daily Outlook
Daily Pivots: (S1) 1.3577; (P) 1.3591; (R1) 1.3606; More....
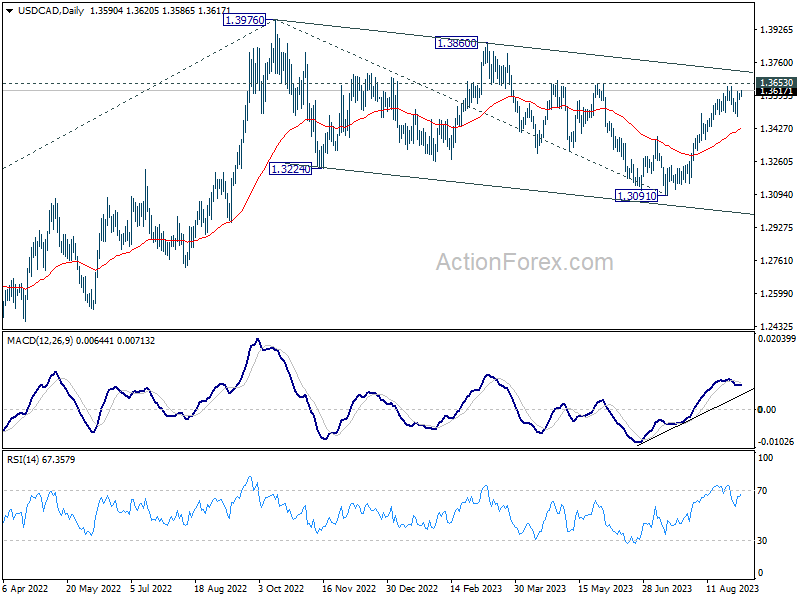
USD/CAD is still bounded in range of 1.3488/3638 and intraday bias remains neutral. On the upside, decisive break of 1.3653 resistance should confirm that correction from 1.3976 has completed, and target a test on this high. Meanwhile, below 1.3488 will bring another fall to 55 D EMA (now at 1.3428).
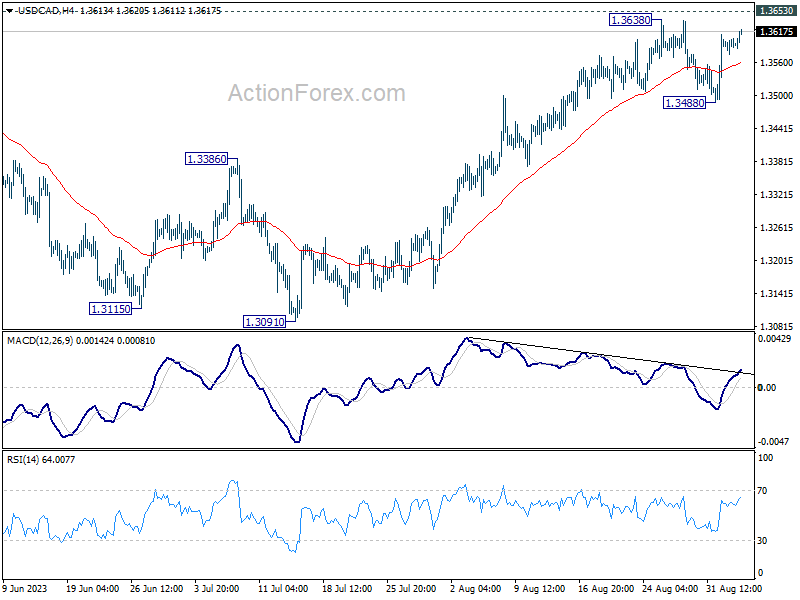
In the bigger picture, price actions from 1.3976 are viewed as a corrective pattern only. Upon completion, rise from 1.2005 (2021 low) would resume through 1.3976. Next target is 61.8% projection of 1.2005 to 1.3976 from 1.3091 at 1.4309. For now, this will remain the favored case as long as 55 D EMA (now at 1.3415) holds.
RBA Pauses, But ECB Could Hardly Skip Hiking Next Week
Other than a nice 7% jump in Chinese property stocks following an apparently explosive weekend of home sales in Chinese big cities like Beijing and Shanghai amid the relaxed mortgage rules deployed by the government last week, we didn’t have much on our plate yesterday. European trading volumes were down by almost a third below their 30-day average and the major European indices were slightly down, as neither Friday’s jobs optimism in the US, nor the Chinese rebound on property news could help Europeans forget about their own slowing economies and sticky inflation, which probably require at least one more rate hike from the European Central Bank (ECB). The DAX remained offered near its 50 and 100-DMA, as the Stoxx 600 closed yesterday’s session below its own 50-DMA. Americans coming back from their long weekend, after the latest data showed a sweet loosening in US jobs market last month, could add some optimism to the mix, but the topside in European stock markets remains limited.
There is one place on the old continent, however, where the stock market looks more promising, is the UK. The British FTSE 100 – which clearly lagged its continental European and American peers so far this year, is looking in a better place to outperform in the H2, because of its high exposure to energy and mining stocks. The FTSE 100 has potential for a further rise toward 7650 then to 7800 level.
Activity in FTSE futures hints at a bearish start today.
In the FX
The EURUSD remains offered below its 200-DMA today, although the softening Federal Reserve (Fed) expectations make more sense than softening ECB expectations, provided that the ECB is NOT in a comfortable place to call a pause at this month’s meeting amid the uptick in latest inflation figures. Therefore, if the ECB expectations, which may have softened unnecessarily are restored into the next ECB meeting, we should see the EURUSD find a solid ground before the critical 1.0615 Fibonacci support.
On the flip side of the world, the Reserve Bank of Australia (RBA) kept its cash rate unchanged at 4.1% at today’s monetary policy meeting. The EURAUD rebounded from a month-dip as investors saw opportunity to trade the soft RBA stance versus a possibly unfunded softness in ECB expectations, which justifies a further upside correction in the EURAUD toward the 1.70 mark – especially when the news from China remains disquieting.
Elsewhere in the Pacific, Japan is testing the market demand for its 10 and 30-year bonds this week, as the finance ministry sells 2.7 trillion-yen worth of 10-year bonds today and 900-billion-yen worth of 30-year bonds on Thursday. Of course, the Bank of Japan (BoJ) is out and buying a massive amount of bonds to make sure that the YCC not too relaxed, and traders are looking for signs of still sluggish demand from local investors that could force the BoJ to act earlier than … never. The Japanese 10-year yield is currently at a 9-year high, but is still below 65bp, meaning that it has ways to strengthen. However, when the Japanese yields will become interesting enough for domestic Japanese investors - which are also among the biggest buyers of US papers, the returning home will apply a decent pressure on the US long term yields.
China Remains in the Spotlight
Market movers today
Today brings the final August PMI figures for the euro area and the flash service PMIs for Italy and Spain. The service sector PMIs in both Spain and Italy have been above 50 the whole year indicating a continuous expansion of the service sectors. Today it will be interesting to see if the service PMIs in the two countries followed the euro area figures and dropped below 50 in august.
In the euro area, we will also receive the producer price index for July. After the sharp increase in producer prices in 2021 and 2022, the index has fallen like a stick this year. We expect that the decline continued in July both on a monthly and annual basis. Consensus is looking for a print of -7.6% y/y and -0.5% m/m. This will continue to weigh on goods inflation.
From ECB both Lagarde and Schnabel will be on the wires.
The 60 second overview
This morning, Caixin Services PMI for China came in weaker than expected, again fuelling fears that the economy is slowing down. The index fell to 51.8 in August (cons. 53.5), its lowest level this year, from 54.1 in July. Asian equities are on the red on the back of this while concerns regarding Country Garden's default add to the weak investor sentiment. The property developer has only a few hours left to make coupon payments on its dollar bonds. Yesterday, a local media outlet reported that the company is also seeking to extend repayments on seven yuan-denominated bonds, by three years, including a bond that is due in September 2025.
We have updated our economic projections for the Nordic economies, Euro area, the US and China. While the US is performing better than expected and can probably avoid a recession, the same is not true for other economies. We have not seen the full effect of the sharp rise in interest rates, and there is a high degree of uncertainty and risks for the near-term economic outlook. The Nordic countries, like the rest of Europe, will likely face a period of more or less stagnating economies and modestly higher unemployment. Read more in Nordic Outlook - Divergent fortunes, 5 September.
Equities: Global equities were marginally higher yesterday lifted by Asia while European markets were slightly lower and the US market was closed for Labour Day. It is worth nothing the cyclical outperformance in Europe despite the sluggish performance. Both tech and consumer discretionary were higher while utilities, consumer staples and communication service were all lower. There were not that many drivers with US markets closed. In Europe yesterday, STOXX 600 -0.1%, FTSE 100 -0.2%, DAX -0.1%, CAC -0.2%. Asian markets are lower this morning as we have got sluggish Chinese service PMIs coupled with surprisingly high Japanese CPI data. European and US futures are also down this morning.
FI: There was a modest rise in the European government bond yields of 3-5bp in the 10Y segment. With the US market closed, activity was low, but the primary market continues to be very active especially in the covered bond market, where we see issuance in the 5Y segment. Furthermore, EIB is coming to the market with a 5Y deal and World Bank coming to the market with a 15Y deal.
FX: Markets were off to a quiet start to the week with US markets closed on Monday and EUR/USD trading broadly sideways. While the recent Chinese stimulus has improved Chinese risk sentiment this has only offered limited support to CNH, with USD/CNH ending the day marginally higher and EUR/CNH recovering from Friday's lows. Oil prices continued its move higher during yesterday's session with Brent above USD88/bbl. This offered support to NOK, which keeps trading in the lower end of the last weeks' tight range.
Credit: With US markets closed on Monday, credit markets had less information to trade on and were thus relatively calm. iTraxx Main tightened 0.5bp to close at 69.6bp, while iTraxx Xover tightened 3.5bp to close at 392.2bp. Among more notable events, Assa Abloy launched a widely anticipated EUR benchmark deal, to fund recent large M&A. The deal will be across three tranches and is likely to launch during this week.
Technical Outlook and Review
DXY:
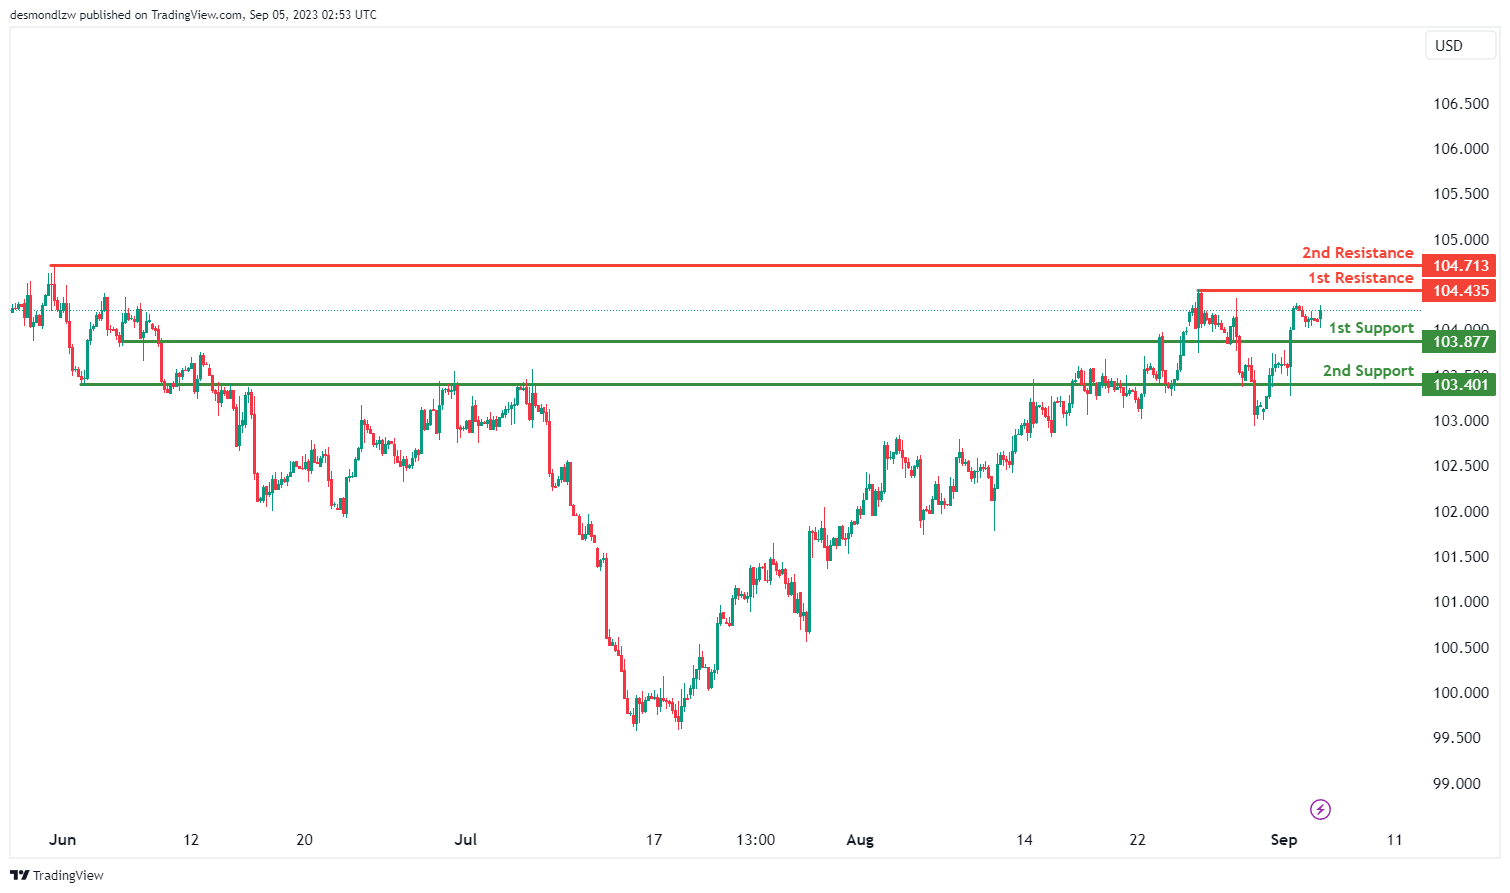
The DXY chart exhibits a bullish momentum, indicating an upward trend in price movement. This sentiment is supported by the price’s position within a bullish ascending channel, suggesting the potential for further upward momentum.
There’s a potential scenario for a bullish continuation towards the 1st resistance level. The 1st support at 103.40 holds significance as a pullback support, indicating that historical price action has found support around this level during pullbacks.
The 2nd support at 103.40 is identified as an overlap support, reinforcing the notion of historical support around this area. This adds to the potential strength of this support level.
In terms of resistance, the 1st resistance at 104.43 gains importance due to its alignment with a swing high resistance level. This suggests that historical price action has faced resistance around this level.
Additionally, the 2nd resistance at 104.71 is marked as a swing high resistance, further emphasizing its potential significance as a level where price might encounter resistance.
EUR/USD:
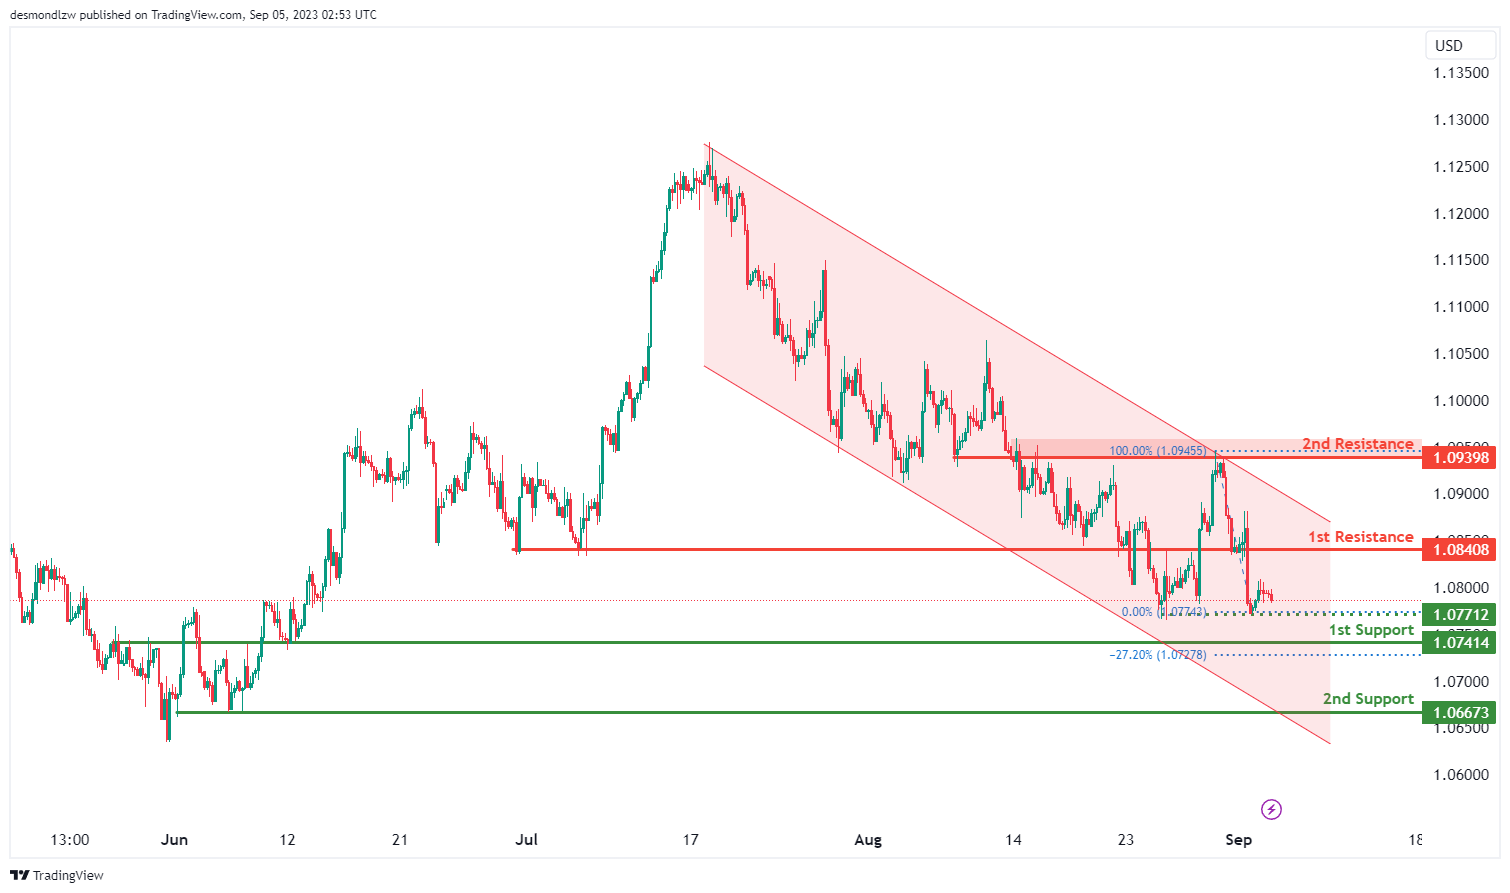
The EUR/USD chart reflects a bearish momentum, indicating a downward trend in price movement. This sentiment is supported by the price’s position within a bearish descending channel, suggesting the potential for further downward momentum.
There’s a potential scenario for a bearish continuation towards the 1st support level. The 1st support at 1.0741 is identified as an overlap support and aligns with the -27% Fibonacci Expansion level. This confluence of support factors strengthens its potential as a key support zone.
The 2nd support at 1.0667 is noted as a multi-swing low support, highlighting historical instances of the price finding support around this level. This adds to the significance of this support level.
On the resistance side, the 1st resistance at 1.0840 is marked as pullback resistance, indicating that historical price action has faced resistance around this level during pullbacks.
Additionally, the 2nd resistance at 1.0939 is identified as an overlap resistance, further reinforcing its potential significance as a level where price might encounter resistance.
An intermediate support level at 1.0771 is recognized as a multi-swing low support, adding to its importance as a potential area where price could find support during pullbacks.
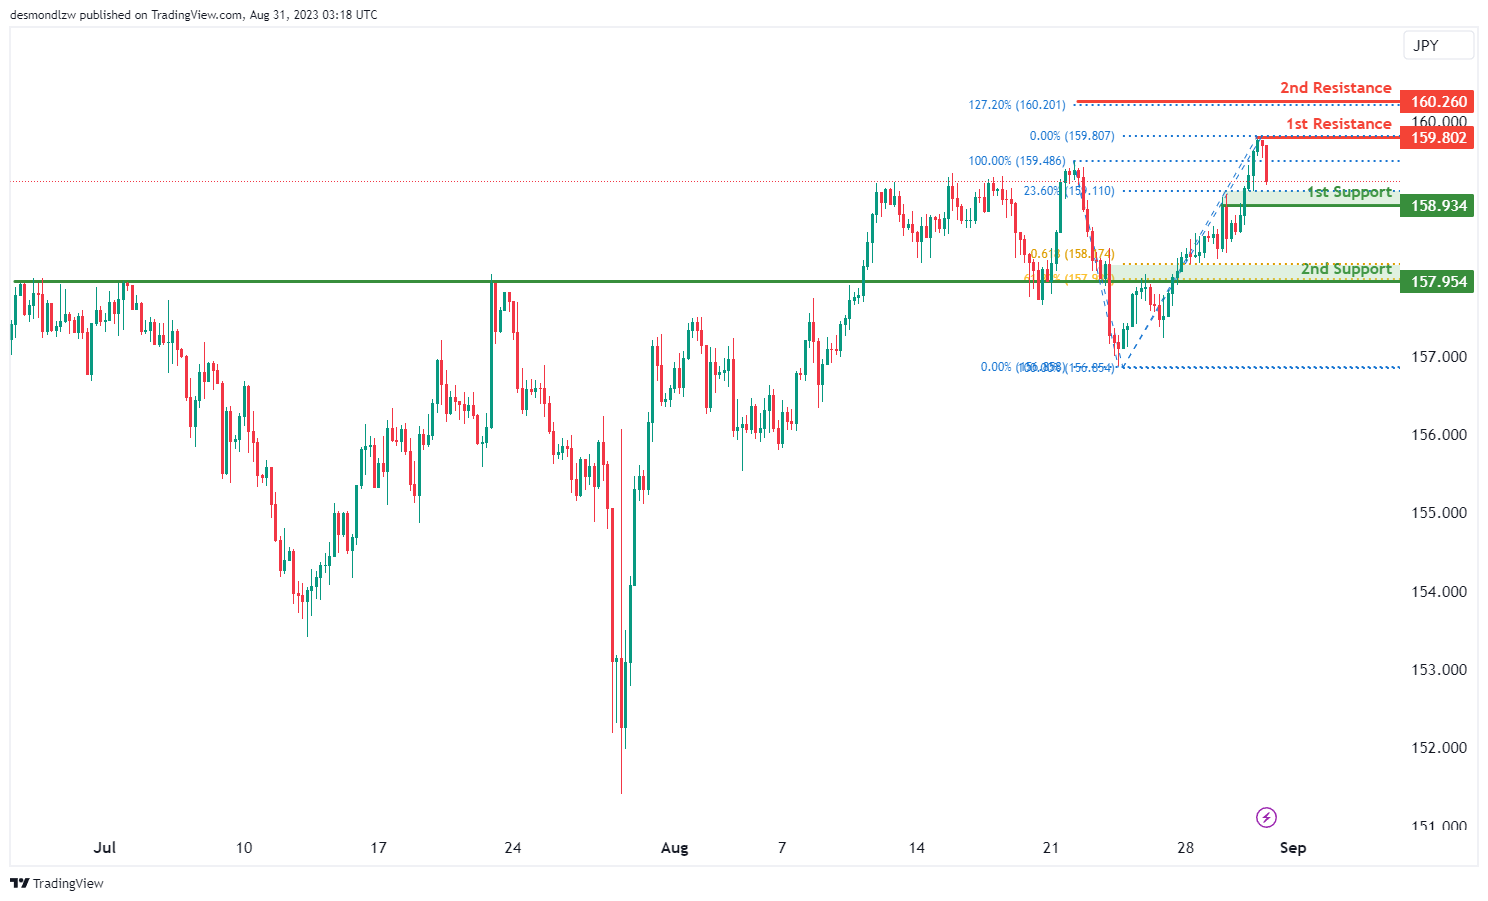
EUR/JPY:
The instrument EUR/JPY currently demonstrates a bearish overall momentum on the chart.
There is a potential scenario where the price could have a bearish reaction off the 1st resistance level at 158.47 and drop towards the 1st support level at 157.06.
The 1st support level at 157.06 is considered strong as it represents multi-swing low support.
On the resistance side, the 1st resistance at 158.47 is significant because it serves as a pullback resistance and aligns with a 50% Fibonacci Retracement.
Furthermore, the 2nd resistance level at 159.22 is considered significant as it represents overlap resistance and aligns with both a 78.60% Fibonacci Retracement and a 78.60% Fibonacci Projection, indicating Fibonacci confluence.
EUR/GBP:
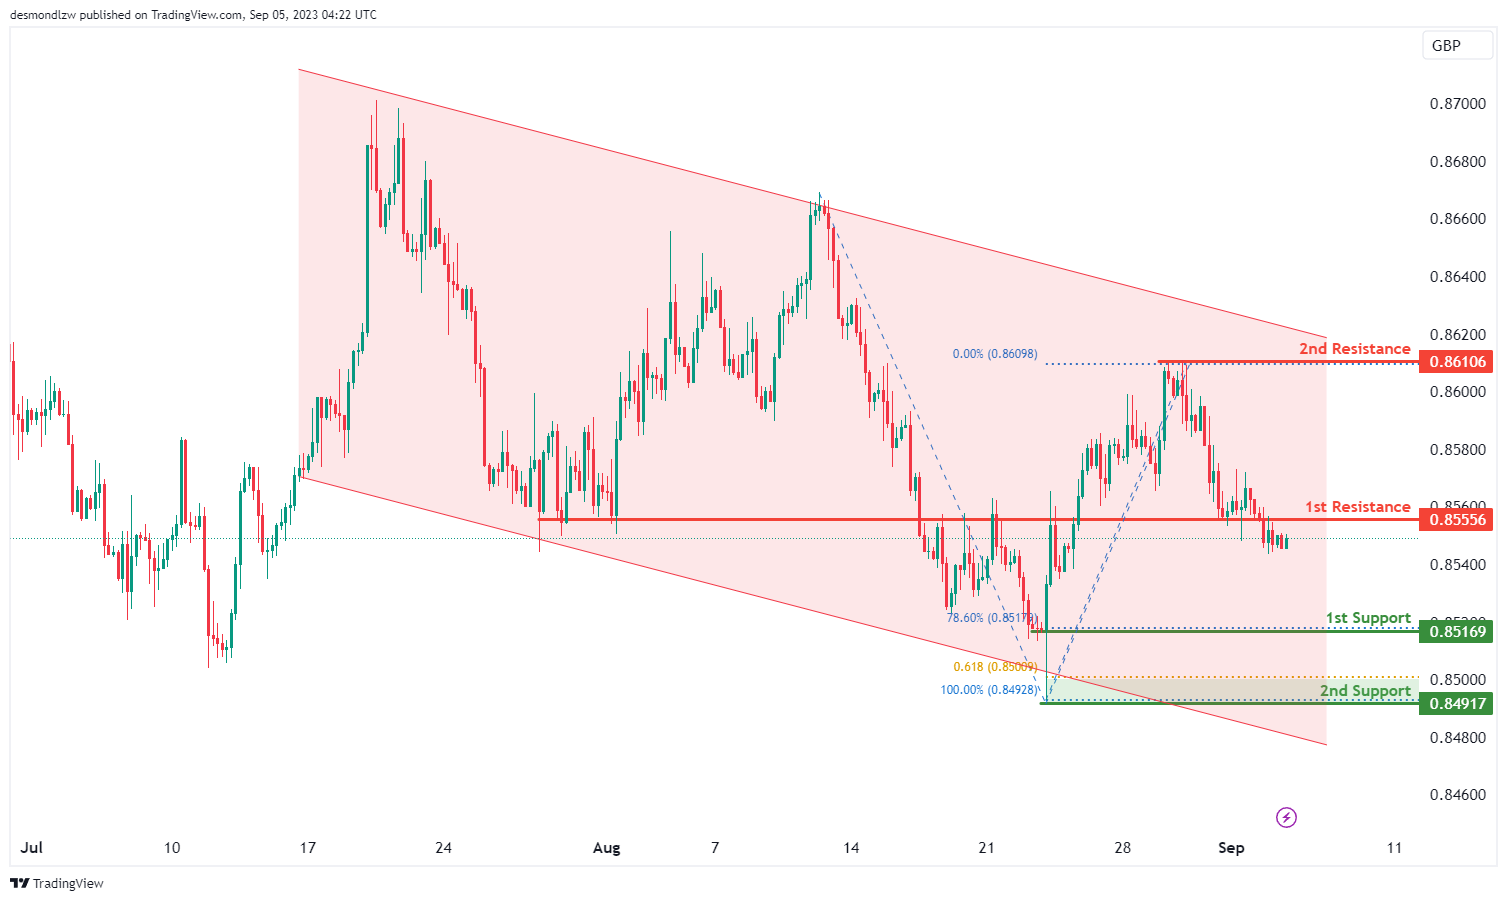
The instrument EUR/GBP currently exhibits a bearish overall momentum on the chart, characterized by the presence of a bearish descending channel.
In this context, there is a potential scenario where the price could experience a bearish reaction off the 1st resistance level at 0.8555 and subsequently drop towards the 1st support level at 0.8516.
The 1st support level at 0.8516 is considered strong because it represents swing low support and aligns with a 78.60% Fibonacci Retracement.
Additionally, there is a 2nd support level at 0.8491, which is significant as it represents swing low support and aligns with a 61.80% Fibonacci Projection.
On the resistance side, the 1st resistance at 0.8555 is noteworthy as it serves as overlap resistance, indicating potential selling pressure in this area.
Furthermore, the 2nd resistance level at 0.8610 is considered significant as it represents swing high resistance.
GBP/USD:
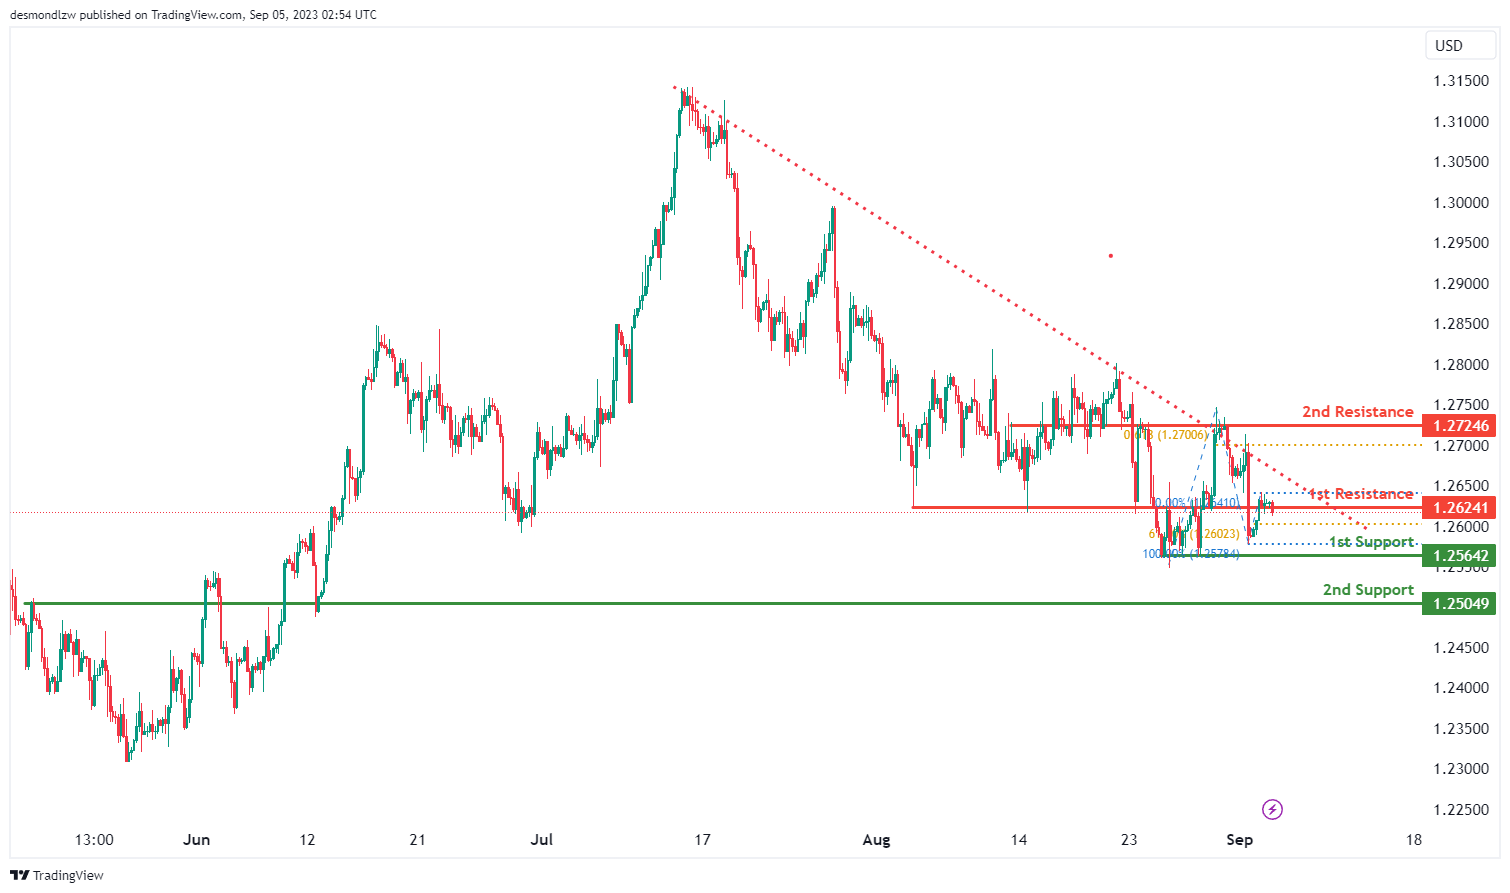
The GBP/USD chart indicates a bearish momentum, signaling a downward trend in price movement. This sentiment is reinforced by the price’s position below a significant descending trend line, hinting at the potential for continued bearish momentum.
A potential scenario involves a bearish reaction at the 1st resistance level, potentially leading to a drop towards the 1st support.
The 1st support at 1.2564 is identified as a multi-swing low support, indicating historical instances of price finding support around this level. This adds to its importance as a potential support zone.
Another 1st support at 1.2504 is noted as an overlap support, suggesting that historical price action has found support in this area.
Looking at resistance levels, the 1st resistance at 1.2624 is marked as an overlap resistance, indicating historical instances of price encountering resistance at this level.
Furthermore, the 2nd resistance at 1.2724 is also identified as an overlap resistance, with the added significance of aligning with the 61.80% Fibonacci Projection level, enhancing its potential as a resistance zone.
GBP/JPY:
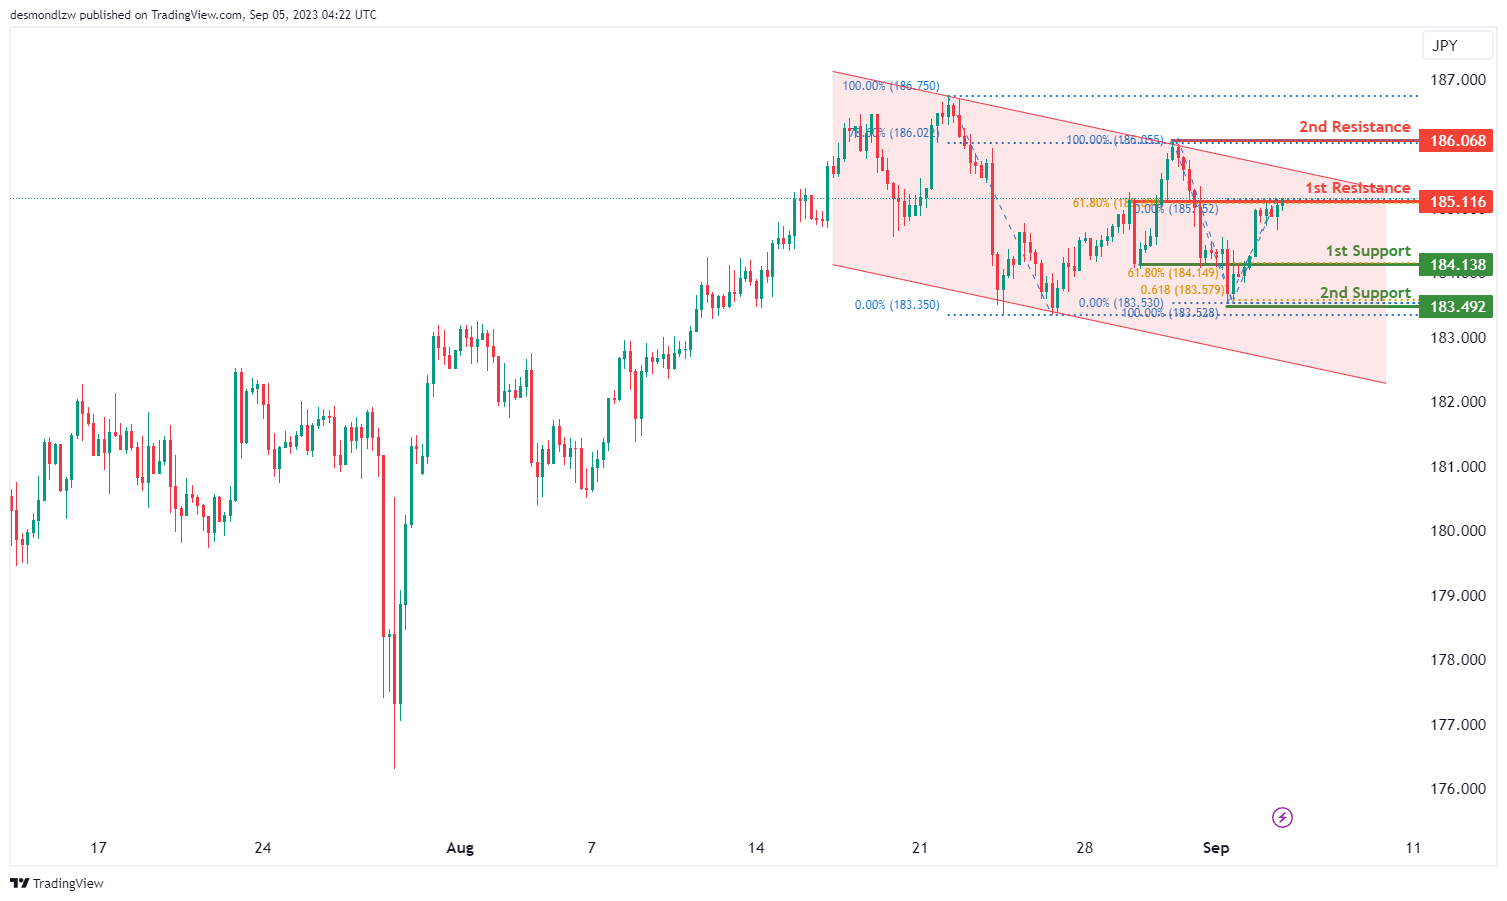
The instrument GBP/JPY currently demonstrates a bearish overall momentum on the chart, characterized by the presence of a bearish descending channel.
In this context, there is a potential scenario where the price could have a bearish reaction off the 1st resistance level at 185.11 and subsequently drop towards the 1st support level at 184.13.
The 1st support level at 184.13 is considered strong because it represents overlap support and aligns with a 61.80% Fibonacci Retracement.
Additionally, there is a 2nd support level at 183.49, which is significant as it represents swing low support and aligns with a 61.80% Fibonacci Projection.
On the resistance side, the 1st resistance at 185.11 is noteworthy because it serves as multi-swing high resistance and aligns with a 61.80% Fibonacci Retracement.
Furthermore, the 2nd resistance level at 186.06 is considered significant as it represents swing high resistance and aligns with a 78.60% Fibonacci Retracement.
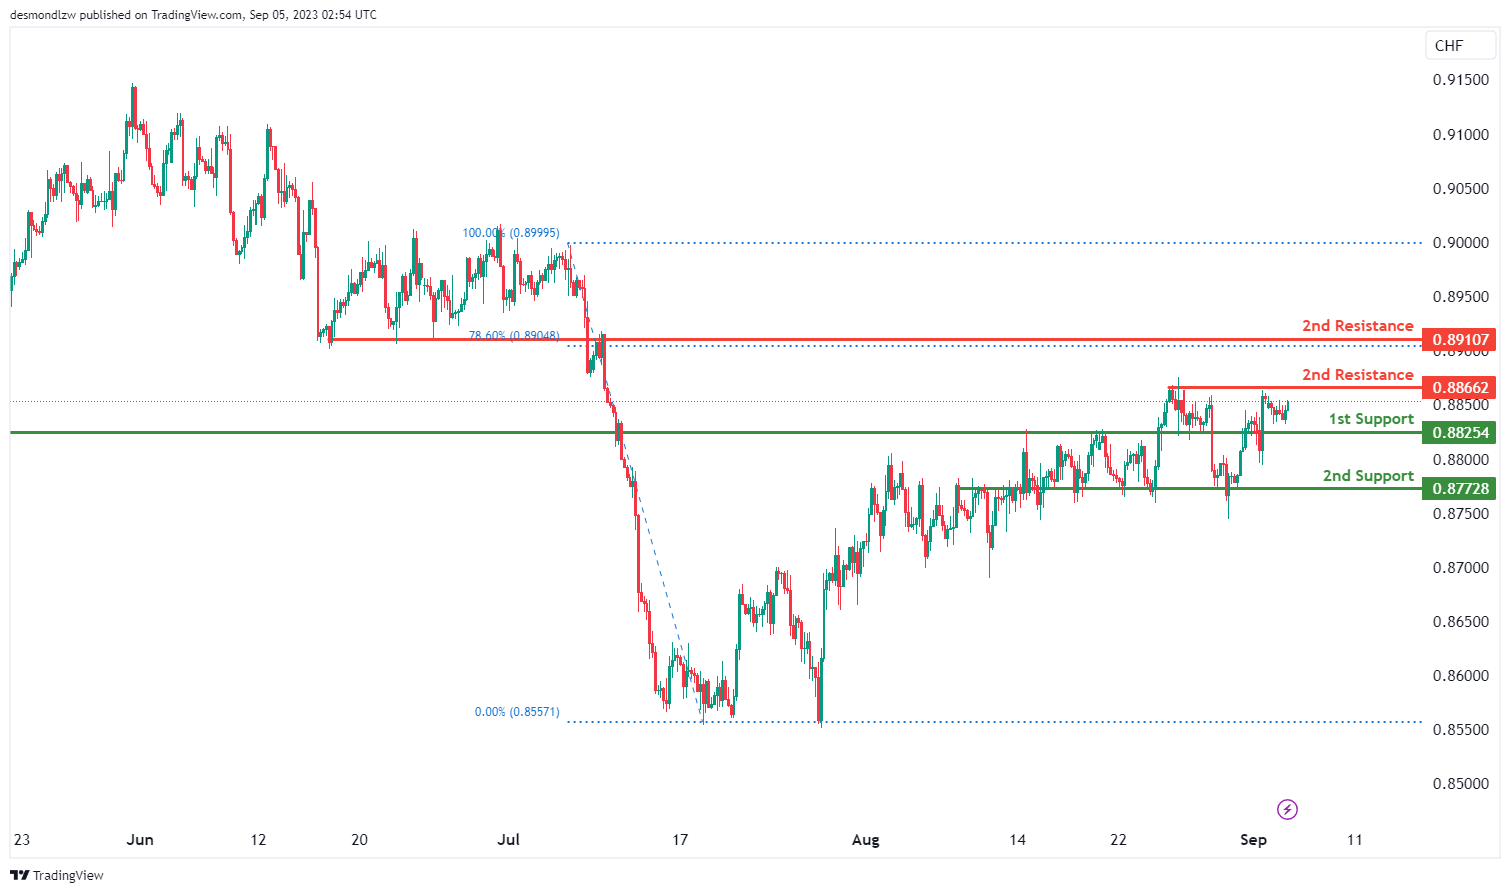
USD/CHF:
The USD/CHF chart indicates a neutral overall momentum, suggesting a lack of clear directional bias in the price movement.
There’s a potential scenario where the price fluctuates between the 1st resistance and 1st support levels.
The 1st support at 0.8825 is identified as an overlap support, indicating historical instances of the price finding support around this level.
Similarly, the 2nd support at 0.8772 is noted as an overlap support, suggesting that this level has served as a supportive region in the past.
On the resistance side, the 1st resistance at 0.8866 is highlighted as a multi-swing high resistance, indicating historical instances of price encountering resistance in this area.
Additionally, the 2nd resistance at 0.8910 is recognized as an overlap resistance, further reinforcing the potential significance of this level.
USD/JPY:
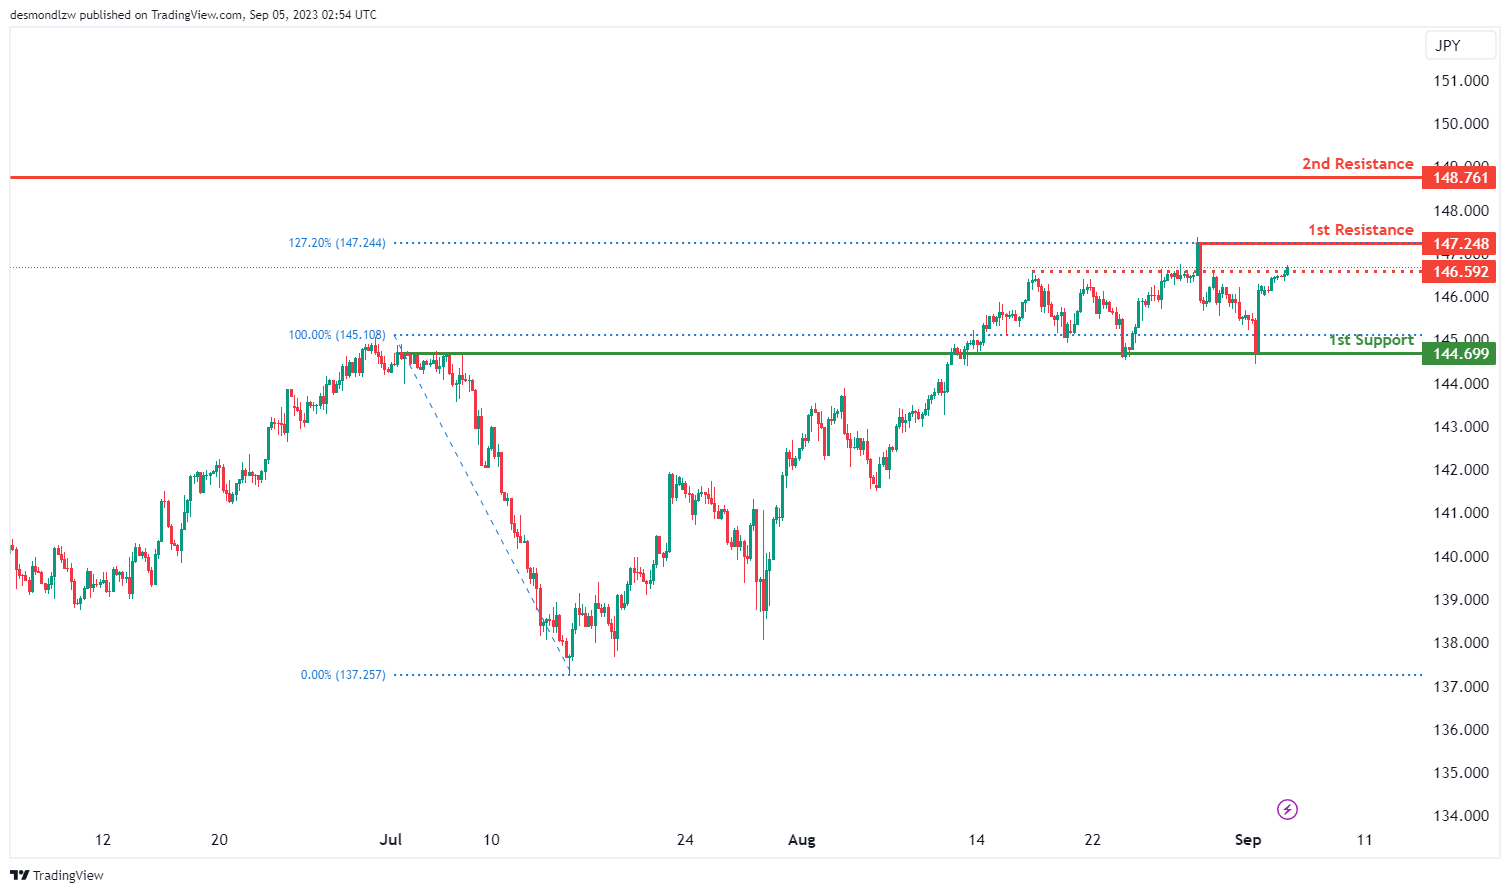
Instrument: USD/JPY
Overall momentum of the chart: Bullish
The USD/JPY chart indicates a bullish overall momentum, suggesting a tendency towards upward price movement.
There’s potential for a bullish continuation towards the 1st resistance level.
The 1st support at 144.69 is recognized as an overlap support, reflecting historical instances of the price finding support around this level.
Looking at resistance levels, the 1st resistance at 147.24 gains significance due to its alignment with the 127.20% Fibonacci Extension, suggesting a potential point of resistance.
The 2nd resistance at 148.76 is also identified as a swing high resistance, indicating historical price action encountering resistance in this region.
Additionally, an intermediate resistance at 146.59 is noted as a pullback resistance, potentially serving as a temporary obstacle to a bullish movement.
USD/CAD:
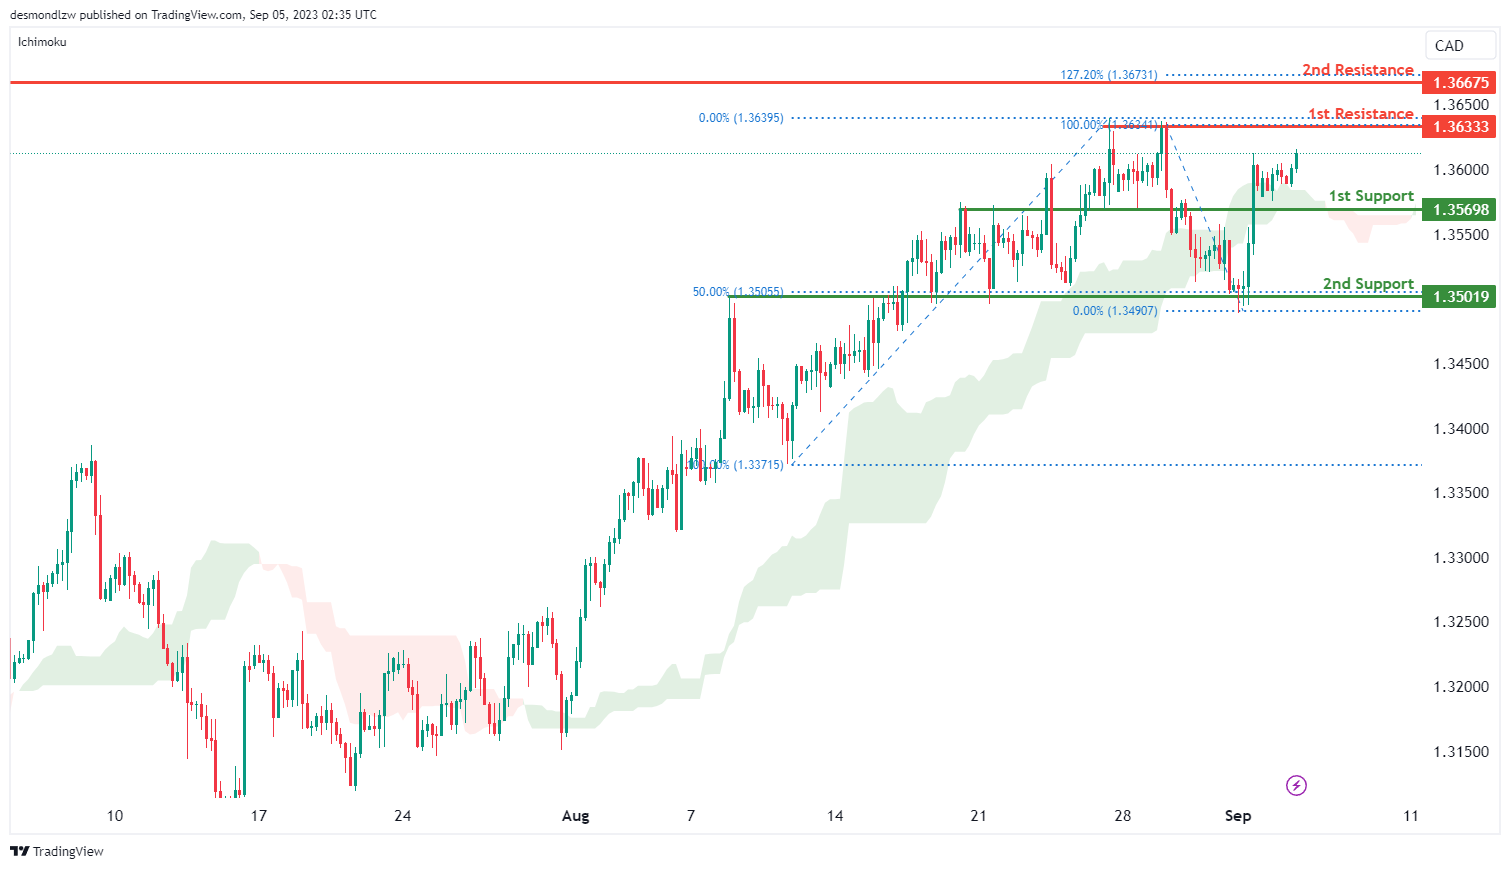
The USD/CAD chart is currently displaying an overall bullish momentum, which suggests an upward trend in its price movement. This positive momentum is attributed to price bouncing off the bullish Ichimoku cloud, indicating favourable conditions for further bullish movement towards the 1st resistance level.
The 1st resistance level at 1.3633 is identified as a multiple swing-high resistance. In addition, the 2nd resistance level at 1.3668 is identified as a swing-high resistance that aligns with the 127.20% Fibonacci extension level.
To the downside, the 1st support level at 1.3569 is identified as an overlap support. Similarly, the 2nd support level at 1.3502 is also identified as an overlap support that aligns with the 50.00% Fibonacci retracement level.
AUD/USD:
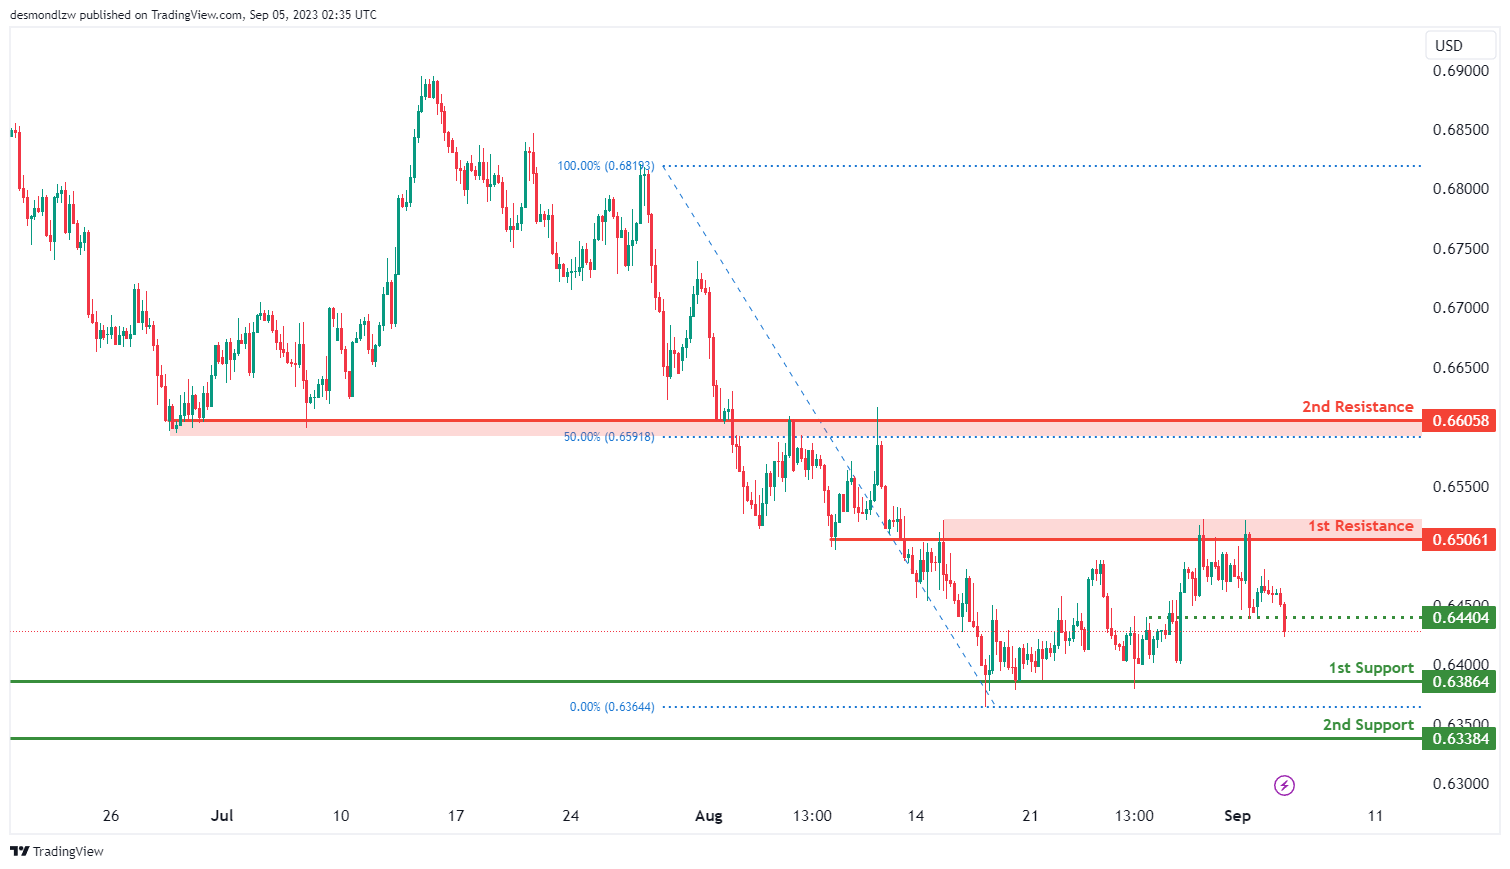
The AUD/USD chart is currently demonstrating a bearish momentum, with price having broken below the intermediate support level at 0.6440. This break suggests the potential for further bearish movement towards the 1st support level.
The 1st support level at 0.6386 is identified as a pullback support while the 2nd support level at 0.6338 also serves as a pullback support, further reinforcing its significance as a potential area of price support.
To the upside, the 1st resistance at 0.6506 is marked as an overlap resistance. Similarly, the 2nd resistance level at 0.6606 is also identified as an overlap resistance that aligns with the 50.00% Fibonacci retracement level.
NZD/USD
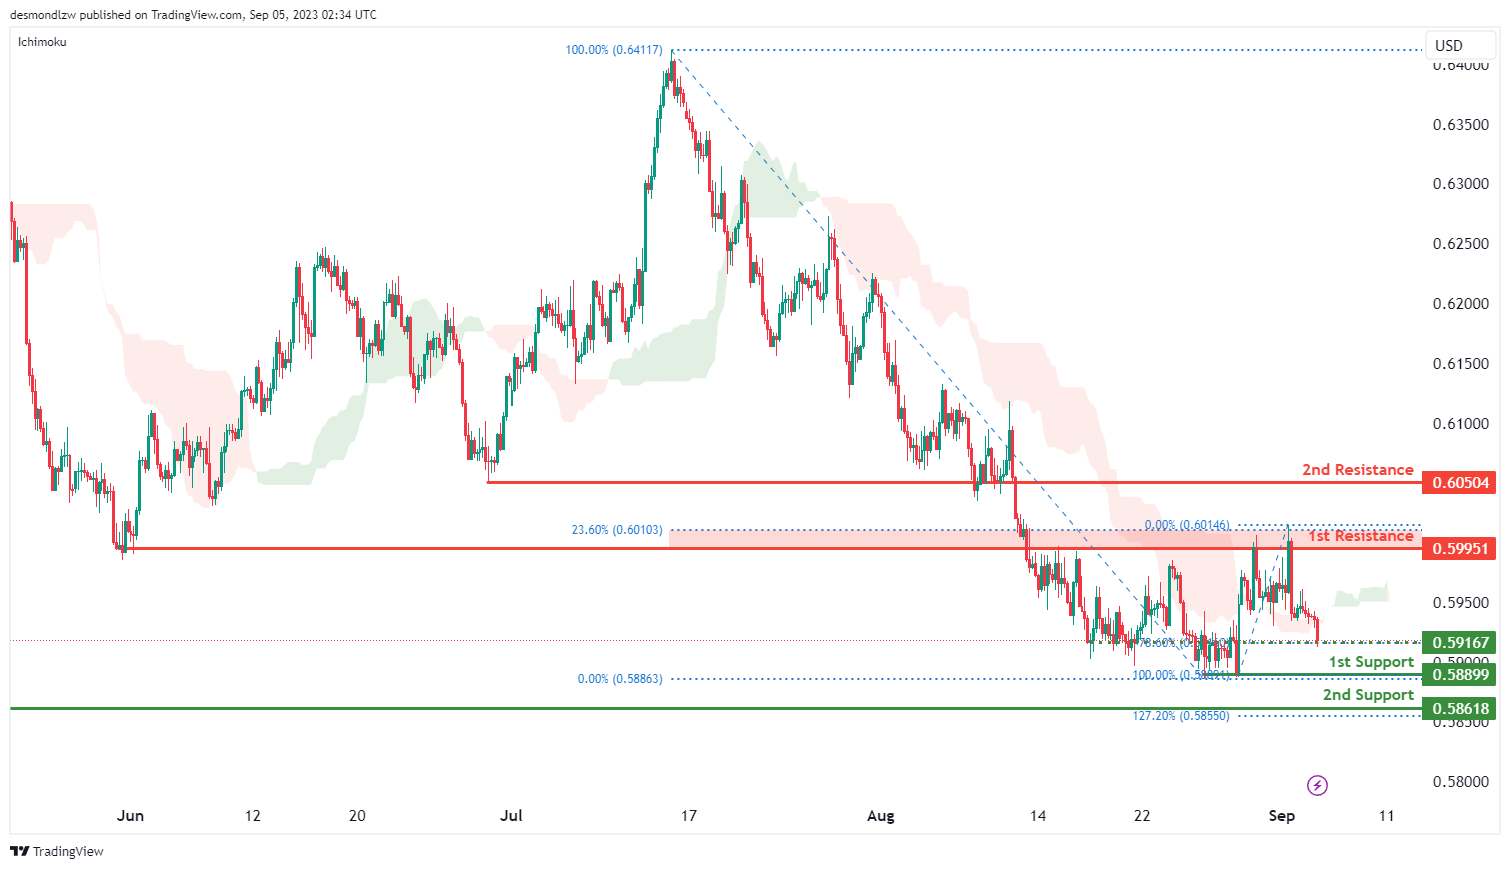
The NZD/USD chart is currently exhibiting a bearish momentum, which is attributed to the price crossing below the Ichimoku cloud. This crossing indicates the potential for further bearish movement towards the 1st support level should price also break below the intermediate support level at 0.5917.
The 1st support level at 0.5889 is identified as a pullback support while the 2nd support level at 0.5862 is also identified as a pullback support that aligns with the 127.20% Fibonacci extension level.
To the upside, the 1st resistance at 0.5995 is marked as an overlap resistance that coincides with the 23.60% Fibonacci retracement level. Furthermore, the 2nd resistance level at 0.6050 is identified as a pullback resistance.
DJ30:
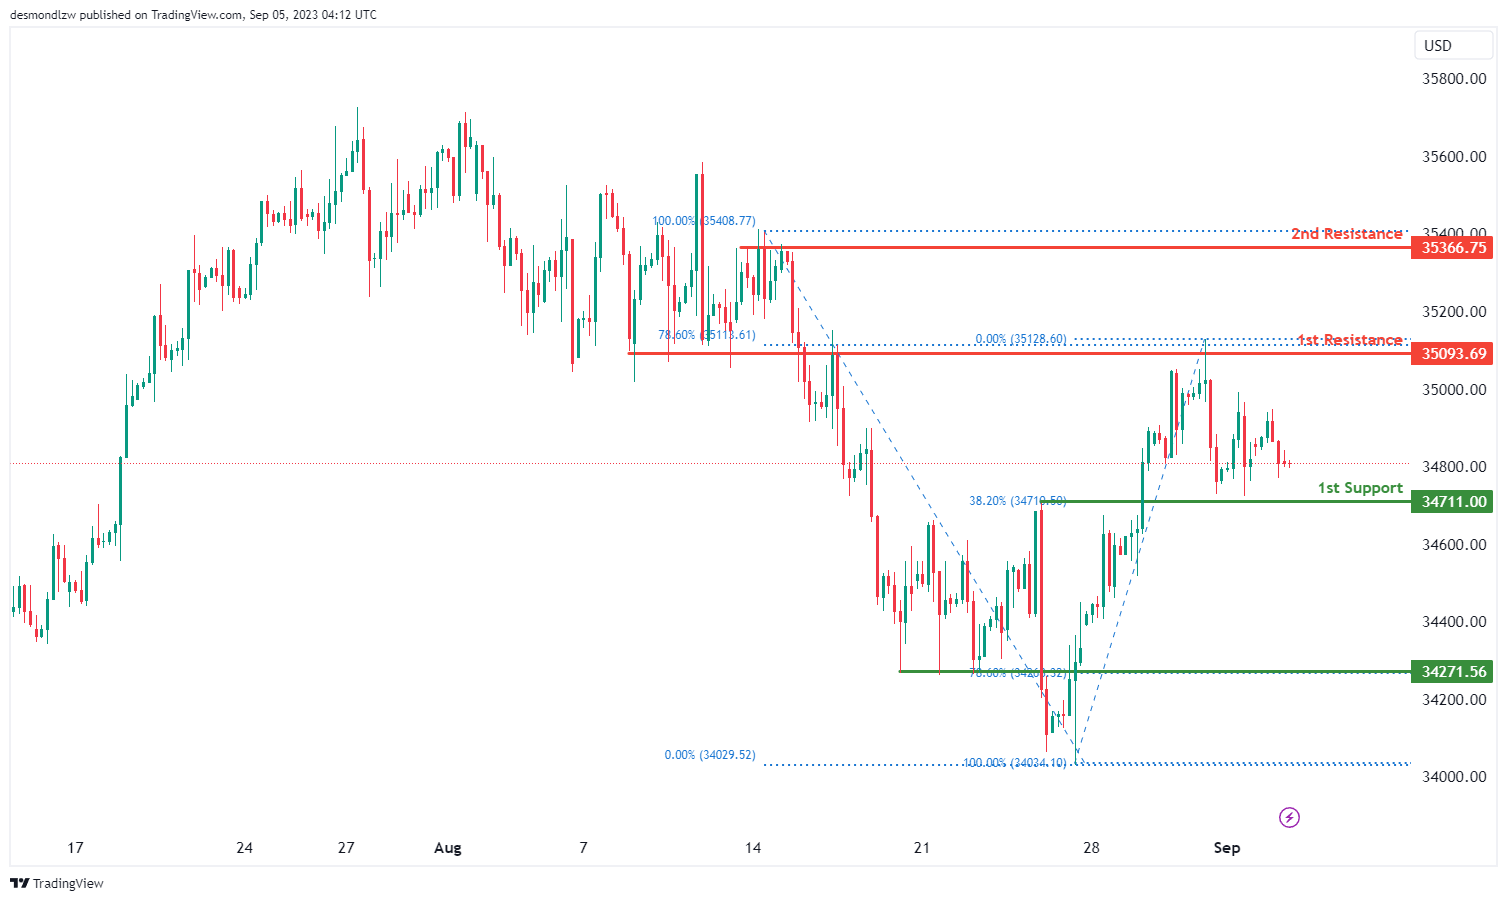
The instrument DJ30 currently reflects a bullish overall momentum on the chart.
However, there is a potential short-term scenario where the price could drop further to the 1st support level at 34711.00 before bouncing from there and subsequently rising towards the 1st resistance level.
The 1st support level at 34711.00 is considered good because it represents overlap support and aligns with a 38.20% Fibonacci Retracement.
Additionally, there is a 2nd support level at 34271.50, which is significant as it represents pullback support.
On the resistance side, the 1st resistance at 35093.60 is notable as it serves as overlap resistance and aligns with a 78.60% Fibonacci Retracement.
Furthermore, the 2nd resistance at 35366.70 is considered significant as it represents multi-swing high resistance.
GER30:
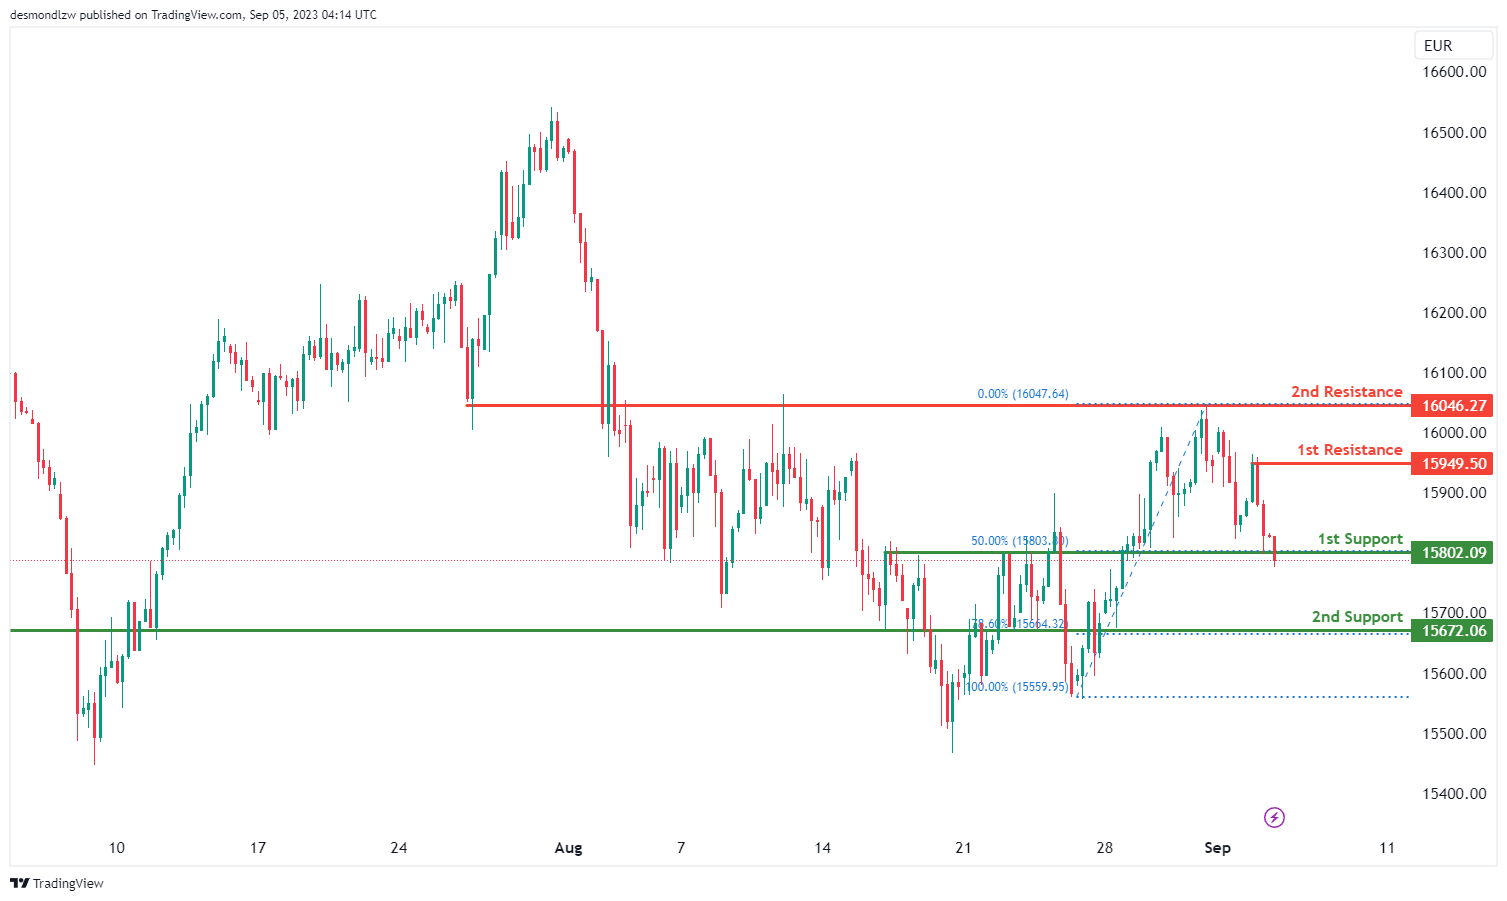
The instrument GER30 currently displays a bearish overall momentum on the chart.
There is a potential scenario where the price could make a bearish break off the 1st support level at 15802.00 and drop towards the 2nd support level at 15672.00.
The 1st support level at 15802.00 is considered strong as it represents overlap support and aligns with a 50% Fibonacci Retracement.
Additionally, there is a 2nd support level at 15672.00, which is also significant as it represents overlap support and aligns with a 78.60% Fibonacci Retracement.
On the resistance side, the 1st resistance at 15949.50 is noteworthy as it serves as swing high resistance.
Furthermore, the 2nd resistance at 16046.20 is considered significant as it represents overlap resistance.
US500
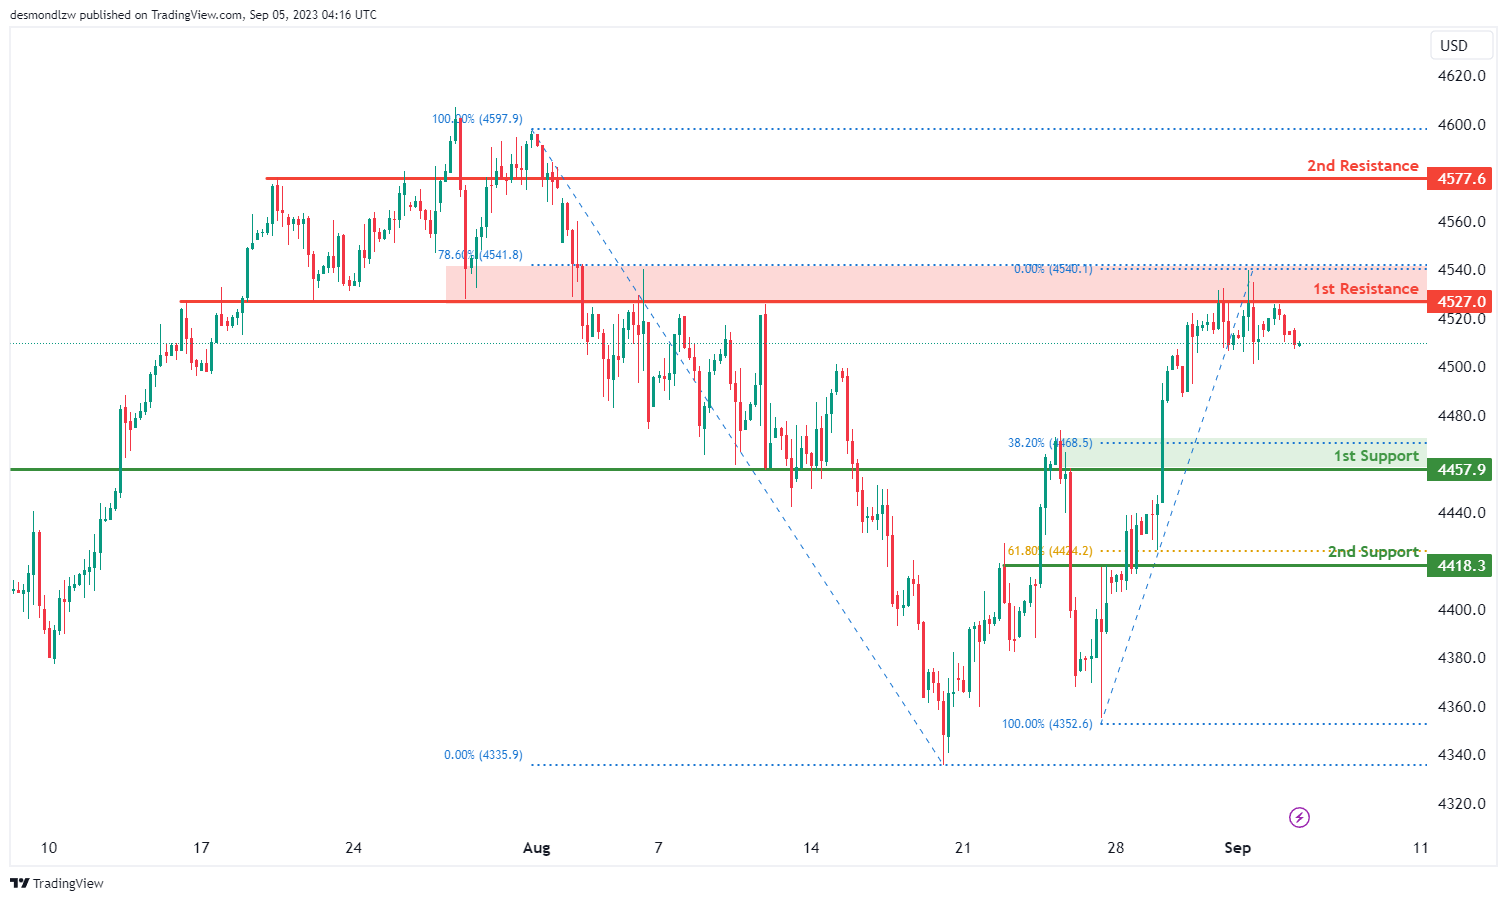
The instrument US500 (S&P 500) currently demonstrates a bearish overall momentum on the chart.
There is a potential scenario where the price could continue its bearish movement towards the 1st support level at 4457.9.
The 1st support level at 4457.9 is considered strong because it represents pullback support and aligns with a 38.20% Fibonacci Retracement.
Additionally, there is a 2nd support level at 4418.3, which is also significant as it represents pullback support and aligns with a 61.80% Fibonacci Retracement.
On the resistance side, the 1st resistance at 4527.0 is noteworthy as it serves as overlap resistance and aligns with a 78.60% Fibonacci Retracement.
Furthermore, the 2nd resistance at 4577.6 is considered significant as it represents overlap resistance.
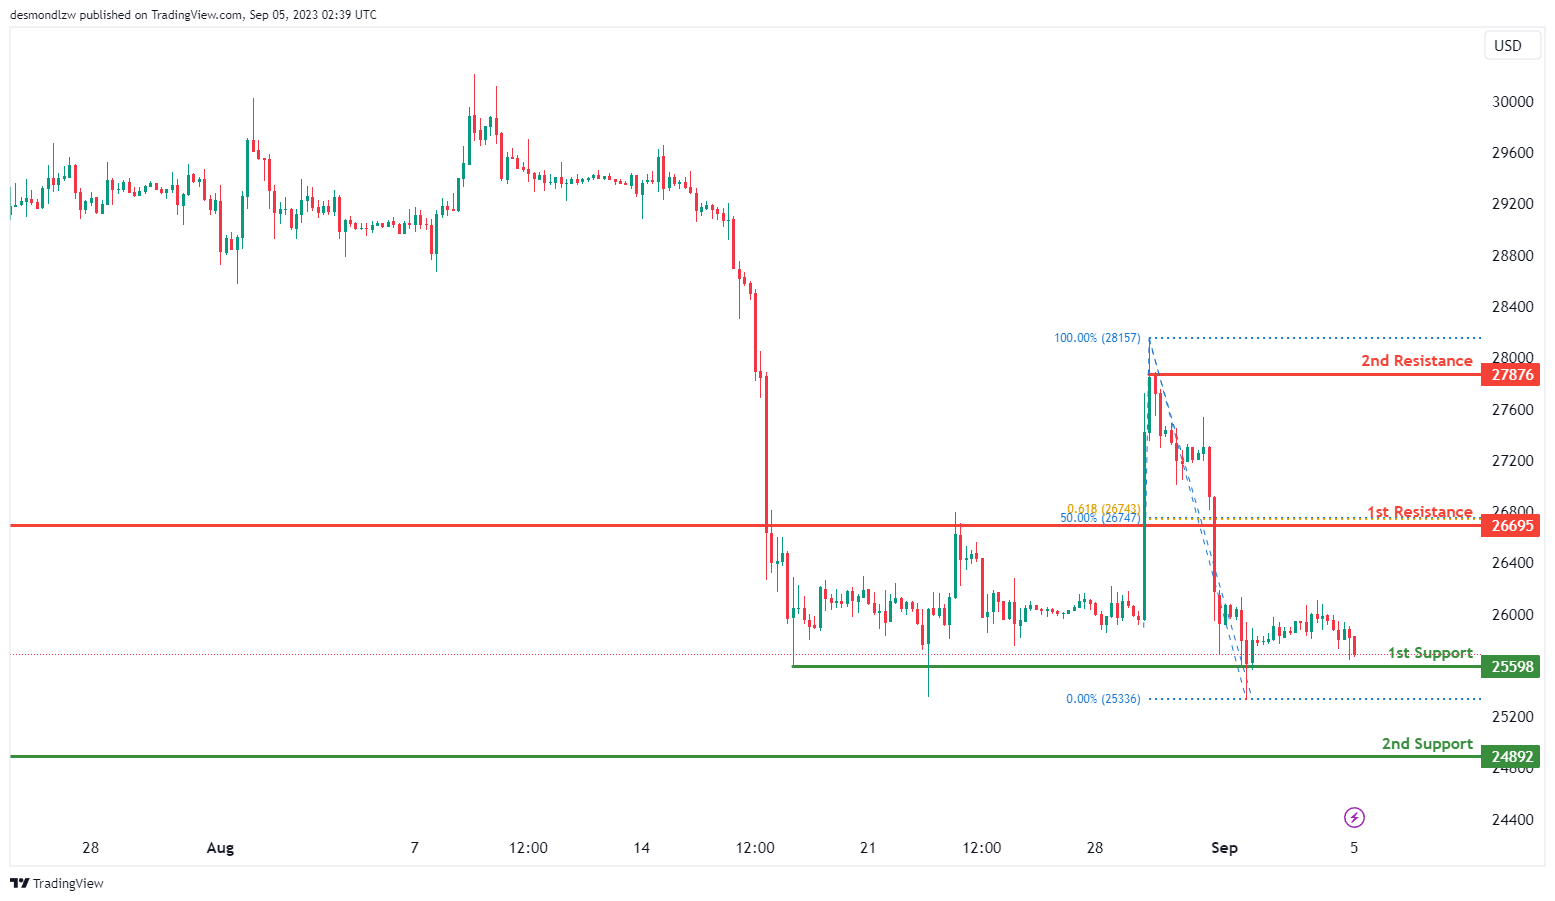
BTC/USD:
The instrument BTC/USD currently reflects a bullish overall momentum on the chart.
Price is potentially set to make a bullish move, bouncing off the 1st support level at 25598. This support level is considered good because it represents multi-swing low support.
There is also a 2nd support level at 24892, which is significant as it represents swing low support.
On the resistance side, the 1st resistance at 26695 is seen as a strong point because it serves as a pullback resistance and aligns with both a 50% Fibonacci Retracement and a 61.80% Fibonacci Projection, indicating Fibonacci confluence.
Furthermore, the 2nd resistance at 27876 is considered significant as it represents swing high resistance.
Overall, the chart suggests a bullish momentum, with the potential for a bullish bounce off the 1st support level, leading towards the 1st resistance level for BTC/USD.
ETH/USD:
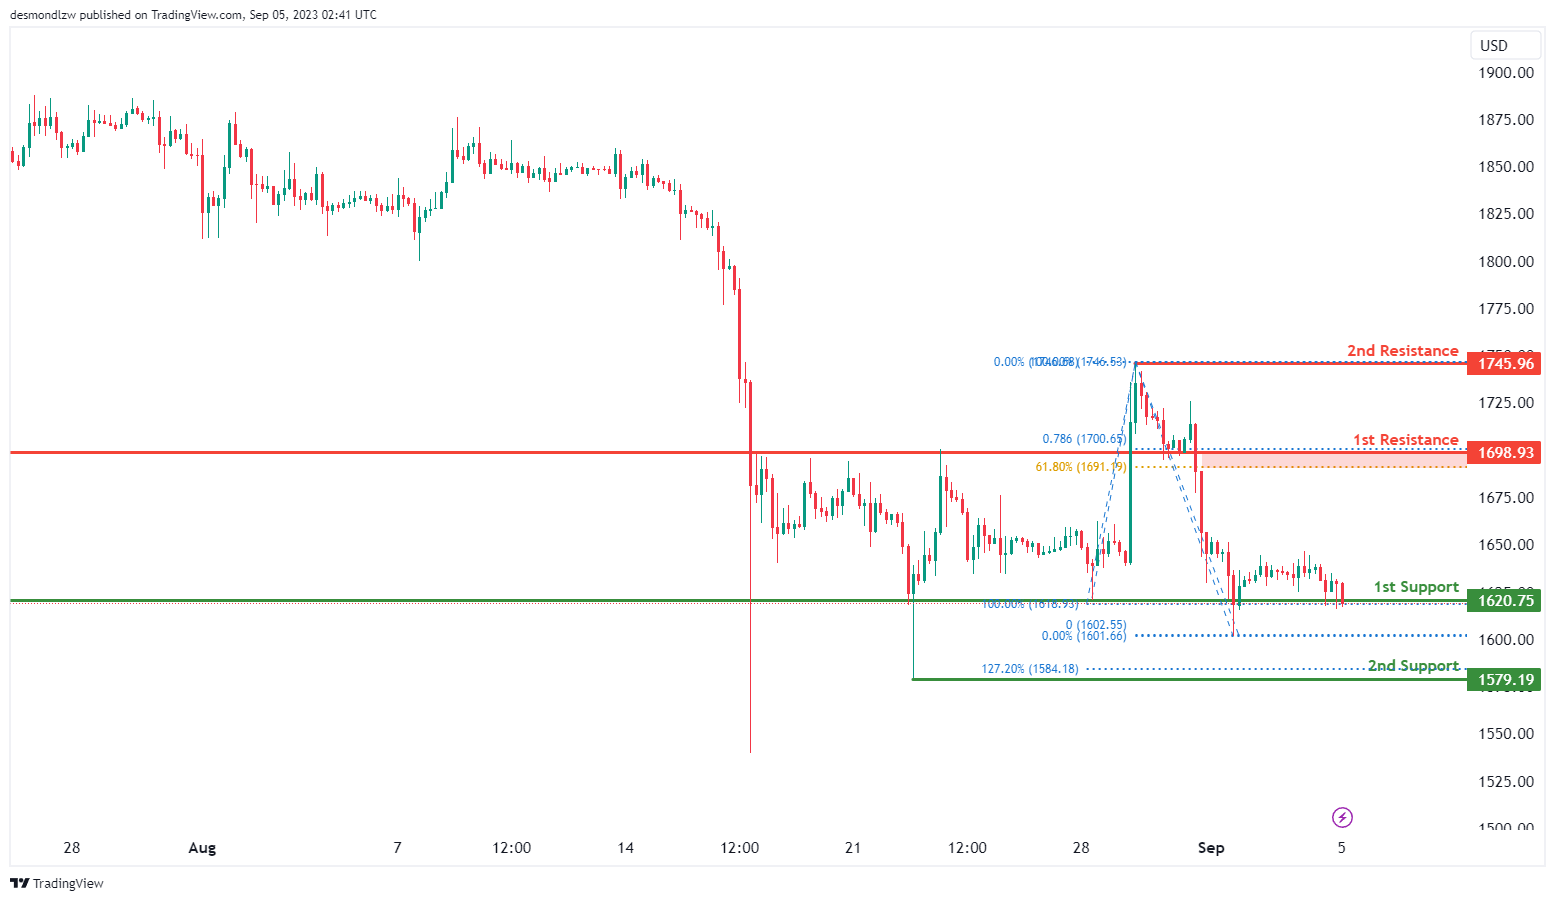
The instrument ETH/USD currently demonstrates a bullish overall momentum on the chart.
There’s a potential scenario where the price could make a bullish move by bouncing off the 1st support level at 1620.75. This support level is considered strong because it represents multi-swing low support.
Additionally, there is a 2nd support level at 1579.19, which is significant as it represents swing low support and aligns with a 127.20% Fibonacci Extension.
On the resistance side, the 1st resistance at 1698.93 is notable as it serves as a pullback resistance and aligns with both a 61.80% Fibonacci Retracement and a 78.60% Fibonacci Projection, indicating Fibonacci confluence.
Furthermore, the 2nd resistance at 1745.96 is considered significant as it represents swing high resistance.
Overall, the chart suggests a bullish momentum, with the potential for a bullish bounce off the 1st support level, leading towards the 1st resistance level for ETH/USD.
WTI/USD:
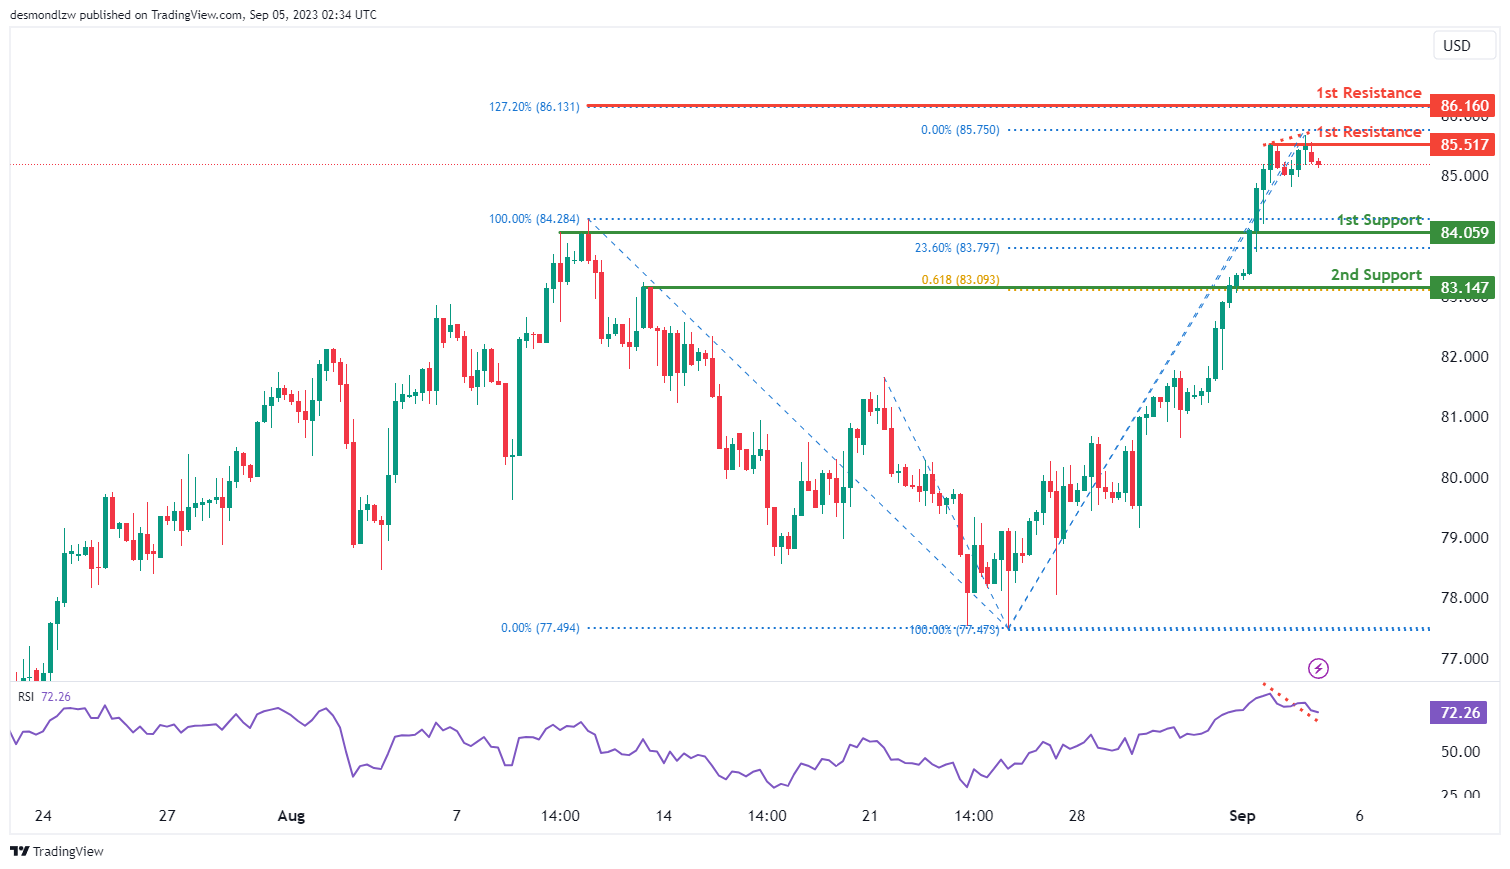
The WTI chart is currently demonstrating a bearish momentum, indicating a downward trend in price movement. Given this bearish sentiment, there is potential for price to experience a bearish continuation towards the 1st support level.
Additionally, the Relative Strength Index (RSI) is displaying bearish divergence compared to the price, which suggests the possibility of a reversal occurring soon. This divergence in RSI adds to the overall bearish outlook and potential for a price reversal.
The 1st support level at 84.06 is identified as a pullback support that aligns with the 23.60% Fibonacci retracement level. Furthermore, the 2nd support level at 83.15 is also identified as a pullback support that coincides with the 61.80% Fibonacci projection level.
To the upside, the 1st resistance level at 85.52 is marked as a multiple swing-high resistance while the 2nd resistance level at 86.16 is identified as a resistance level that aligns with the 127.20% Fibonacci extension level.
XAU/USD (GOLD):
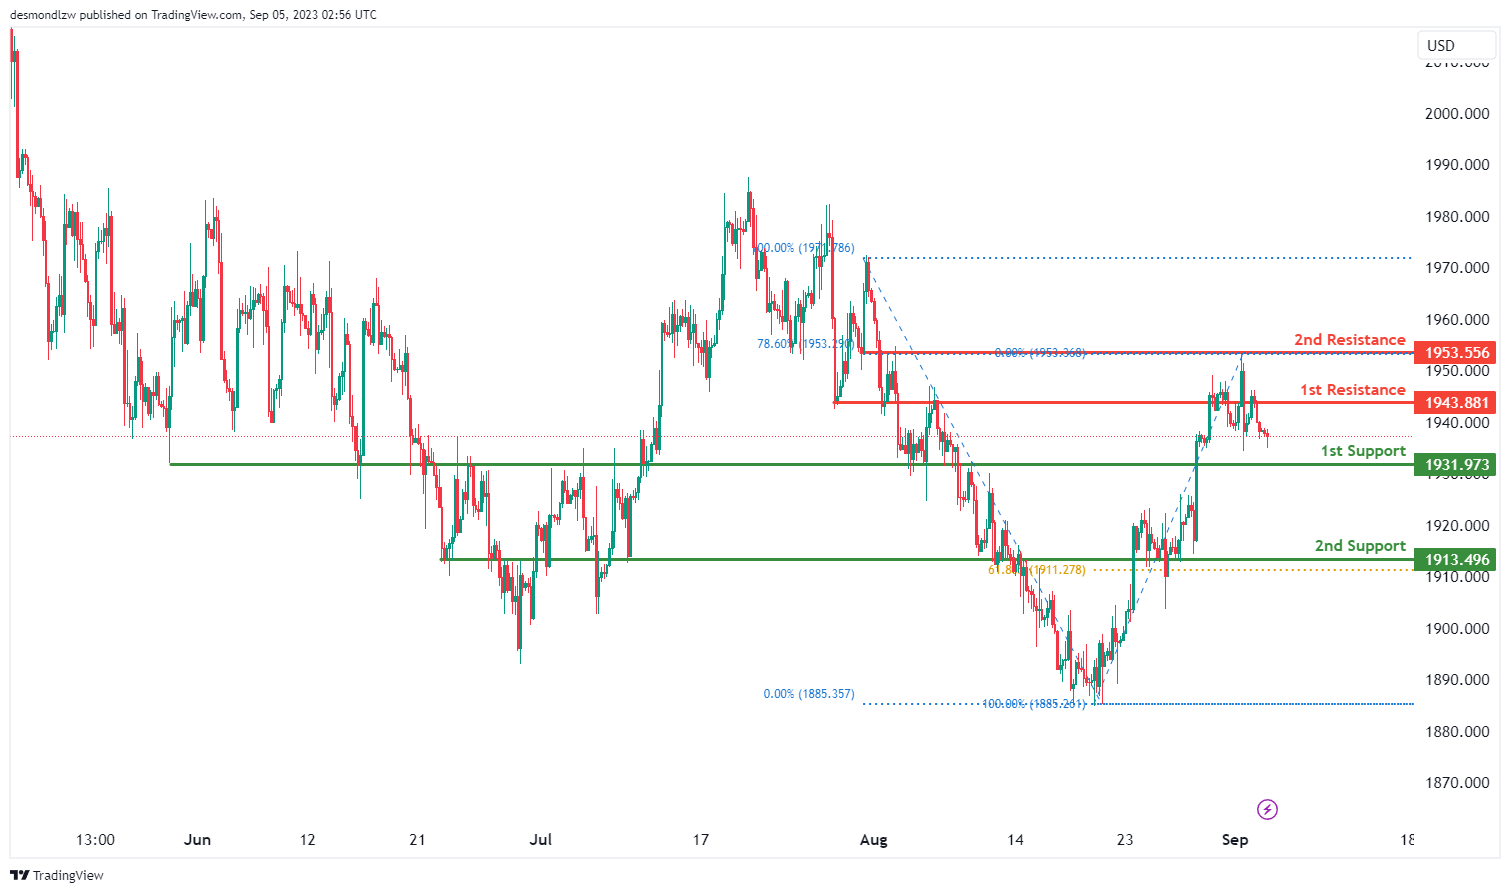
The XAU/USD chart currently demonstrates a bearish overall momentum, suggesting a trend towards downward price movement.
There’s potential for a bearish continuation towards the 1st support level.
The 1st support at 1931.97 is recognized as a pullback support, indicating a historical area where the price found support.
The 2nd support at 1913.49 is marked as an overlap support, aligning with the 61.80% Fibonacci Retracement, which enhances its significance as a potential support zone.
In terms of resistance levels, the 1st resistance at 1943.88 is identified as an overlap resistance, implying historical instances of the price facing resistance around this level.
The 2nd resistance at 1953.55 gains importance as an overlap resistance and aligns with the 78.60% Fibonacci Retracement, making it a noteworthy zone for potential price reactions.
AUD/USD Daily Report
Daily Pivots: (S1) 0.6444; (P) 0.6463; (R1) 0.6480; More...
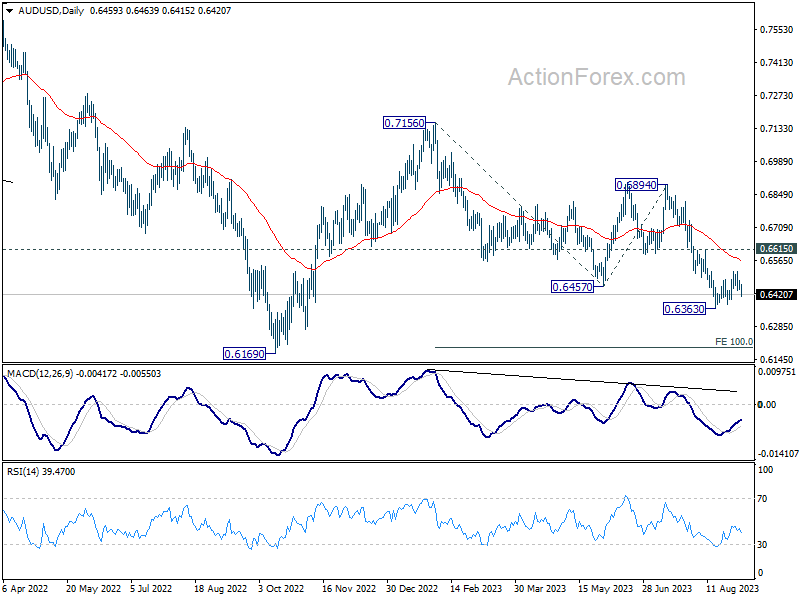
AUD/USD falls notably today but stays above 0.6363 short term bottom. Intraday bias remains neutral for now, and another recovery cannot be ruled out. But in that case, upside should be limited by 0.6615 resistance. On the downside, firm break of 0.6363 will resume larger fall from 0.7156 to 100% projection of 0.7156 to 0.6457 from 0.6894 at 0.6195.
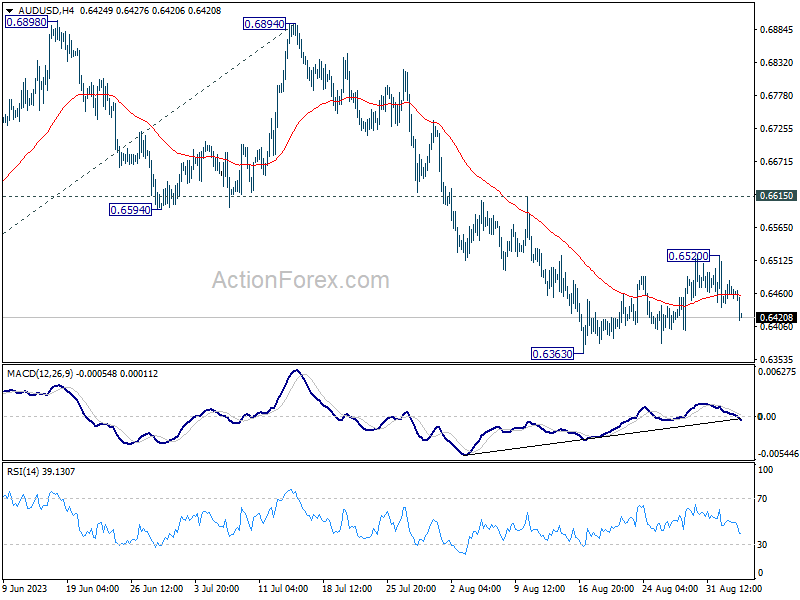
In the bigger picture, current development argues that the down trend from 0.8006 (2021 high) is still in progress. Decisive break of 0.6169 will target 61.8% projection of 0.8006 to 0.6169 to 0.7156 at 0.6021. This will now remain the favored case as long as 0.6894, in case of strong rebound.
RBA Rate Hold and Subpar China PMI Services Weigh Down Aussie Dollar
Australian Dollar finds itself on shaky ground today, trading lower due to lackluster investor sentiment, and stays soft after RBA's decision to keep interest rates unchanged, a move that was widely anticipated. New Zealand Dollar is tracking its Australian counterpart, emerging as the day's second-worst performer. Canadian Dollar is not far behind, showing weakness ahead of tomorrow's BoC rate decision. In contrast, Dollar is holding the fort as today's strongest currency so far, followed by European majors led by Euro. Japanese Yen is showing a mixed performance, continuing its near-term range trading against its major rivals.
Equities in China and Hong Kong took a hit, erasing all of yesterday's gains, following disappointing PMI Services data from China. Some economists are skeptical about the effectiveness of recent policy moves by Chinese authorities, labeling them as mere relaxation of over-regulation rather than genuine stimulus measures. While Country Garden, the troubled property developer, managed to avoid its first default by paying coupons on two dollar bonds within grace periods, this news failed to uplift the general market mood.
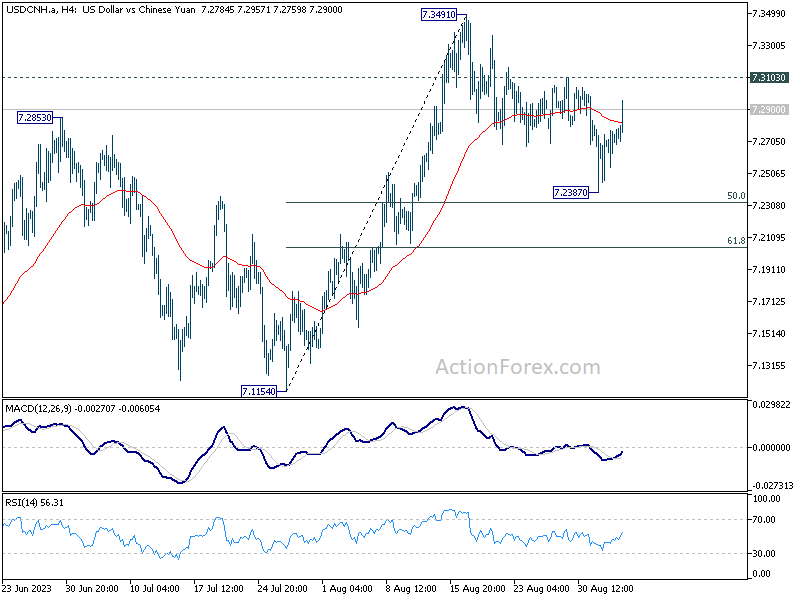
Technically, USD/CNH's rally today further affirms the case that correction from 7.3491 has completed at 7.2387. Focus for the next few days will be on 7.3103 resistance. Decisive break there would push USD/CNH through 7.3491 to retest 7.3745 (2022 high). Renewed selloff in Yuan might prompt the Chinese authority to announce more supporting measures.
In Asia, at the time of writing, Nikkei is down -0.10%. Hong Kong HSI is down -1.51%. China Shanghai SSE is down -0.63%. Singapore Strait Times is down -0.26%. Japan 10-year JGB yield is up 0.0092 at 0.656.
RBA holds rates steady at 4.10%, maintains hawkish bias
RBA held its cash rate target unchanged at 4.10% in a widely expected move, offering additional time to evaluate impact of previous interest rate hikes and evolving economic outlook. Although the central bank maintained hawkish bias, it emphasized that future decisions would be highly data-dependent, particularly scrutinizing global economic trends, household spending, and conditions in labor and inflation.
In its accompanying statement, the RBA noted, "Some further tightening of monetary policy may be required to ensure that inflation returns to target in a reasonable timeframe."
RBA stated that the Australian economy is undergoing a period of "below-trend growth," a situation expected to persist. Unemployment rate is anticipated to rise gradually to around 4.5% by the end of next year. Recent data suggests that inflation will likely re-enter the 2-3% target range over the forecast horizon.
However, it cautioned that uncertainties abound, including the persistent nature of services price inflation observed overseas, which could manifest similarly in Australia. Other uncertainties revolve around the lag effects of monetary policy, labor market's response to slower economic growth, and behavior of firms in their pricing and wage-setting decisions.
It also expressed concerns about the household sector. Global uncertainties, particularly those related to the Chinese economy, were noted as an additional risk, given the ongoing stresses in China's property market.
China's Caixin PMI services fell to 51.8, waning economic momentum
China Caixin PMI Services for August fell to 51.8, down from 54.1 in July and below market expectations of 53.6. This marks the lowest reading in eight months. According to Caixin, the softer performance was due to a slower increase in business activity and new orders. While employment continued to rise, input cost inflation reached a six-month low.
Composite Output Index, which includes both manufacturing and services sectors, slightly decreased from 51.9 to 51.7. Though it still indicates expansion, the rate of growth was the slowest since January this year. A milder expansion in services sector was partially offset by a modest uptick in factory production.
Wang Zhe, Senior Economist at Caixin Insight Group, attributed the lackluster performance to seasonal fluctuations, extreme weather conditions like high temperatures and flooding, and a complicated global economic environment. These factors are further exacerbated by weak domestic demand.
Wang also warned of the long-term challenges facing the Chinese economy, stating, "Looking ahead, seasonal impacts will gradually subside, but the problems of insufficient domestic demand and weak expectations may form a vicious cycle for a protracted period of time." He added that given the uncertainty in external demand, downward pressure on the economy may continue to intensify.
Looking ahead
Eurozone PMI services final and PPI will be released in European session. UK will also publish PMI services final. Later in the day, US will release factory orders.
AUD/USD Daily Report
Daily Pivots: (S1) 0.6444; (P) 0.6463; (R1) 0.6480; More...
AUD/USD falls notably today but stays above 0.6363 short term bottom. Intraday bias remains neutral for now, and another recovery cannot be ruled out. But in that case, upside should be limited by 0.6615 resistance. On the downside, firm break of 0.6363 will resume larger fall from 0.7156 to 100% projection of 0.7156 to 0.6457 from 0.6894 at 0.6195.
In the bigger picture, current development argues that the down trend from 0.8006 (2021 high) is still in progress. Decisive break of 0.6169 will target 61.8% projection of 0.8006 to 0.6169 to 0.7156 at 0.6021. This will now remain the favored case as long as 0.6894, in case of strong rebound.
Economic Indicators Update
| GMT | Ccy | Events | Actual | Forecast | Previous | Revised |
|---|---|---|---|---|---|---|
| 23:01 | GBP | BRC Like-For-Like Retail Sales Y/Y Aug | 4.30% | 2.20% | 1.80% | |
| 01:30 | AUD | Current Account Balance (AUD) Q2 | 7.7B | 8.1B | 12.3B | 12.5B |
| 01:45 | CNY | Caixin Services PMI Aug | 51.8 | 53.6 | 54.1 | |
| 04:30 | AUD | RBA Interest Rate Decision | 4.10% | 4.10% | 4.10% | |
| 07:45 | EUR | Italy Services PMI Aug | 50.2 | 51.5 | ||
| 07:50 | EUR | France Services PMI Aug F | 46.7 | 46.7 | ||
| 07:55 | EUR | Germany Services PMI Aug F | 47.3 | 47.3 | ||
| 08:00 | EUR | Eurozone Services PMI Aug F | 48.3 | 48.3 | ||
| 08:30 | GBP | Services PMI Aug F | 48.7 | 48.7 | ||
| 09:00 | EUR | Eurozone PPI M/M Jul | -0.60% | -0.40% | ||
| 09:00 | EUR | Eurozone PPI Y/Y Jul | -7.60% | -3.40% | ||
| 14:00 | USD | Factory Orders M/M Jul | -2.50% | 2.30% |
RBA holds rates steady at 4.10%, maintains hawkish bias
RBA held its cash rate target unchanged at 4.10% in a widely expected move, offering additional time to evaluate impact of previous interest rate hikes and evolving economic outlook. Although the central bank maintained hawkish bias, it emphasized that future decisions would be highly data-dependent, particularly scrutinizing global economic trends, household spending, and conditions in labor and inflation.
In its accompanying statement, the RBA noted, "Some further tightening of monetary policy may be required to ensure that inflation returns to target in a reasonable timeframe."
RBA stated that the Australian economy is undergoing a period of "below-trend growth," a situation expected to persist. Unemployment rate is anticipated to rise gradually to around 4.5% by the end of next year. Recent data suggests that inflation will likely re-enter the 2-3% target range over the forecast horizon.
However, it cautioned that uncertainties abound, including the persistent nature of services price inflation observed overseas, which could manifest similarly in Australia. Other uncertainties revolve around the lag effects of monetary policy, labor market's response to slower economic growth, and behavior of firms in their pricing and wage-setting decisions.
It also expressed concerns about the household sector. Global uncertainties, particularly those related to the Chinese economy, were noted as an additional risk, given the ongoing stresses in China's property market.
(RBA) Statement by Philip Lowe, Governor: Monetary Policy Decision
At its meeting today, the Board decided to leave the cash rate target unchanged at 4.10 per cent and the interest rate paid on Exchange Settlement balances unchanged at 4.00 per cent.
Interest rates have been increased by 4 percentage points since May last year. The higher interest rates are working to establish a more sustainable balance between supply and demand in the economy and will continue to do so. In light of this and the uncertainty surrounding the economic outlook, the Board again decided to hold interest rates steady this month. This will provide further time to assess the impact of the increase in interest rates to date and the economic outlook.
Inflation in Australia has passed its peak and the monthly CPI indicator for July showed a further decline. But inflation is still too high and will remain so for some time yet. While goods price inflation has eased, the prices of many services are rising briskly. Rent inflation is also elevated. The central forecast is for CPI inflation to continue to decline and to be back within the 2–3 per cent target range in late 2025.
The Australian economy is experiencing a period of below-trend growth and this is expected to continue for a while. High inflation is weighing on people's real incomes and household consumption growth is weak, as is dwelling investment. Notwithstanding this, conditions in the labour market remain tight, although they have eased a little. Given that the economy and employment are forecast to grow below trend, the unemployment rate is expected to rise gradually to around 4½ per cent late next year. Wages growth has picked up over the past year but is still consistent with the inflation target, provided that productivity growth picks up.
Returning inflation to target within a reasonable timeframe remains the Board's priority. High inflation makes life difficult for everyone and damages the functioning of the economy. It erodes the value of savings, hurts household budgets, makes it harder for businesses to plan and invest, and worsens income inequality. And if high inflation were to become entrenched in people's expectations, it would be very costly to reduce later, involving even higher interest rates and a larger rise in unemployment. To date, medium-term inflation expectations have been consistent with the inflation target and it is important that this remains the case.
The recent data are consistent with inflation returning to the 2–3 per cent target range over the forecast horizon and with output and employment continuing to grow. Inflation is coming down, the labour market remains strong and the economy is operating at a high level of capacity utilisation, although growth has slowed.
There are significant uncertainties around the outlook. Services price inflation has been surprisingly persistent overseas and the same could occur in Australia. There are also uncertainties regarding the lags in the effect of monetary policy and how firms' pricing decisions and wages respond to the slower growth in the economy at a time when the labour market remains tight. The outlook for household consumption also remains uncertain, with many households experiencing a painful squeeze on their finances, while some are benefiting from rising housing prices, substantial savings buffers and higher interest income. And globally, there is increased uncertainty around the outlook for the Chinese economy due to ongoing stresses in the property market.
Some further tightening of monetary policy may be required to ensure that inflation returns to target in a reasonable timeframe, but that will continue to depend upon the data and the evolving assessment of risks. In making its decisions, the Board will continue to pay close attention to developments in the global economy, trends in household spending, and the outlook for inflation and the labour market. The Board remains resolute in its determination to return inflation to target and will do what is necessary to achieve that.
USDJPY Looking to Resume Higher in wave 5
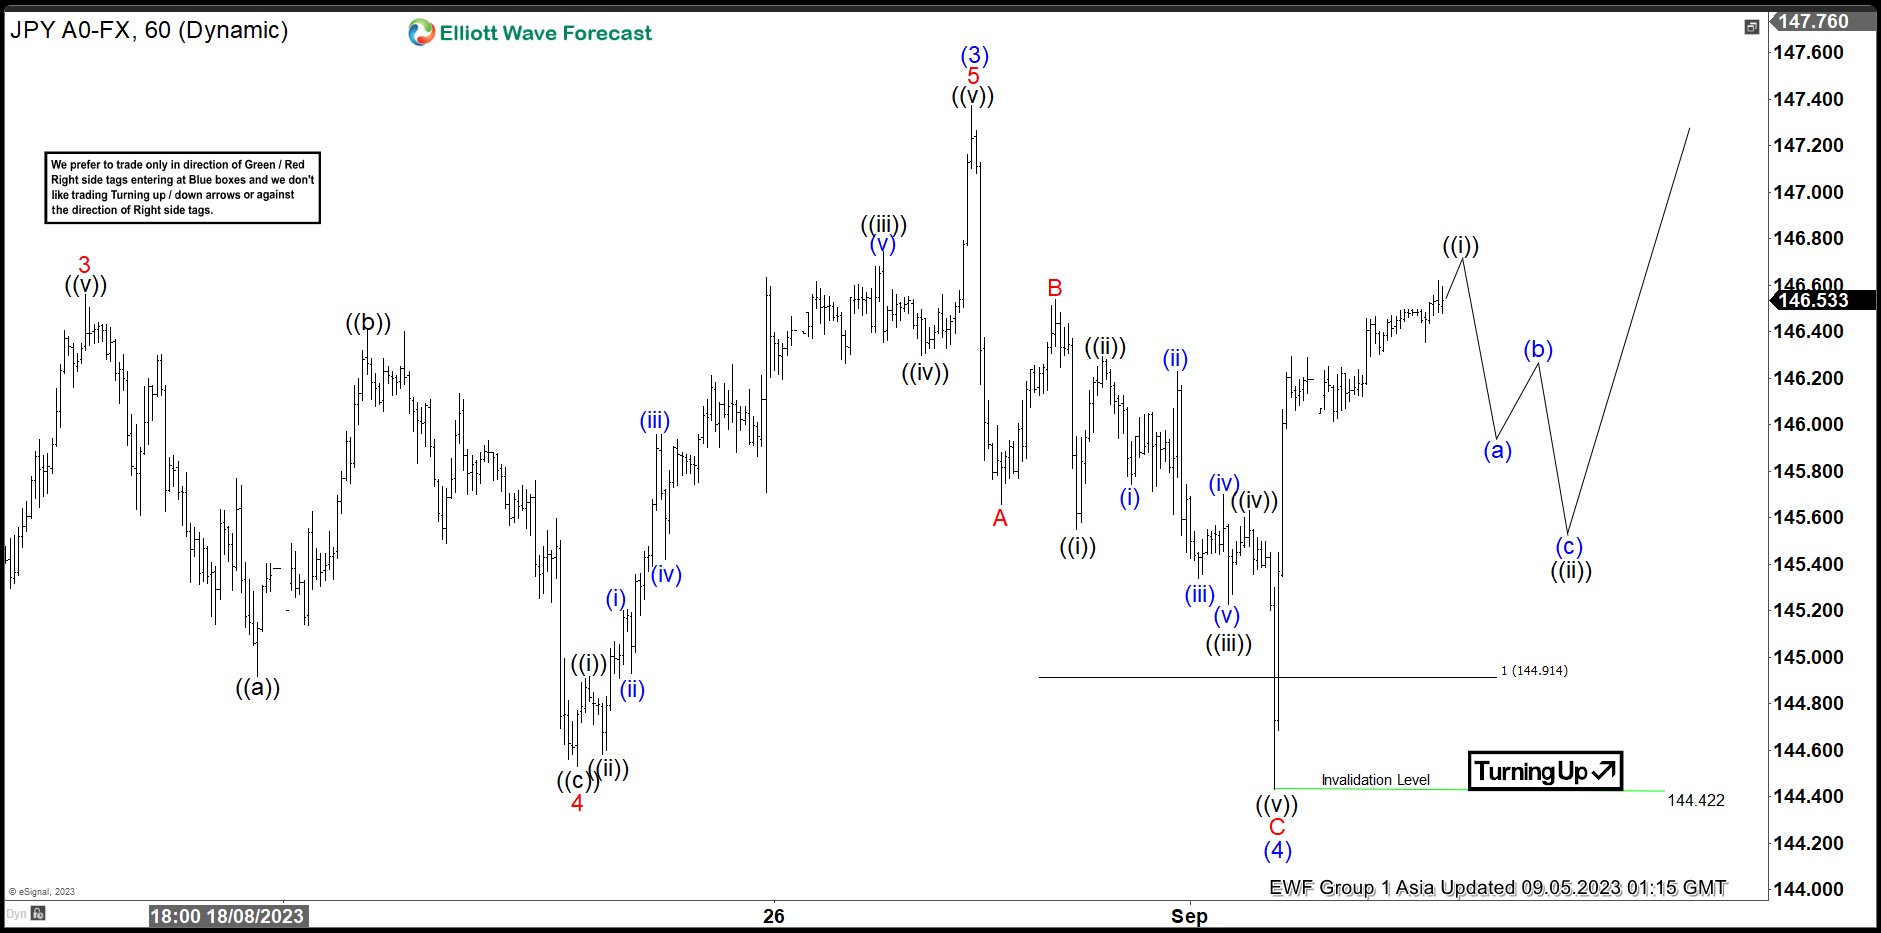
Short term view in USDJPY suggests the rally from 7.14.2023 low is unfolding as a 5 waves impulse Elliott Wave structure. Up from 7.14.2023 low, wave (1) ended at 141.95 and pullback in wave (2) ended at 138.05. Pair then extended higher in wave (3) towards 147.37 as the 1 hour chart below shows. It then pullback in wave (4) with internal subdivision as a zigzag structure. Down from wave (3), wave A ended at 145.65 and rally in wave B ended at 146.53. Pair then resumed lower in wave C towards 144.42 to complete wave (4).
Internal subdivision of wave C unfolded as a diagonal. Down from wave B, wave ((i)) ended at 145.54 and wave ((ii)) rally ended at 146.29. Pair resumed lower in wave ((iii)) towards 145.22, and rally in wave ((iv)) ended at 145.63. Last leg lower wave ((v)) ended at 144.42 which completed wave C of (4). Pair then resumes higher in wave (5), but it still needs to break above wave (3) to confirm the view. Up from wave (4), wave ((i)) is expected to end soon, then it should pullback in wave ((ii)) to correct cycle from 144.43 low in 3, 7, or 11 swing before it resumes higher again. Near term, as far as pivot at 144.42 low stays intact, expect pullback to find support in 3, 7, 11 swing for further upside.
USDJPY 60 Minutes Elliott Wave Chart
USDJPY Elliott Wave Video
https://www.youtube.com/watch?v=XeldX-85l3k
GBP/USD Holds Key Support But Upsides Could Be Limited
Key Highlights
- GBP/USD declined and traded close to the 1.2560 support.
- A major bearish trend line is forming with resistance near 1.2670 on the 4-hour chart.
- EUR/USD is still at risk of more downsides below 1.0750.
- Gold prices are correcting gains from the $1,950 resistance.
GBP/USD Technical Analysis
The British Pound failed near 1.2745 and declined again against the US Dollar. GBP/USD traded below the 1.2650 support zone to move into a bearish zone.
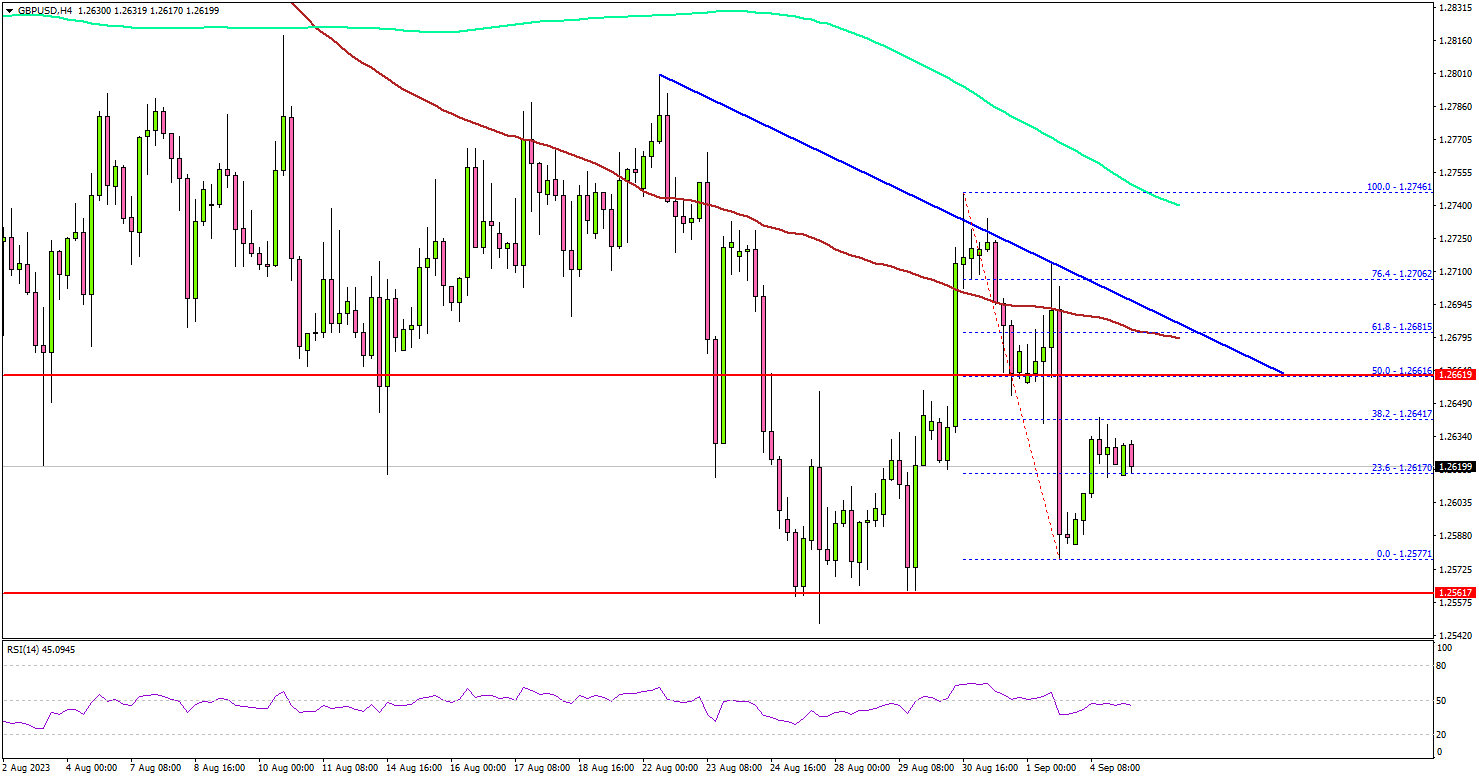
Looking at the 4-hour chart, the pair traded close to the 1.2560 support. It is now trading well below the 100 simple moving average (red, 4 hours) and the 200 simple moving average (green, 4 hours).
A low is formed near 1.2577 and the pair is now consolidating losses. On the upside, an initial resistance is near the 1.2650 level. The first major resistance is near the 1.2670 level. There is also a major bearish trend line forming with resistance near 1.2670 on the same chart.
A close above 1.2670 could start a decent increase. In the stated case, the pair could rise toward the 1.2720 level. Any more gains could send the pair toward the 1.2750 level.
If not, the pair might start a fresh decline below the 1.2580 support. The next key support is seen near the 1.2560 level. If there is a move below 1.2560, the pair could dive toward 1.2500. Any more losses might send the pair toward the 1.2450 level.
Looking at EUR/USD, the pair is still trading in a bearish zone and there could be a fresh decline below the 1.0750 level.
Economic Releases
- Germany’s Services PMI for August 2023 - Forecast 47.3, versus 47.3 previous.
- Euro Zone Services PMI for August 2023 – Forecast 48.3, versus 48.3 previous.
- UK Services PMI for August 2023 – Forecast 48.7, versus 48.7 previous.