Sample Category Title
USD/JPY Daily Outlook
Daily Pivots: (S1) 145.02; (P) 145.65; (R1) 146.86; More...
Intraday bias in USD/JPY remains neutral and more consolidations could be seen. On the upside, firm break of 137.36 will resume larger rally to retest 151.93 high. However, on the downside, firm break of 144.52 should confirm short term topping, and turn bias back to the downside for 55 D EMA (now at 143.18) and possibly below.
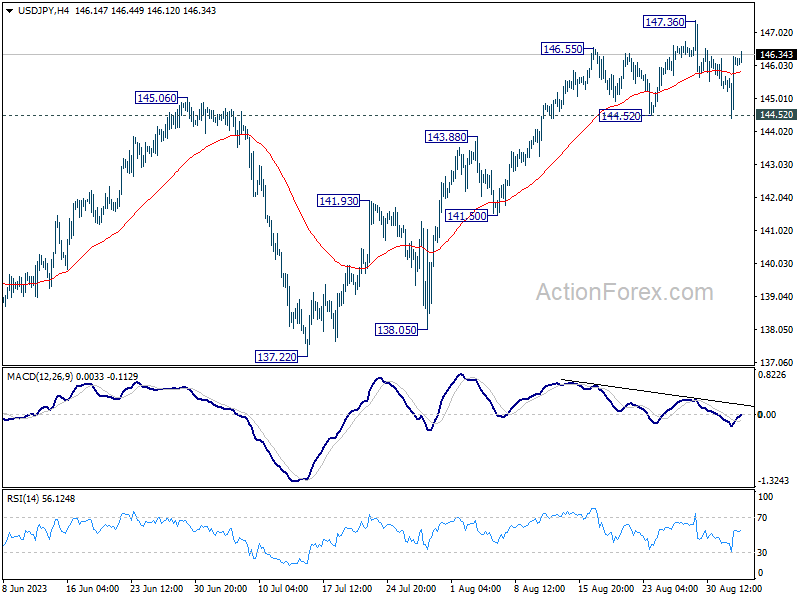
In the bigger picture, overall price actions from 151.93 (2022 high) are views as a corrective pattern. Rise from 127.20 is seen as the second leg of the pattern and could still be in progress. But even in case of extended rise, strong resistance should be seen from 151.93 to limit upside. Meanwhile, break of 137.22 support should confirm the start of the third leg to 127.20 (2023 low) and below.

USD/CAD Daily Outlook
Daily Pivots: (S1) 1.3517; (P) 1.3565; (R1) 1.3640; More....
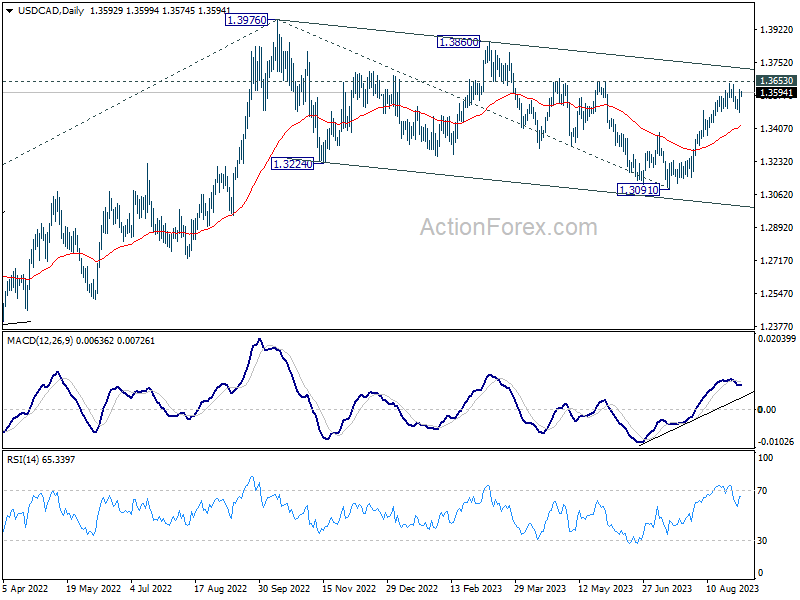
Intraday bias in USD/CAD remains neutral for the moment, and some more consolidations could be seen. On the upside, decisive break of 1.3653 resistance should confirm that correction from 1.3976 has completed, and target a test on this high. Meanwhile, below 1.3488 will bring another fall to 55 D EMA (now at 1.3421).
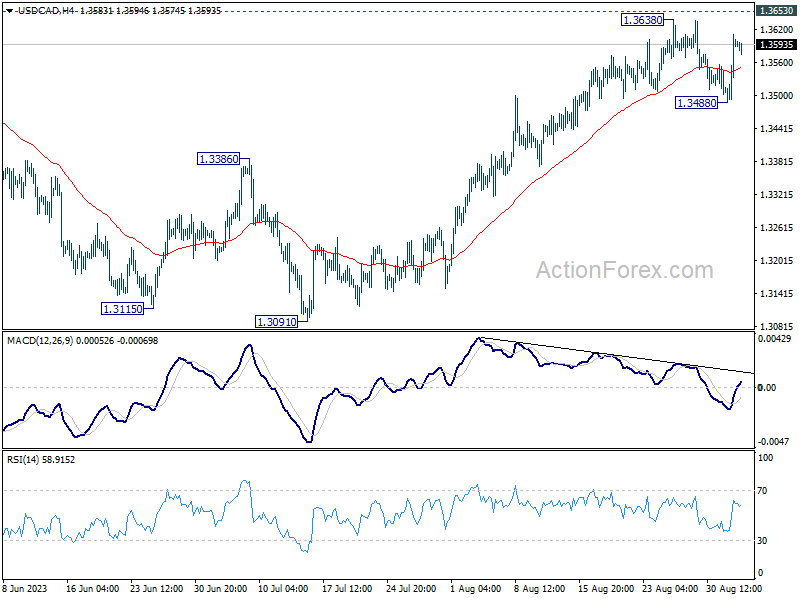
In the bigger picture, price actions from 1.3976 are viewed as a corrective pattern only. Upon completion, rise from 1.2005 (2021 low) would resume through 1.3976. Next target is 61.8% projection of 1.2005 to 1.3976 from 1.3091 at 1.4309. For now, this will remain the favored case as long as 55 D EMA (now at 1.3415) holds.
Death Crosses in ETH and BTC
Market picture
Crypto market capitalisation is almost the same level as a week ago – near 1.045 trillion. The Bitcoin pump and dump tickled the market with nerves, formally tied to events surrounding Grayscale’s Bitcoin ETF fund.
Bitcoin has been pegged at $26K for more than two weeks. An attempt to move back above the 200-day average has technically encountered stronger selling, confirming that the bears are not relinquishing market control. This disposition suggests higher risks that the consolidation will end with downside momentum, potentially at $25K or even $24K.
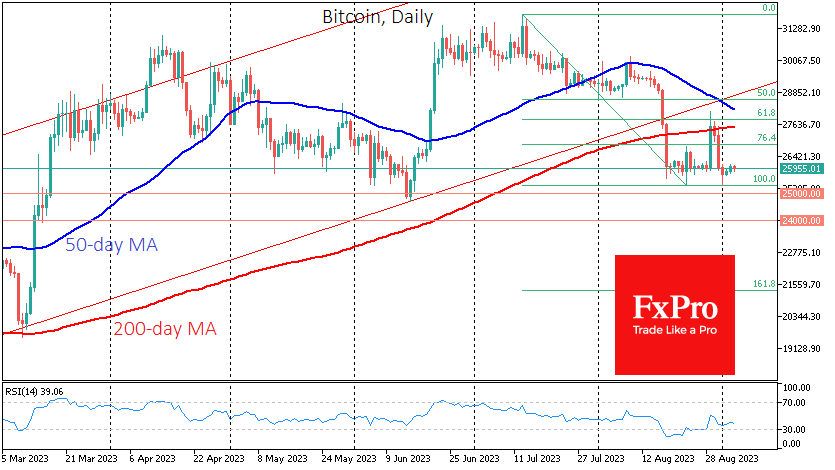
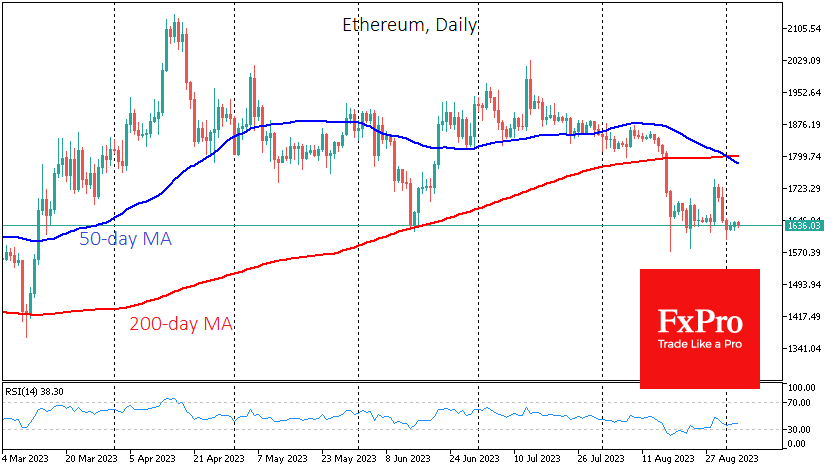
On Ethereum’s daily timeframes, a “death cross” has formed, with the 50-day moving average falling below the 200-day MA. Such a signal suggests a further decline, emphasising the bearish trend here. On the Bitcoin chart, such a pattern could form next week. But we also note that ETH already looks locally oversold.
Toncoin (TON) rose 26% over the week, taking the top spot for growth in the top 100 cryptocurrencies. The token soared to 11th place in CoinMarketCap’s capitalisation ranking. In August, the number of registered addresses in the project’s network exceeded 3.2 million.
News background
Throughout August, there was a slight but steady deviation of the USDT exchange rate from the US dollar, which is “a cause for concern,” Kaiko notes. Meanwhile, quotes from USDT’s competitors remained generally more stable.
Investment company Bitwise withdrew its application to launch an ETF based on a basket of bitcoin and Ethereum following the SEC’s decision to postpone its review of applications to launch spot bitcoin ETFs.
Former SEC head Jay Clayton said it was inevitable that the regulator would approve a spot bitcoin-ETF. He said the dichotomy between futures and spot products cannot continue forever.
A court in China has recognised cryptocurrency as legally protected property despite a ban on trading crypto assets in the country since 2017. Meanwhile, according to The Wall Street Journal, China accounts for a fifth of Binance’s trading volume.
According to a report by crypto exchange KuCoin, 52% of Turkish residents aged 18 to 60 are investing in cryptocurrencies amid high inflation in the country. The figure has grown by 12% over the past 1.5 years.
EURUSD Falls Below 200-Day SMA, Fresh Lows in Sight
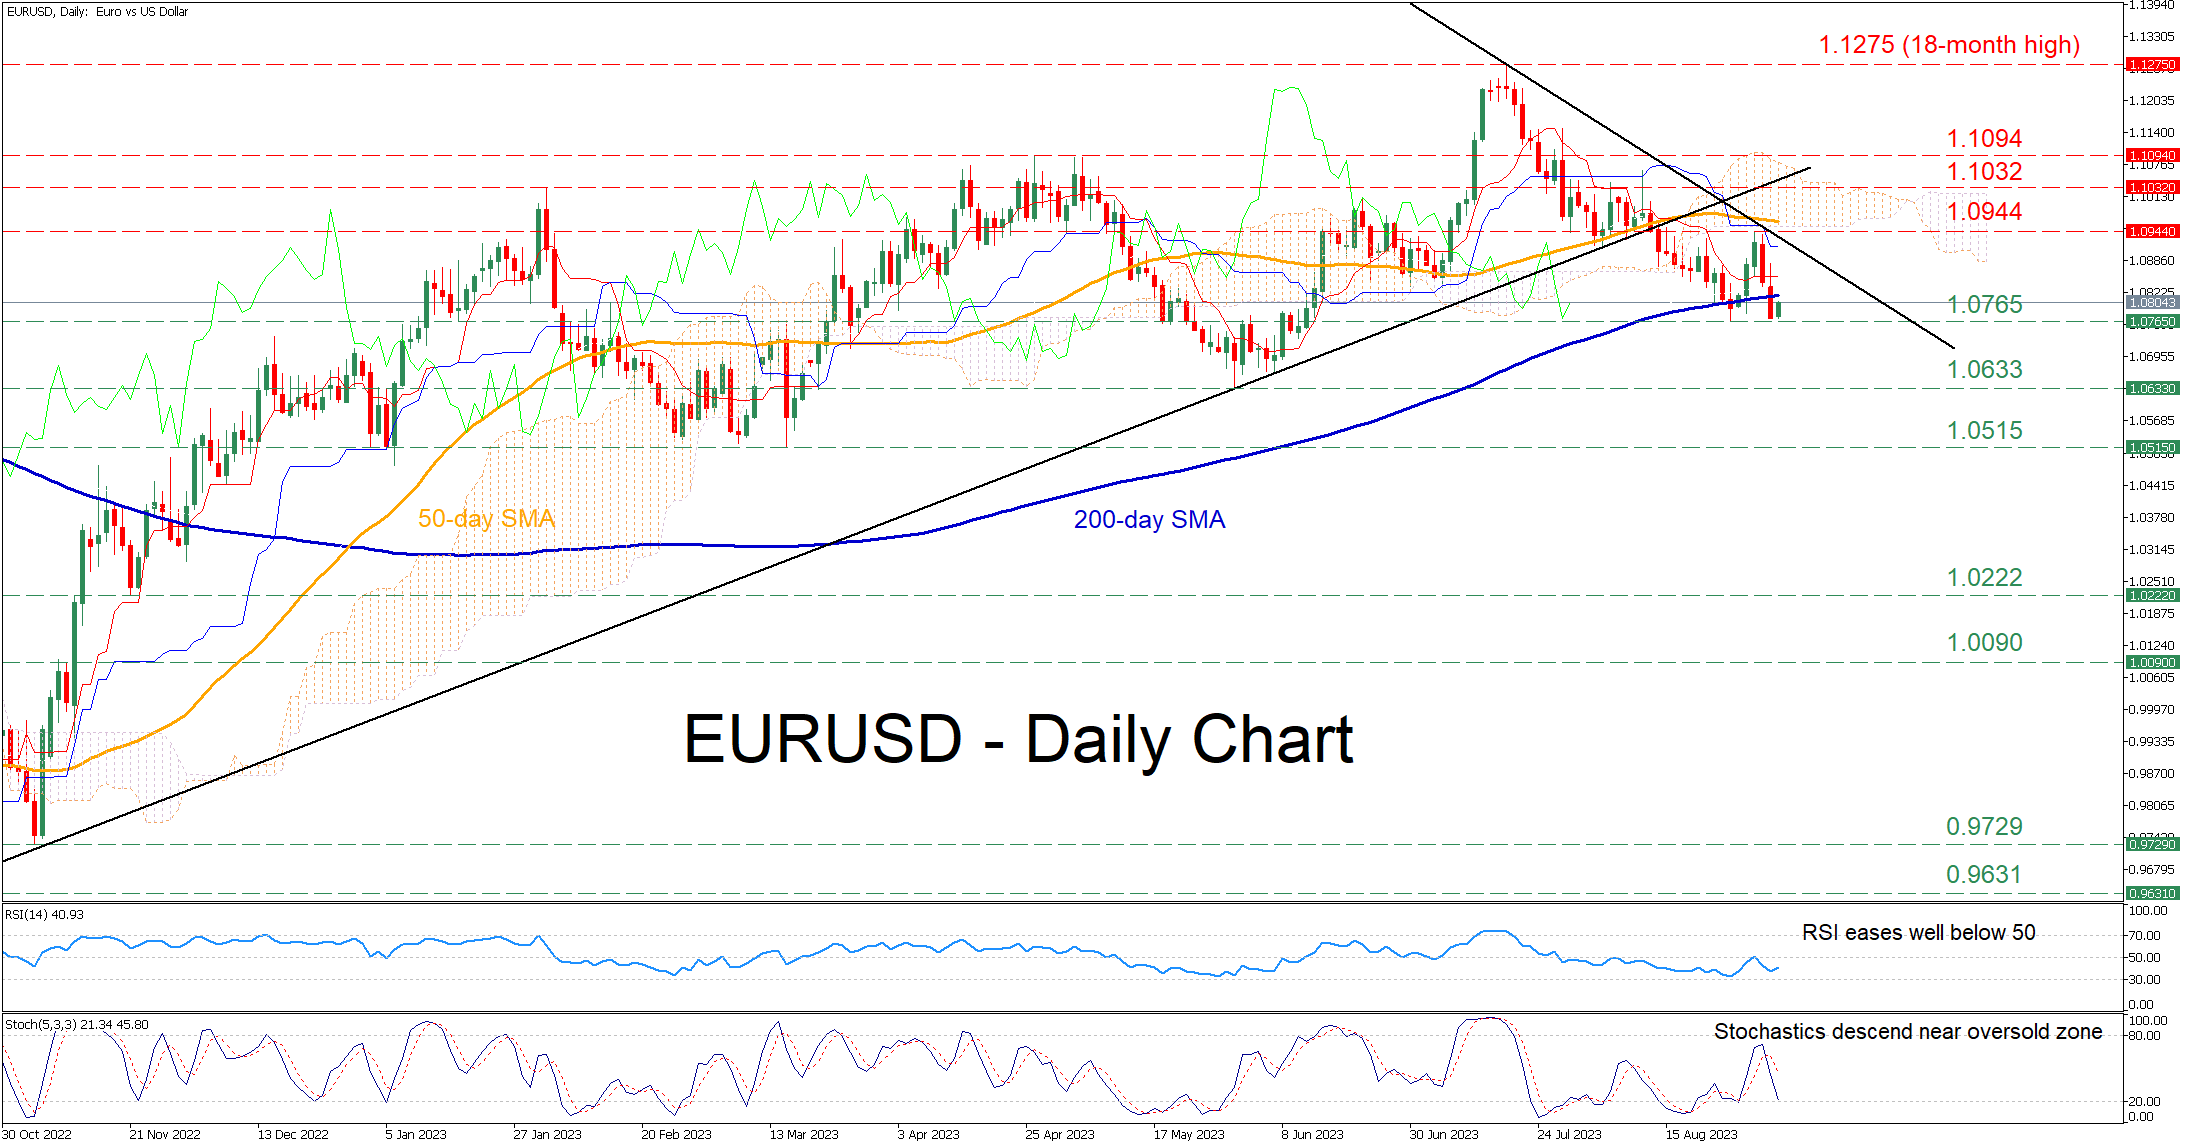
EURUSD has been in a steady decline after peaking at the 18-month high of 1.1275 on July 18, generating a series of lower highs and lower lows. Besides that, the pair has dived beneath its 200-day simple moving average (SMA), which is further deteriorating the technical outlook.
The momentum indicators currently suggest that the bearish forces are in control. Specifically, the RSI is hovering well below its 50-neutral threshold, while the stochastics are descending close to their 20-oversold mark.
Should the decline below the 200-day SMA extend, the recent support of 1.0765 could act as the first line of defense. A break beneath that region could open the door for fresh lows, where the May bottom of 1.0633 might curb further declines. Failing to halt there, the price may move lower to challenge the March bottom of 1.0515.
Alternatively, if the pair reverses back higher, the bulls could attack the recent resistance of 1.0944, which overlaps with the lower boundary of the Ichimoku cloud. Violating that territory, the price may face the February high of 1.1032. Should that hurdle also fail to provide resistance, the spotlight could turn to 1.1094, which held strong three times in April.
In brief, EURUSD seems to be stuck in a downtrend as the bulls continue to stay on the sidelines. For that bearish sentiment to alter, the pair needs to reclaim the 200-day SMA.
AUD/USD Daily Report
Daily Pivots: (S1) 0.6420; (P) 0.6471; (R1) 0.6503; More...
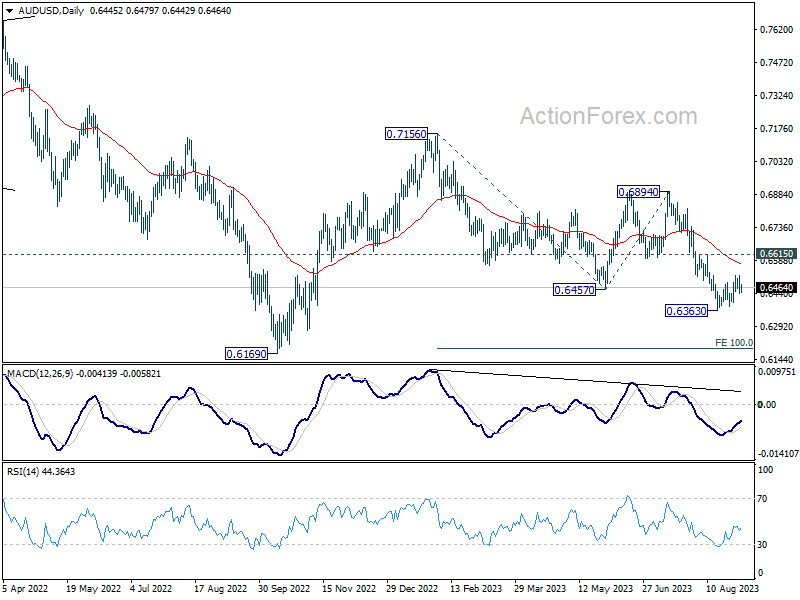
AUD/USD recovers mildly today but stays in the consolidation pattern from 0.6363. Outlook is unchanged and intraday bias stays neutral. In case of another recovery, upside should be limited by 0.6615 resistance. Break of 0.6363 will resume larger fall from 0.7156 to 100% projection of 0.7156 to 0.6457 from 0.6894 at 0.6195.
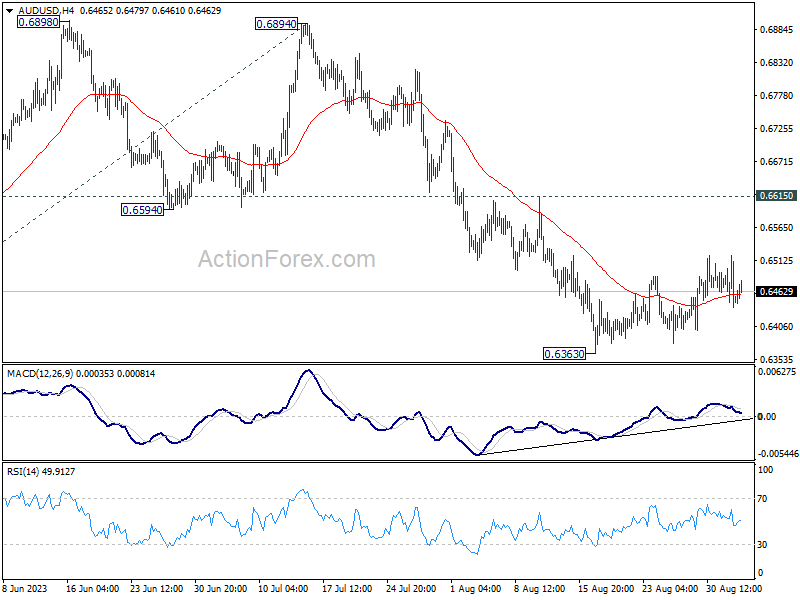
In the bigger picture, current development argues that the down trend from 0.8006 (2021 high) is still in progress. Decisive break of 0.6169 will target 61.8% projection of 0.8006 to 0.6169 to 0.7156 at 0.6021. This will now remain the favored case as long as 0.6894, in case of strong rebound.
Yen and Dollar Weaken as China’s Property Sector News Lifts Sentiment
Japanese Yen and Dollar are experiencing broad declines today, as rebound in Chinese and Hong Kong stocks that buoyed overall market sentiment. The mood lifted on news that Country Garden, a troubled Chinese property giant, has secured an extension for a critical debt payment deadline, effectively avoiding default. Reports suggest that the company's Chinese creditors have agreed to a repayment plan stretched over the next three years.
While Yen and Dollar falter, Sterling has emerged as today's top performer in the currency market, outperforming Australian Dollar and Euro. The strong showing by Sterling could indicate that individual currency dynamics are also impacting forex market movements, in addition to the broader uplift in sentiment around China's economic conditions.
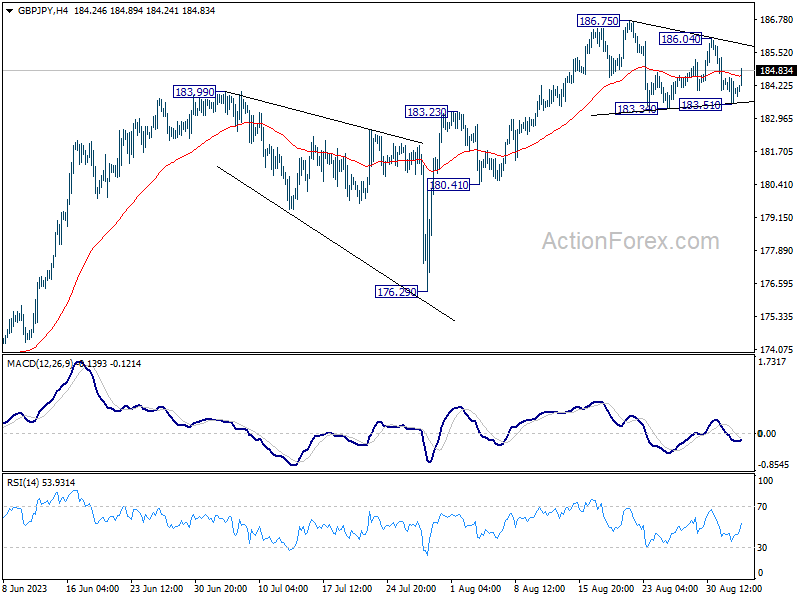
Technically, GBP/JPY's rebound today keeps recent price actions from 186.75 short term top as a sideway corrective pattern, probably in form of triangle. In other words, larger up trend is expected to resume after this consolidation completes. Break of 186.04 resistance will be the first sign that GBP/JPY is ready to rise through 186.75 high.
In Asia, Nikkei closed up 0.70%. Hong Kong HSI is up 2.39%. China Shanghai SSE is up 1.40%. Singapore Strait Times is up 0.28%. Japan 10-year JGB yield rose 0.0141 to 0.646.
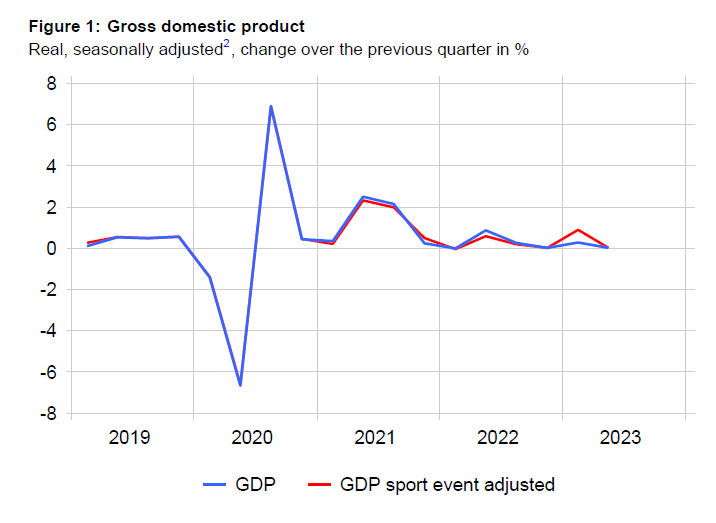
Swiss Q2 GDP stagnates as manufacturing slumps
Switzerland's GDP growth for Q2 came in flat at 0.0% qoq, missing the modest expectation of a 0.1% qoq growth. While this paints a grim picture, particularly for manufacturing and construction sectors, certain segments like trade and accommodation services displayed resilience, leaving a mixed bag of results for economists and investors to sift through.
The manufacturing sector contracted sharply by -2.9% qoq, weighed down significantly by a decline in the chemical and pharmaceutical industry, which shrank by -2.3%. Mechanical engineering and metal construction also faced headwinds, reflecting the sector's sensitivity to challenging international conditions. Furthermore, the construction sector didn't fare well either, contracting by -0.7% qoq.
On a brighter note, both private and government consumption showed marginal growth at 0.4% and 0.1% qoq, respectively. These figures indicate that domestic demand remains somewhat steady, offering a counterbalance to the weaknesses observed in production sectors.
Equipment and software investment plunged by -3.7% qoq, while exports of goods fell by -1.2% qoq. However, export of services saw a rise of 2.6% qoq, and imports of goods and services contracted by -3.7%, making a net positive contribution to GDP.
New Zealand goods terms of trade rose 0.4% in Q2
In Q2 2023, New Zealand's goods terms of trade rose by a 0.4%, much better than expectation of -1.3% decline. Both export and import prices for goods witnessed a dip, falling -0.6% and -1.0% respectively. Export volumes surged 6.8%, while import volumes declined by -2.8%, suggesting robust external demand and potentially cautious domestic consumption.
The services sector terms of trade rose significantly by 4.4%, a robust figure indeed. Export prices for services edged up 0.3%, whereas import prices saw a more considerable decline of -3.9%.
Alasdair Allen, international trade manager, highlighted that New Zealand typically enjoys a trade surplus with China, increasingly driven by trade in goods. The trade surplus for Q2 stood at a NZD 2.0B, with total goods and services exports to China valued at NZD 5.8B, and imports at NZD 3.8B. Notably, there have been only three quarterly goods deficits with China over the past five years.
RBA and BoC to hold, US ISM services and China data featured
This week, much attention will be on RBA and BoC, both of which are expected to leave their key interest rates unchanged.
Consumer inflation in Australia eased to 4.9% in July, prompting economists to largely anticipate that RBA will maintain its official cash rate at 4.10% in its Tuesday meeting. However, there is no consensus on the road ahead. Major local banks present a divided front: ANZ, CBA, and Westpac expect the rate to remain static until at least the end of 2023. In contrast, NAB projects another 25 bps hike to 4.35% come November. A recent Reuters poll further substantiates this division, with 21 of 35 respondents anticipating another hike by the year's end, while the remaining expect rates to hold steady.
Similarly, BoC is predicted to keep its key interest rate at 5.00% when it meets on Wednesday, after two consecutive 25 bps hikes in its previous meetings. A Reuters poll saw 31 out of 34 economists forecasting a rate hold this month. Going forward, only a minority of respondents—8 out of 34—foresee one more hike to 5.25% by year-end. In addition to the rate decision, Canadian job data will also be under the microscope.
Markets will also be closely tracking other major economic indicators, including Fed's Beige Book report and US ISM services data. From China, Caixin PMI services and trade balance reports are on the watchlist.
Here are some highlights for the week:
- Monday: New Zealand terms of trade; Japan monetary base; Germany trade balance; Swiss GDP; Eurozone Sentix investor confidence.
- Tuesday: Japan household spending; Australia current account, RBA rate decision; China Caixin PMI services; Eurozone PMI services final, PPI; UK PMI services final; US factory orders.
- Wednesday: Australia GDP; Germany factory orders; UK PMI construction; Eurozone retail sales; Canada labor productivity, BoC rate decision, trade balance; US trade balance, ISM services, Fed's Beige Book.
- Thursday: New Zealand manufacturing sales; Japan leading indicators; Swiss unemployment rate; Germany industrial production, foreign currency reserves; France trade balance; Eurozone GDP revision; Canada building permits, Ivey PMI; US jobless claims.
- Friday: Japan average cash earnings, GDP final; Germany GDP final; France industrial production; Canada employment.
AUD/USD Daily Report
Daily Pivots: (S1) 0.6420; (P) 0.6471; (R1) 0.6503; More...
AUD/USD recovers mildly today but stays in the consolidation pattern from 0.6363. Outlook is unchanged and intraday bias stays neutral. In case of another recovery, upside should be limited by 0.6615 resistance. Break of 0.6363 will resume larger fall from 0.7156 to 100% projection of 0.7156 to 0.6457 from 0.6894 at 0.6195.
In the bigger picture, current development argues that the down trend from 0.8006 (2021 high) is still in progress. Decisive break of 0.6169 will target 61.8% projection of 0.8006 to 0.6169 to 0.7156 at 0.6021. This will now remain the favored case as long as 0.6894, in case of strong rebound.
Economic Indicators Update
| GMT | Ccy | Events | Actual | Forecast | Previous | Revised |
|---|---|---|---|---|---|---|
| 22:45 | NZD | Terms of Trade Index Q2 | 0.40% | -1.30% | -1.50% | |
| 23:50 | JPY | Monetary Base Y/Y Aug | 1.20% | -0.70% | -1.30% | |
| 01:00 | AUD | TD Securities Inflation M/M Aug | 0.20% | 0.80% | ||
| 06:00 | EUR | Germany Trade Balance (EUR) Jul | 15.9B | 17.6B | 18.7B | |
| 07:00 | CHF | GDP Q/Q Q2 | 0.00% | 0.10% | 0.30% | |
| 08:30 | EUR | Eurozone Sentix Investor Confidence Sep | -19.6 | -18.9 |
GBP/USD and EUR/GBP Show Signs of Weakness
GBP/USD failed to climb above 1.2750 and trimmed all gains. EUR/GBP is declining and trading below the 0.8580 pivot level.
Important Takeaways for GBP/USD and EUR/GBP Analysis Today
- The British Pound is attempting a fresh increase from 1.2580.
- There is a key bearish trend line forming with resistance near 1.2655 on the hourly chart of GBP/USD at FXOpen.
- EUR/GBP is declining and showing bearish signs below 0.8580.
- There is a major bearish trend line forming with resistance near 0.8560 on the hourly chart at FXOpen.
GBP/USD Technical Analysis
On the hourly chart of GBP/USD at FXOpen, the pair started a fresh decline from the 1.2745 zone. As mentioned in the previous analysis, the British Pound struggled to recover and declined below the 1.2655 support level against the US Dollar.
The pair even tested the 1.2580 support zone. A low was formed near 1.2577 and the pair is now attempting a fresh increase. There was a move above the 1.2600 zone and it is now testing the 23.6% Fib retracement level of the downward move from the 1.2702 swing high to the 1.2577 low.
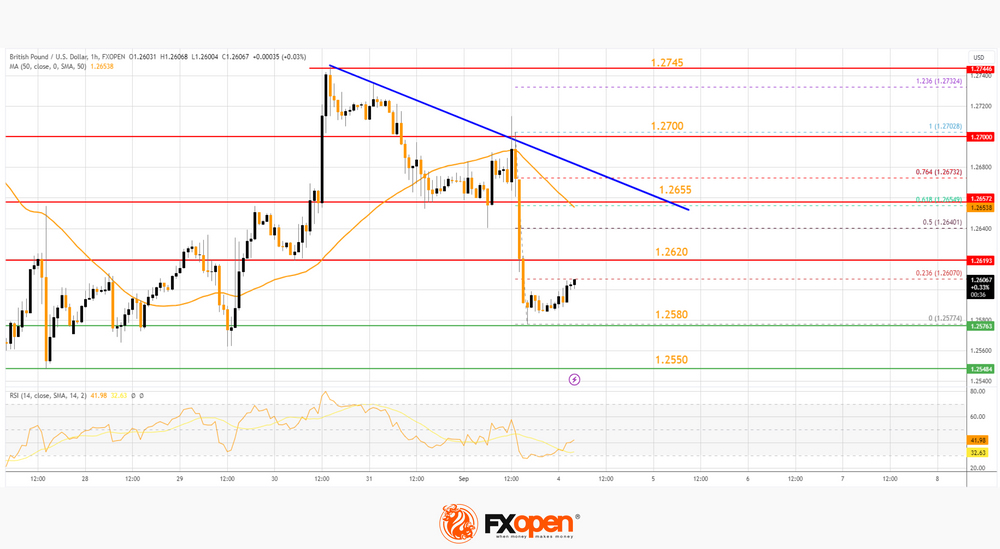
On the upside, the GBP/USD chart indicates that the pair is facing resistance near 1.2620. The next major resistance is near a bearish trend line at 1.2655 and the 50-hour simple moving average.
The trend line is close to the 61.8% Fib retracement level of the downward move from the 1.2702 swing high to the 1.2577 low. A close above the 1.2655 resistance zone could open the doors for a move toward 1.2700.
Any more gains might send it toward 1.2745. If not, the pair could resume its decline below 1.2600. On the downside, there is a key support forming near 1.2580.
If there is a downside break below the 1.2580 support, the pair could accelerate lower. The next major support is near the 1.2550 zone, below which the pair could test 1.2500. Any more losses could lead the pair toward the 1.2450 support.
EUR/GBP Technical Analysis
On the hourly chart of EUR/GBP at FXOpen, the pair struggled to gain pace for a move above 0.8600. The Euro traded formed a top near 0.8610 and started a fresh decline against the British Pound.
There was a clear move below the 0.8580 pivot level. The EUR/GBP chart suggests that the pair settled below the 50-hour simple moving average and 0.8560. A low is formed near 0.8547 and the pair is now consolidating losses.
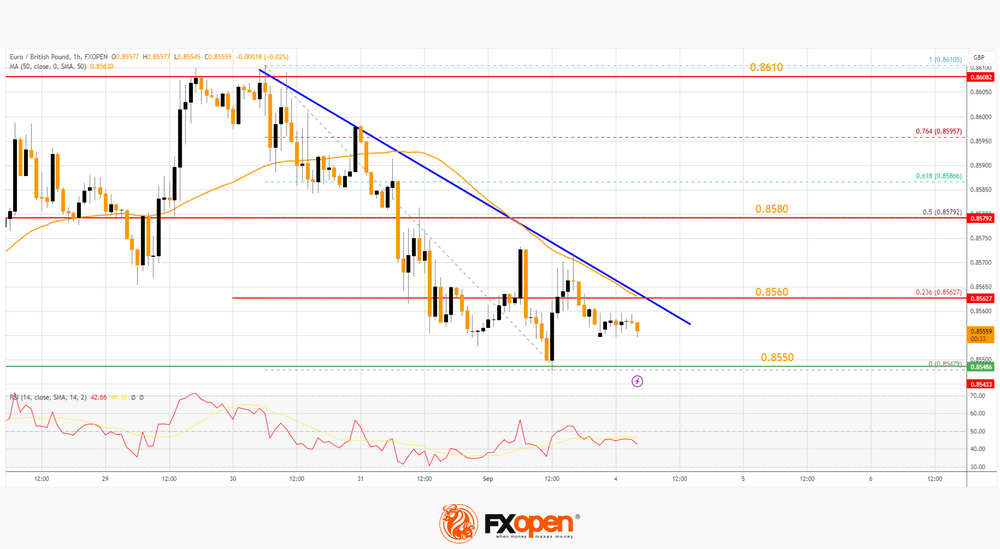
Immediate resistance is near a major bearish trend line at 0.8560. It coincides with the 50-hour simple moving average and the 23.6% Fib retracement level of the downward move from the 0.8610 swing high to the 0.8547 low.
The next major resistance could be near the 50% Fib retracement level of the downward move from the 0.8610 swing high to the 0.8547 low at 0.8580.
A close above the 0.8580 level might accelerate gains. In the stated case, the bulls may perhaps aim for a test of 0.8600. Any more gains might send the pair toward the 0.8650 level.
Immediate support sits near 0.8550. The next major support is near 0.8525. A downside break below the 0.8525 support might call for more downsides. In the stated case, the pair could drop toward the 0.8465 support level.
This article represents the opinion of the Companies operating under the FXOpen brand only. It is not to be construed as an offer, solicitation, or recommendation with respect to products and services provided by the Companies operating under the FXOpen brand, nor is it to be considered financial advice.
EUR/USD Remains at Risk of Losing Trend Channel
Markets
Friday’s payrolls report initially added to market conviction of the Fed’s tightening cycle having come to an end already. The labour market is indeed showing signs of normalizing but is it going fast enough? Second thoughts crept in, with the US manufacturing ISM published a little later adding to the doubt. The interest rate-sensitive sector is still facing contraction but continues to bottom out nevertheless. The headline figure rose from 46.4 to a higherthan-expected 47.6. New orders snapped a two-month recovery (46.8) but employment jumped 4 points to 48.5. Prices paid sharply rose too, from 42.6 to 48.4, suggesting a cautious return of price pressures. US yields extended their intraday comeback, resulting in changes between +1.6 bps (2-y) and +8.2 bps (30-y). German yields followed their US peers, adding 1.2 to 9.1 bps in similar curve steepening. The dollar rebounded. EUR/USD lost the 200dMA to close at the lower bound of the 2023 upward sloping trend channel just south of 1.08 (1.078). DXY (trade-weighted dollar) rallied from an intraday low of 103.27 to 104.23 – the highest close since end May. USD/JPY surged, in first instance back above 145, then 146. Sterling barely budged against the euro but dipped towards the recent lows against USD (GBP/USD closed at 1.259). Stock markets showed little direction. They ended slightly lower in Europe while eking out small gains in the US. Asian-Pacific shares are better bid this morning. Hong Kong and China outperform. The string of economic measures announced in the past two weeks is bolstering investor confidence. Regional benchmarks add 1-2.4%. This risk on environment weighs the dollar down a bit. EUR/USD stabilizes around Friday’s closing levels, DXY loses very marginally to 104.13. US cash bond markets are closed for Labour Day today, but futures are trending south. German Bunds underperform in early European trading. Belgian ECB governor Wunsch over the weekend said rates may have to be hiked once more (see below).
It’s going to be a slow start of the week in absence of US investors and an uninspiring economic calendar. Speeches from ECB’s Nagel and Lagarde are worth mentioning but aren’t due until late afternoon trading hours. German yields ready for a higher open. The 10-y yield could test the recently lost support-turned-into-resistance around 2.58%/2.60%. Overall risk sentiment is probably the key factor for currency markets. Despite a slightly weaker USD this morning, EUR/USD remains at risk of losing the trend channel. We are looking at 1.0735 first in case of a break today. That said, we wouldn’t draw too many technical conclusions from it before it gets confirmed. Attention later this week shifts to the ECB’s consumer inflation expectations survey and the RBA (tomorrow) & the US services ISM, the Bank of Canada and BoE governor Bailey’s parliamentary testimony on Wednesday.
News and views
Rating agency Moody’s on Friday affirmed the Hungarian sovereign credit rating at Baa2 with a stable outlook. According to the agency, the assessment is balancing credit strengths and challenges. Moody’s sees a solid medium term growth outlook. Hungarian fiscal strength is seen as robust with a moderately high debt burden. The agency sees weaknesses at the institutional level which have been the cause of the contentious relationship with the EU and Hungary’s main credit challenge. It causes uncertainty about the disbursement of significant amounts of EU funds. The stable outlook reflects the agency’s view that risks to the country’s credit profile are balanced. Moody’s expects the country’s debt burden to continue on its downward trajectory and that it ultimately will receive most EU funds, albeit in a noisy step-by-step process. Moody’s expects a solid trend growth estimated at 3% over 2018- 2027. This year, growth is stagnating, before rebounding to 3% in 2024. The fiscal deficit is projected at 4.2% of GDP in 2023 and 3.5% in 2024 compared to 6.2% in 2022. Moody’s estimates that the combination of strong nominal GDP growth and a smaller fiscal deficit will result a the debt to GDP ratio of 67.8% in 2024. Inflation is set to ease to single digits end 2023 and at 3.4% at the end of 2024.
In an interview with the Belgian Public radio, ECB governing Council member Wunsch indicated that the ECB might have to raise rates interest rates a bit more before coming to a pause. According to the governor of the Belgian National Bank, it’s too soon to talk about a real stop in the hiking cycle as inflation remains very persistent. Wunch sees price pressures decreasing, but it won’t reach the 2% target before 2025.
Swiss Q2 GDP stagnates as manufacturing slumps
Switzerland's GDP growth for Q2 came in flat at 0.0% qoq, missing the modest expectation of a 0.1% qoq growth. While this paints a grim picture, particularly for manufacturing and construction sectors, certain segments like trade and accommodation services displayed resilience, leaving a mixed bag of results for economists and investors to sift through.
The manufacturing sector contracted sharply by -2.9% qoq, weighed down significantly by a decline in the chemical and pharmaceutical industry, which shrank by -2.3%. Mechanical engineering and metal construction also faced headwinds, reflecting the sector's sensitivity to challenging international conditions. Furthermore, the construction sector didn't fare well either, contracting by -0.7% qoq.
On a brighter note, both private and government consumption showed marginal growth at 0.4% and 0.1% qoq, respectively. These figures indicate that domestic demand remains somewhat steady, offering a counterbalance to the weaknesses observed in production sectors.
Equipment and software investment plunged by -3.7% qoq, while exports of goods fell by -1.2% qoq. However, export of services saw a rise of 2.6% qoq, and imports of goods and services contracted by -3.7%, making a net positive contribution to GDP.
EUR/USD Resumes Downtrend after US NFP and ISM manufacturing PMI Data
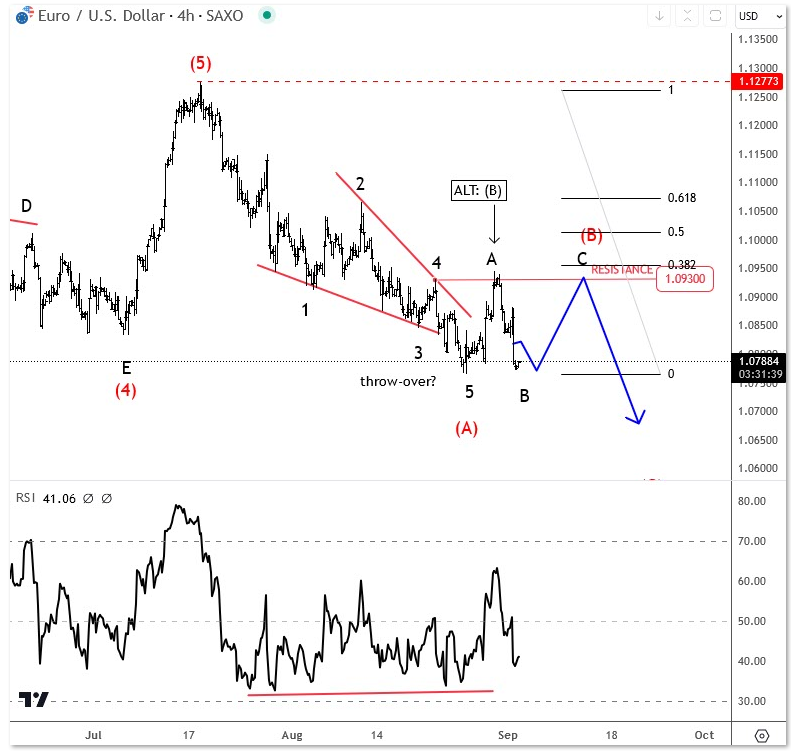
EURUSD is coming down after a rally back to 1.0930 resistance after a completed leading diagonal in wave (A). Well, pair turned back to the lows after latest US NFP report so it seems that euro will stay bearish, either straight from here down for wave (C) to around 1.06, or there can still be a flat int wave (B) if suddenly price will turn up for 1.0930 again. In either case, we think that a corrective pullback from summer highs is still underway and that euro will retest lower levels. When looking at the daily chart, big supports are at 1.06 and 1.05 from where a higher degree uptrend may resume.