

Sample Category Title
Soft US Jobs Data, Further China Stimulus Fuel Appetite
Last week ended on a positive note, and this week started with a solid risk appetite, as the US jobs data hinted at a finally loosening jobs market, while Chinese stocks rallied on further measures deployed by the Chinese government to support the country’s faltering property market. In fact, the latest news suggests that more than 1800 new homes were sold in Beijing on Saturday alone after the government eased mortgage rules last week (vs. around 3100 homes were sold in Beijing during the entire August). The Hang Seng index jumped more than 3% this Monday before paring gains.
In the US, Friday’s jobs data was good, in terms of Federal Reserve (Fed) expectations. The US economy added 187K new nonfarm jobs last month, above expectations, but the unemployment rate ticked higher to 3.8% as the participation rate rose. The wages growth fell from 4.4% to 4.3% in August. The US 2-year yield, which is the most sensitive to changes in Fed expectations, tipped a toe below the 4.80% level, as investors took the opportunity to increase their bets that the Fed is certainly done with its rate hikes this cycle. Activity on Fed funds futures gives around 93% chance for another skip at the September meeting, and the probability of a pause in November has almost jumped to two thirds. The S&P500 recorded its best week since June, and rebounded to the highest level in a month, while Nasdaq 100 ended last week a few points below the 15500 level, and with trend and momentum indicators pointing at further strength.
Today, the US and Canada will be closed, but Europe is open for business and even though the week starts with a favourable risk appetite, there is nothing in the latest economic data to make the European investors cheer. Released last Friday, the euro area manufacturing PMI came in lower than expected, and posted the 14th consecutive month of contraction as the energy crisis continued taking a toll on activity in the old continent. Released earlier last week, the latest inflation estimate for the Eurozone showed that inflation in the euro-area stagnated, instead of easing further. In summary, activity is slowing but inflation is not - due to still too high energy prices, and that’s bad for the European Central Bank (ECB). There are now rising voices that the ECB won’t hike rates when it meets this month, although it’s hard to imagine Christine Lagarde announce a pause while weakness in economic activity isn’t yet reflected in price dynamics, and the European jobs market remains relatively strong.
US crude hits $86pb
The barrel of US crude traded past $86pb, as oil bulls continued buying the tight supply narrative from OPEC+. But looking at the crude’s impressive rally since the 24th of August dip, and taking into account that the RSI index now warns that oil has stepped into the overbought market conditions, we shall see a minor correction in oil prices this week, before an eventual push toward the $89/90pb area.
Elsewhere, the European nat gas futures remain highly volatile due to strikes in Australia. Hundreds of Chevron workers will be going on a strike on September 7. Strikes cause decent positive pressure and a lot of volatility in TTF futures. But the European nat gas reserves are full by around 90% and there is no particular urge for the European to rush to nat gas at the current prices. Therefore, the price rallies on strike news remain interesting short-term trade opportunities for top sellers.
Technical Outlook and Review
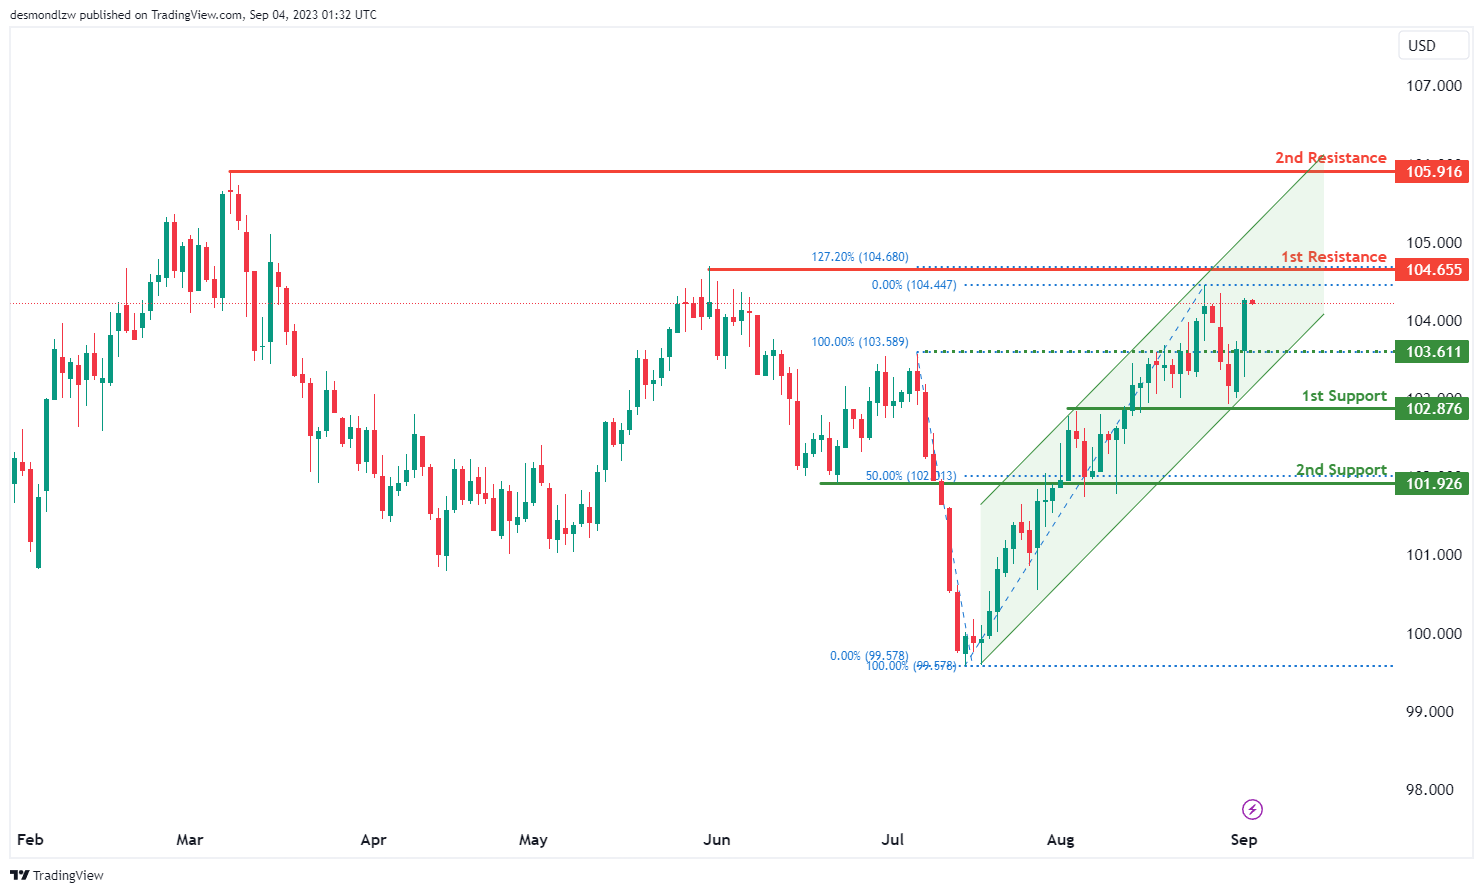
DXY:
The DXY chart is currently showing a bullish overall momentum, suggesting an upward trend in the price movement. This bullish sentiment is reinforced by the fact that the price is within a bullish ascending channel, indicating a potential continuation of the upward trajectory.
The 1st support level at 102.87 is identified as an overlap support, indicating that historical price action has found support around this level. It serves as a foundation for potential upward movements.
The 2nd support level at 101.92 is also marked as an overlap support and aligns with the 50% Fibonacci Retracement level. This confluence of support factors adds to its significance, potentially strengthening its role as a support zone.
On the resistance side, the 1st resistance level at 104.65 is noted as a swing high resistance, suggesting that historical price action has faced resistance at this level in the past. Traders often pay close attention to these levels for potential reversal or continuation patterns.
The 2nd resistance level at 105.91 is also identified as a swing high resistance, further confirming its potential significance as a barrier for upward price movement.
Additionally, an intermediate support level at 103.61 is recognized as a pullback support, indicating a level where the price could potentially find support during a pullback.
EUR/USD:
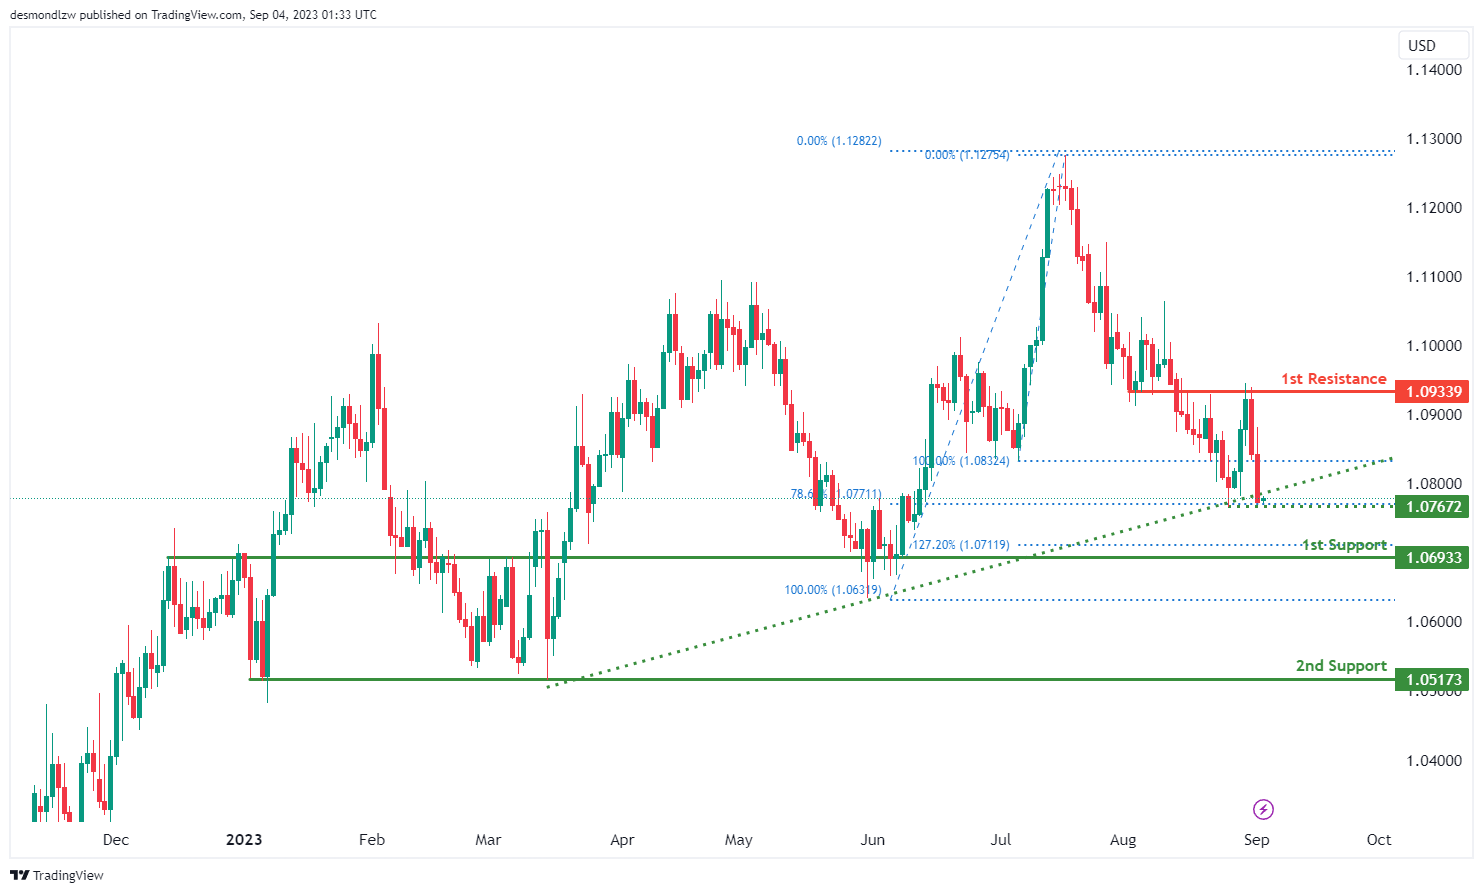
The EUR/USD chart is currently demonstrating a bullish overall momentum, implying an upward trend in price movement. This bullish sentiment is bolstered by the fact that the price is positioned above a major ascending trend line, indicating the potential for further bullish momentum ahead.
In the short term, there’s potential for the price to drop further before initiating a rebound. The 1st support level at 1.0693 is identified as a pullback support, and it aligns with the 127.20% Fibonacci Extension. This confluence of support factors increases its importance as a potential support zone.
The 2nd support level at 1.0517 is noted as a multi-swing low support, indicating that historical price action has found support around this level. This further solidifies its role as a potential area of support.
In the event of a bounce from the support, the price could rise towards the 1st resistance level at 1.0933. This level is marked as an overlap resistance, suggesting that historical price action has faced resistance in this region before.
Additionally, an intermediate support level at 1.0767 is recognized as a swing low support, and it aligns with the 78.60% Fibonacci Retracement level. This level could potentially provide support during pullbacks.
EUR/JPY:
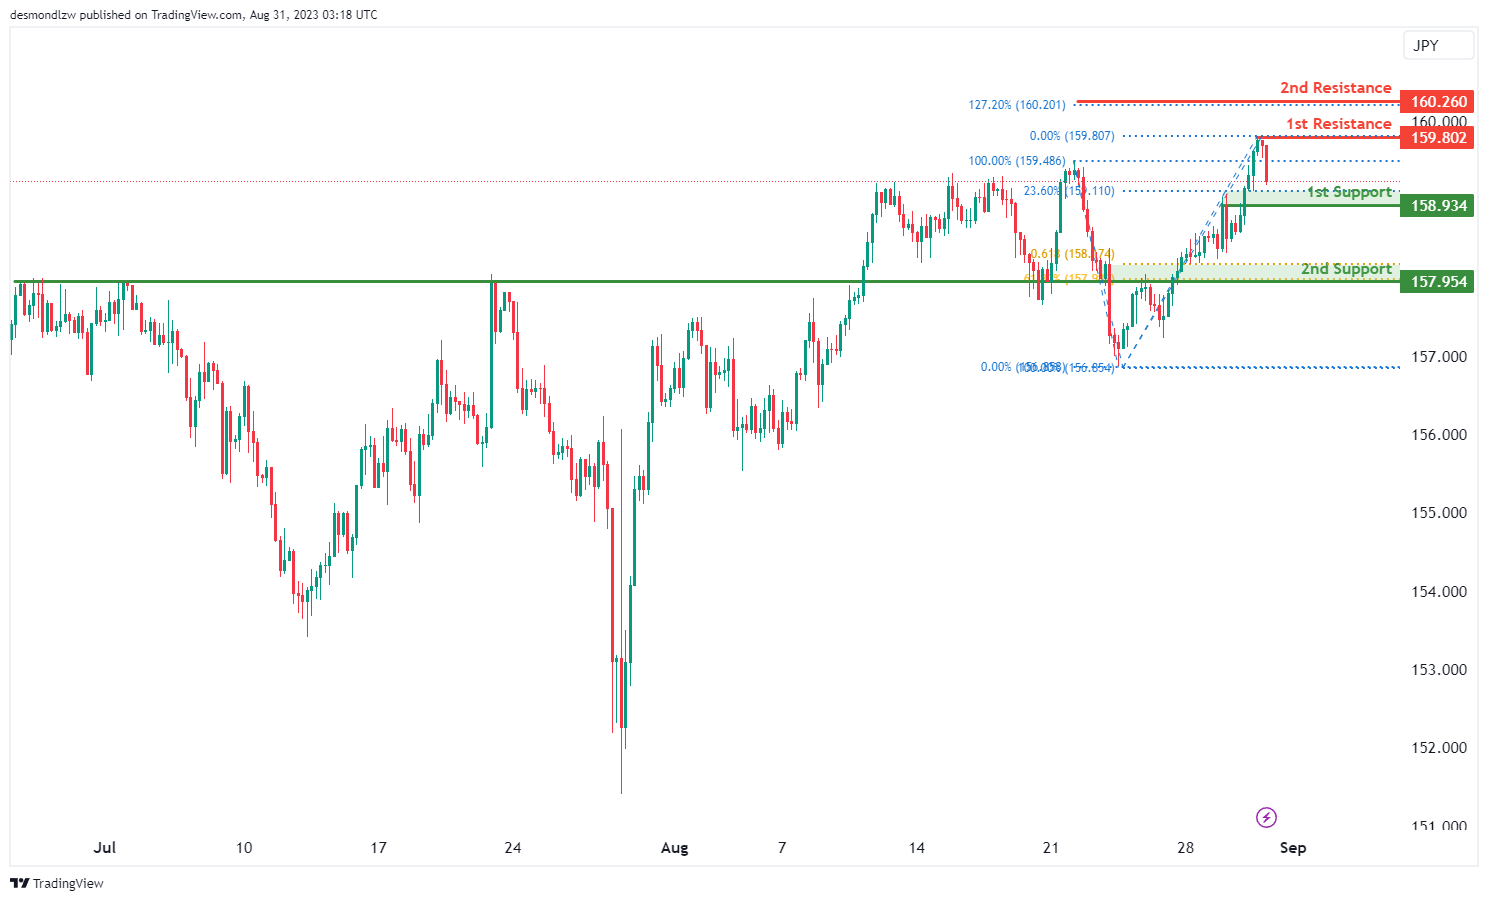
The EUR/JPY pair currently exhibits a bullish momentum. Given this upward trajectory, there’s a notable possibility for the currency pair to take a bullish bounce off its 1st support level, which is positioned at 156.91. This support level stands out mainly due to its classification as a multi-swing low support.
Should the price dip further, the 2nd support level is pegged at 155.48. This support level is recognized as a swing low support and is also reinforced by the 50% Fibonacci Retracement, which adds to its significance as a potential zone of stabilization in the event of a pullback.
On the potential upside, the 1st resistance is identified at 159.32. This resistance level is termed as an overlap resistance. What amplifies its significance is the association with the 127.20% Fibonacci Extension, suggesting that it could serve as a formidable barrier or pivot point in the market, especially for bullish movements.
EUR/GBP:
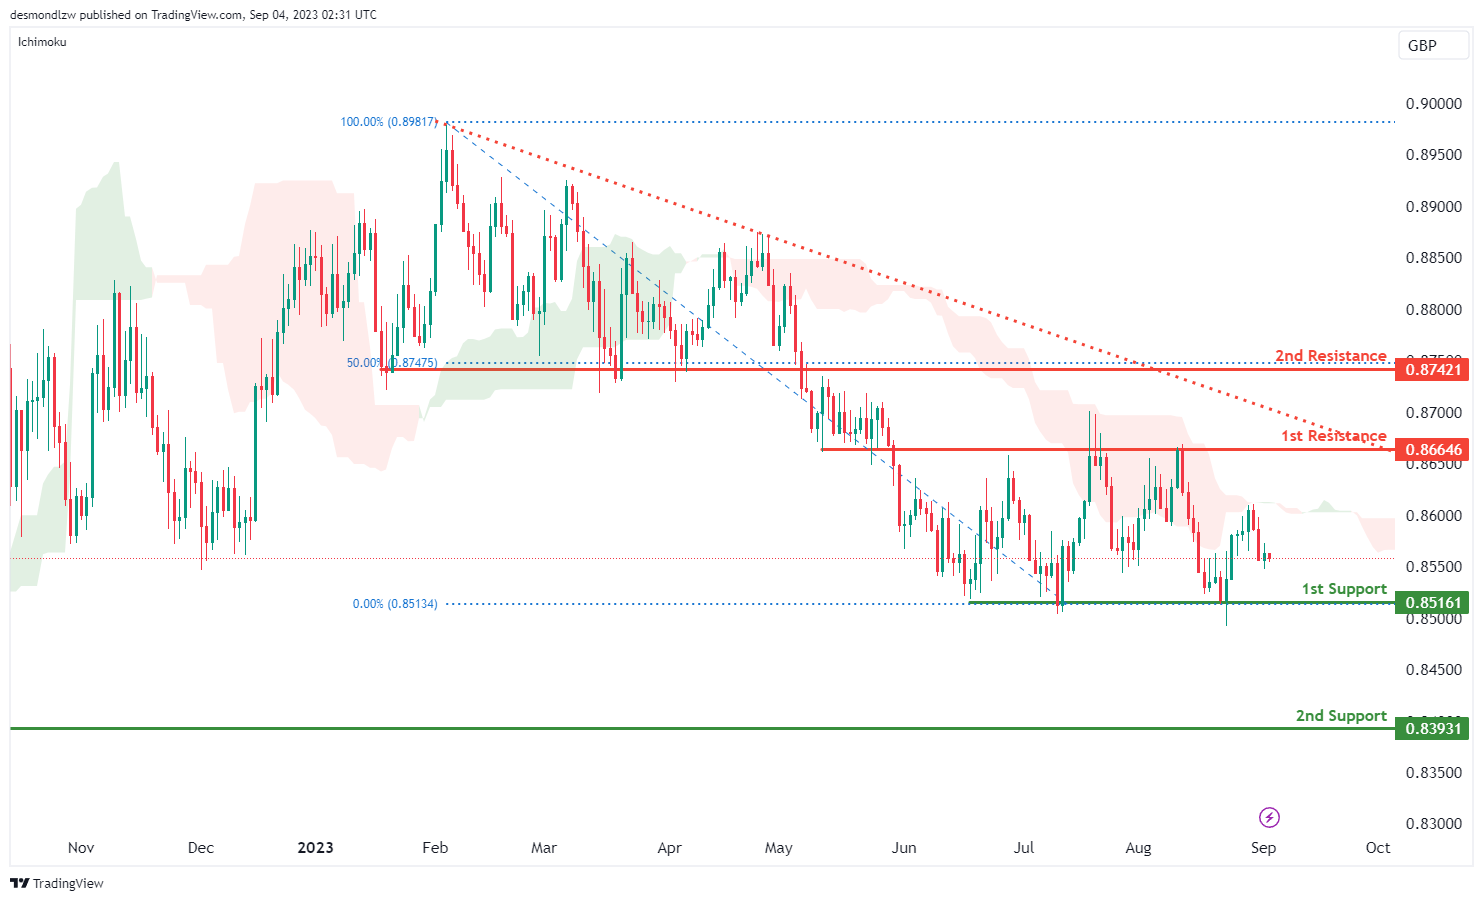
The EUR/GBP pair is currently indicating a bearish momentum. One of the significant factors underscoring this bearish trend is the price’s positioning below a major descending trend line. This pattern suggests that the bearish momentum might persist and continue further.
Given this context, there’s a possibility for the pair to sustain its bearish movement, targeting the 1st support level at 0.8516. This support level is significant due to its characterization as a multi-swing low support, indicating areas where the price has found support in the past.
If the bearish momentum pushes the price even lower, the 2nd support to watch is at 0.8393. This level stands out as an overlap support, representing levels where the price has shown historical interactions.
On the upside, should there be any short-term bullish retractions, the 1st resistance is pegged at 0.8664. This resistance level is noteworthy as an overlap resistance, suggesting zones where past price action might have encountered barriers.
Beyond that, the 2nd resistance is identified at 0.8742. This level serves not only as a pullback resistance but is also aligned with the 50% Fibonacci Retracement, emphasizing its potential importance as a barrier against further bullish movements.
GBP/USD:
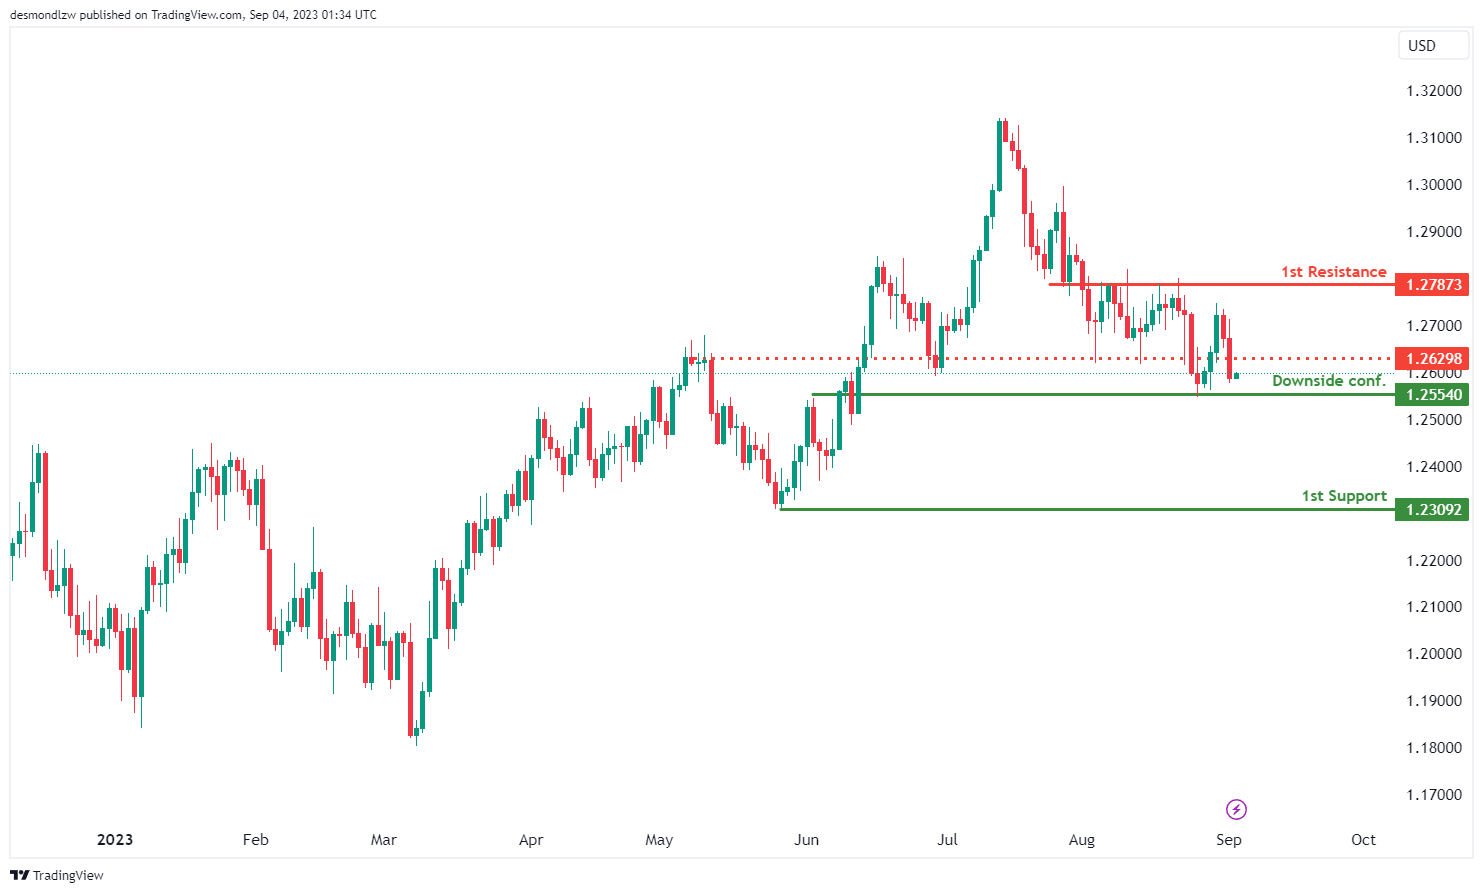
The GBP/USD chart is currently exhibiting a bullish overall momentum, indicating an upward trend in price movement. There’s potential for the price to experience a bullish bounce off the 1st support level and subsequently move towards the 1st resistance level.
Before considering potential bullish movement, it’s advised to wait for downside confirmation at 1.2554. This level is identified as an overlap support, indicating that historical price action has found support around this area. Waiting for confirmation can help ensure a stronger foundation for potential price movements.
The 1st support level at 1.2309 is significant as it’s a swing low support. This suggests that historical price action has previously encountered support at this level, potentially serving as a key reference point for future movements.
Should the price exhibit a bullish rebound, the 1st resistance level at 1.2787 becomes relevant. This level is marked as an overlap resistance, implying that historical price action has faced resistance in this region before.
Additionally, an intermediate resistance at 1.2629 is identified as a pullback resistance. This level could play a role in temporarily halting a bullish movement before further potential advancement.
GBP/JPY:
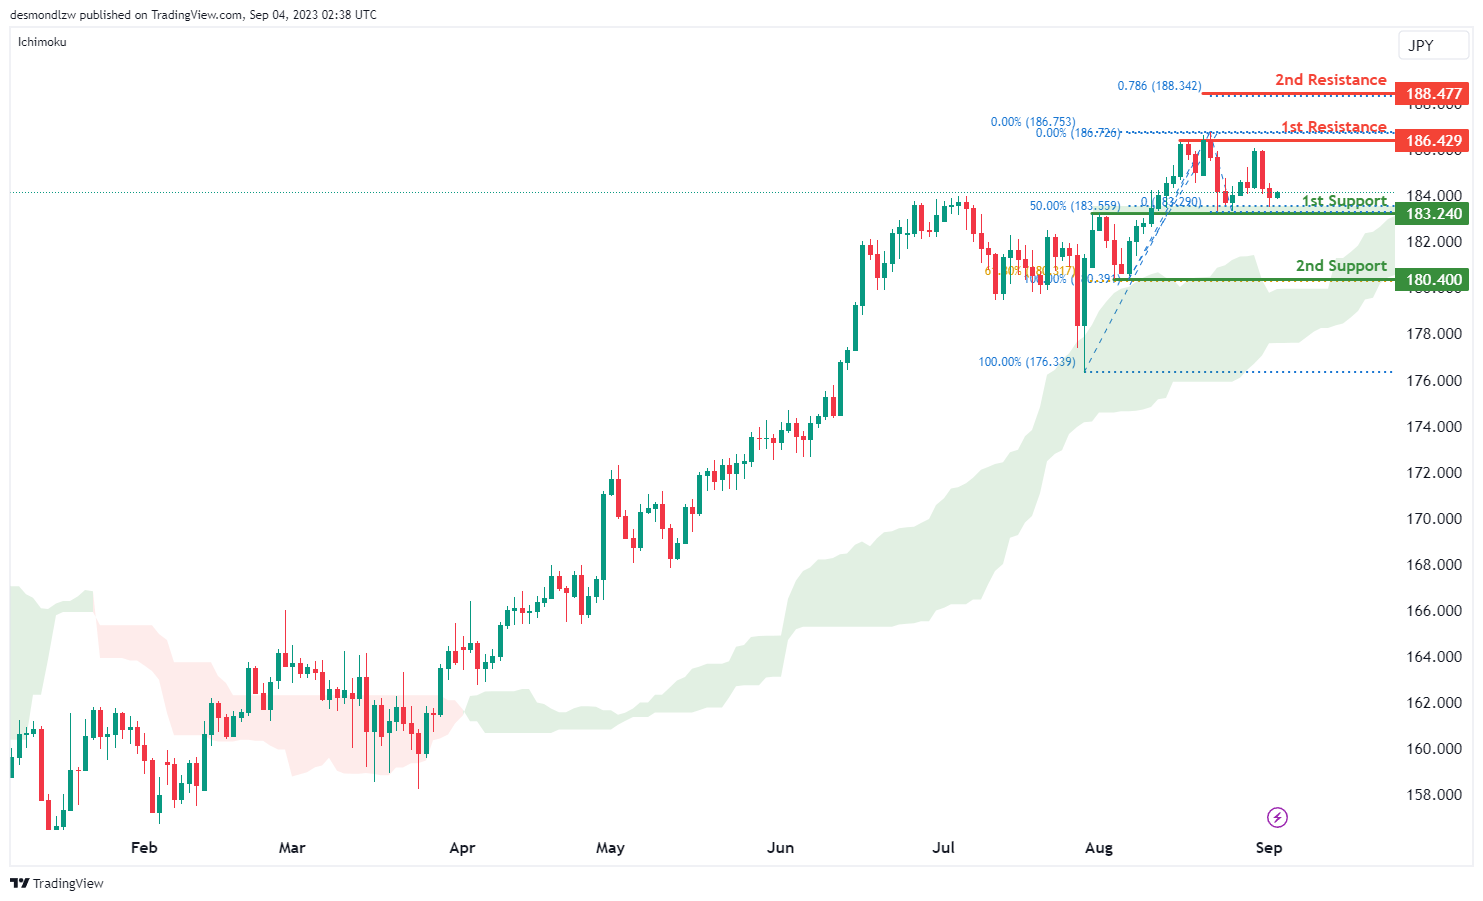
The GBP/JPY chart currently exhibits a bullish trend, primarily because the price is positioned above the bullish Ichimoku cloud.
Given this momentum, there’s a chance for a bullish bounce from the 1st support at 183.24, which is distinguished as an overlap support and aligns with the 50% Fibonacci Retracement. Should the price decline further, the 2nd support to note is at 180.40, a swing low support strengthened by the 61.80% Fibonacci Retracement.
On the bullish front, the 1st resistance is marked at 186.42, identified as a multi-swing high resistance. Beyond that, the 2nd resistance is at 188.47, aligning with the 78.60% Fibonacci Projection.
USD/CHF:
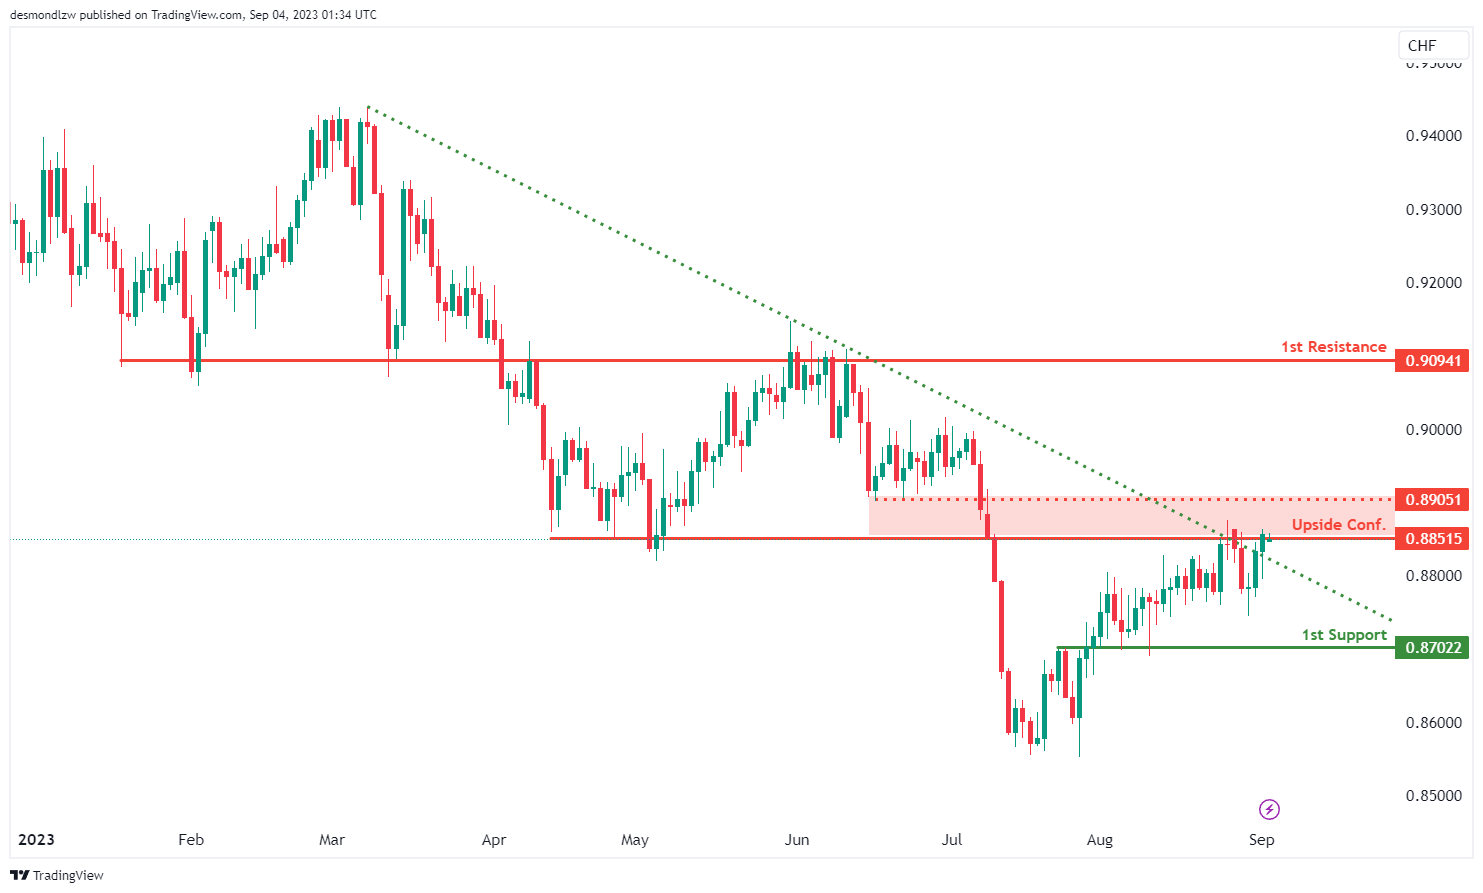
The USD/CHF chart is currently displaying a bullish overall momentum, marked by a breakout above a descending resistance line. This breakout has triggered a potential bullish move in the price.
In the short term, there’s potential for the price to experience a drop towards the 1st support level at 0.8702. This level is identified as an overlap support, indicating that historical price action has found support around this area.
Should the price exhibit a drop and reach the 1st support level, a bounce could be anticipated from there. Following this bounce, a potential upward movement towards the 1st resistance level at 0.9094 could occur. This level is marked as an overlap resistance, implying that historical price action has encountered resistance in this region before.
Before considering the upward move, waiting for upside confirmation at 0.8851 is recommended. This level is identified as a multi-swing high resistance, and waiting for confirmation can provide stronger indications of a potential bullish breakout.
Furthermore, an intermediate resistance at 0.8905 is noted as a pullback resistance. This level might act as a temporary barrier to any bullish movement before further potential advancement.
USD/JPY:
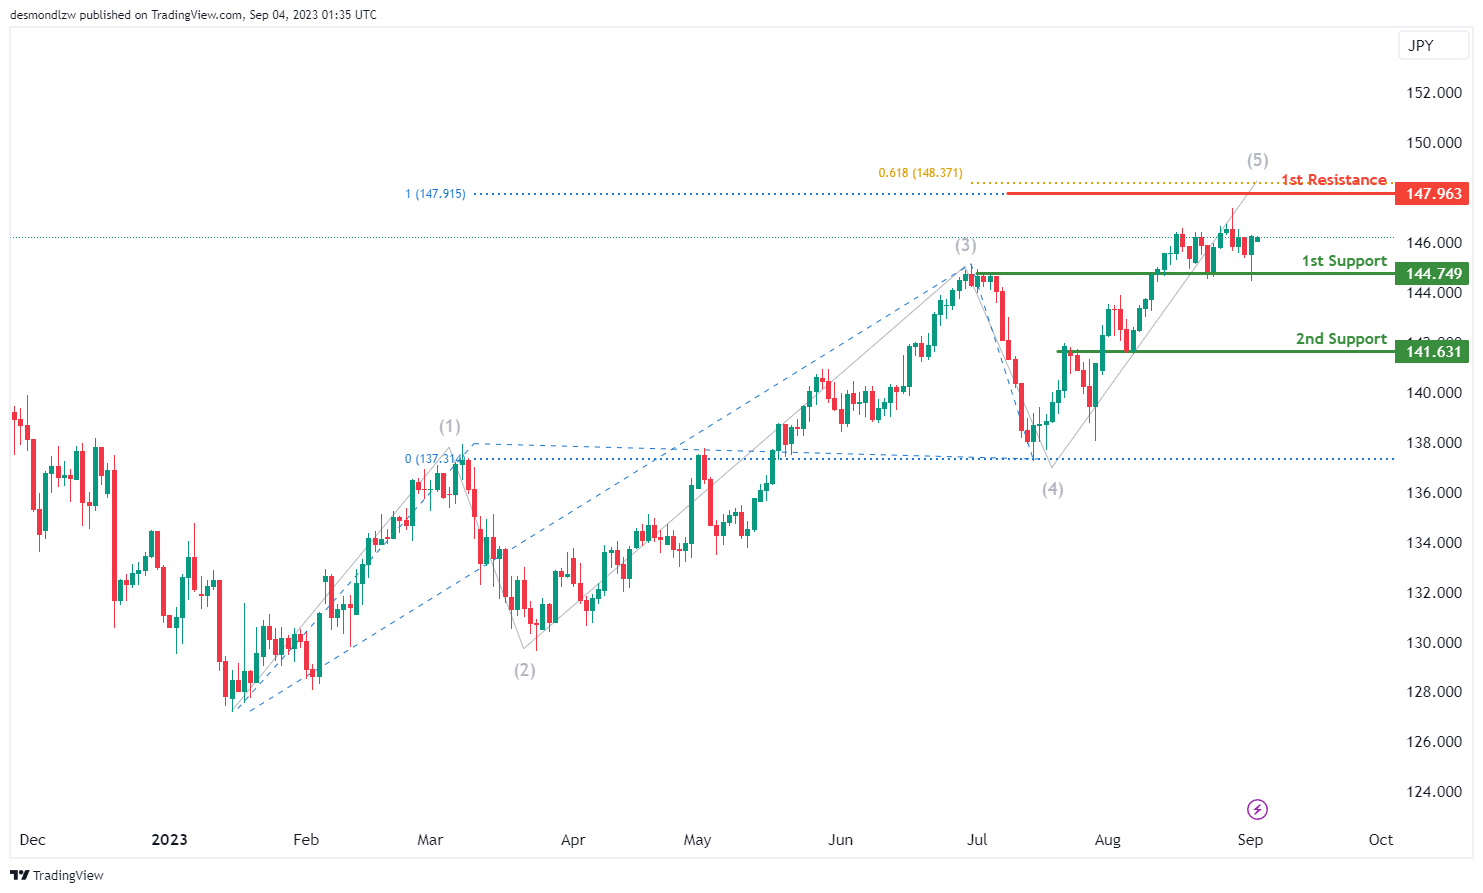
The USD/JPY chart is currently demonstrating a bullish overall momentum, indicating an upward trend in the price movement. There is potential for the price to continue its bullish trajectory and possibly reach the 1st resistance level.
The 1st support level at 144.74 is recognized as an overlap support, highlighting historical price action finding support around this region. This level establishes a foundation for potential upward movements.
Similarly, the 2nd support level at 141.63 is also considered an overlap support, suggesting that previous price action has seen support in this area as well.
Looking towards potential resistance levels, the 1st resistance at 147.96 holds significance due to its alignment with the 100% and 61.80% Fibonacci projections. This confluence of Fibonacci levels adds to the importance of this resistance level, making it a point of interest for potential price reactions.
USD/CAD:
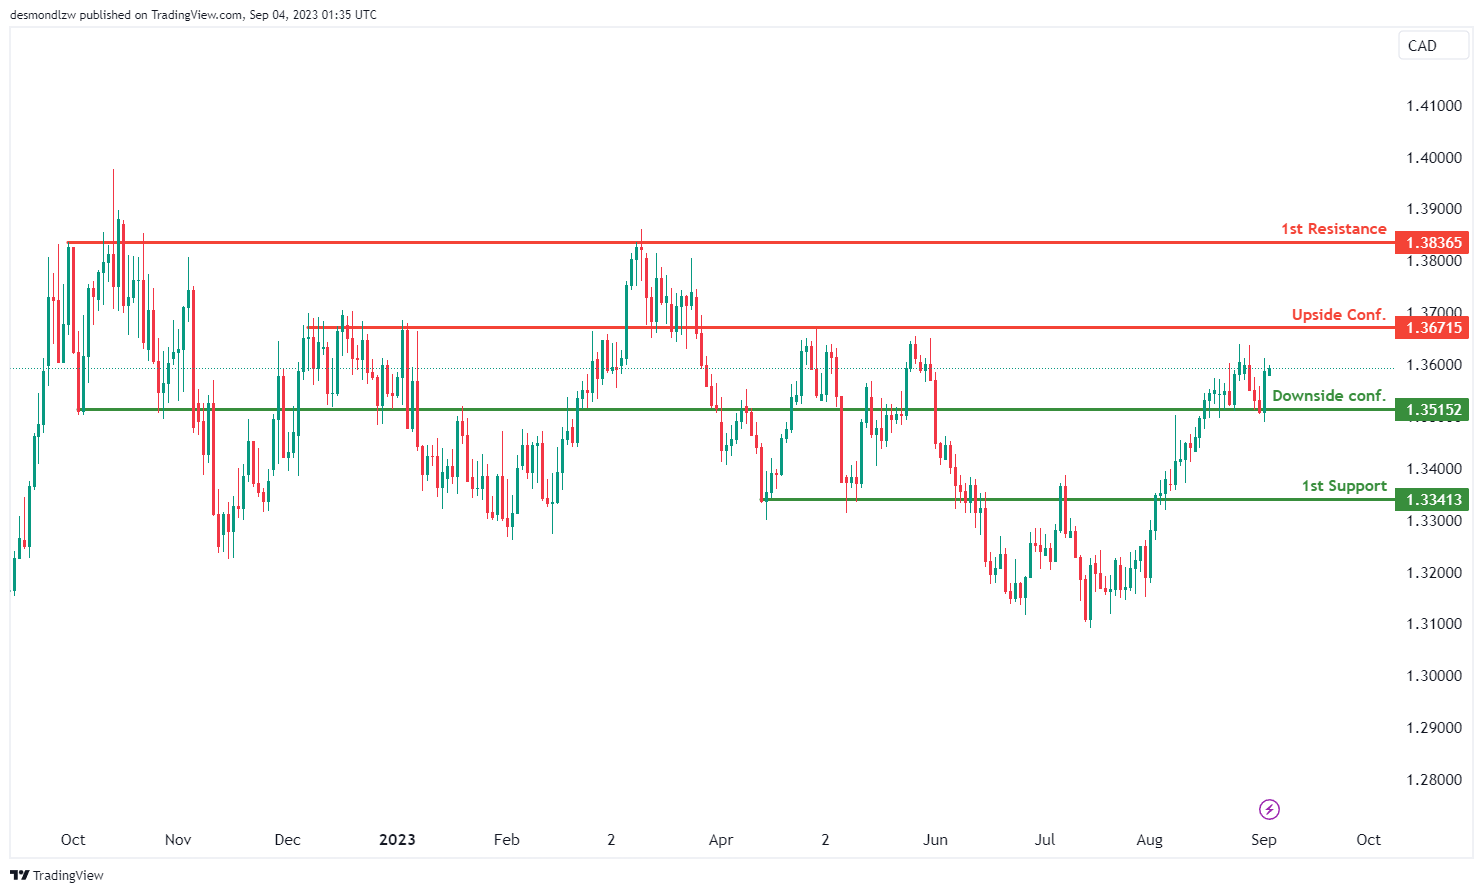
The USD/CAD chart is currently displaying an overall neutral momentum, indicating a lack of a clear trend direction. In this scenario, there’s a possibility that price could fluctuate within the boundaries as defined by the 1st resistance and the 1st support levels.
The 1st support at 1.3341 is identified as an overlap support while the 1st resistance level at 1.3837 is marked as a multi-swing high resistance.
The intermediate support level at 1.3515 is identified as an overlap support and is also marked as a downside confirmation level, indicating that if price breaks under this level, there is potential for further downside movement towards the 1st support.
The intermediate resistance level at 1.3672 is identified as an overlap resistance and is also marked as an upside confirmation level, indicating that if price breaks above this level, there is potential for further upward movement towards the 1st resistance.
AUD/USD:
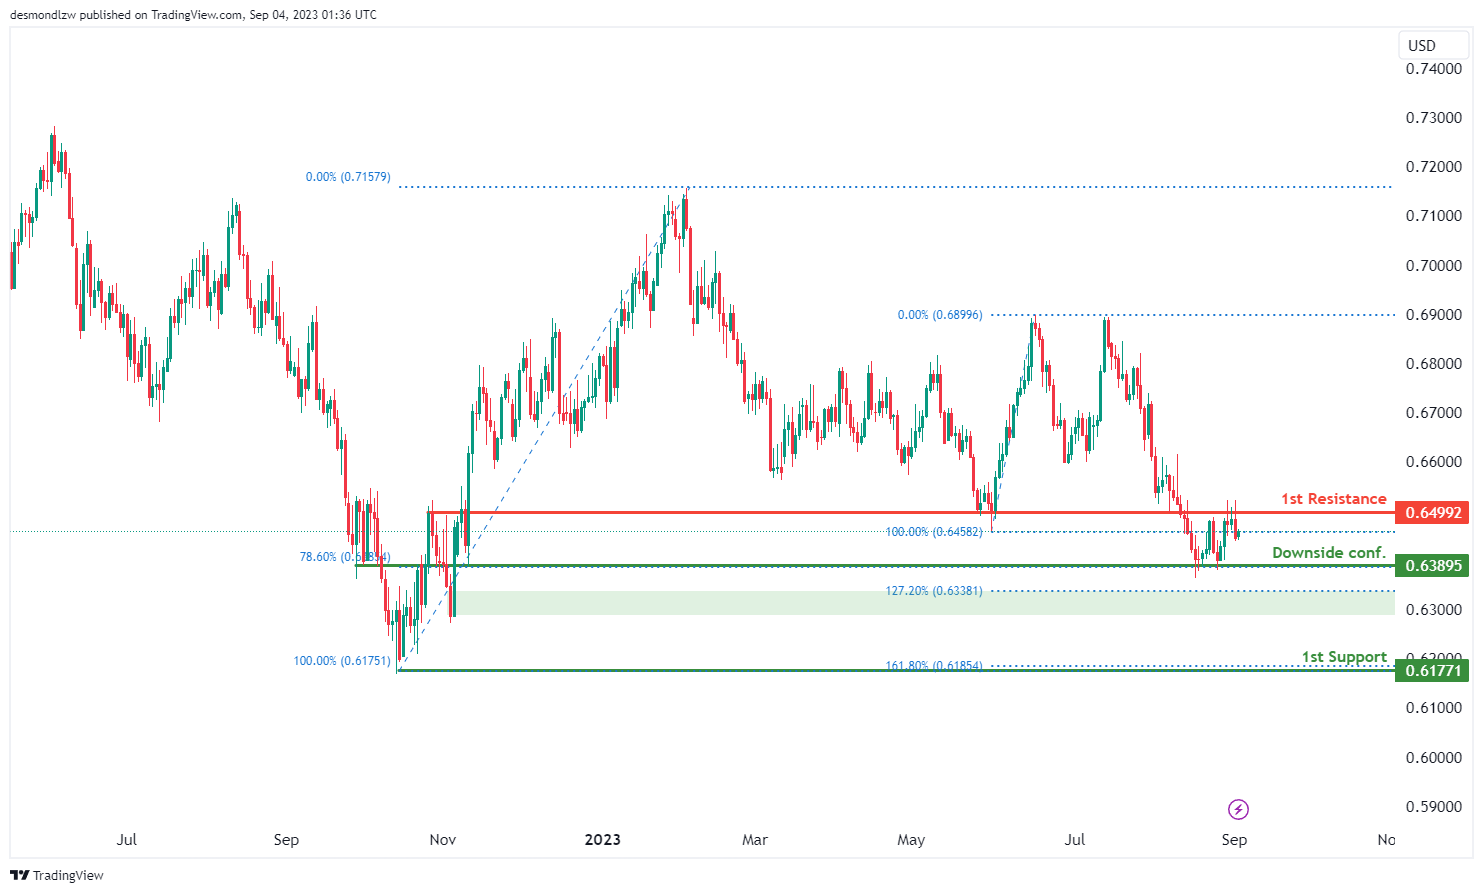
The AUD/USD chart is currently exhibiting an overall neutral momentum, suggesting a lack of a distinct trend direction. Given this scenario, there’s a potential scenario where the price might fluctuate between the 1st resistance and the 1st support levels.
The intermediate support at 0.6390 is noted as pullback support that coincides with the 78.60% Fibonacci retracement level and is also marked as a downside confirmation level, indicating that if price breaks under this level, there is potential for further downside movement towards the 1st support.
The 1st support level at 0.6177 is identified as an overlap support that aligns with the 161.80% Fibonacci extension level, adding to its potential significance as a support zone.
To the upside, the 1st resistance at 0.6499 is identified as an overlap resistance, implying that historical price action has encountered resistance around this level before.
NZD/USD
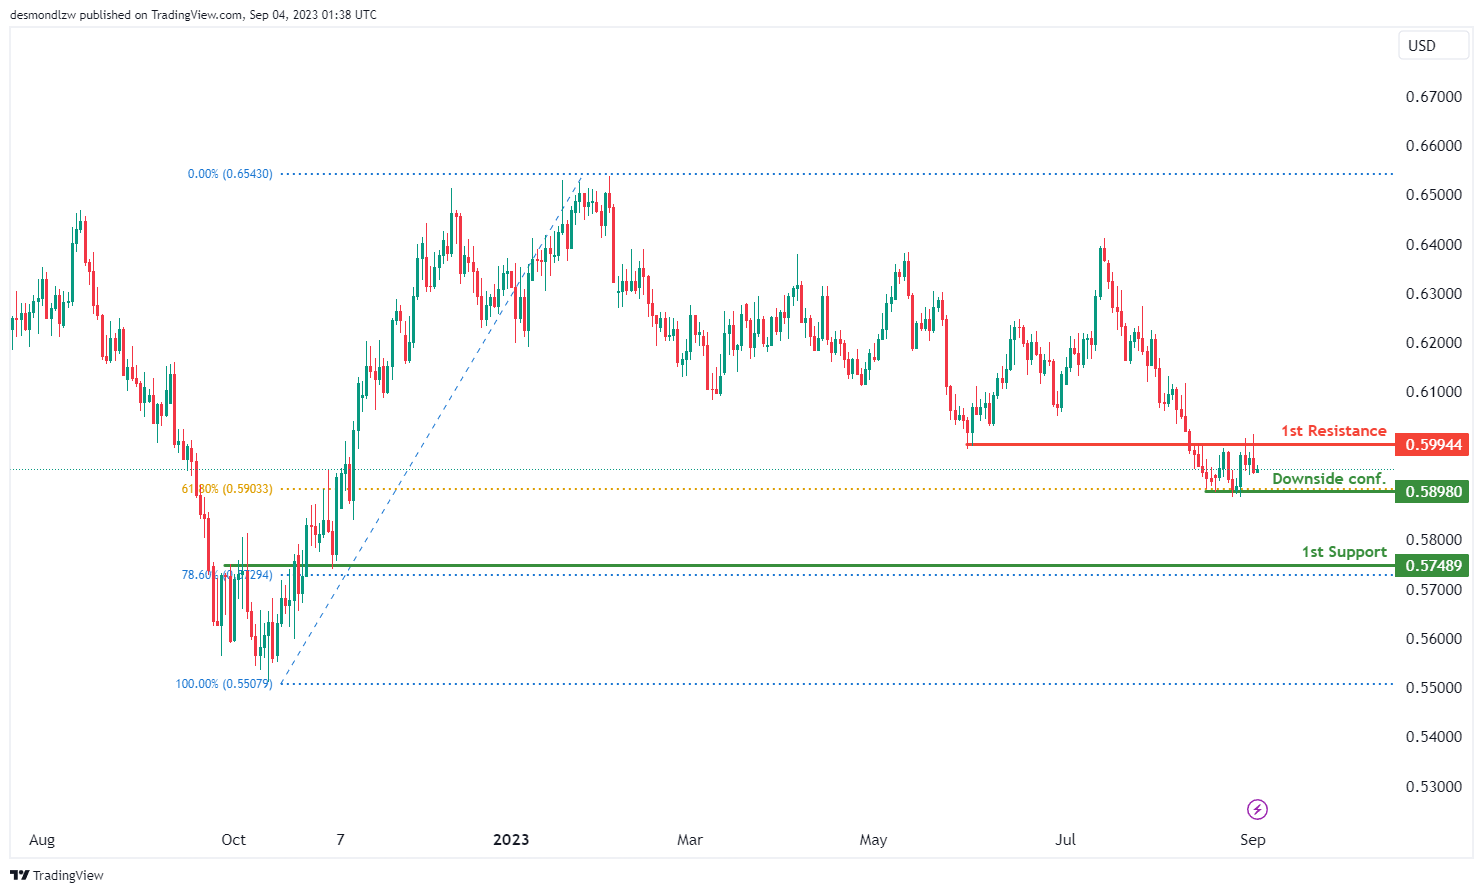
The NZD/USD chart currently presents an overall neutral momentum, suggesting a lack of clear trend direction. In this scenario, there’s a possibility that the price might fluctuate within a range between the 1st resistance and the 1st support levels.
The intermediate support at 0.5898 is identified as pullback support that aligns with the 61.8% Fibonacci retracement level and is also marked as a downside confirmation level, indicating that if price breaks under this level, there is potential for further downside movement towards the 1st support.
The 1st support level at 0.5748 is identified as an overlap support that aligns with the 78.6% Fibonacci retracement level. To the upside, the 1st resistance level at 0.5994 is noted as an overlap resistance, suggesting that historical price action has encountered resistance around this level before.
DJ30:
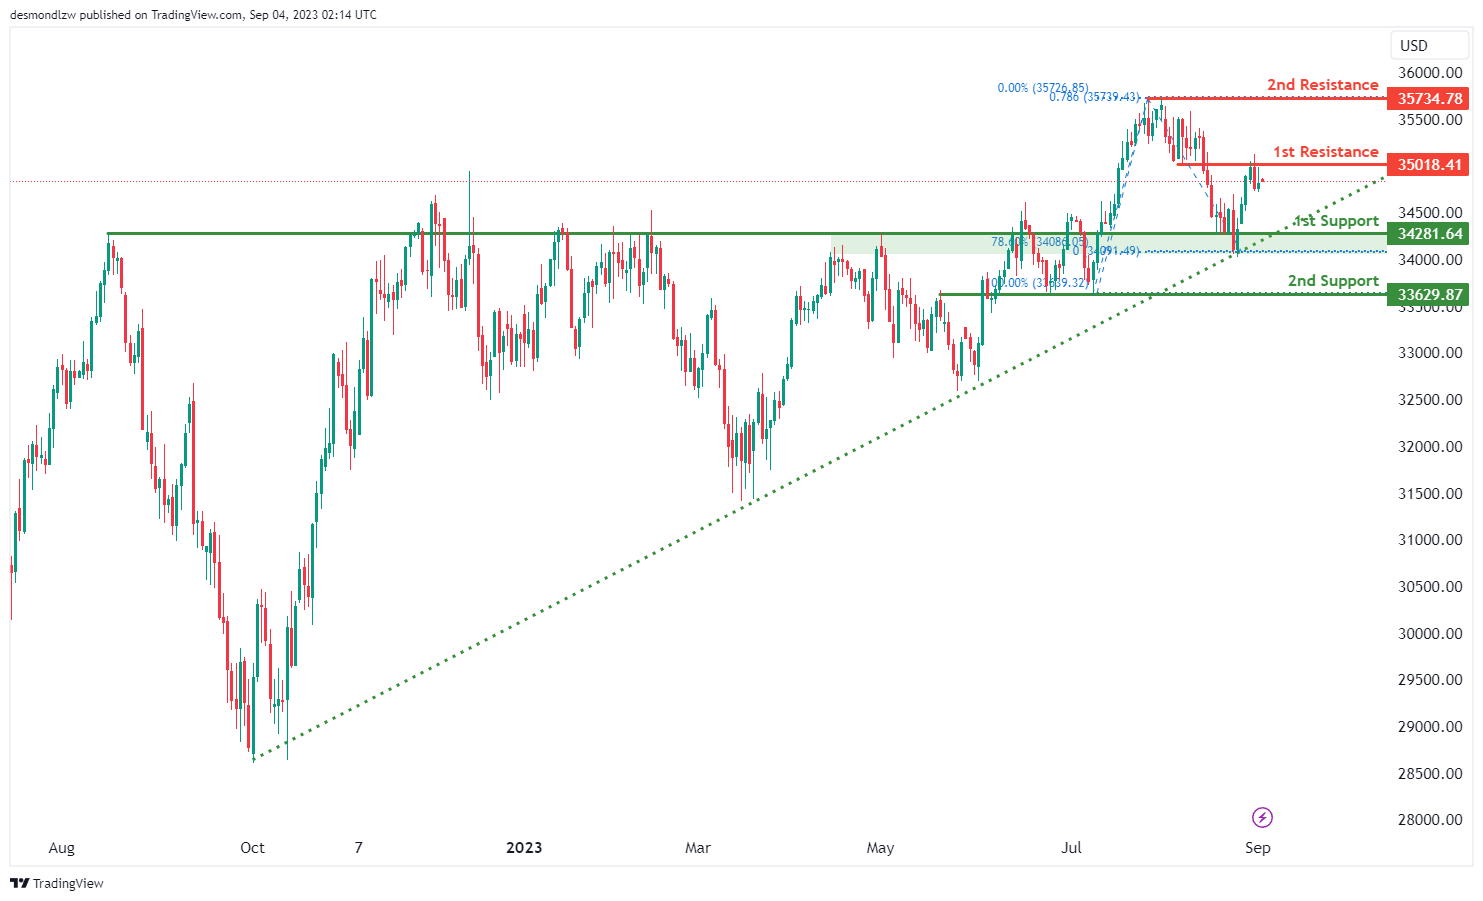
For DJ30, the chart indicates a bearish overall momentum.
The 1st support level at 34281.60 aligns with an overlap support and coincides with the 78.60% Fibonacci retracement level. This makes it a significant level where price could potentially find support.
The 2nd support level at 33629.80 is also identified as an overlap support, further strengthening its significance as a potential level for price to bounce.
The 1st resistance level at 35018.40 is marked as an overlap resistance, which suggests it could act as a barrier to further upward movement.
The 2nd resistance level at 35734.70 coincides with a swing high resistance and the 78.60% Fibonacci projection. This level could serve as a significant hurdle for any bullish attempts.
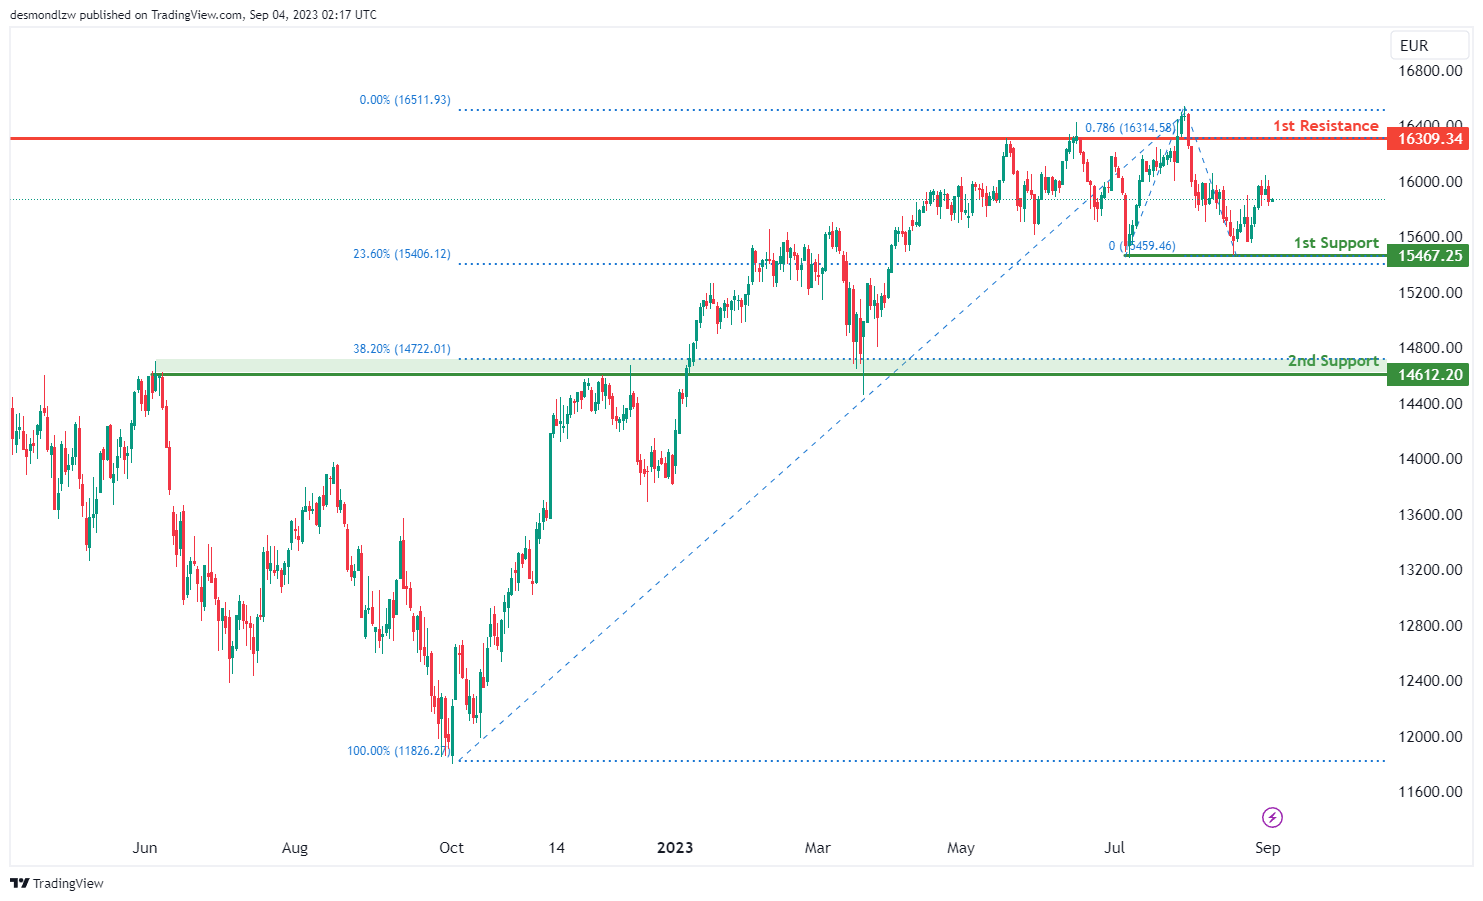
GER30:
For GER30, the chart suggests a bearish overall momentum.
The 1st support level at 15467.20 is significant as it aligns with a multi-swing low support and coincides with the 23.60% Fibonacci retracement level. This makes it a strong candidate for potential support.
The 2nd support level at 14612.20 is identified as an overlap support and further strengthens its importance as a potential area where the price could find support.
The 1st resistance level at 16309.30 is marked as an overlap resistance, indicating it could act as a barrier to any upward movements.
US500
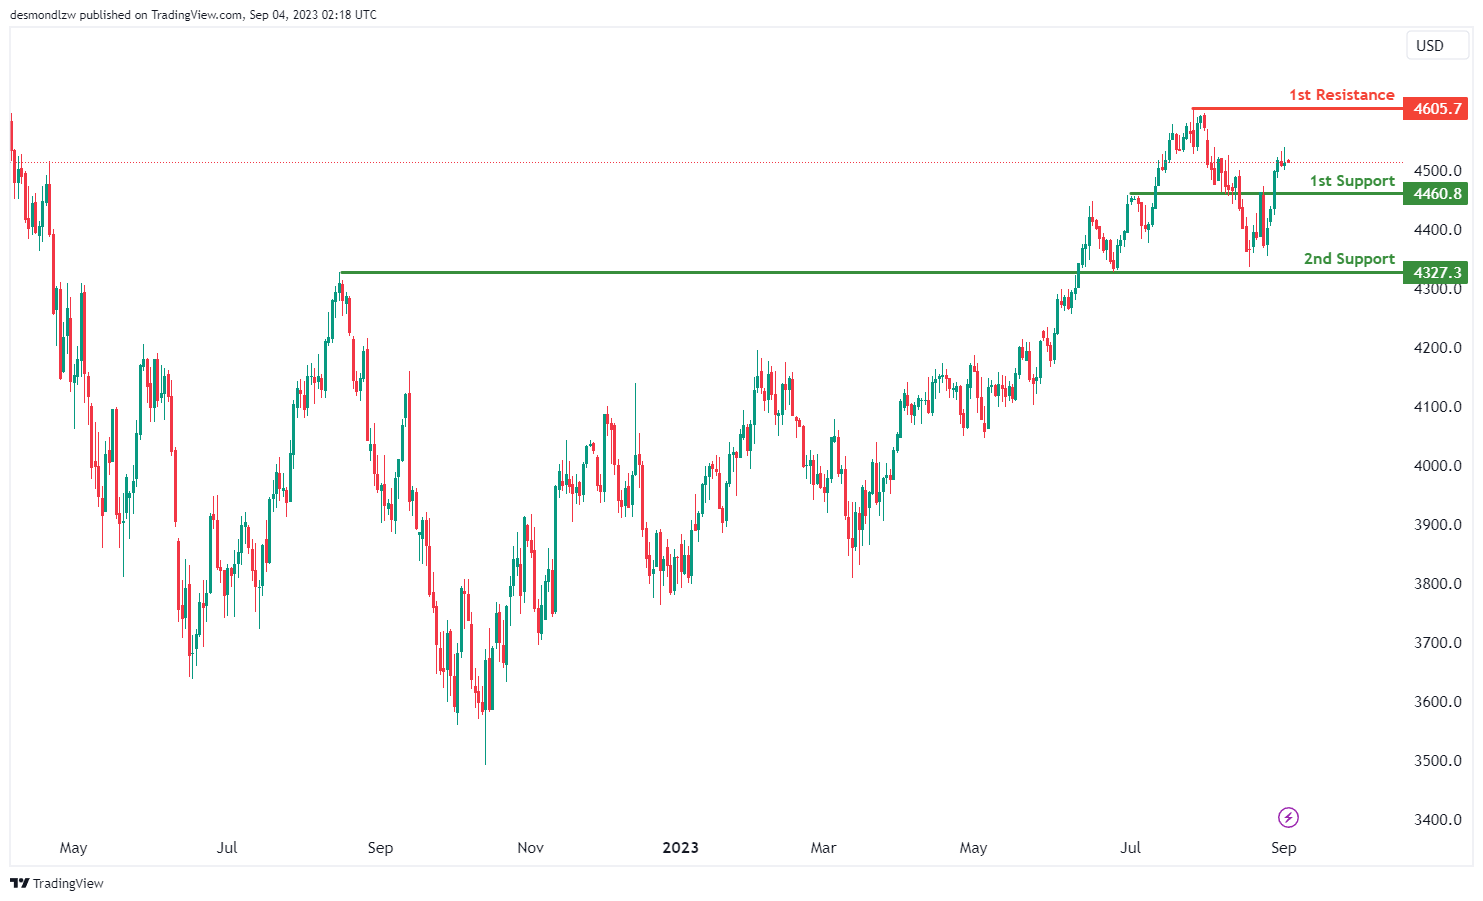
The chart for US500 suggests a bullish momentum, with the price above the bullish Ichimoku cloud.
The 1st support level is at 4460.8, which is considered as a pullback support, and the 2nd support level is at 4327.3, which is an overlap support. These support levels may attract buyers after a short decline.
The 1st resistance is at 4605.7, which is a swing high resistance, often a tough level for price to break past. Given the bullish trend, there could be a brief drop to the 1st support before a potential bounce towards the 1st resistance.
BTC/USD:
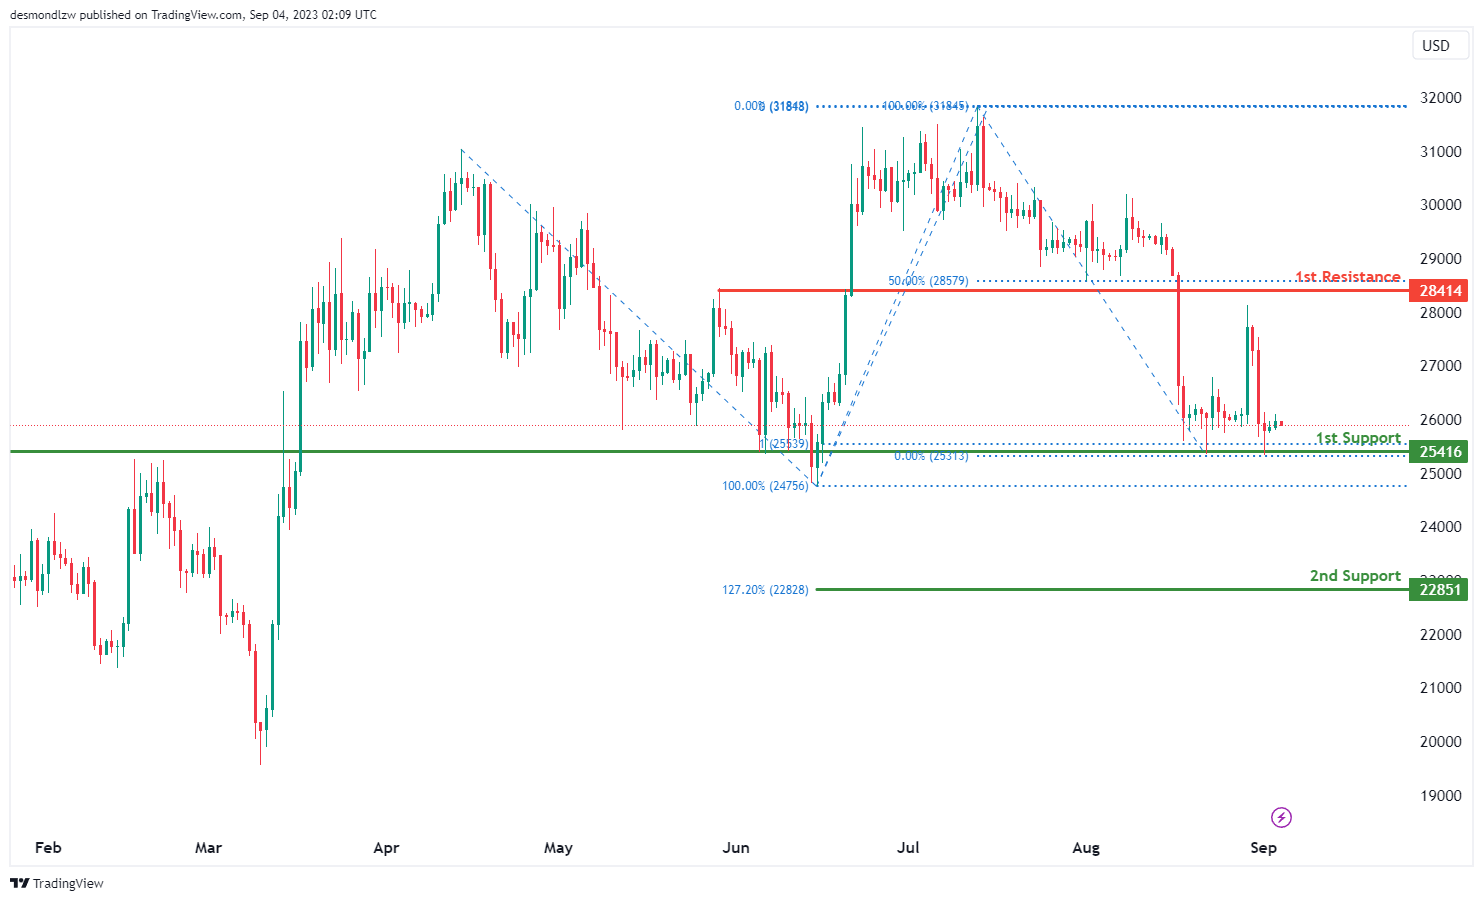
For BTC/USD, the chart suggests a bullish overall momentum.
The 1st support level at 25416 aligns with an overlap support and coincides with the 100% Fibonacci projection. This level could act as a strong support area for the price.
The 2nd support level at 22851 aligns with the 127.20% Fibonacci extension, providing additional support in case of a retracement.
The 1st resistance level at 28414 is identified as a pullback resistance, which could serve as a significant barrier to further upward movement.
ETH/USD:
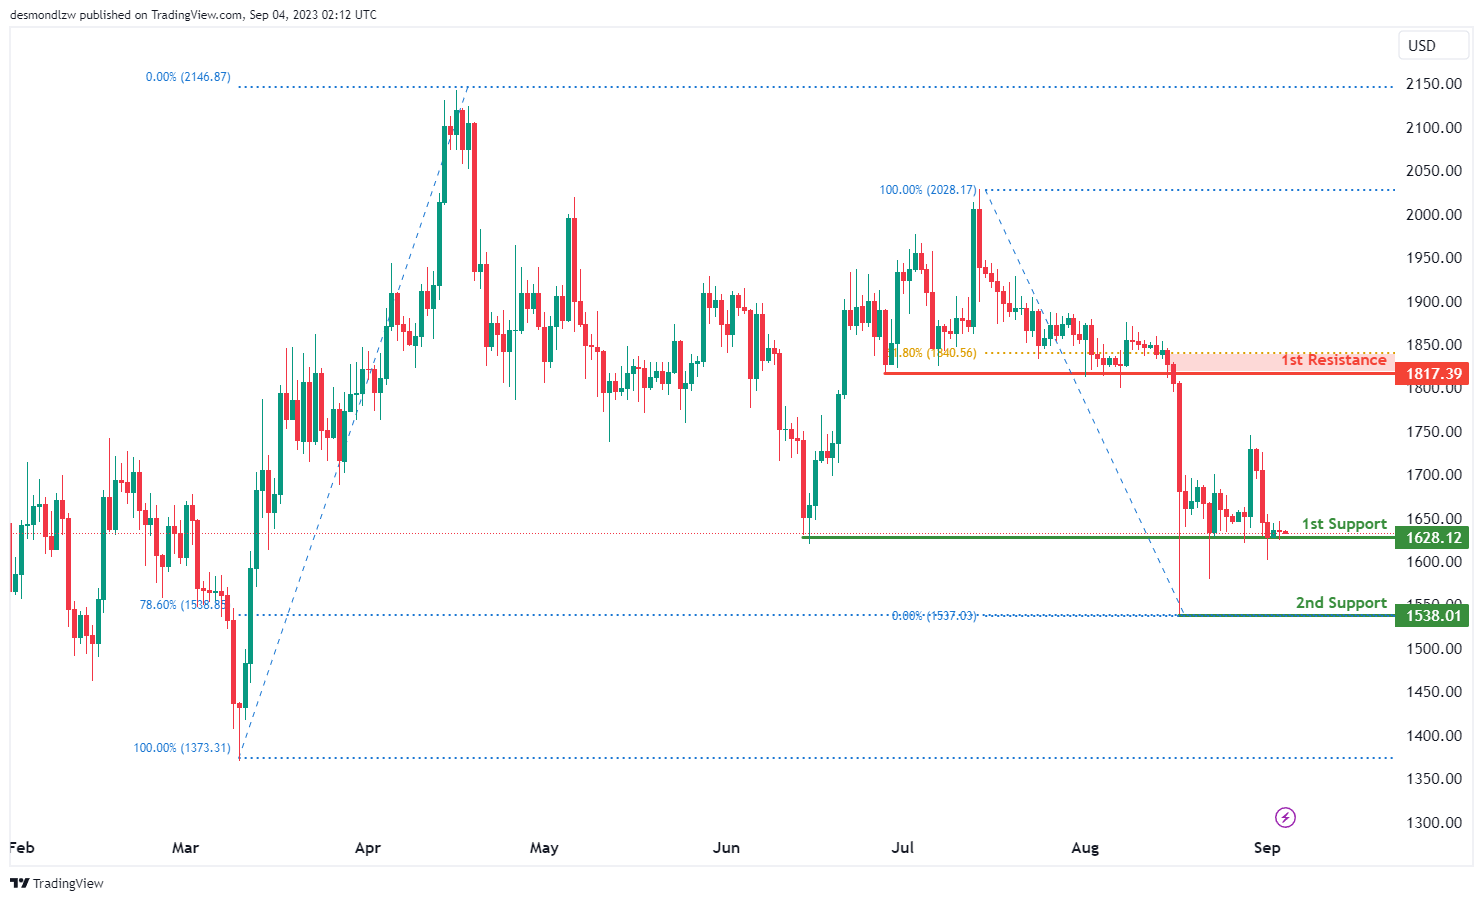
For ETH/USD, the chart indicates a bullish overall momentum.
The 1st support level at 1628.12 is based on multi-swing low support, suggesting it’s a significant level for potential price reversals or bounces.
The 2nd support level at 1538.01 aligns with a swing low support and coincides with the 78.60% Fibonacci retracement level. This adds strength to the support level.
The 1st resistance level at 1817.39 is identified as a pullback resistance, indicating that it could act as a significant barrier to further upward movement.
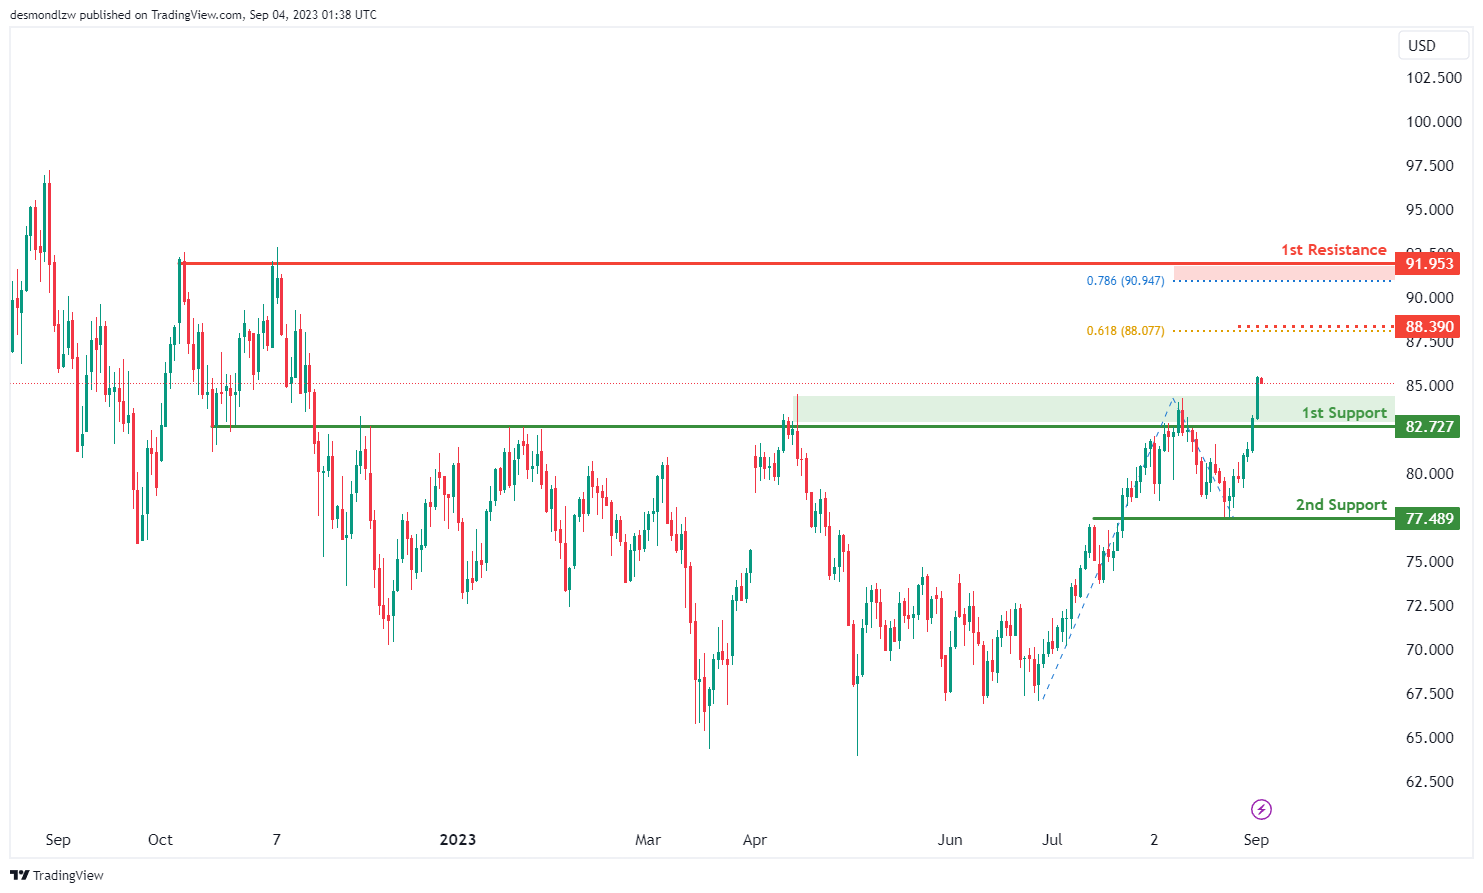
WTI/USD:
The WTI chart currently displays a bullish overall momentum, indicating an upward trend in the price movement. There’s a potential scenario for the price to continue its bullish trend and potentially reach the 1st resistance level.
The 1st support level at 82.72 is marked as pullback support, suggesting that this level could act as a base for potential upward movements. This level is where price might find support if it experiences a temporary pullback.
The 2nd support level at 77.48 is identified as an overlap support, indicating historical instances of price finding support around this level. It further reinforces the potential significance of this support level.
Looking at resistance levels, the 1st resistance at 91.95 is marked as a multi-swing high resistance. This level holds importance due to its alignment with the 78.60% Fibonacci projection level, adding to its potential significance as a resistance zone.
Additionally, the intermediate resistance at 88.39 is noted for its alignment with the 61.80% Fibonacci projection level. This further reinforces the potential for resistance at this level.
XAU/USD (GOLD):
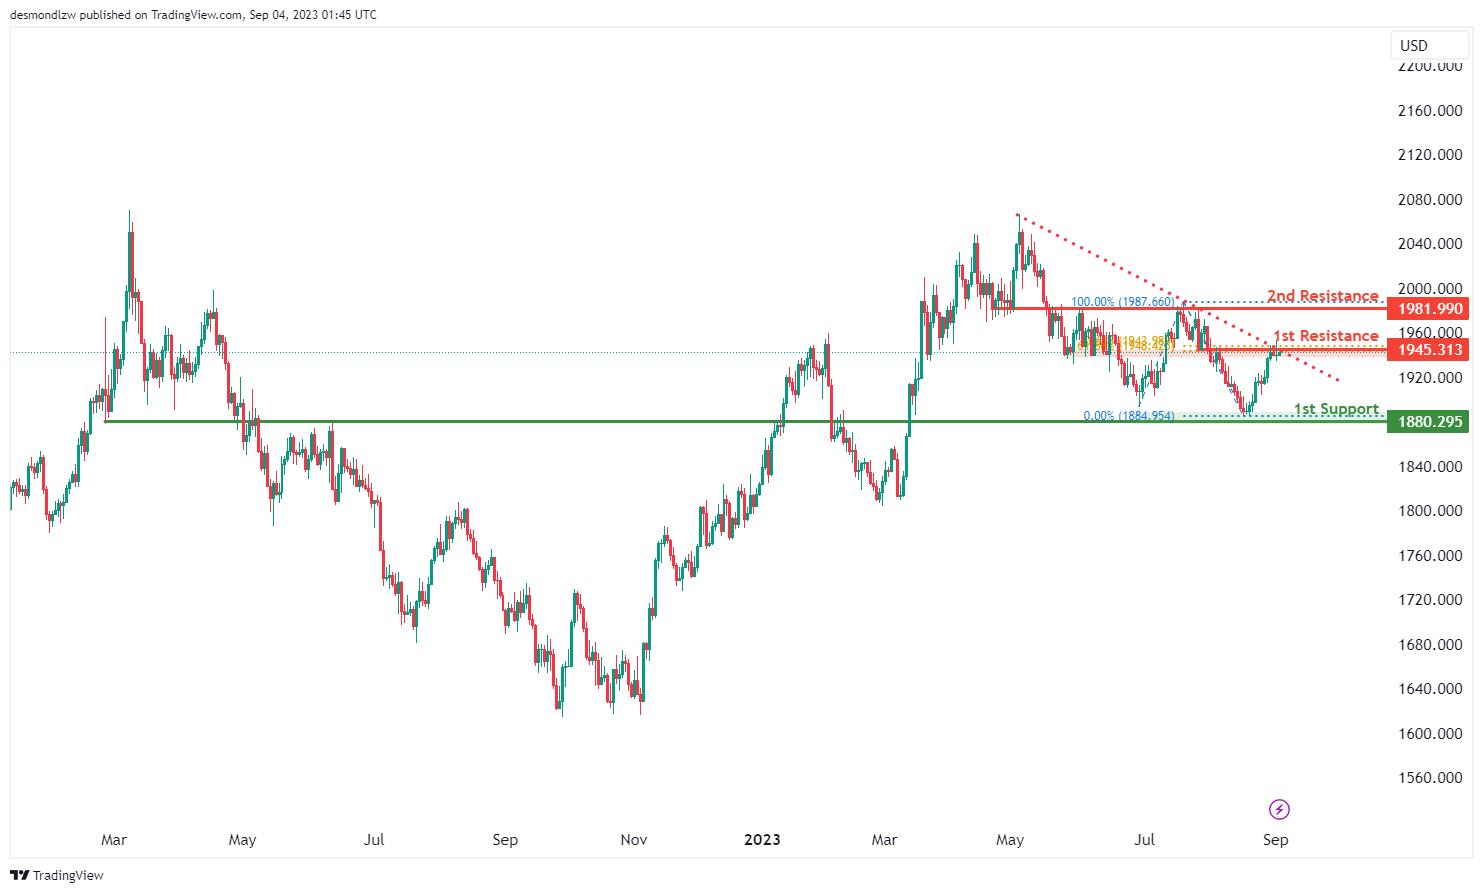
The XAU/USD chart currently exhibits a bearish overall momentum, signaling a downward trend in the price movement. This bearish sentiment is reinforced by the fact that the price is positioned below a significant descending trend line, which suggests a continuation of bearish momentum.
There’s a potential scenario where the price reacts bearishly at the 1st resistance level, leading to a drop towards the 1st support.
The 1st support level at 1880.29 is identified as an overlap support, indicating historical instances of the price finding support around this level. This support level could act as a base for potential downward movements.
Looking at resistance levels, the 1st resistance at 1945.31 holds particular importance due to its alignment with the 61.80% Fibonacci retracement and 61.80% Fibonacci projection. This confluence of Fibonacci levels enhances the significance of this resistance level, making it a noteworthy zone to monitor for potential price reactions.
Additionally, the 2nd resistance at 1981.99 is also marked as an overlap resistance, suggesting that historical price action has encountered resistance in this area before.
New Zealand goods terms of trade rose 0.4% in Q2
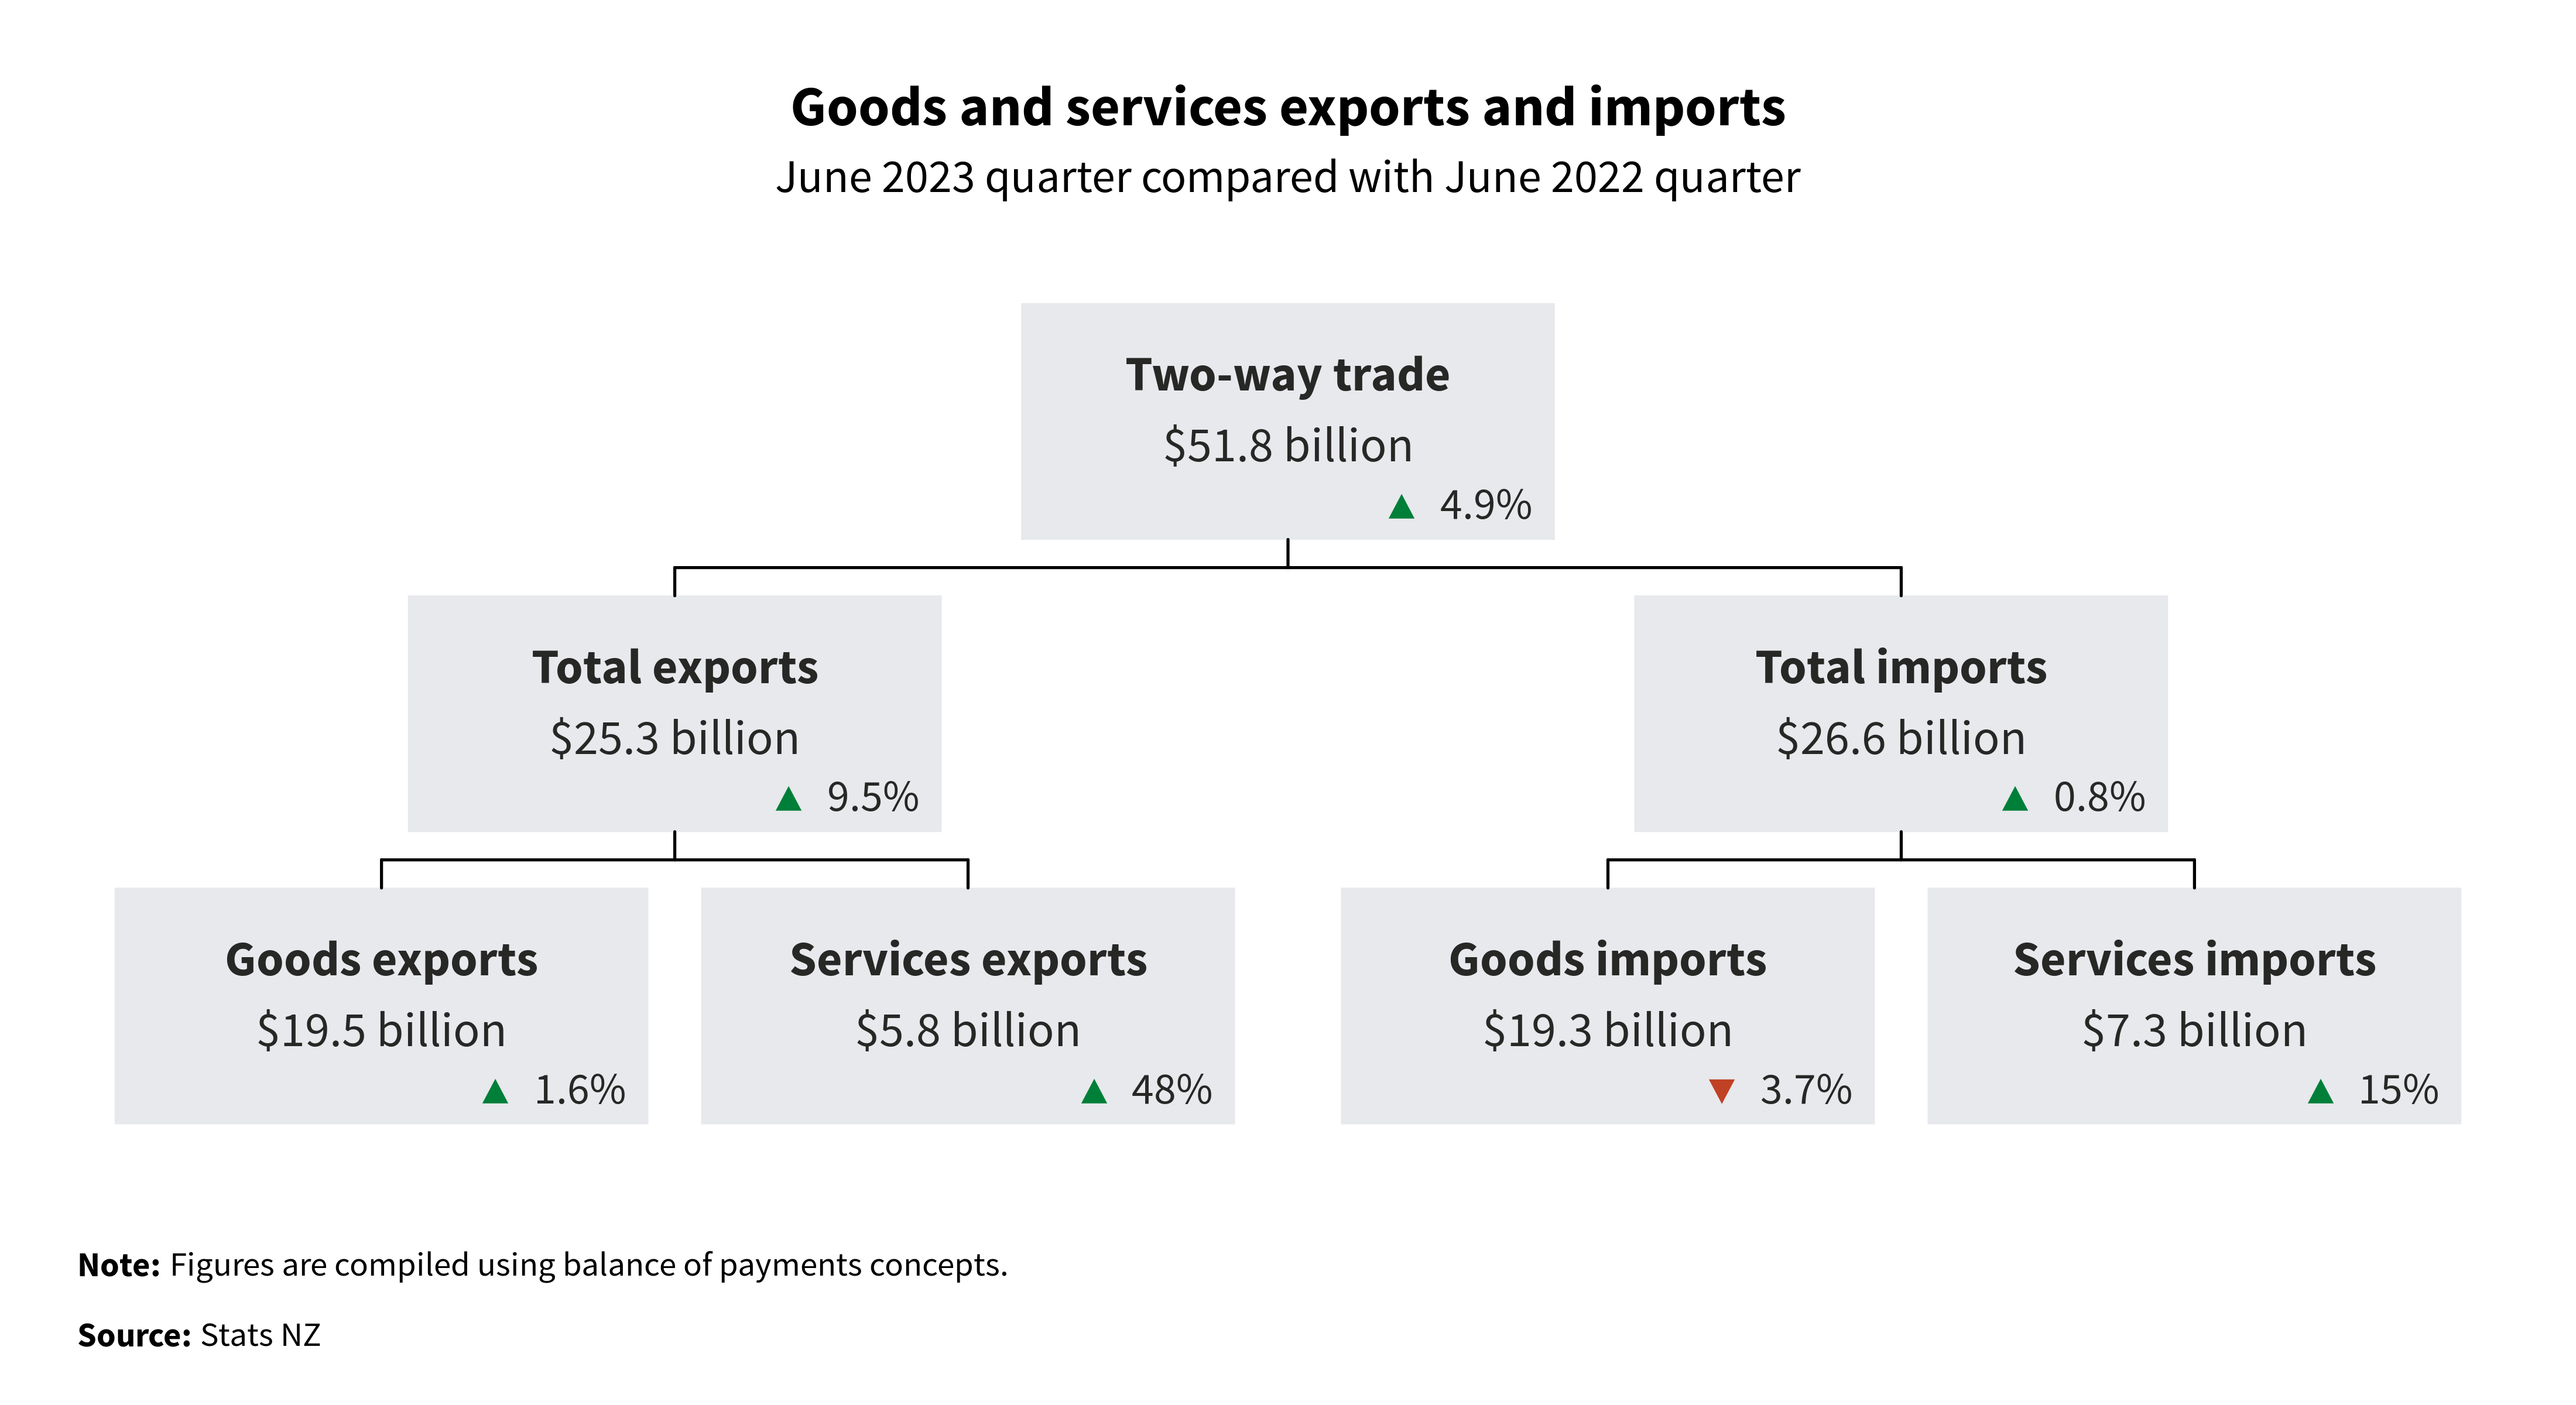
In Q2 2023, New Zealand's goods terms of trade rose by a 0.4%, much better than expectation of -1.3% decline. Both export and import prices for goods witnessed a dip, falling -0.6% and -1.0% respectively. Export volumes surged 6.8%, while import volumes declined by -2.8%, suggesting robust external demand and potentially cautious domestic consumption.
The services sector terms of trade rose significantly by 4.4%, a robust figure indeed. Export prices for services edged up 0.3%, whereas import prices saw a more considerable decline of -3.9%.
Alasdair Allen, international trade manager, highlighted that New Zealand typically enjoys a trade surplus with China, increasingly driven by trade in goods. The trade surplus for Q2 stood at a NZD 2.0B, with total goods and services exports to China valued at NZD 5.8B, and imports at NZD 3.8B. Notably, there have been only three quarterly goods deficits with China over the past five years.
ECB Wunsch inclined to do a little bit more
In a radio interview over the weekend, Pierre Wunsch, a hawkish member of ECB Governing Council, signaled that more action may be needed to address the issue of "very persistent" inflation in Eurozone.
"I'm inclined to say we maybe need to do a little bit more," Wunsch stated on Belgian public radio, leaving the door open for additional monetary policy adjustments.
Wunsch clarified that it's too soon to talk about a complete stop in tightening. He added that he does not expect inflation to come back to ECB's target of 2% before 2025.
EUR/USD Is Still At Risk of More Downsides
Key Highlights
- EUR/USD trimmed gains and retested the 1.0780 support.
- It traded below a bullish trend line with support near 1.0800 on the 4-hour chart.
- GBP/USD is also moving lower below the 1.2650 support.
- USD/JPY is eyeing a fresh increase toward the 147.40 level.
EUR/USD Technical Analysis
The Euro attempted an upside correction above the 1.0820 resistance against the US Dollar. EUR/USD climbed above 1.0880 but struggled to surpass 1.0950.
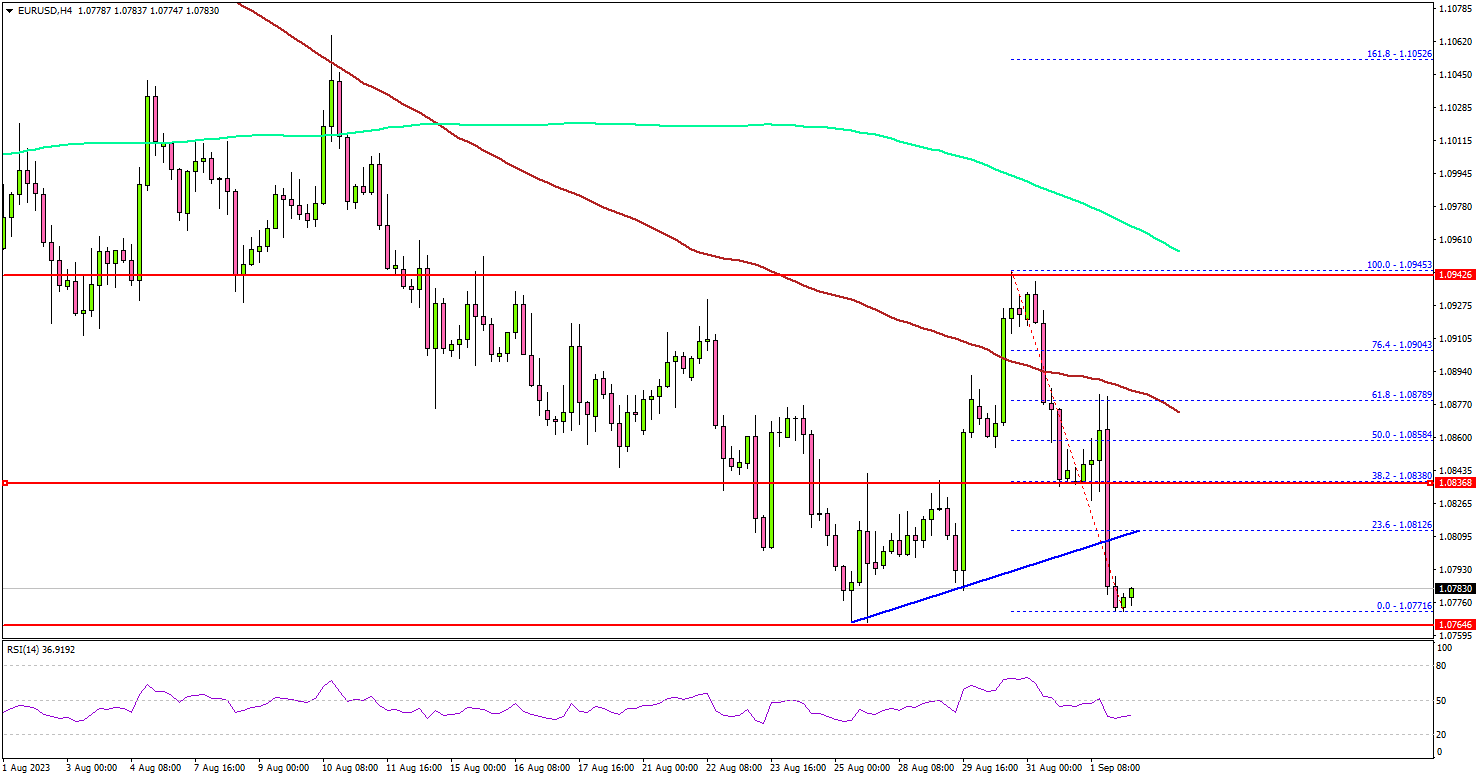
Looking at the 4-hour chart, the pair peaked near 1.0945 and started a fresh decline. It trimmed all gains and traded below the 1.0850 level. Besides, it traded below a bullish trend line with support near 1.0800.
The pair is now retesting the 1.0780 support zone, and trading below the 100 simple moving average (red, 4 hours) and the 200 simple moving average (green, 4 hours).
On the upside, an initial resistance is near the 1.0810 level. The first major resistance is near the 1.0840 level. A close above 1.0840 could start a decent increase. In the stated case, the pair could rise toward the 1.0950 level. Any more gains could send the pair toward the 1.1000 level.
If not, the pair might start a fresh decline below the 1.0780 support. The next key support is seen near the 1.0750 level.
If there is a move below 1.0750, the pair could dive toward 1.0710. Any more losses might send the pair toward the 1.0650 level.
Looking at GBP/USD, the pair declined below the 1.2650 level and there could be more downsides in the near term.
Economic Releases
- ECB's President Lagarde speech.
WTI Oil Technical: Risk of Countertrend Setback After Rallying a Year-to-Date High
- Erased prior two weeks of consecutive losing streaks to trade a current year-to-date closing high of US$86.31 per barrel printed on last Friday, 1 September.
- Price actions are oscillating within short-term and medium-term uptrend phases.
- Hourly technical indicators (RSI & Bollinger Bands Bandwidth) are suggesting the risk of an imminent minor pull-back in price actions after last week’s strong upside reversal.
- Watch the key short-term pivotal resistance at US$87.25 per barrel.
The price actions of West Texas Oil (a proxy of WTI crude oil futures) have managed to snap its prior two weeks of consecutive losing streak and cleared above the US$84.90 resistance as highlighted in our previous report. Also, it recorded a weekly gain of +7.35% for the week ended last Friday, 1 September.
Rallied to a 10-month high
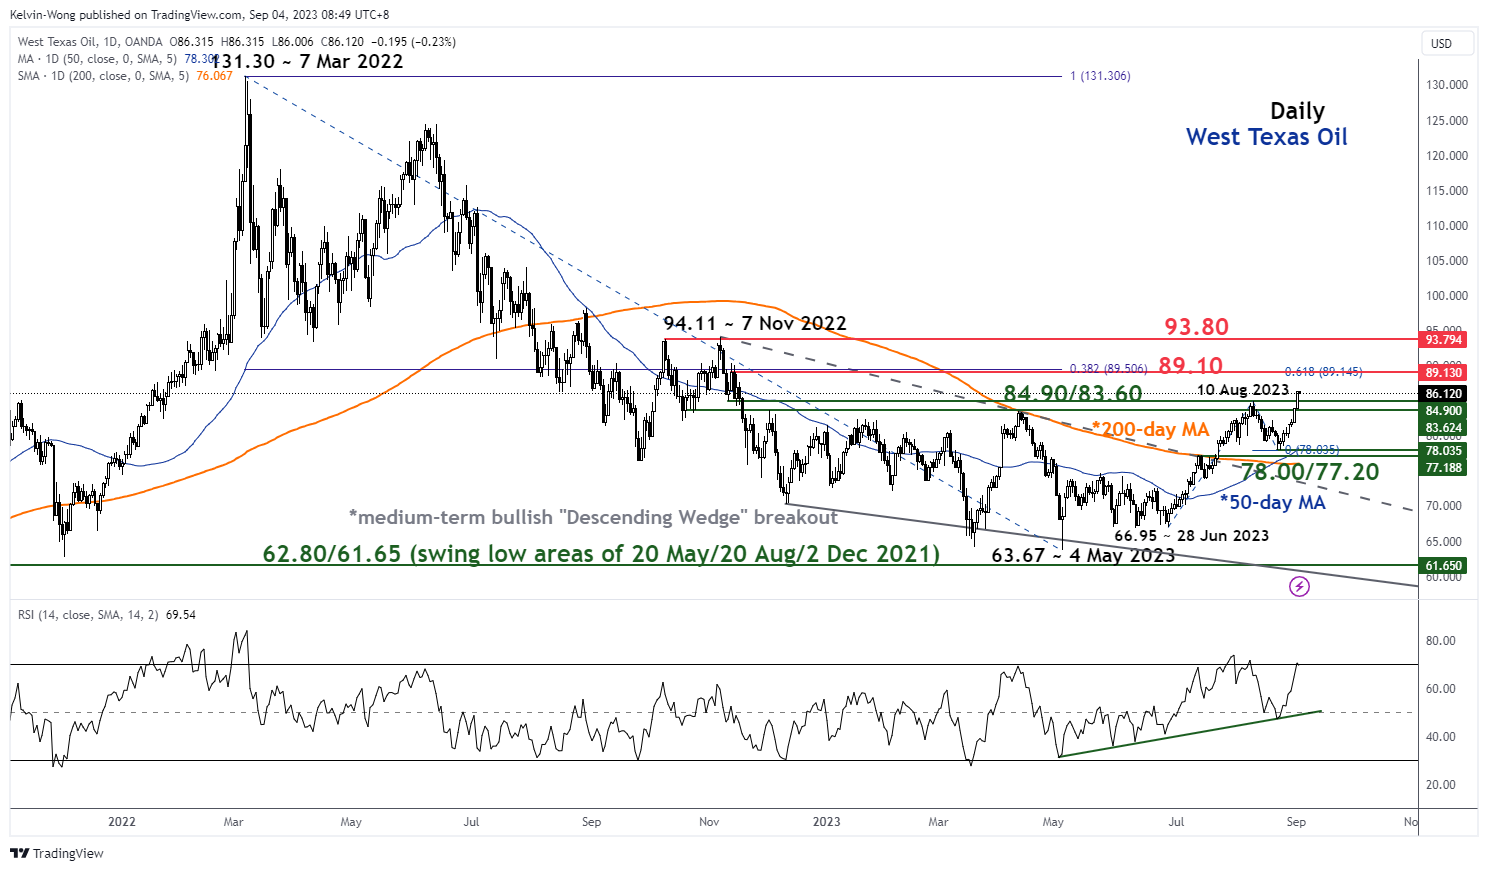
Fig 1: West Texas Oil medium-term trend as of 4 Sep 2023 (Source: TradingView, click to enlarge chart)
In addition, last Friday’s bullish momentum has allowed it to surpass its recent medium-term swing high of US$84.92 per barrel printed on 10 August 2023 and notched a current year-to-date closing high of US$86.31 on last Friday, also its highest level since 15 November 2022.
In addition, current price actions have managed to trade above their respective 20, 50, and 200-day moving averages which indicates that West Texas Oil is oscillating within short-term and medium-term uptrend phases.
Risk of an imminent minor pull-back in price actions
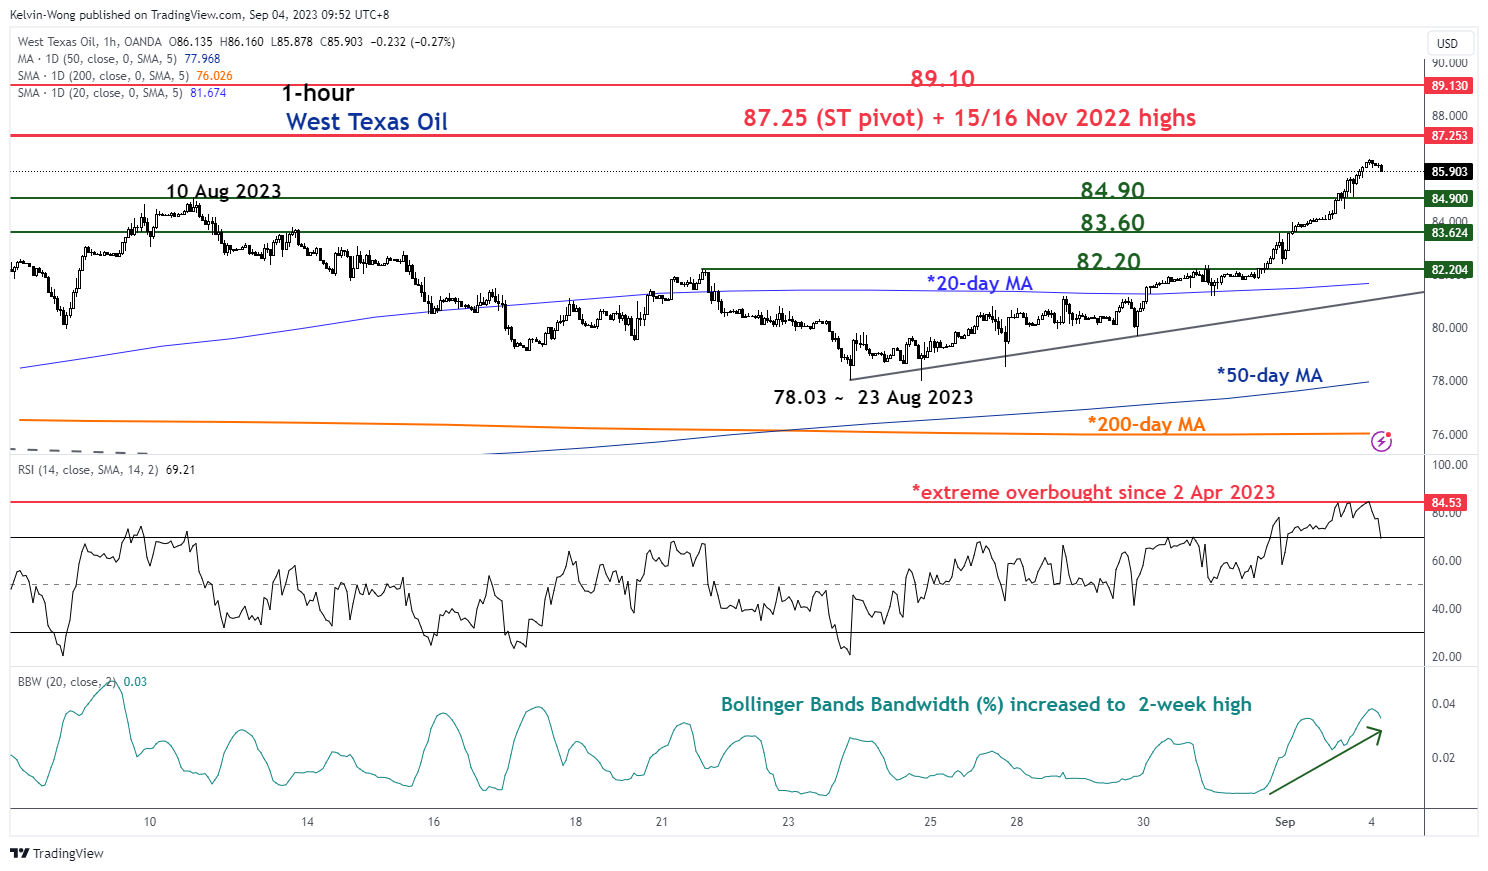
Fig 2: West Texas Oil minor short-term trend as of 4 Sep 2023 (Source: TradingView, click to enlarge chart)
However, the current up move of +10.7% from its 23 August 2023 low of US$78.03 to its 1 September 2023 high of US$86.36 seems overstretched which suggests that the current short-term uptrend phase is due for a potential minor pull-back/setback.
Two key technical conditions are advocating this potential minor pull-back/setback scenario for West Texas Oil within its ongoing short to medium-term uptrend phases.
Firstly, the hourly RSI oscillator has exploded to an extreme overbought condition of 84.53, its highest level since 2 April 2023. Secondly, the hourly Bollinger Bands Bandwidth (%) has increased to a two-week high which indicates a significant expansion in short-term volatility.
An expansion in short-term volatility as indicated by the widening of the hourly Bollinger Bands Bandwidth (%) tends to lead to a normalization of such a heightened level of volatility in the next few trading sessions which supports an imminent potential minor pull-back/setback for price actions.
Watch the US$87.25 key short-term pivotal resistance to maintain the potential minor pull-back/setback scenario for West Texas Oil towards the intermediate supports at US$84.90 and US$83.60.
However, a clearance above US$87.25 invalidates the minor bearish tone for a continuation of the bullish impulsive up move sequence to see the next resistance at US$89.10 (Fibonacci retracement/extension cluster; 38.2% Fibonacci retracement of the major downtrend from 7 March 2022 high to 4 May 2023 low & 0.618 Fibonacci extension of the medium-term uptrend from 28 June 2023 low to 10 August 2023 high projected to 23 August 2023 low).
NZDUSD Wave Analysis
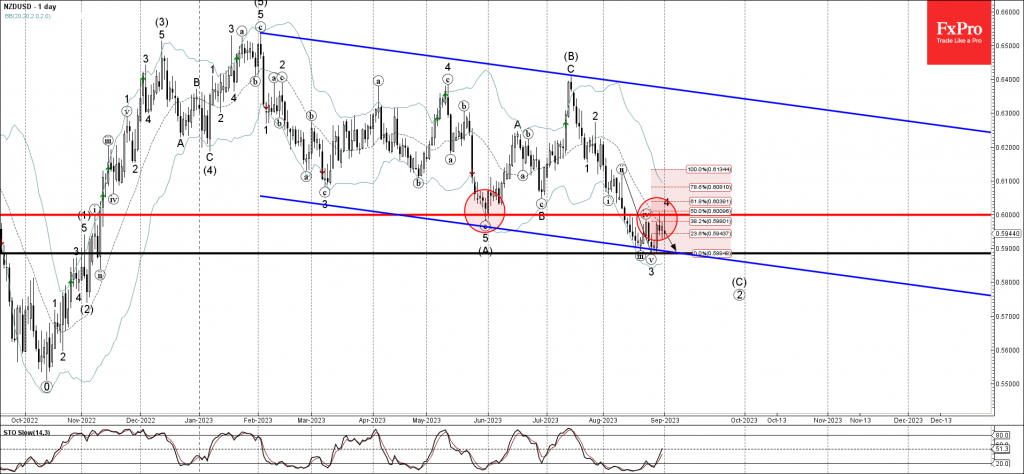
- NZDUSD reversed from resistance level 0.6000
- Likely to fall to support level 0.5900
NZDUSD currency pair recently reversed down from the strong round resistance level 0.6000 (former multi-month support from June), coinciding with the 20-day moving average and the 50% Fibonacci correction of the downward impulse from the start of August.
The downward reversal from the resistance level 0.6000 stopped the wave 4 of the active sharp downward impulse wave C from July.
Given the overriding daily downtrend, NZDUSD can be expected to fall further toward the next support level 0.5900 (low of the previous impulse wave 3).
USDJPY Wave Analysis
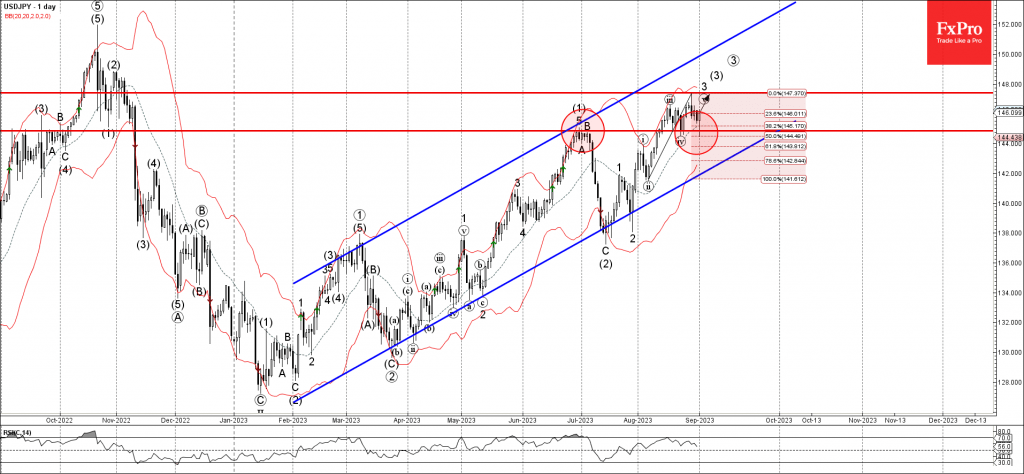
- USDJPY reversed from support level 144.85
- Likely to test resistance level 147.40
USDJPY currency pair recently reversed up from the support level 144.85 (former resistance from the end of June), intersecting with the 50% Fibonacci correction of the upward impulse from the start of August.
The upward reversal from the support level 144.85 continues the active impulse waves 3 and (3).
Given the strong daily uptrend, USDJPY can be expected to rise further toward the next resistance level 147.40 (previous monthly high from August).
Forex and Cryptocurrencies Forecast
EUR/USD: No to Rate Hike, Yes to Dollar Appreciation!
Market participants continue to scrutinize the macroeconomic backdrop in the United States, attempting to discern (or speculate) whether the Federal Reserve will proceed with further increases to the federal funds rate. Following disappointing consumer confidence reports, weak ADP labour market data, and a slowdown in economic growth in Q2, market chatter has shifted towards the spectre of recession and the potential for a dovish pivot by the American regulator. U.S. economic growth currently remains above expectations. However, the revised GDP assessment still disappointed markets, as it fell short of initial projections.
On the other hand, household expenditures increased by 0.8% month-over-month, the highest rate since January. The Personal Consumption Expenditures (PCE) Index, the inflation indicator most closely watched by the Federal Reserve, added 0.2% month-over-month for the second consecutive month. While the growth is modest, it is growth, nonetheless. The core PCE rose by 4.2% year-over-year, aligning with forecasts but exceeding the previous month's figure of 4.1%.
The labour market situation has transitioned from "consistently strong" to "potentially challenging." The number of open job vacancies, as measured by the JOLTS report, dipped to 8.827 million in July for the first time in a long while. For over a year, it had mostly stayed above 10 million, a threshold figure for the Federal Reserve in assessing the strength of the labour market. Additionally, the number of initial unemployment claims increased by 228,000 last week.
The data released on Friday, September 1st, further muddled market forecasts. On Thursday, all signs pointed to a cooling labor market. However, contrary to expectations of 170K, the number of new jobs created in the non-farm sector (NFP) rose significantly from 157K to 187K. In other words, the news is good. On the flip side, the unemployment rate also increased, from 3.5% to 3.8% (with a forecast of 3.5%). So, the news is bad. Additionally, the U.S. Manufacturing Purchasing Managers' Index (PMI) also increased, from a previous level of 46.4 and expectations of 47.0, to an actual figure of 47.6. Once again, the news is good. However, it's worth noting that a PMI above 50.0 indicates an improving economic situation, while below 50.0 suggests deterioration. So, is the news bad again?
Overall, these mixed indicators led to a divergent market reaction. On one hand, the U.S. Dollar Index (DXY) began gradually improving its position from Wednesday, August 30th, sharply accelerating its gains on Friday. On the other hand, the likelihood of a rate hike at the upcoming Federal Reserve meeting on September 19-20 dropped to 12%. Contributing to the reduced rate hike expectations were the somewhat divergent statements from Federal Reserve officials. We have already covered what Federal Reserve Bank of Boston President Susan Collins, Federal Reserve Bank of Philadelphia President Patrick Harker, and Federal Reserve Chairman Jerome Powell said at the global central banks symposium in Jackson Hole in our previous review. Now, we add that Federal Reserve Bank of Atlanta President Raphael Bostic believes that rates are already at a restrictive level and that further hikes could inflict additional pain on the U.S. economy.
As for the Eurozone economy, the latest statistics indicate that inflation has ceased to decline, while the money supply contracted due to falling lending volumes. Contrary to Bloomberg experts' forecast of 5.1%, the year-over-year Consumer Price Index (CPI) remained stable at 5.3%. In Germany, the region's largest economy, the monthly CPI also remained static at 0.3%.
In such a situation, one would expect the European Central Bank (ECB) to continue tightening monetary policy. However, the threat of stagflation appears to concern the regulator more than rising prices. Even such a hawkish figure as ECB Executive Board Member Isabel Schnabel confirmed that the economic outlook for the Eurozone is more dire than initially thought, suggesting that the region could be on the brink of a deep or prolonged recession.
Her comments are supported by the state of the labour market. The overall unemployment rate in the Eurozone remains stubbornly high, holding steady at 6.4%. In Germany, the rate has been gradually increasing on a quarterly basis, slowly reverting to levels seen during the COVID-19 pandemic.
It appears that both regulators, the Federal Reserve and the European Central Bank, are losing their appetite for further monetary tightening and are prepared to end their cycles of monetary restriction (or at least put rate hikes on hold). In such a scenario, it is logical that weaker economies stand to lose. Strategists at JP Morgan and Bank of America anticipate the euro to reach $1.0500 by the end of the current year, while BNP Paribas projects an even lower level of $1.0200.
Starting the five-day trading period at 1.0794, EUR/USD closed nearly where it began, settling at 1.0774. As of the time of writing this review, the evening of September 1, 50% of experts are bullish on the pair in the near term, 20% are bearish, and 30% have taken a neutral stance. Regarding technical analysis, nothing has changed over the past week. All trend indicators and oscillators on the D1 timeframe remain 100% in favour of the U.S. currency and are coloured red. Additionally, 15% still indicate that the pair is oversold. The nearest support levels for the pair are situated around 1.0765, followed by 1.0665-1.0680, 1.0620-1.0635, and 1.0515-1.0525. Bulls will encounter resistance at 1.0800, followed by 1.0835-1.0865, 1.0895-1.0925, 1.0985, 1.1045, 1.1090-1.1110, 1.1150-1.1170, 1.1230, and 1.1275-1.1290.
Among the events to watch for the upcoming week, attention should be paid to the speech by ECB President Christine Lagarde on Monday, September 4. On Wednesday, September 6, retail sales data for the Eurozone will be released, along with the U.S. Services PMI figures. On Thursday, September 7, revised Q2 GDP figures for the Eurozone will be published, as will the customary U.S. initial jobless claims numbers. And rounding out the workweek, on Friday, September 8, we will learn about the state of inflation (CPI) in Germany, the main engine of the European economy.
GBP/USD: Will the Rate Not Increase After All?
Earlier in the EUR/USD overview, we highlighted the central banks' main question: what's more important – defeating inflation or preventing the economy from sliding into a recession? Although the annual inflation rate in the United Kingdom has dropped from 7.9% to 6.8% (the lowest since February 2022), inflation remains the highest among the G7 countries. Moreover, the core CPI indicator remained at 6.9% YoY, just as it was a month earlier. This is only 0.2% below the peak set two months prior. Additionally, rising energy prices pose a threat for new inflationary surges.
Such data and outlooks, according to several analysts, should have compelled the Bank of England (BoE) to continue raising interest rates. However, there's another factor tipping the scales in the opposite direction. August marked a further deepening of the downturn in the UK's manufacturing sector. Manufacturers in the country reported a weakening economic backdrop, as demand suffers due to rising interest rates, a cost-of-living crisis, export sector losses, and market outlook concerns. According to S&P Global, intermediate goods producers are particularly hard-hit — the B2B sector is facing the steepest decline in production volumes. This affects both new orders and staffing levels, which are being cut back.
The final Purchasing Managers' Index (PMI) for August stood at just 43.0. The main PMI figure plummeted to a 39-month low, as production volumes and new orders contracted at rates rarely seen, except during major periods of economic stress, such as the global financial crisis of 2008-2009 and pandemic-related lockdown measures.
Against this bleak backdrop, survey results indicate that the country's policymakers will increasingly focus on concerns about the state of the economy rather than on the issue of raising interest rates. The Bank of England's Chief Economist, Huw Pill, stated that while there's no room for complacency regarding inflation, he himself would prefer to keep the rate steady for a more extended period. He announced that at the upcoming BoE meeting on September 21, he will vote to maintain the current rate at 5.25%. Following such a statement, the previously described rule comes into effect – if both regulators lose their appetite for further rate hikes, the weaker economy loses. In the case of the UK/US pair, the former turns out to be the weaker link.
We have previously mentioned that experts at Scotiabank do not rule out the possibility of GBP/USD falling further to 1.2400. Analysts at ING, the largest banking group in the Netherlands, believe that should the dollar strengthen, the pair may find support around 1.2500. Their colleagues at Singapore's United Overseas Bank anticipate that "as long as the pound remains below the strong resistance level of 1.2720, it is likely to weaken to 1.2530, and possibly even to 1.2480."
The pair closed last week at 1.2585. Looking at the near future, 40% of experts anticipate an upward correction, 20% foresee further dollar strengthening, and the remaining 40% expect sideways movement. Among the oscillators on the D1 timeframe, 90% are coloured red and 10% green. As for the trend indicators, the ratio between red and green is 85% to 15%, favouring red. If the pair moves south, it will encounter support levels and zones at 1.2560-1.2575, 1.2545, 1.2500-1.2510, 1.2435-1.2450, 1.2300-1.2330, 1.2190-1.2210, 1.2085, 1.1960, and 1.1800. In the event of an upward movement, the pair will face resistance at 1.2620-1.2635, 1.2690-1.2710, 1.2760, 1.2800-1.2815, 1.2880, 1.2940, 1.2980-1.3000, 1.3050-1.3060, 1.3125-1.3140, and 1.3185-1.3210.
As for significant events concerning the state of the United Kingdom's economy, particular attention should be paid to the Inflation Report hearings scheduled for Thursday, September 7.
USD/JPY: Awaiting Currency Interventions
Generally speaking, if we review the week's outcomes, it can be stated that the Dollar Index (DXY) reclaimed all three pairs, EUR/USD, GBP/USD, and USD/JPY, on Friday, September 01, nearly returning them to where they began the five-day period. This occurred despite significant volatility. For instance, starting at the 146.40 yen mark per dollar, the Japanese currency reached a peak of 147.36, then declined to 144.44, with the final note being played at the 146.21 level.
Fresh statistics indicate that industrial activity in Japan is experiencing a downturn. This is evident from the Purchasing Managers' Index (PMI) data for the manufacturing sector, which fell from 49.7 to 49.6 in a month, remaining below the threshold of 50 for the third consecutive month. The 50 mark separates expansion from contraction. Against this backdrop, USD/JPY maintains a bullish sentiment, although this could be disrupted by currency interventions from the Japanese authorities. Officials assure that they remain vigilant. For instance, Japan's Finance Minister, Sunaiti Suzuki, recently conducted another verbal (non-financial) intervention. On September 01, he stated that markets should determine currency exchange rates themselves, while emphasizing that sharp fluctuations are undesirable. He also mentioned closely monitoring currency movements. Whether such "incantations" will calm investors concerning the yen remains uncertain. It is plausible that concrete currency interventions, rather than verbal ones, might be required to provide evidence, much like what occurred last November.
In terms of the near-term outlook, much like the previous pairs, the majority of analysts believe that the DXY has gained sufficiently and that it might be time for it to retrace southward, at least temporarily. Regarding USD/JPY, 80% of analysts have voted in favour of such a trend reversal. The remaining 20% continue to hold faith in the dollar's potential for further pair growth. On the D1 timeframe, all 100% of trend indicators are painted in green. Among oscillators, 65% are in this state, while 10% are in red, and the remaining 25% have assumed a neutral position.
The nearest support level is situated in the range of 146.10, followed by 145.50-145.70, 144.90, 144.50, 143.75-144.05, 142.90-143.05, 142.20, 141.40-141.75, 140.60-140.75, 139.85, 138.95-139.05, 138.05-138.30, 137.25-137.50. The closest resistance lies at 146.50-146.60, followed by 146.90, 147.25-147.35, 148.45-148.85, 150.00, and finally, the October 2022 high of 151.90.
Friday, September 08, stands out in the economic calendar for the upcoming week as the day when the GDP figures for Japan's Q2 2023 will be released. There are no other significant statistical releases planned concerning the state of the Japanese economy for the upcoming week.
CRYPTOCURRENCIES: Why Bitcoin Soared and Why It Fell Again
The beginning of the past week was exceptionally dull. Its continuation could have been just as uneventful if not for Grayscale. Currently, Grayscale is the world's largest investment firm managing cryptocurrency assets. And now, it has won an appeal against the U.S. Securities and Exchange Commission (SEC). The judges unanimously deemed the regulator's denial of converting the Bitcoin trust fund into a spot ETF "arbitrary and capricious." The legal battle lasted over a year, and unexpectedly on Tuesday, August 29, the court delivered such a definitive verdict. As a result, within three hours, Bitcoin surged from $26,060 to $28,122, a 7.9% increase, demonstrating the best growth rate in the last 12 months.
Perhaps, the explosive effect could have been even more impressive if not for the insiders. It turned out that someone did know about the court's decision in advance. Just before the court's announcement, this individual placed 30,000 Bitcoins, worth around $780 million, on the exchange. Selling such a volume of coins at the price peak is rather challenging due to low liquidity, thus causing a decline in their selling value. Consequently, the gains of BTC/USD gradually faded away, and it returned to where it started on August 29.
However, despite this decline, many analysts are confident that the current court decision will still have a positive impact on the market. Recall that this summer, eight major financial institutions have already filed applications with the SEC to enter the cryptocurrency market through spot Bitcoin ETFs. Among them are global asset managers like BlackRock, Invesco, and Fidelity. Earlier, the fact that the SEC had previously rejected all similar applications raised concerns. However, everything has changed now following the Grayscale case verdict.
Senior Bloomberg strategist, Eric Balchunas, has already raised his prediction to 95% for ETF approvals within 2024 and to 75% for the possibility of it happening in this year, 2023. According to various estimates, these new funds could attract between $5 billion to $10 billion of institutional investments within the first six months alone, undoubtedly pushing the quotations higher.
Co-founder of Fundstrat, Tom Lee, believes that if a spot Bitcoin ETF is approved, the price could rise to $185,000. On the other hand, Cathy Wood, the CEO of ARK Invest, forecasts a surge in the total cryptocurrency market capitalization to $25 trillion by 2030, representing an increase of over 2100%. Within this projection, ARK Invest's baseline scenario envisions BTC's price rising to $650,000 during this period, while the more optimistic scenario suggests roughly twice that.
The Artificial Intelligence ChatGPT, developed by OpenAI, has proposed its optimistic scenario. It envisions the primary cryptocurrency growing to $150,000 by 2024, $500,000 by 2028, $1 million by 2032, and $5 million by 2050. ChatGPT, however, outlined certain conditions. This growth could only materialize if: the cryptocurrency becomes widely adopted, bitcoin becomes a popular store of value, and the coin is integrated into various financial systems. If these conditions are not met, according to the AI's calculations, by 2050, the coin could be valued anywhere from $20,000 to $500,000.
In general, even the latest figure sounds promising for long-term holders of BTC, whose numbers continue to grow. Research from Glassnode reveals that this figure recently reached a record high, indicating the popularity of the hodling concept, a presence of certain optimism, and potential resistance to market fluctuations.
On the flip side, short-term speculators are exiting the market. According to CryptoQuant, the trading volume of bitcoins has hit its lowest level in five years. "Trading volumes are decreasing amidst a bearish trend, as retail investors depart," explains Julio Moreno, Head of Research at CryptoQuant. "Overall, the market remains lacklustre," asserts Gautam Chhugani, an analyst at Bernstein. "This trend isn't necessarily bearish, but participants are still uninterested in trading, as the market awaits catalysts."
Raoul Pal, CEO of Real Vision Group, one of the world's leading financial media platforms, noted that btc's 30-day volatility has decreased to 20 points. However, based on his observations, historically, such low volatility within two to four months led to a robust surge in the first cryptocurrency. According to the analyst known as Credible Crypto, for a truly potent surge, the bulls need to push the first cryptocurrency's price above the key zone of $29,000-$30,000. For now, a significant portion of traders anticipates a decrease in BTC to more favourable buying levels. Yet, when the price surpasses $30,000, according to Credible Crypto, the Fear of Missing Out (FOMO) phenomenon will come into play, propelling quotations upwards.
To what extent can the price of the flagship cryptocurrency fall in the current situation? September historically has not been favourable for bitcoin. From 2011 to 2022, BTC on average lost about 4.67% of its value during this period.
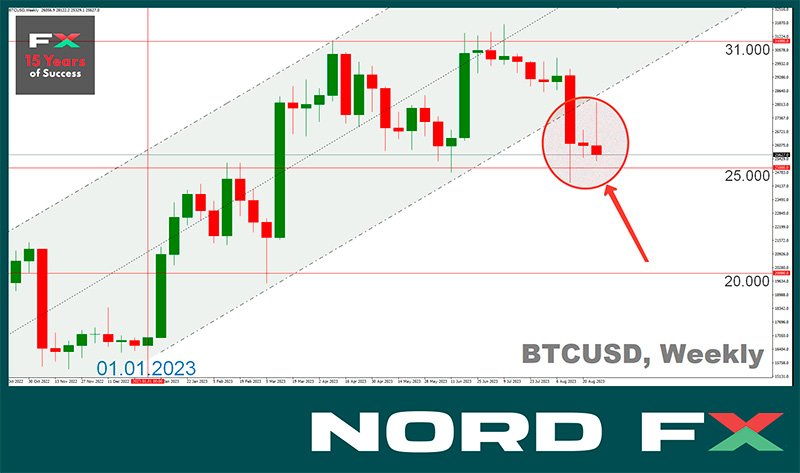
Analyst Justin Bennett believes that the bitcoin price could potentially drop to $14,000. This level acted as strong support from 2018 to 2020. Bennett supports his forecasts with a chart showing that the flagship crypto asset has exited an ascending channel that it had been in for about ten months. Bitcoin failed to overcome resistance in the range of $29,000-$33,000, which led to this breakout. Furthermore, a global economic recession could exacerbate the decline. According to Bennett, since the S&P 500 stock index couldn't replicate the 2022 record of 4,750 points, it could now potentially lose a substantial percentage of its value.
However, despite the aforementioned viewpoints, September could still prove favourable for long-term investments within the "buy on dips" strategy. Bloomberg's Senior Analyst, Mike McGlone, compared metrics of the first cryptocurrency to the stock market and concluded that even a drop to $10,000 wouldn't significantly shake the coin's positions. As an example, the expert cited corporate giant Amazon's stocks, which yielded over 7,000% returns in the last 20 years. Yet, BTC far surpasses this figure having grown around 26,000% since 2011. "Even a return to the $10,000 mark would maintain an unprecedented asset performance," notes McGlone. He emphasizes that bitcoin's trajectory of "mainstream migration" is also crucial, as exchange-traded funds and other instruments characteristic of the traditional market emerge.
In addition to the potential approval of spot bitcoin ETFs, the upcoming halving could also influence the coin's growth. Thanks to these factors, according to TradingShot analysts, BTC/USD could rise to the $50,000 mark by the end of this year. However, at the time of writing this review on the evening of Friday, September 1st, it's trading around $25,750. The overall cryptocurrency market capitalization stands at $1.048 trillion ($1.047 trillion a week ago). The Crypto Fear & Greed Index remains in the Fear zone at a reading of 40 (39 points a week ago)