

Sample Category Title
GBP/USD Daily Outlook
Daily Pivots: (S1) 1.2780; (P) 1.2834; (R1) 1.2904; More...
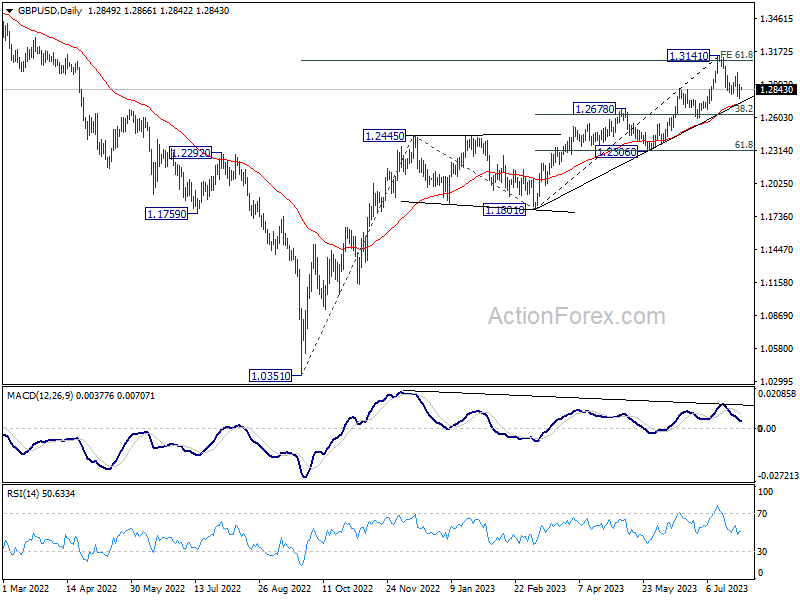
Intraday bias in GBP/USD remains neutral for the moment. Further decline is in favor as long as 1.2994 resistance holds. Break of 1.2761 will target 55 D EMA (now at 1.2720) and below. Nevertheless, on the upside, break of 1.2994 resistance will argue that the pull back has completed, and bring retest of 1.3141 high.
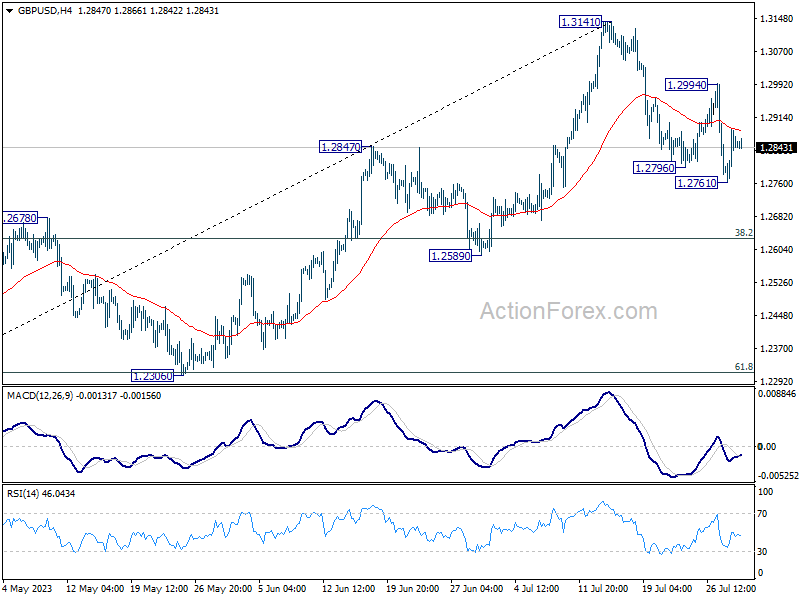
In the bigger picture, as long as 1.2678 resistance turned support holds, rise from 1.0351 (2022 low) is expected to continue. Next target is 100% projection of 1.0351 to 1.2445 from 1.1801 at 1.3895. However, sustained break of 1.2678 will argue that it's at least correcting this rally, with risk of bearish reversal.
EUR/USD Daily Outlook
Daily Pivots: (S1) 1.0958; (P) 1.1003; (R1) 1.1061; More...
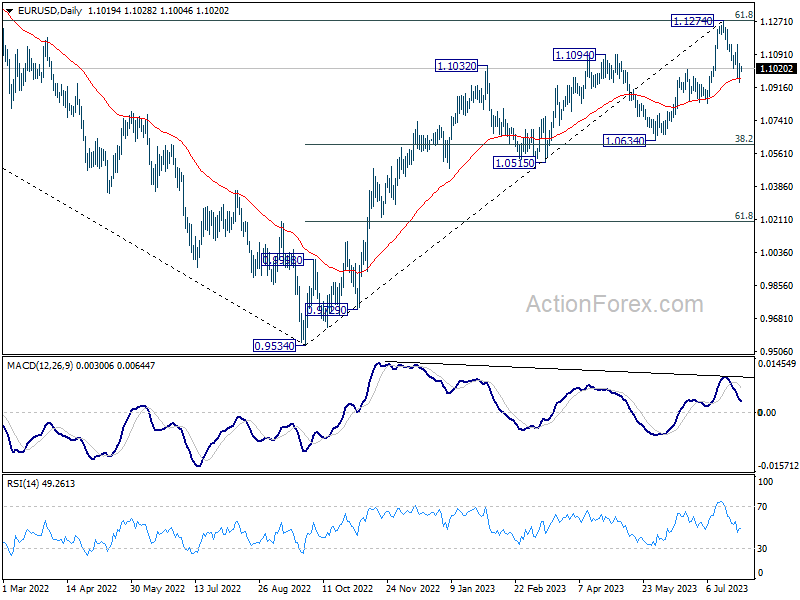
Intraday bias in EUR/USD stays neutral for the moment. Further fall is expected as long as 1.1148 resistance holds. Below 1.0942 will target 1.0832 support next. Nevertheless, break of 1.1148 will argue that the decline has completed and bring retest of 1.1274 high.
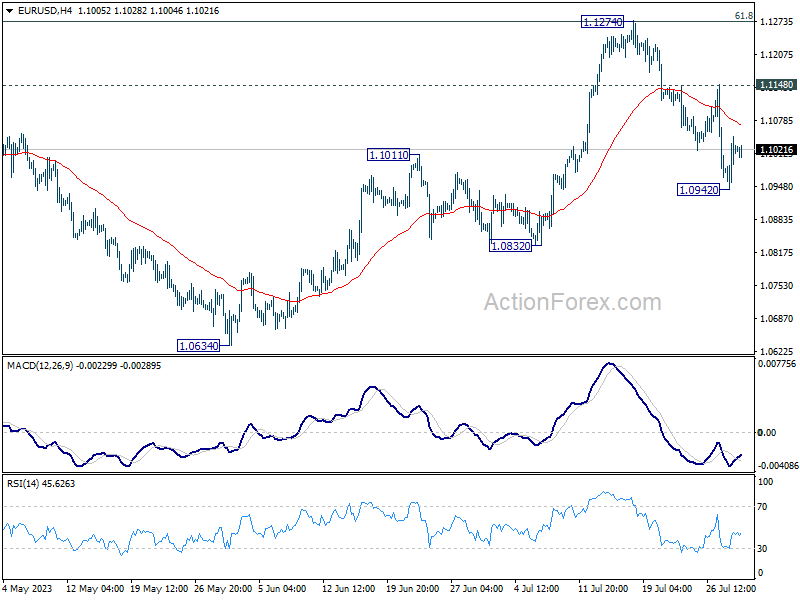
In the bigger picture, a medium term top could be formed at 1.1274, after failing to break through 61.8% retracement of 1.2348 (2021 high) to 0.9534 at 1.1273 decisively, on bearish divergence condition in D MACD. Sustained trading below 55 D EMA (now at 1.0963) will bring deeper correction to 1.0634 cluster support (38.2% retracement of 0.9534 to 1.1274 at 1.0609). Strong support could be seen there, at least on first attempt, to set the range for consolidation.
GBP/USD Attempts Fresh Increase While EUR/GBP Faces Hurdle
GBP/USD is attempting a fresh increase from the 1.2770 region. EUR/GBP is consolidating and remains at risk of more downsides below 0.8545.
Important Takeaways for GBP/USD and EUR/GBP Analysis Today
- The British Pound started a steady increase above the 1.2805 resistance.
- There is a short-term contracting triangle forming with resistance near 1.2860 on the hourly chart of GBP/USD at FXOpen.
- EUR/GBP declined below the 0.8600 and 0.8580 support levels.
- There is a key breakout pattern forming with support near 0.8560 on the hourly chart at FXOpen.
GBP/USD Technical Analysis
On the hourly chart of GBP/USD at FXOpen, the pair started a fresh decline from the 1.3000 zone. As mentioned in the previous analysis, the British Pound would remain at risk of more downsides if it cleared the 1.2840 and 1.2805 levels against the US Dollar.
The pair extended its decline and tested the 1.2770 zone. A low is formed near 1.2762, and the pair is now attempting a fresh increase. There was a move above the 23.6% Fib retracement level of the downward move from the 1.2995 swing high to the 1.2762 low.
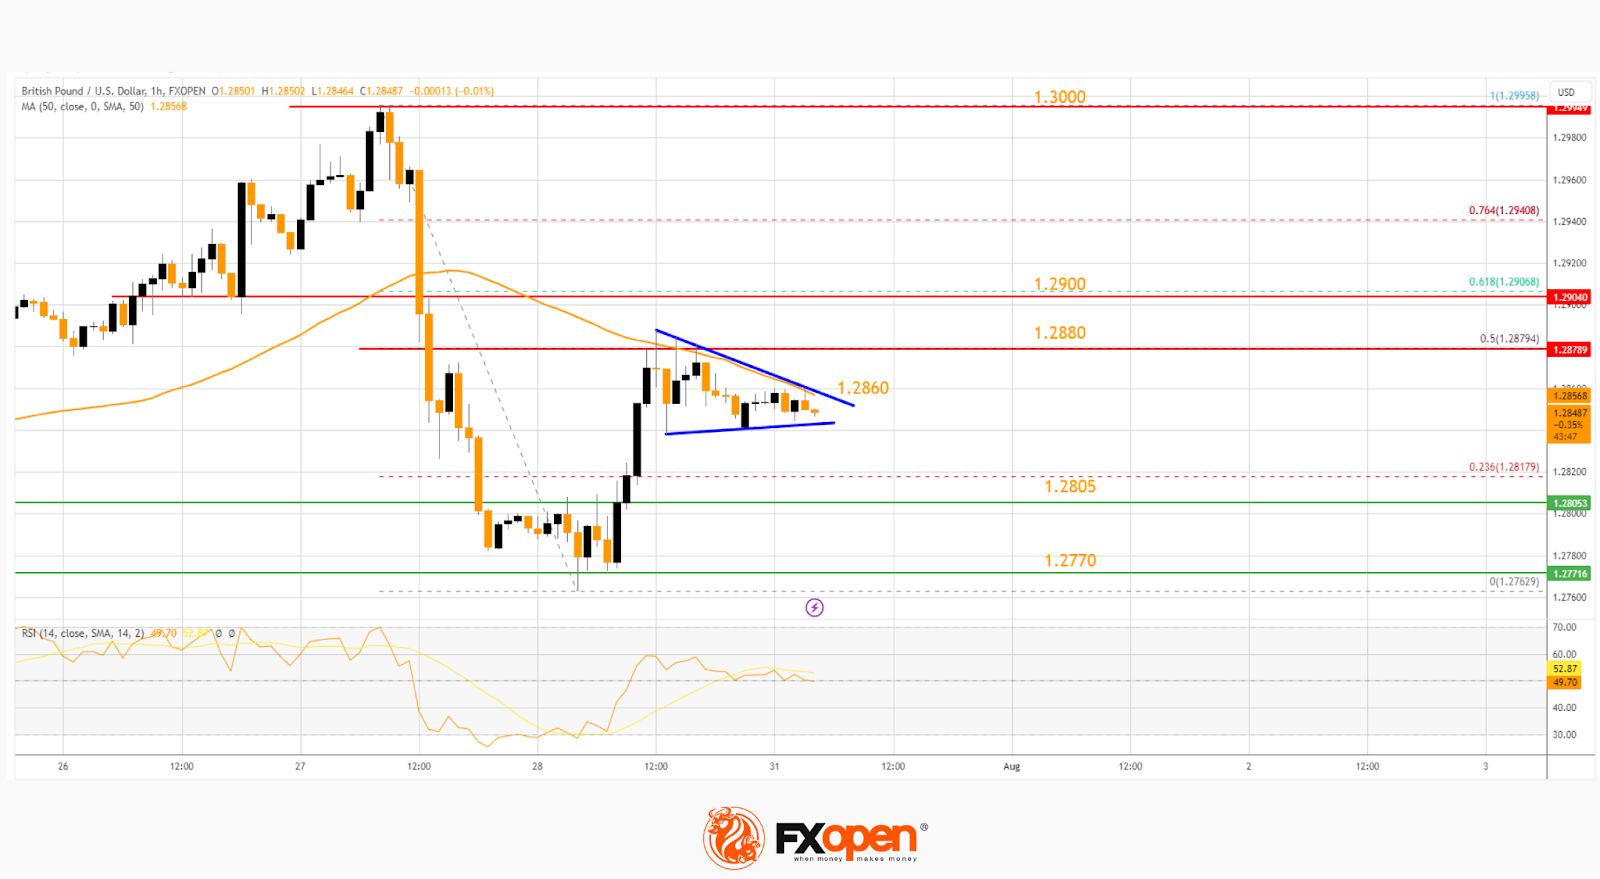
The pair is now consolidating below the 50-hour simple moving average. The GBP/USD chart indicates that the pair is facing resistance near a short-term contracting triangle at 1.2860.
The next major resistance is near the 50% Fib retracement level of the downward move from the 1.2995 swing high to the 1.2762 low at 1.2880. The main breakout zone could be 1.2900. If the RSI moves above 60 and the pair climbs above 1.2900, there could be another rally. In the stated case, the pair could rise toward the 1.3000 level or even 1.3050.
On the downside, there is a major support forming near 1.2805. If there is a downside break below it, the pair could accelerate lower.
The next major support is near the 1.2770 zone, below which GBP/USD could test 1.2740. Any more losses could lead the pair toward 1.2650.
EUR/GBP Technical Analysis
On the hourly chart of EUR/GBP at FXOpen, the pair started a fresh decline from the 0.8640 resistance. The Euro traded below the 0.8600 support and moved into a bearish zone against the British Pound.
The EUR/GBP chart suggests that the pair settled below the 50-hour simple moving average and 0.8580. A low is formed near 0.8545, and the pair is now consolidating losses. The RSI is stuck near 50.
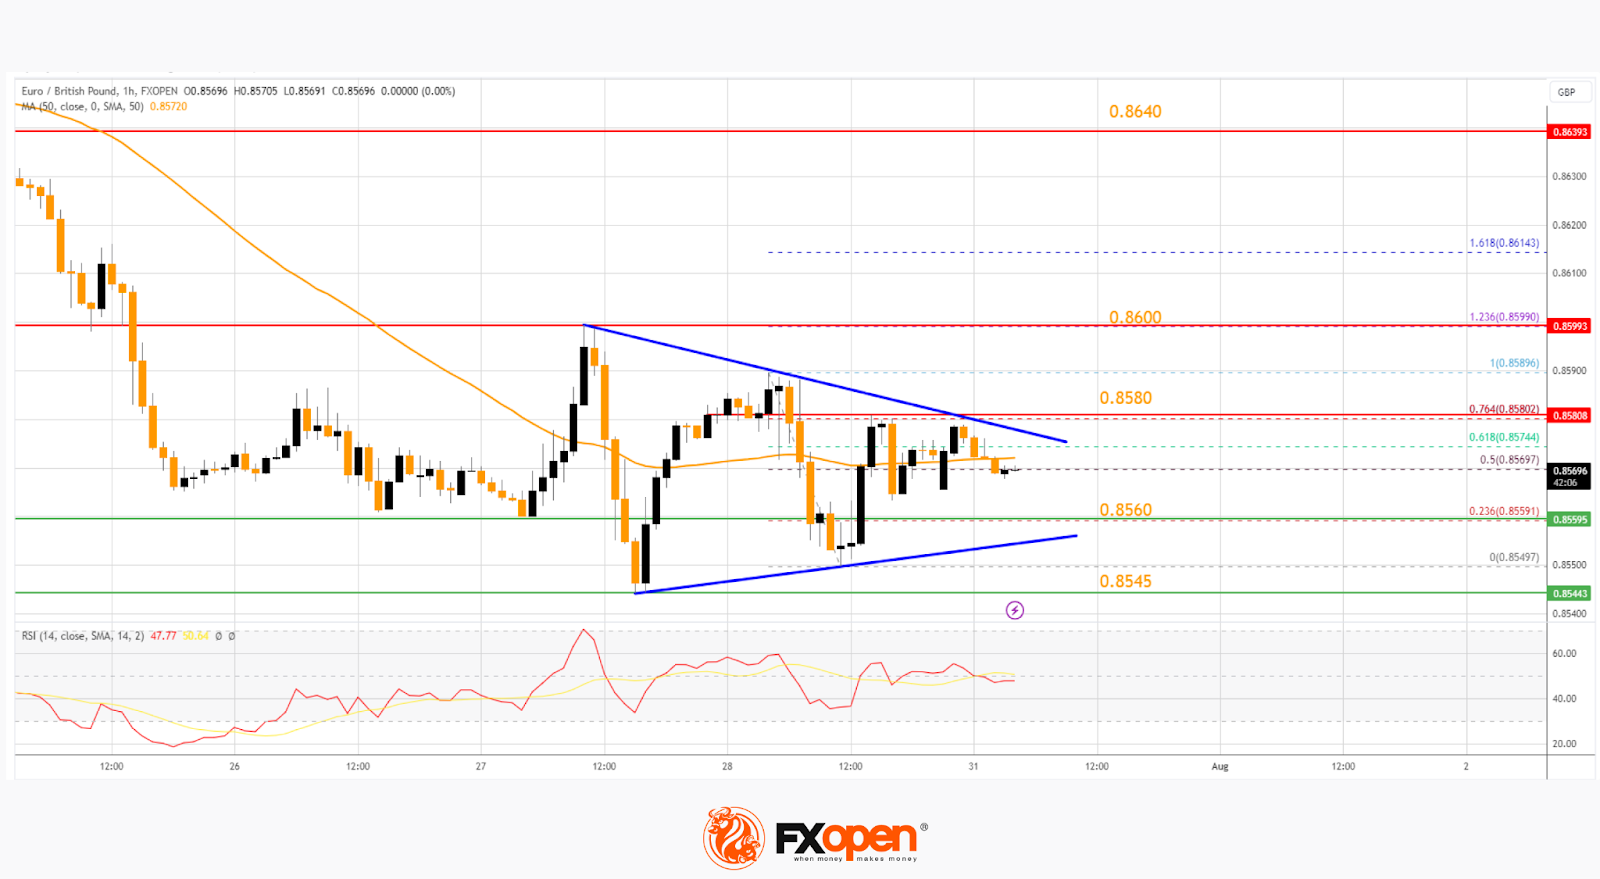
Immediate resistance is near a key breakout pattern at 0.8575. It coincides with the 61.8% Fib retracement level of the downward move from the 0.8599 swing high to the 0.8549 low.
The next major resistance for the bulls is near the 76.4% Fib retracement level of the downward move from the 0.8599 swing high to the 0.8549 low at 0.8580. A close above the 0.8580 level might accelerate gains.
In the stated case, the bulls may perhaps aim for a test of 0.8600. Any more gains might send the pair toward the 0.8640 level.
If there is no move below 0.8580, EUR/GBP could continue to move down. Immediate support sits at 0.8560. The next major support is near 0.8545. A downside break below 0.8545 might call for more downsides. In the stated case, the pair could drop toward the 0.8500 support level.
AUD/USD Daily Report
Daily Pivots: (S1) 0.6664; (P) 0.6742; (R1) 0.6787; More...
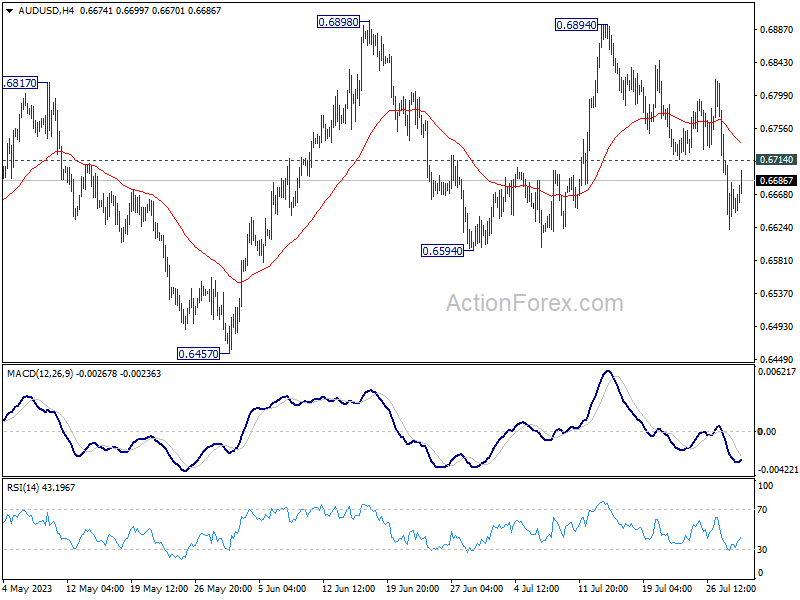
Intraday bias in AUD/USD is turned neutral with current recovery. While deeper fall cannot be ruled out, strong support should be seen from 0.6594 to complete to corrective pattern from 0.6898. On the upside, break of 0.6714 support turned resistance will turn bias back to the upside for retesting 0.6894/8 resistance zone. However, sustained break of 0.6594 will dampen this will and bring deeper fall towards 0.6457.
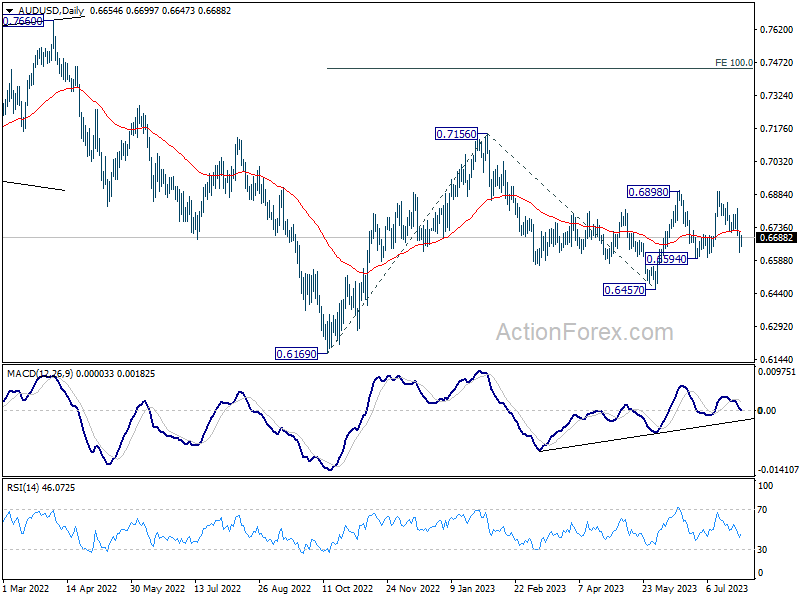
In the bigger picture, outlook is mixed for now as AUD/USD failed to sustain above both 55 D EMA (now at 0.6720) and 55 W EMA (now at 0.6784). On the upside, break of 0.65898 resistance will solidify the case that down trend from 0.8006 (2021 high) has already completed, and target 0.7156 resistance for confirmation. However, break of 0.6457 will likely resume the down trend through 0.6169 (2022 low).
USD/CAD Daily Outlook
Daily Pivots: (S1) 1.3219; (P) 1.3236; (R1) 1.3270; More....
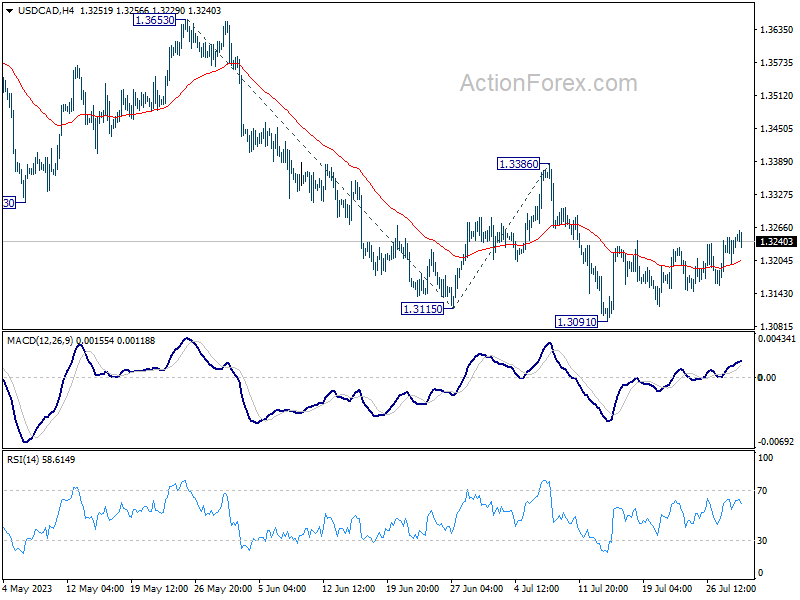
Intraday bias in USD/CAD remains neutral as sideway consolidation continues. Outlook stays bearish for further decline with 1.3385 resistance intact. On the downside, break of 1.3091 will resume larger fall and target 61.8% projection of 1.3653 to 1.3115 from 1.3386 at 1.3054. However, firm break of 1.3386 will indicate near term reversal and turn outlook bullish.
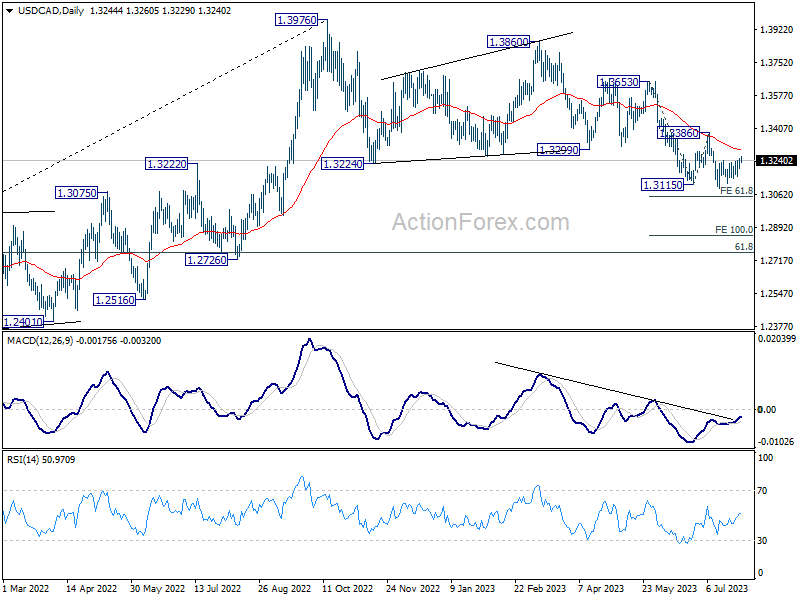
In the bigger picture, price actions from 1.3976 are viewed as a correction to up trend from 1.2005 (2021 low) only. But even so, deeper decline is expected as long as 1.3386 resistance holds. Further fall could be seen to 61.8% retracement of 1.2005 to 1.3976 at 1.2758. Meanwhile, break of 1.3386 will be a sign that the correction has completed and bring stronger rally back to retest 1.3976.
EUR/GBP Daily Outlook
Daily Pivots: (S1) 0.8551; (P) 0.8571; (R1) 0.8591; More...
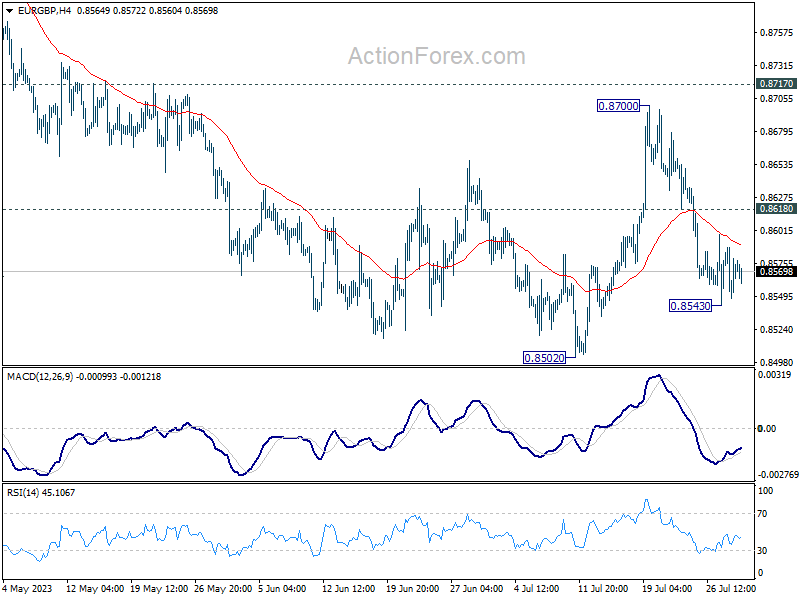
Intraday bias in EUR/GBP stays neutral for the moment. On the downside, below 0.8543 will target a test on 0.8502 low. Decisive break there will resume larger decline from 0.8977. On the upside, above 0.8618 minor resistance will turn bias back to the upside for 0.8700, and possibly further to 0.8717 key support turned resistance.
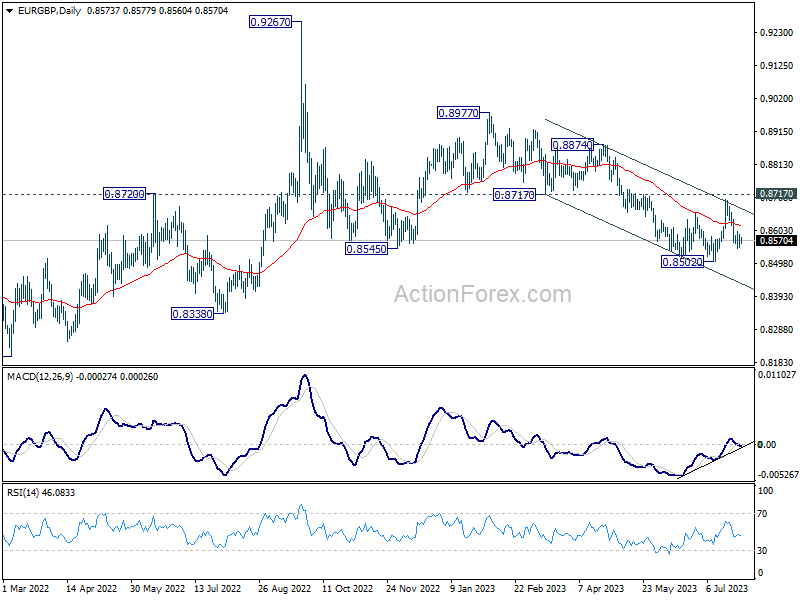
In the bigger picture, the down trend from 0.9267 (2022 high) is seen as part of the long term range pattern from 0.9499 (2020 high). Firm break of 0.8717 support turned resistance will argue that it has completed with three waves down to 0.8502. Further break of 0.8977 will bring retest of 0.9267 high. Nevertheless, rejection by 0.8717, followed by break of 0.8502 will resume the decline towards 0.8201 (2022 low).
EUR/AUD Daily Outlook
Daily Pivots: (S1) 1.6426; (P) 1.6502; (R1) 1.6650; More...
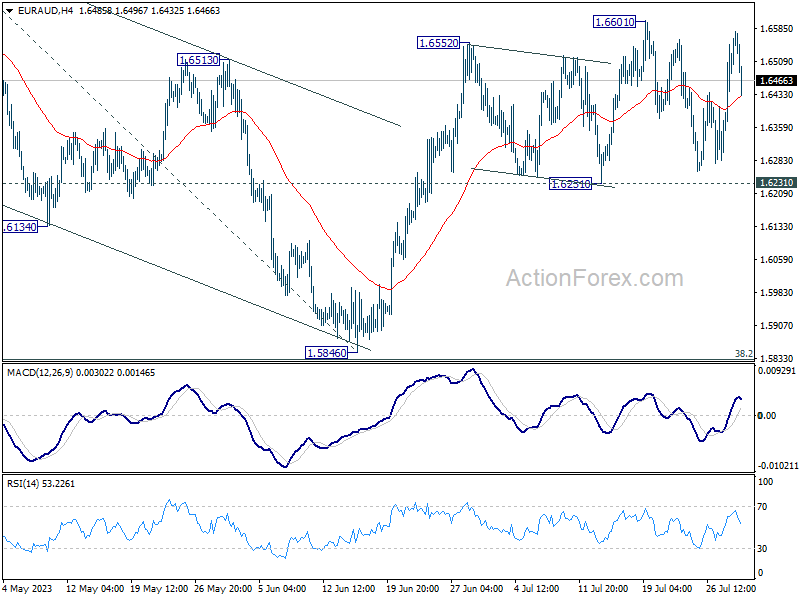
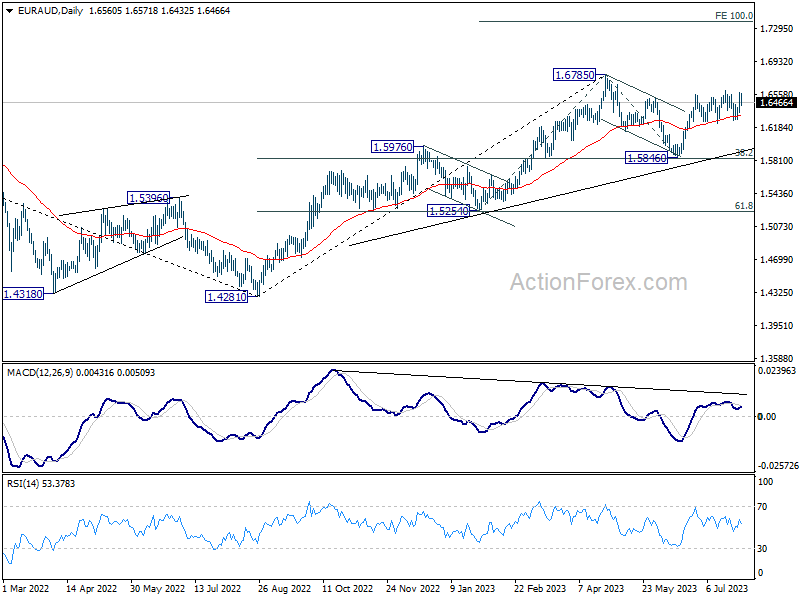
Intraday bias in EUR/AUD remains neutral as sideway trading continues. Further Further rally is expected with 1.6231 support intact. Firm break of 1.6601 will solidify the case that corrective fall from 1.6785 has completed, and target a retest on this high next.
In the bigger picture, with 38.2% retracement of 1.4281 to 1.6785 at 1.5828 intact, rally from 1.4281 is still in progress. Firm break of 1.6785 will confirm rise resumption. Next target is 100% projection of 1.5254 to 1.6785 from 1.5846 at 1.7377. On the other hand, rejection by 1.6785 will extend the corrective pattern with another fall leg. But outlook will stay bullish as long as 1.5828 holds.
EUR/CHF Daily Outlook
Daily Pivots: (S1) 0.9546; (P) 0.9570; (R1) 0.9616; More...
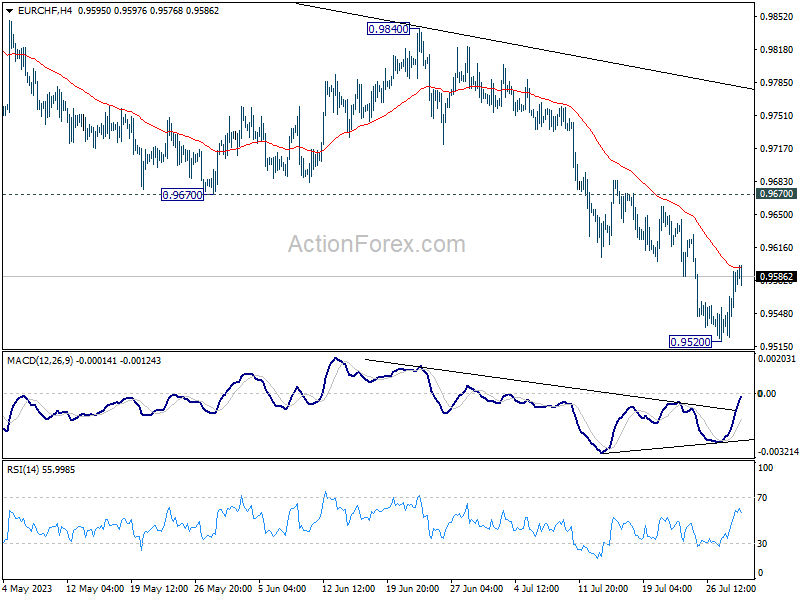
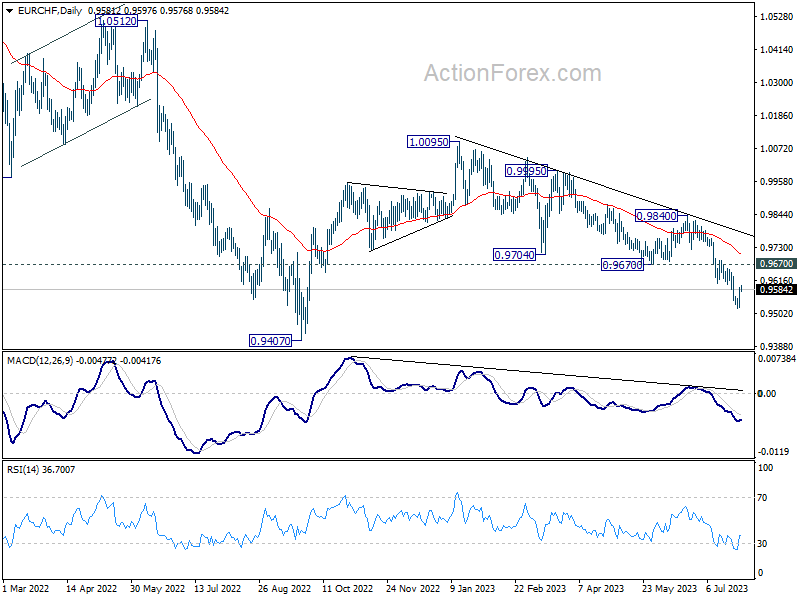
Intraday bias in EUR/CHF remains neutral for consolidations above 0.9520. While stronger recovery could be seen, outlook will remain bearish as long as 0.9670 support turned resistance holds. Break of 0.9520 will resume the fall from 1.0095 towards 0.9407 low.
In the bigger picture, medium term outlook is staying bearish as the pair is capped well below falling 55 W EMA (now at 0.9876). Down trend from 1.2004 (2018 high) is in favor to continue. Sustained break of 0.9407 will target 61.8% projection of 1.1149 to 0.9407 from 1.0095 at 0.9018. For now, this will remain the favored case as long as 0.9840 resistance holds, in case of strong rebound.
EUR/JPY Daily Outlook
Daily Pivots: (S1) 152.75; (P) 154.18; (R1) 156.95; More....
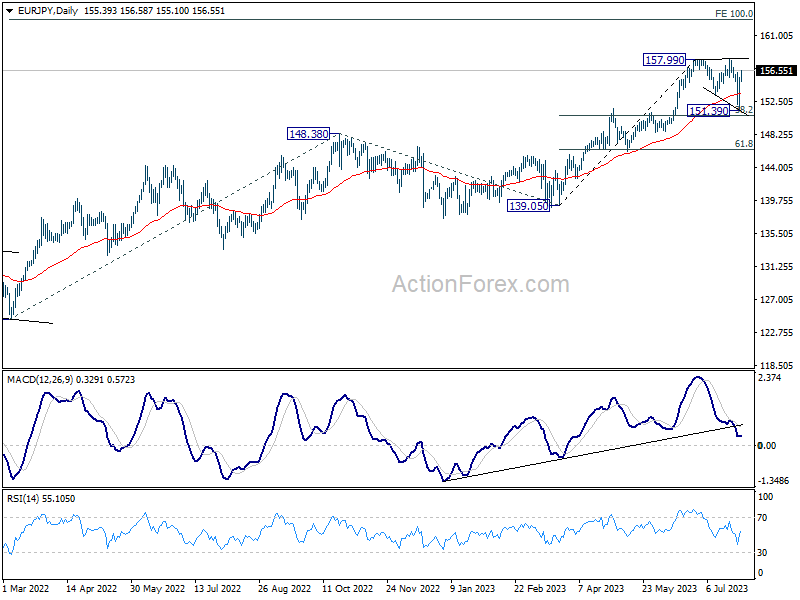
Intraday bias in EUR/JPY is mildly on the upside for retesting 157.99/158.03 resistance. As noted before, correction from 157.99 could have completed at 151.39, just ahead of 38.2% retracement of 139.05 to 157.99 at 150.77. Decisive break of 157.03 will resume larger up trend to 162.82 projection level next. On the downside, below 155.10 minor support will turn intraday bias neutral again. But outlook will remain bullish as long as 150.77 holds, in case of another dip.
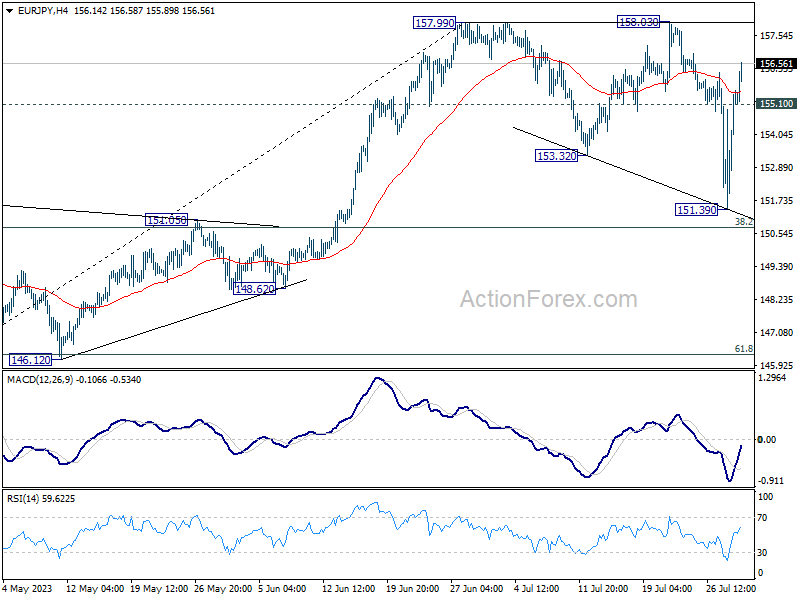
In the bigger picture, as long as 151.60 resistance turned support holds, rise from 114.42 (2020 low) is in progress. On resumption, next target is 100% projection of 124.37 to 148.38 from 138.81 at 162.82. Nevertheless, sustained break of 151.60 will argue that larger correction is already underway. Deeper decline would be seen to 55 W EMA (now at 145.56).
Hang Seng Index Technical: Risk of a Minor Pull-Back after Bullish Breakout
- Price actions staged a bullish breakout from a three-month descending range.
- Daily MACD trend indicator rose to a five-month high reading above the zero centreline which reinforces a medium-term uptrend condition of the Hang Seng Index.
- In the shorter term, a minor pull-back cannot be ruled out due to an extremely overbought reading seen in the hourly RSI oscillator.
- Key short-term support to watch will be at 19,700.
One of China’s proxies benchmark stock indices, the Hang Seng Index staged a bullish breakout last Friday, 28 July on the backdrop of more upcoming consumer-related stimulus measures, and private sector-friendly rhetoric from China’s top policymakers announced in the past two weeks to reverse the current weak internal demand environment in China.
Medium-term bullish breakout from descending range in place since April 2023
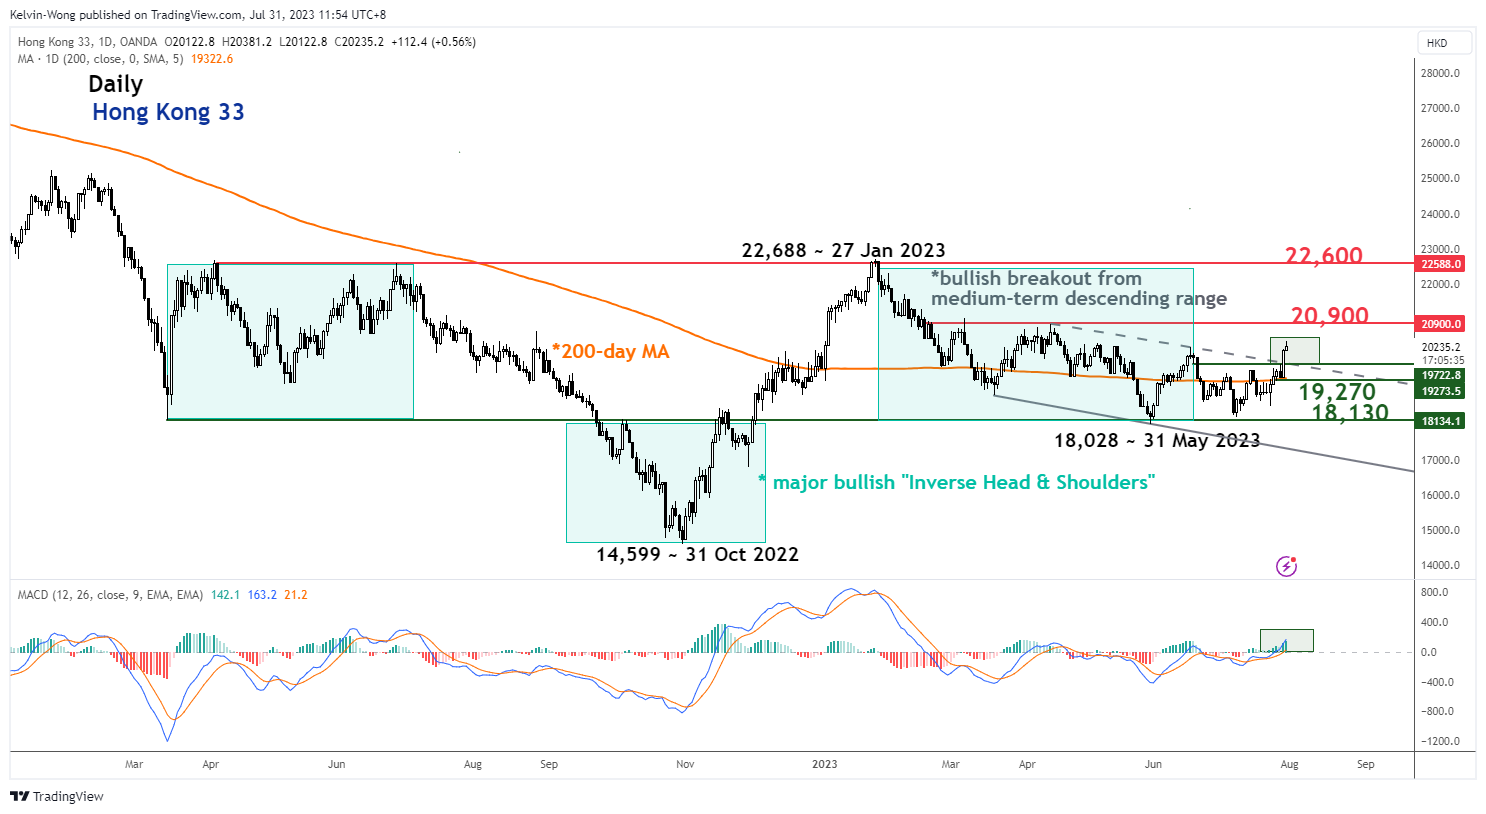
Fig 1: Hong Kong 33 medium-term trend as of 31 Jul 2023 (Source: TradingView, click to enlarge chart)
Price actions of the Hong Kong 33 Index (a proxy for the Hang Seng Index futures) have broken above the medium-term descending range resistance in place since the 17 April 2023 high now turns pull-back support at 19,700. Additionally, in the past week, the Index has recorded a weekly gain of +6.25% which was its best weekly performance seen in the past six months.
The daily MACD trend indicator has pierced above the zero line and recorded a five-month high of 162.9 at this time of the writing which reinforces a medium-term uptrend condition for the Index.
Minor uptrend hit overstretched condition, at risk of a minor pull-back
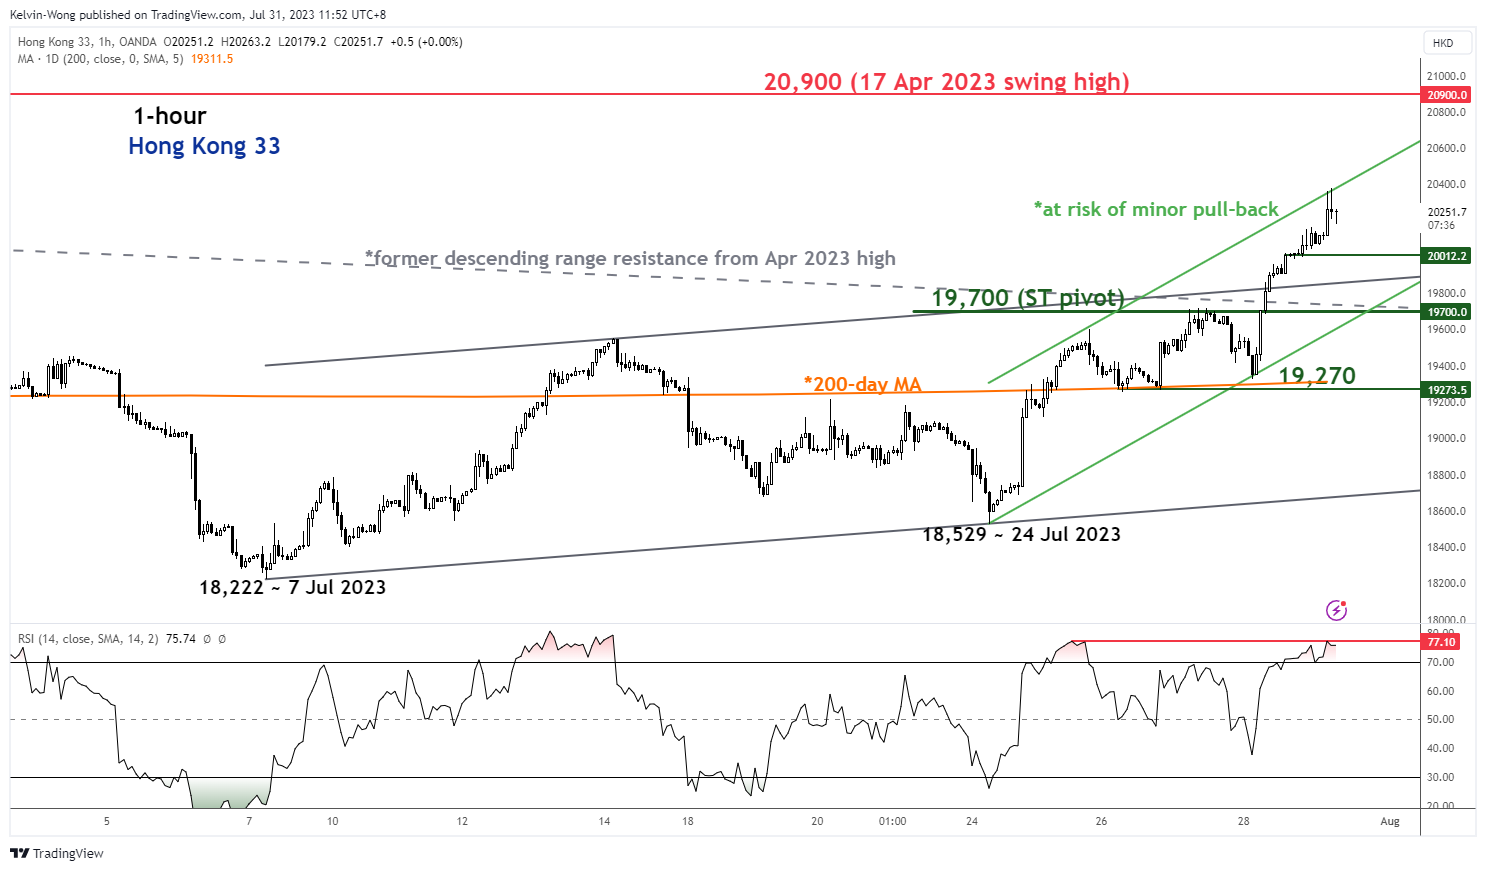
Fig 2: Hong Kong 33 minor short-term trend as of 31 Jul 2023 (Source: TradingView, click to enlarge chart)
In the shorter-term (see 1-hour chart), the price actions of the Index have reached the upper boundary of a minor ascending channel in place since the 24 July 2024 low of 18,529 coupled with an extreme overbought condition reading of 77.10 seen on the hourly RSI oscillator.
These short-term technical elements suggest that the current short-term burst up in price actions is overstretched, and a minor pull-back may occur within its short to medium-term uptrend phases with near-term support at 20,010.
The key short-term pivotal support will be at 19,700 to maintain the short-term uptrend phase from the 24 July 2023 low with the next resistance coming in at 20,900.
However, a break below 19,700 sees a deeper pull-back to expose the next support at 19,270 (also the 200-day moving average).