Sample Category Title
ECB Lagarde: A September pause not necessarily definitive
In an interview published in Le Figaro on Sunday, ECB President Christine Lagarde said , "At the next meeting in September, there could be a further hike of the policy rate or perhaps a pause."
But, she further clarified that "a pause, whenever it occurs, in September or later, would not necessarily be definitive." This suggests that the ECB remains flexible in its approach to policy adjustments, committed to assessing the economic landscape on a meeting-by-meeting basis.
Elucidating on ECB's mandate, Lagarde said, "We are committed to returning inflation to our target in a timely manner and for this we need a sufficiently restrictive policy in terms of level and length."
On a more positive note, Lagarde pointed out that recent Q2 GDP figures for France, Germany, and Spain were "quite encouraging." These data points, she suggested, lend support to their projection of a 0.9% GDP growth in Eurozone this year.
Forex and Cryptocurrencies Forecast
EUR/USD: From Hawks to Not-Yet Doves
The past week was filled with both events and the release of macroeconomic data. Regarding the Federal Reserve meeting on July 26 and the European Central Bank meeting on July 27, there were no surprises in terms of key interest rate hikes. In both cases, they were predictably increased by 25 basis points (bps): to 5.50% for the dollar and to 4.25% for the euro. Therefore, market participants' attention was drawn to the statements made by the heads of these regulators following the meetings.
Jerome Powell, the Chairman of the Federal Reserve, announced during the press conference on July 26 that the US central bank's monetary policy has now become restrictive. As is usual, he deflected a direct answer on whether there will be an additional rate hike within this year. He didn't rule out the prospect of a further surge in the cost of federal fund borrowings but neither did he confirm it, even though it has already touched a 22-year peak.
It became apparent from Powell's remarks that the Federal Reserve no longer anticipates a recession. Instead, the central bank's policy will aim for a 'soft landing' – a state of moderate economic expansion coupled with a continued deceleration in inflation. This upbeat forecast for the stock market prompted further growth in the S&P500 and Dow Jones indices, whereas the yields on US Treasury bonds and the Dollar Index (DXY) dropped. Amidst this backdrop, the EUR/USD pair recorded its weekly high at 1.1149.
Everything changed radically the next day, on Thursday, July 27. Almost simultaneously, with a 15-minute interval, the European Central Bank's decision on interest rates and preliminary US GDP data were announced. 15 minutes later, a press conference led by the head of the European Central Bank, Christine Lagarde, began.
The US economy, against a forecast of 1.8%, expanded by 2.4% in Q2, substantiating Powell's statements and removing the topic of recession from the current agenda. Against this backdrop, the Eurozone economy is clearly lagging behind (for instance, German GDP, after a drop of -0.3% in Q1, contracted further by -0.2% in Q2). The ECB's head lamented this weakness in her address. If a month ago it was said that the European regulator would bring rates to levels that would be sufficiently restrictive, on July 27 everything sounded different. It was now stated that the Governing Council of the Central Bank would maintain restrictive borrowing costs for as long as necessary. In other words, they would at least take a pause, or even cease further tightening of their policy.
Gediminas Šimkus, a member of the Bank's Governing Council, confirmed this, stating that the "economy is weaker in the short term than forecasted" and monetary authorities are "near the peak of rates or at it". As a result of these statements, the probability of a rate hike in September dropped below 50%, and EUR/USD plummeted. The pair bottomed for the week at the mark of 1.0943.
Towards the end of the work week, on Friday, July 28, the pair corrected into the 1.1000 zone. Following the publication of preliminary inflation (CPI) data in Germany and personal consumption expenditure data in the US, EUR/USD closed the five-day period at 1.1016.
As for the near-term prospects, at the time of writing this review on the evening of July 28, 30% of analysts voted for further growth of the pair, 55% foresaw a decline, and the remaining 15% held a neutral position. Among trend indicators on D1, 50% point upwards, 50% downwards. The oscillators present a more specific picture: only 15% recommend buying, 65% selling, and the remaining 20% are neutral. The nearest support for the pair is around 1.0985, followed by 1.0945-1.0955, 1.0895-1.0925, 1.0845-1.0865, 1.0780-1.0805, 1.0740, 1.0665-1.0680, and 1.0620-1.0635. Bulls will encounter resistance in the area of 1.1045, then 1.1085-1.1110, 1.1145, 1.1170, 1.1230-1.1245, 1.1275-1.1290, 1.1355, 1.1475, and 1.1715.
In the coming week, on Monday, July 31, we await data on retail sales in Germany and a whole raft of preliminary statistics for the Eurozone, including GDP and inflation (CPI) data. On Tuesday, business activity indicators (PMI) in Germany and the US will be revealed. The following day, August 2, we will receive data on the level of employment in the private sector of the United States. The labour market statistics will be supplemented on August 3 and 4, when we will learn the number of unemployment benefit claims and such important indicators as wage level, unemployment rate, and the number of new jobs created outside the agricultural sector (NFP) of the country.
GBP/USD: Awaiting the Bank of England's Meeting
The preliminary data released on Monday, July 24, showed a decline in business activity in the UK. According to the Chartered Institute of Procurement & Supply (CIPS), the PMI in the manufacturing sector, which was forecasted at 46.1, actually fell from 46.5 to 45.0 points. The PMI in the service sector and the composite PMI, although they remained above 50, also showed a decline: from 53.7 to 51.5 and from 52.8 to 50.7 points, respectively.
The Bank of England (BoE) meeting will take place on Thursday, August 3, and the market has yet to come to a consistent opinion on how much the regulator will raise the base rate for the pound under current conditions. Will it be 50 basis points or, like the Fed and ECB, 25? We've previously mentioned arguments in favor of both numbers. We'll just repeat some of them.
Three main reasons for the BoE to decide on a 50 basis point increase were formulated by economists of the French financial conglomerate Societe Generale.
Firstly, service sector inflation and wages may have peaked in June, but both indicators remain uncomfortably high. The Consumer Price Index (CPI), although it decreased from 8.7% to 7.9% (forecasted at 8.2%) over the month, is still far from the target level of 2.0%.
Secondly, as Societe Generale believes, investors are avoiding British bonds due to the persistent inflation in the country. Such high and steady inflation means that investors require higher compensation for holding British bonds compared to US Treasuries and German bonds. To reassure investors, it is necessary at this stage to continue a tight monetary policy.
Thirdly, in recent weeks the Bank of England and its governor, Andrew Bailey, have been subjected to extensive criticism for maintaining a soft monetary policy for too long, thereby allowing inflation to rise significantly. Now the BoE may overdo it in an effort to prove its critics wrong.
However, not everyone agrees with the arguments of the French economists. For example, their colleagues from the German Commerzbank note that consumer prices (CPI) in the UK grew much slower in June than expected. Therefore, market expectations for a rate hike are too high and need to be adjusted downwards. This, in turn, will lead to a weakening of the pound. A similar view was expressed by strategists from the largest banking group in the Netherlands, ING, who believe that the rate will be increased by a maximum of 25 basis points.
It can be seen on the long-term chart that the British currency has recovered more than three-quarters after a sharp fall in the second half of 2021 and in 2022. And according to economists at Scotiabank, the pound is "likely to continue to receive support from positive yield spreads, even though a very tight monetary policy will threaten the prospects for UK economic growth next year." Scotiabank predicts that the pound will reach 1.3500 by the end of 2023 and 1.4000 by the end of 2024.
As for the current situation, the GBP/USD dynamics last week were similar to how EUR/USD moved - both pairs reacted to the results of the Fed and ECB meetings, to the statements of their leaders, and to macroeconomic statistics from the US. As a result, the week's maximum was recorded on July 27 at the height of 1.2995, the minimum - the next day at the level of 1.2762, and the final chord sounded at the mark of 1.2850.
The median forecast for GBP/USD in the near term tends to be bearish, with 70% supporting this view and the remaining 30% taking the opposite position. On the D1 oscillators, 15% are coloured green, 25% neutral-grey, and 60% red. For trend indicators, as in the case of EUR/USD, the ratio between green and red is 50% to 50%. If the pair moves south, it is expected to meet support levels and zones - 1.2800-1.2815, then 1.2740-1.2760, 1.2675-1.2695, 1.2575-1.2600, 1.2435-1.2450, 1.2300-1.2330. 1.2190-1.2210. In case of pair growth, it will encounter resistance at levels 1.2880, then 1.2940, 1.2980-1.3000, 1.3050-1.3060, 1.3125-1.3140, 1.3185-1.3210, 1.3300-1.3335, 1.3425, 1.3605.
In the calendar for the upcoming week, in addition to the Bank of England meeting and the subsequent press conference of its management, Tuesday, August 1 can be noted when the final data on business activity (PMI) in the manufacturing sector of the UK economy will be published.
USD/JPY: BoJ Delivers a Surprise
The second half of the past week turned out to be not just volatile, but insanely volatile for USD/JPY. Jumps of 100, 200, and even 300 points followed one after another. Not only did the yen react sharply to the meetings of the Fed and the ECB, but also its own Bank of Japan (BoJ) delivered a surprise. The fire was started by the Nikkei newspaper, which published an insider that the BoJ intends, on the one hand, to maintain control over the bond yield curve in the same range, but on the other hand - to allow the rates of the debt market to go beyond its limits.
The results of the regulator's meeting fully confirmed the journalists' information. As expected, the Japanese Central Bank kept the key rate at an ultra-low negative level of -0.1%. However, for the first time in many years, the new head of the bank, Kazuo Ueda, decided to turn strict targeting of the yield curve into flexible one. For some central banks, this is a common practice. But for the BoJ, it's a desperately bold, revolutionary step.
The target yield level of Japanese 10-year bonds remains 0%. The permissible range of yield changes of +/-0.5% is also maintained. But from now on, this limit should no longer be seen as a hard boundary but is more flexible. True, to certain limits - the Bank of Japan drew a "red line" at the level of 1.0% and will conduct daily purchase operations so that the yield does not rise above this mark.
Initially, this decision literally blew up the market, the yen's rate began to strengthen. USD/JPY dropped to the mark of 138.05. But then everything calmed down. Investors reasoned that, essentially, the BoJ policy remained ultra-soft. The review of the target range for long-term government bonds has purely symbolic significance so far, as it is unknown whether such a range will actually be used.
Especially since there were immediate critics of this decision. Thus, strategists from Commerzbank warned in advance that the possibility of a slight increase in rates could be devastating for the yen. They referred to the potential growth of inflation and the high level of public debt in the country. "With such half-hearted measures," they said, "the Bank of Japan is fuelling fears that the actual cessation of control over the yield curve could be undesirable or impractical. [...] Even if the yen currently benefits from the possibility of a slight increase in interest rates in the long run, this will be a catastrophic signal for it.".
"And in general, it is still unclear what and how will happen in this distant future," thought market participants, and as a result, the end of the week ended in favour of the dollar. The final point of the week was set at the level of 141.15.
At the time of writing the review, the forecast is maximally neutral: a third of analysts believe that in the coming days the pair will continue to grow, a third expect its fall, and a third have taken a wait-and-see position. The readings of the indicators on D1 look as follows. Among oscillators, 35% are coloured red, 25% are gray, and 40% are green (a quarter of them are in the overbought zone). Among trend indicators, green has a total advantage, such are 100%. The nearest support level is located in the zone of 140.60-140.75, then 139.85, 138.95-139.05, 138.05-138.30, 137.25-137.50, 135.95, 133.75-134.15, 132.80-133.00, 131.25, 130.60, 129.70, 128.10, and 127.20. The nearest resistance is 141.95-142.20, then 143.00, 143.75-144.00, 145.05-145.30, 146.85-147.15, 148.85, and finally, the maximum of October 2022, 151.95.
Part from the meeting of the Bank of Japan, no significant economic information related to the economy of this country is expected to arrive in the coming week.
CRYPTOCURRENCIES: In Search of a Lost Trigger
The decisions of the Federal Reserve (and even more so the European Central Bank and the Bank of Japan) have not had a significant impact on bitcoin quotes. After a decline on Monday, July 24, BTC/USD attempted to rise slightly in line with stock indices, but it did not manage to consolidate above $30,000.
Statistics show that after a price surge in June, blue whales (those holding more than 10,000 bitcoins) are locking in profits and selling bitcoin at record rates for 2023, offloading an average of 16,300 coins per day onto exchanges. During this period, the share of whale transactions in the overall inflow to these platforms reached 41%. This even surpasses crisis periods in 2022, such as the Terra project crash and the FTX bankruptcy (when whale proportions were 39% and 33%, respectively).
Conspiracy theorists attribute this sell-off to the whales possessing some kind of insider information. However, it's more likely that the sales are driven by increasing risks due to heightened regulatory pressure on the crypto market from the U.S. Securities and Exchange Commission (SEC), including the legal pursuit of its prominent participants.
As for the smaller members of the whale family (those holding between 1,000 and 10,000 bitcoins), they have been actively replenishing their reserves over the past month. Other market participants behaved fairly passively, not exerting a significant impact on quotes.
The only positive development for the crypto market this summer has been the submission of applications to launch spot bitcoin exchange-traded funds (ETFs) by giants such as BlackRock, Invesco, Fidelity, and others. Thanks to these developments, BTC/USD managed to rise above $30,000 in mid-June.
Senior Bloomberg analyst Eric Balchunas believes that SEC approval of these applications will open up $30 trillion worth of capital to the bitcoin market. According to forecasts by the analytical company Fundstrat, the launch of a bitcoin ETF could increase the daily demand for bitcoin by $100 million. In this case, even before the halving scheduled for April 2024, the price of bitcoin could rise by 521% from its current levels, reaching up to $180,000.
However, clarity about the fate of these applications is still a long way off. For instance, the final decision on BlackRock's application is not expected until the middle of Q3 2023 and no later than mid-March 2024. And this decision does not necessarily have to be positive. As a result of this uncertainty, the joyful excitement among crypto enthusiasts in June has fizzled out, but fear of the SEC remains. This fear continues to put pressure on the market.
Two events could potentially serve as new triggers to initiate a bull rally. The first is a shift in the Federal Reserve's monetary policy towards easing (QE). In other words, it would involve not just an end to the tightening cycle (QT), but the actual start of easing. But so far, this isn't even being discussed. The interest rate will either be frozen at its current level or rise by another 25 b.p. However, based on recent statements, the Federal Reserve does not intend to lower it. In general, we are still far from the point where a significant amount of free money appears on the market, which investors would want to invest in digital assets.
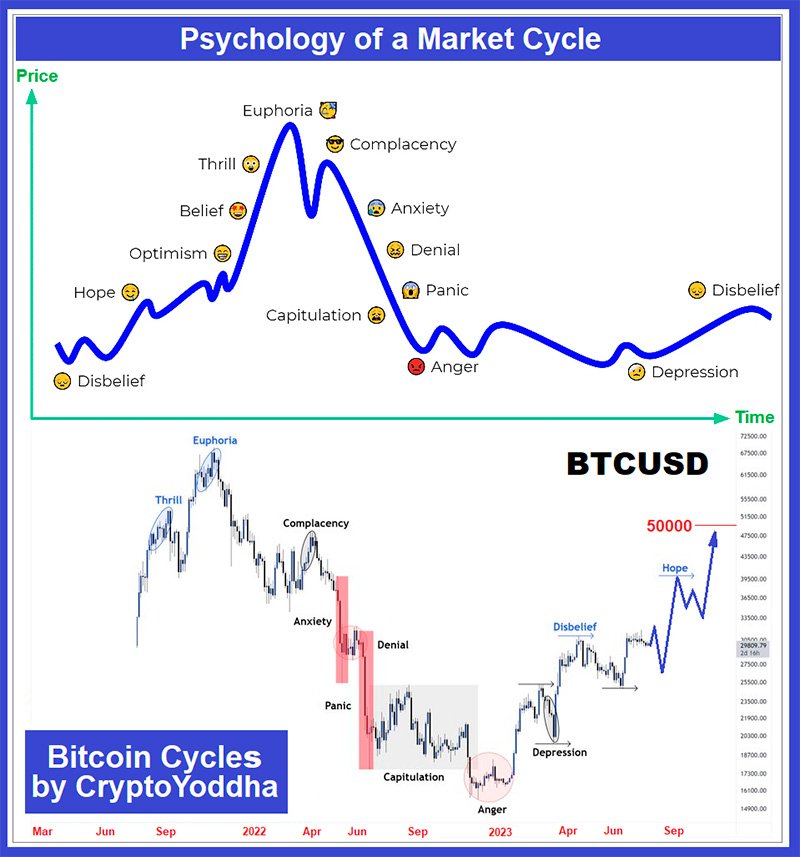
The second trigger is the halving, which could cause not only the subsequent, but also preceding growth in bitcoin. As on traditional markets, shifts in investor sentiment on the crypto market follow certain patterns. Taking into account the so-called "Wall Street Cheat Sheet," which describes the psychology of market cycles, and the emotions traders typically experience, bitcoin is moving towards the "hope" phase after passing through pessimistic phases of "panic," "capitulation," and "depression."
According to the chart by analyst CryptoYoddha, the cryptocurrency is currently going through the "disbelief" or "sucker's rally" stage, with the next step being "hope" for a price recovery, possibly to $50,000 and higher by the end of 2023. The upward movement will correspond to the passage through the stages of "optimism," "belief," "thrill," and finally, "euphoria.".
Cody Buffington, the host of the Altcoin Buzz YouTube channel, holds the view that a surge in bitcoin's volatility will happen even sooner than everyone expects. In his opinion, the impending volatility of the flagship cryptocurrency could rival its growth since January 2023. Buffington noted that in July, the bitcoin price fluctuated in a narrow range around the $30,000 mark, which was a kind of test for both bulls and bears. More often than not, such a flat period occurs before large movements. As evidence, he referred to the Bollinger Bands and a visual display of the indicator, where it can be seen that the bitcoin price chart is in its narrowest state since the beginning of 2023.
A survey of 29 analysts conducted by Finder.com resulted in the following median forecast. Experts expect BTC to rise to $38,488 by the end of the year, with a potential peak for bitcoin in 2023 potentially reaching $42,000. By the end of 2025, according to the average opinion of those surveyed, the price of the coin could reach $100,000, and by the end of 2030 - $280,000.
Naturally, individual forecasts of the experts varied. Overall, the majority of survey participants (59%) are optimistic about BTC and believe that now is a good time to enter the market, 34% simply advise holding existing cryptocurrency, and 7% recommend selling it.
Market strategist Todd "Bubba" Horwitz believes that within the next six months, the flagship cryptocurrency will rise to $35,000, and then to $40,000. Interestingly, "Bubba" has chosen neither the Federal Reserve nor the halving as the trigger, but… Robert F. Kennedy Jr. This Democratic presidential candidate stated that saving the country's economy and supporting the dollar could be facilitated by hard assets such as gold, silver, platinum, and... bitcoin.
Analyst under the pseudonym Trader Tardigrade believes that bitcoin is repeating the same price structure as in the period from 2013 to 2018 when it followed the model of transition from the "previous peak" to the "top-1", which preceded the "top-2" and the "retest" (the stage where bitcoin is now). If this model is correct, the next step will be a price "boom", which could lead to bitcoin's growth to $400,000 in 2026.
Another expert, Stockmoney Lizards, opines that bitcoin has just exited its third historical cycle, during which it reached a historical maximum of $68,900, and has entered its fourth price cycle, the culmination of which could be a new record between $150,000 and $200,000 Q2 or Q3 2025.
Artificial Intelligence also has an opinion on this matter (we couldn't possibly proceed without it!). The experts at Finbold decided to ask the Google Bard machine learning system how much the flagship of the crypto market will cost after the long-awaited halving in 2024. The AI noted that several factors could influence this, but it's highly likely that bitcoin will reach a new all-time high. This will be facilitated not only by halving but also by a more global integration of BTC and interest from institutional investors. Speaking in specific figures, Google Bard noted that after halving, the coin could spike to a $100,000 mark. On the other hand, the AI highlighted factors that could limit the growth of the main cryptocurrency and did not rule out the possibility that the crypto winter could continue in 2024.
As of the time this review was written, on the evening of Friday, July 28, bitcoin doesn't seem to be significantly affected. BTC/USD is being traded around $29,400. The total capitalization of the crypto market has slightly decreased and is at $1.183 trillion ($1.202 trillion a week ago). The Crypto Fear & Greed Index is currently in the Neutral zone, standing at 52 points (compared to 50 points a week ago)
Yen Staying Bearish after a Wild Ride; Dollar Index Presses Key Resistance
The global financial markets found themselves in a flurry of volatility in the past week, underpinned by policy decision of three major central banks in North American, Europe, and Asia. Yen and Nikkei had the wildest roller-coaster ride in reaction to BoJ's tweak to their Yield Curve Control. In the end, Yen crosses are maintaining their bullish trends, together with Nikkei.
Meanwhile, the western hemisphere saw a divergence in currency trends following expected monetary policy decisions from Fed and ECB. That resulted in extended rally in Dollar index which is now pressing a key resistance level, with future trends hinging on market reactions at this juncture.
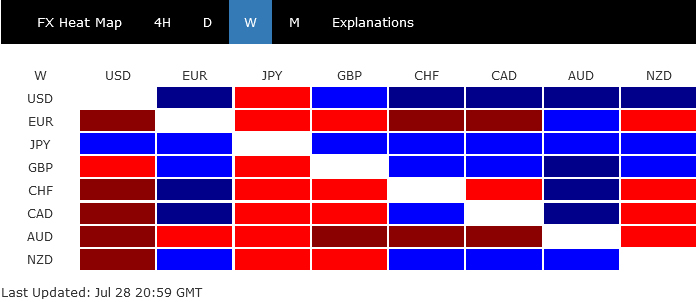
Overall, while Yen was the best performer of the week, it's near outlook looks shaky. Dollar followed as the second best, and then Sterling. Australian Dollar was the worst performer, followed by Euro, and then Swiss Franc. Canadian and new Zealand Dollar ended mixed.
BoJ's surprised YCC tweak prompted volatility, but no change in trends
Japanese Yen experienced one of its most volatile periods over the last two days of the week. Initial anticipation of a modification in BoJ yield curve control catalyzed a sharp upmove in Yen, a trend that persisted post BoJ's announcement. Yet, the gains were entirely wiped out by the week's end, despite Yen ending higher against all other major rivals.
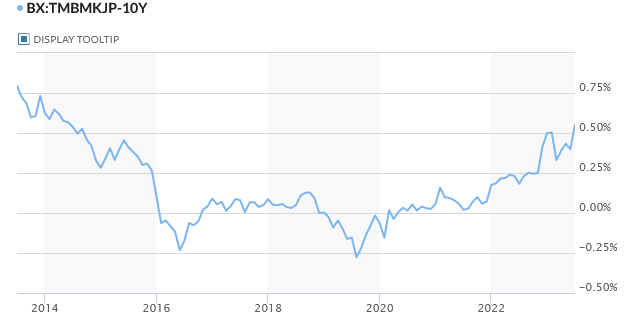
BoJ's latest monetary policy announcement was a mixed bag. While short-term interest rate remained at -0.1%, and 10-year JGB yield around 0%, the central bank has revised its purchase rate for 10-year JGB to 1.0%, up from 0.5%. The decision is viewed as a signal to allow 10-year JGB to rise within a 0.5%-1.0% range. Only that, as BoJ Governor Kazuo Ueda asserted, "We will not tolerate an increase in the 10-year bond yield above 1% and will step in if it does." The 10-year JGB yield closed at a nine-year high of 0.55%.
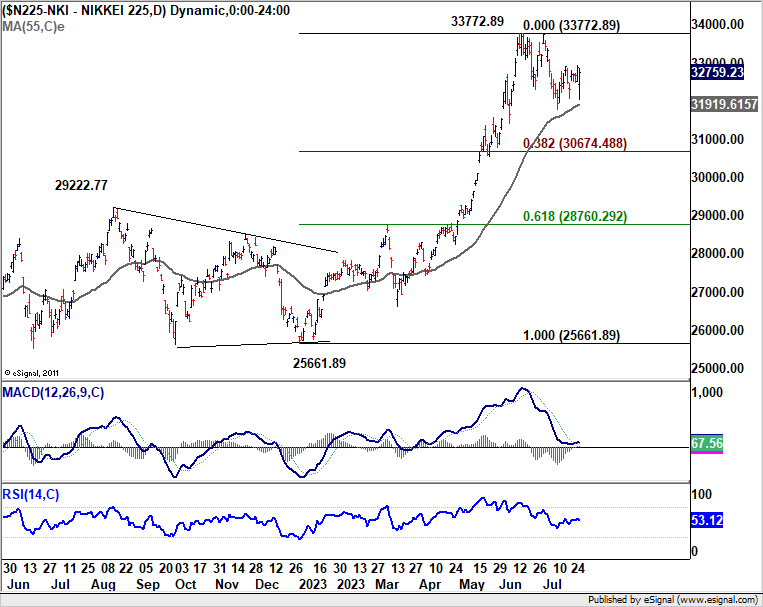
On the equities side, Nikkei, which initially plummeted following BoJ's perceived steps towards exiting its ultra-loose monetary policy, managed to recoup most of its losses by the week's close. Japanese investors seem unperturbed by this slight policy shift, even with the banking and insurance index gaining 4.6% on Friday, supported by the expectation that a steeper yield curve could boost lending profits.
From a technical perspective, Nikkei is seen as extending a near term consolidation pattern from 33772.89 for now. Another dip cannot be ruled out, but 38.2% retracement of 25661.89 to 33772.89 at 30674.48 should offer support to bring rebound.
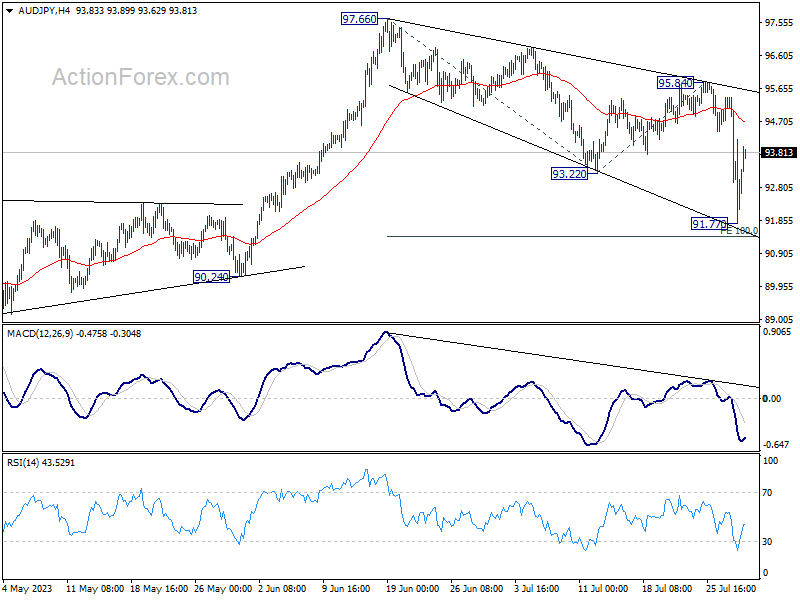
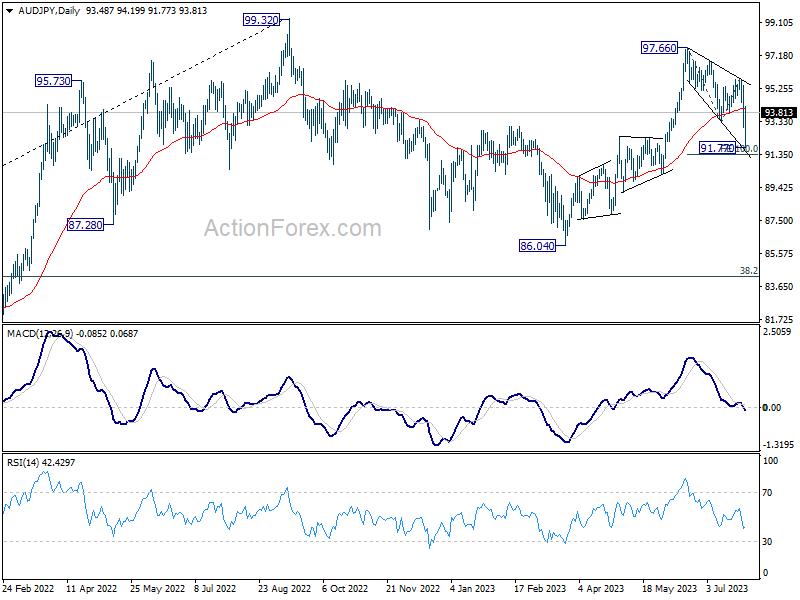
For example, AUD/JPY was the top mover last week, closed down -1.72%. But it was clearly way off weekly low at 91.77. Fall from 97.66 could have completed as a three-wave corrective move, inside 90.24/92.42 support zone (wave four of the five-wave sequence from 86.04 to 97.66). And it just missed 100% projection of 97.66 to 93.22 from 95.84 at 91.40. If this interpretation is correct, rise from 86.04 would be ready to resume through 97.66 any time.
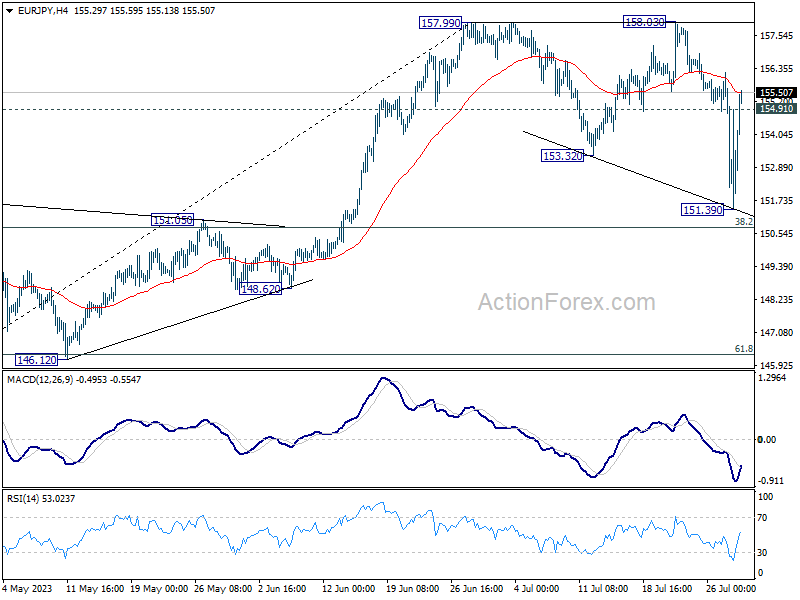
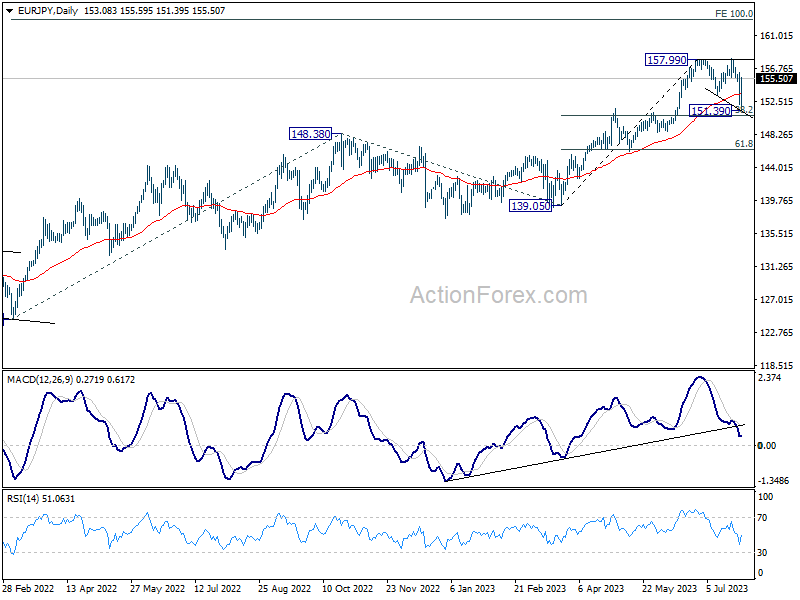
EUR/JPY also rebounded strongly after diving to as low as 151.39. One of the views is that price action from 157.99 are a three-wave corrective pattern, that might have completed with three waves down to 151.39. 38.2% retracement of 139.05 to 157.99 at 150.77 was well defended, and rise from 139.05 could be ready to resume through 157.99 any time too.
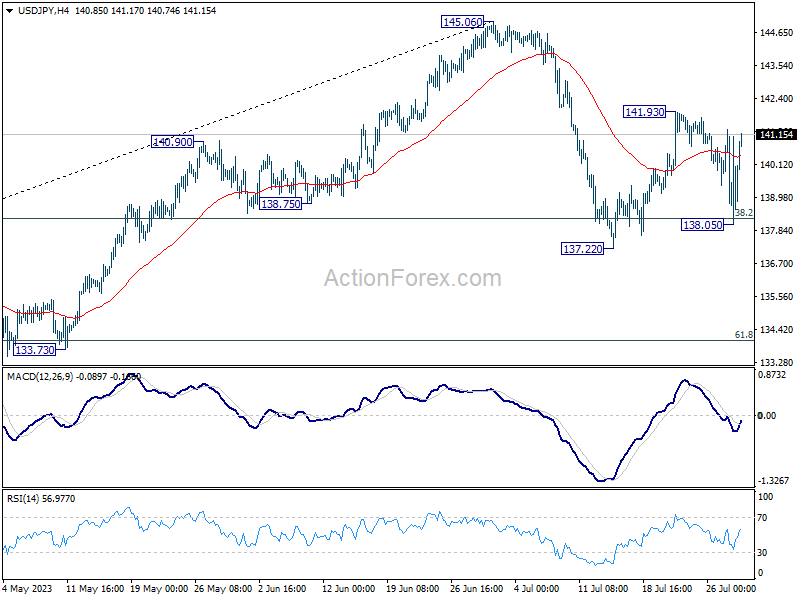
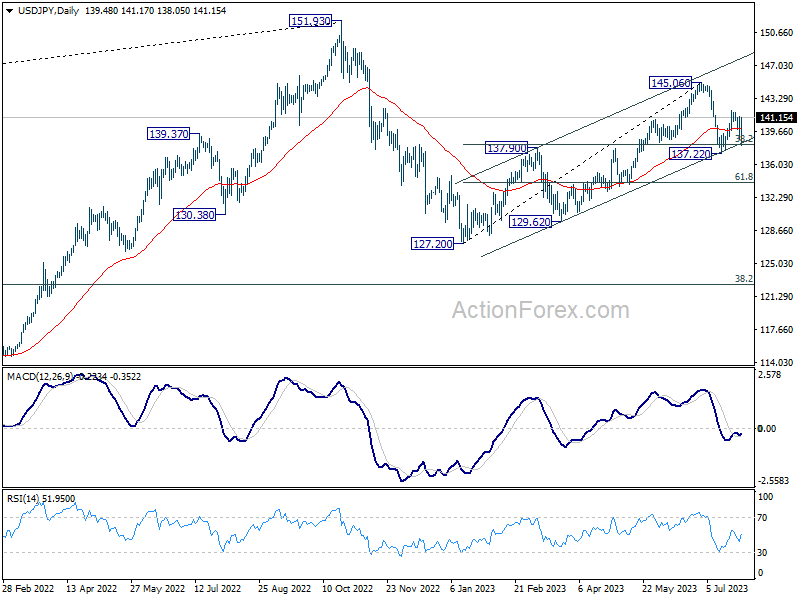
USD/JPY also managed to defend 137.22 support well and rebounded strongly after dipping to 138.05. There is no confirmation that the rally from 127.20 has completed. Indeed, break of 141.93 will resume the rebound from 137.22 to retest 145.06 high, and retain near term bullishness for resuming the rise from 127.20 at a later stage.
Dollar index pressing key resistance after Fed and ECB
After the highly anticipated Fed and ECB rate decision, Dollar and Euro experienced contrasting fortunes. The difference in market responses triggered an extended recovery in Dollar Index, which is now pressing a critical resistance level. Reactions from there would decide whether Dollar would need to head lower before forming a medium term bottom.
Fed's rate decision was largely as expected. Rate hike of 25bps was delivered, with the accompanying statement almost a carbon copy as June's. Chair Jerome Powell's left the door open for another rate hike in September, without giving any indication of preference. Dollar initially weakened after the event, but rebounded with help from stronger than expected Q2 GDP data. Yet it failed to extend gains towards the end of the week.
Meanwhile, ECB's announcement was largely the same as Fed's, with 25bps hike delivered, without any concrete guidance for next meeting in September. But markets have taken the decision as a dovish one after President Christine Lagarde highlighted that every change in the statement was deliberate. In particular, ECB's new wording implies that future decisions will ensure key interest rates are "set" at, rather than "brought to" sufficiently restrictive levels, possibly opening the case for a pause at the next meeting, depending on incoming data.
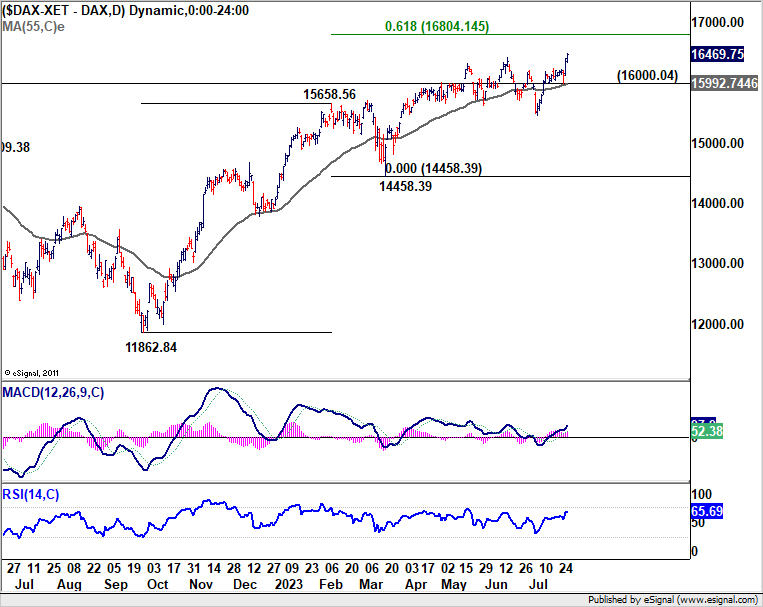
An important development to note is that German DAX surged sharply since Thursday to close at new record high. Recent economic data from Germany and Eurozone were really encouraging, except that inflation is on track going down. And just as Lagarde described, the economic outlook for Eurozone has "deteriorated" in the near term. DAX's bullish run is clearly mainly in response to the "relatively dovish" ECB event. Technically speaking, near term outlook in DAX will stay bullish as long as 16000.04 support holds. Next target is 61.8% projection of 11862.84 to 15658.56 from 14458.39 at 16804.14.
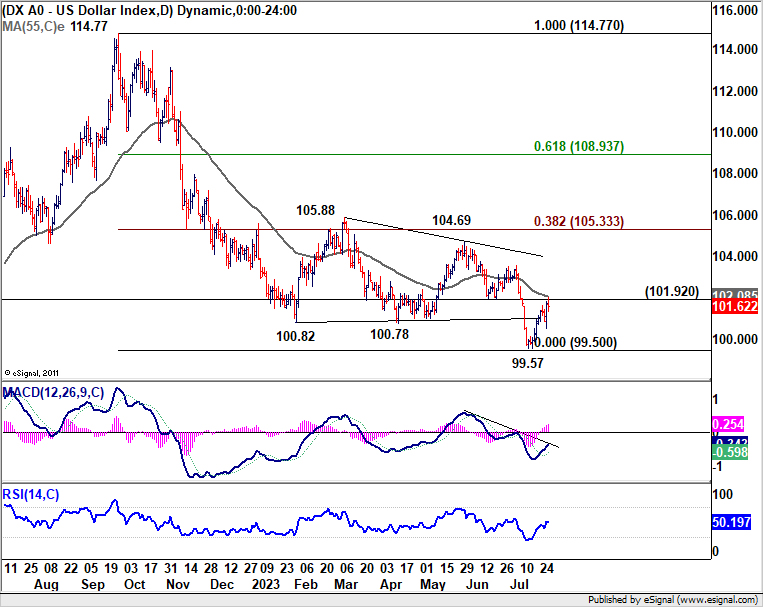
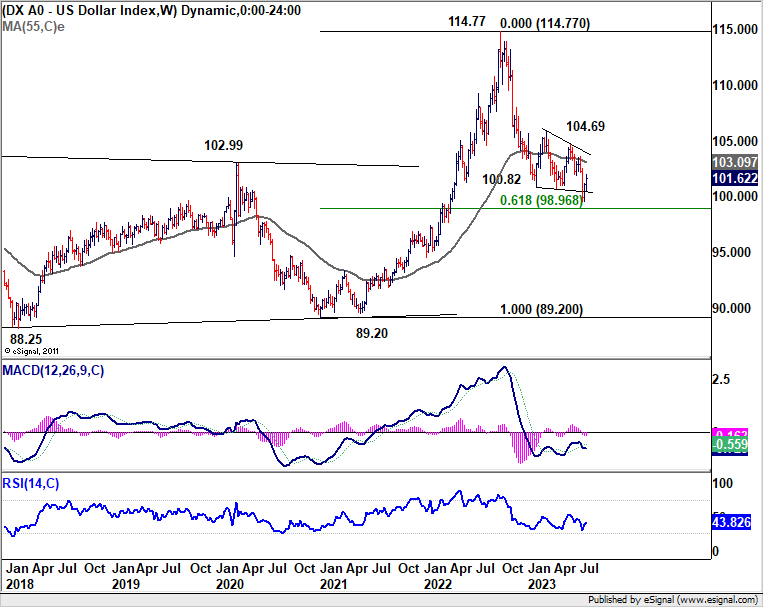
Dollar ended as the second strongest currency, while Euro was the second from bottom. The development was reflected in the extended recovery in Dollar index. DXY is now pressing an important resistance level at 101.92, which is also close to 55 E MA (now at 102.08). Rejection by this resistance zone will likely push DXY through 99.57 to resume the decline from 114.77. In this case, DXY might only be able to bottom after a test on key support zone around 98.
However, considering bullish convergence condition in D MACD, sustained break of the mentioned resistance zone around 102 will argue that a medium term bottom was already formed. Rise from 99.57 could then be at least a correction to whole fall from 114.77. Stronger rally would be seen to 104.69 resistance and possibly above.
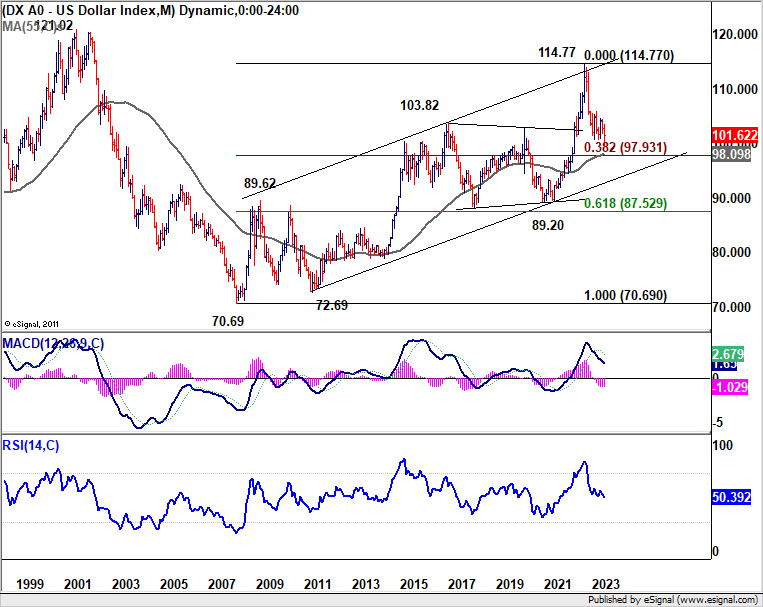
The above mentioned 98 support zone represents 61.8% retracement of 89.20 (2021 low) to 114.77 at 98.96, 55 M EMA at 98.09, and 38.2% retracement of 70.69 to 114.77 at 97.93.
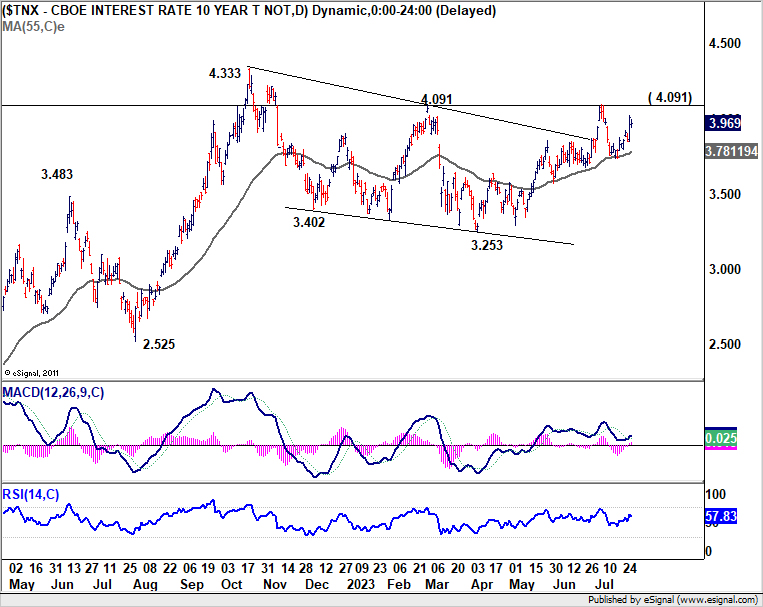
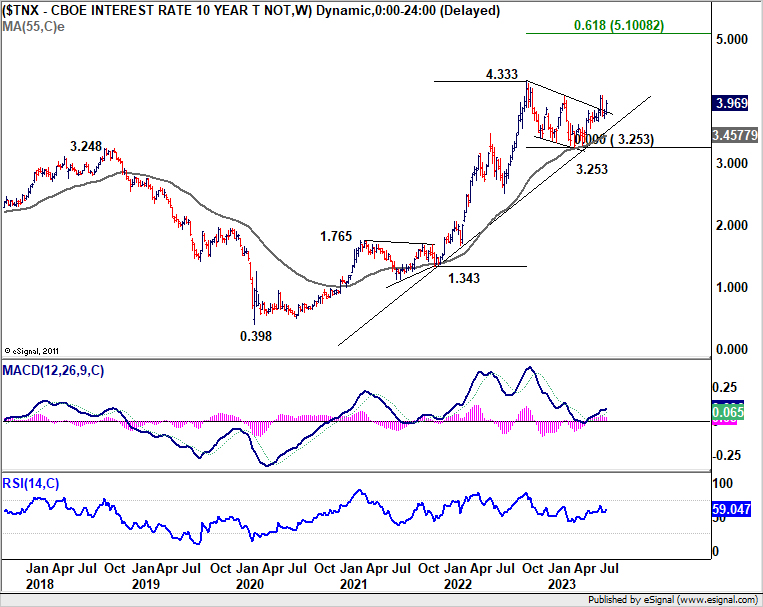
Development in US benchmark 10-year yield would be a factor that's supporting the greenback, or at least, limiting it's downside in case of another selloff. It seems that TNX is not giving up on 4% handle after drawing notable support from rising 55 D EMA (now at 3.781). Another attempt would likely be seen in the near term to retest 4.091 structural resistance. Decisive break there should confirm completion of the corrective pattern from 4.333 at 3.253. Retest of 4.333 should be seen next with prospect of up trend resumption. This will remain the favored case as long as 55 D EMA holds.
EUR/USD Weekly Outlook
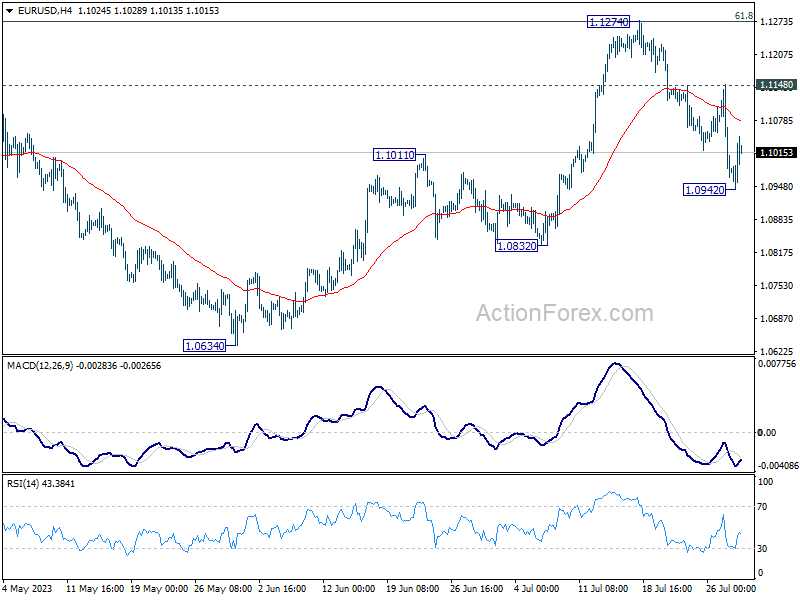
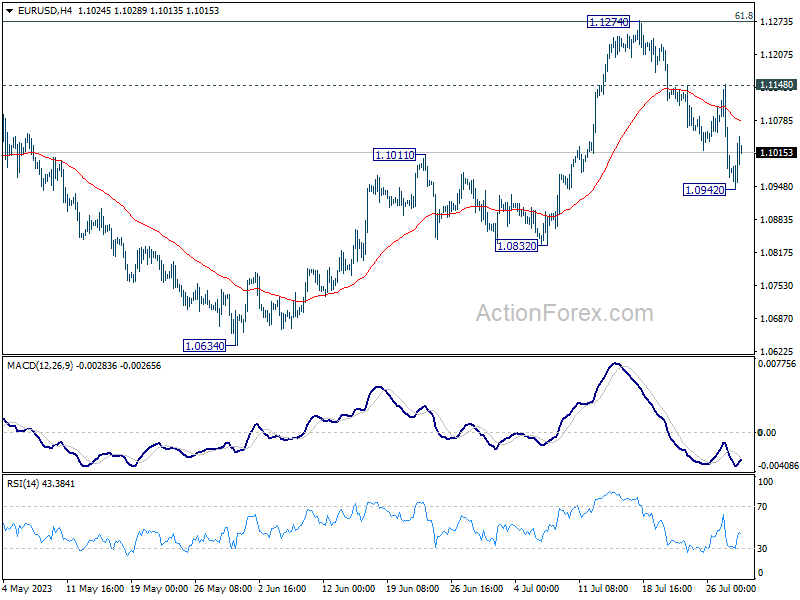
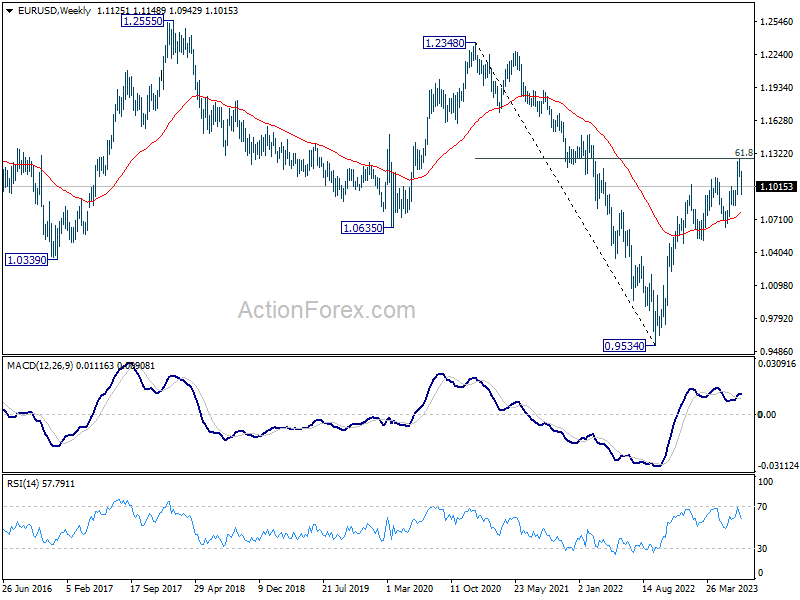
EUR/USD's fall from 1.1274 short term top extended last week and hit as low as 1.0942. Further fall is expected this week as long as 1.1148 resistance holds. Below 1.0942 will target 1.0832 support next. Nevertheless, break of 1.1148 will argue that the decline has completed and bring retest of 1.1274 high.
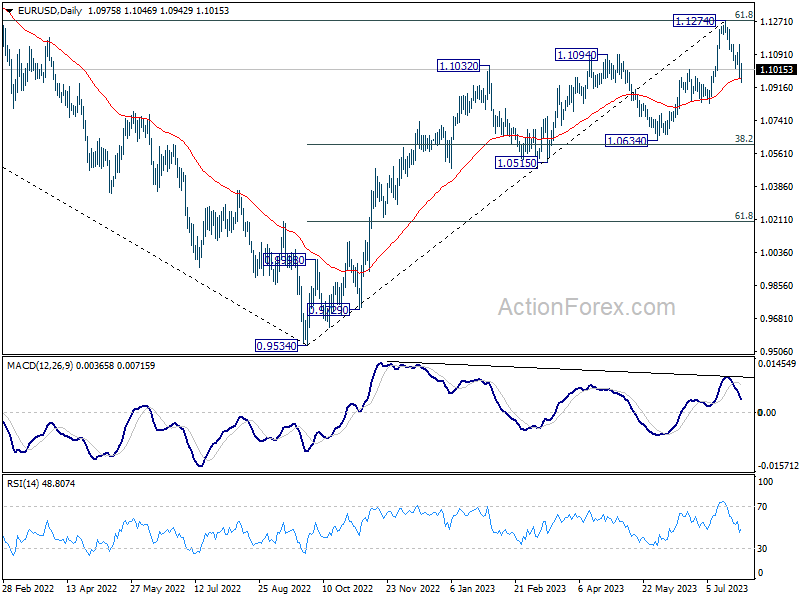
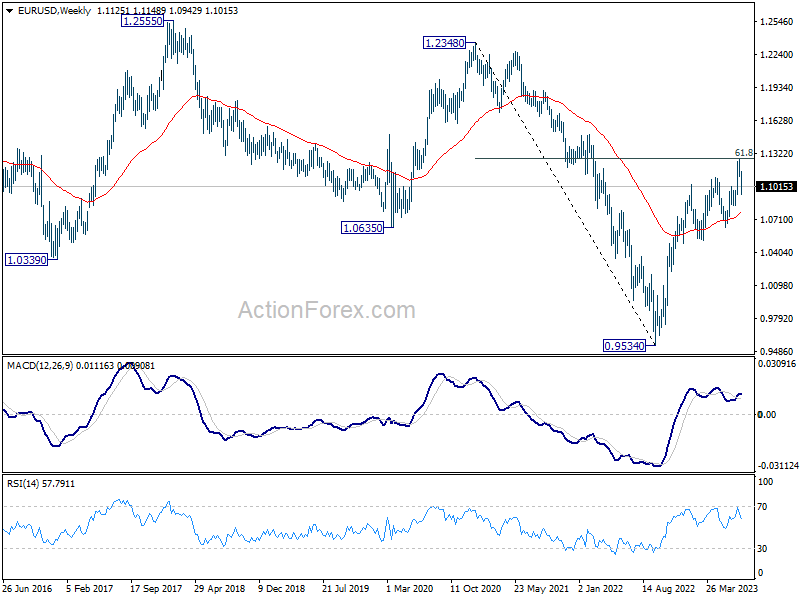
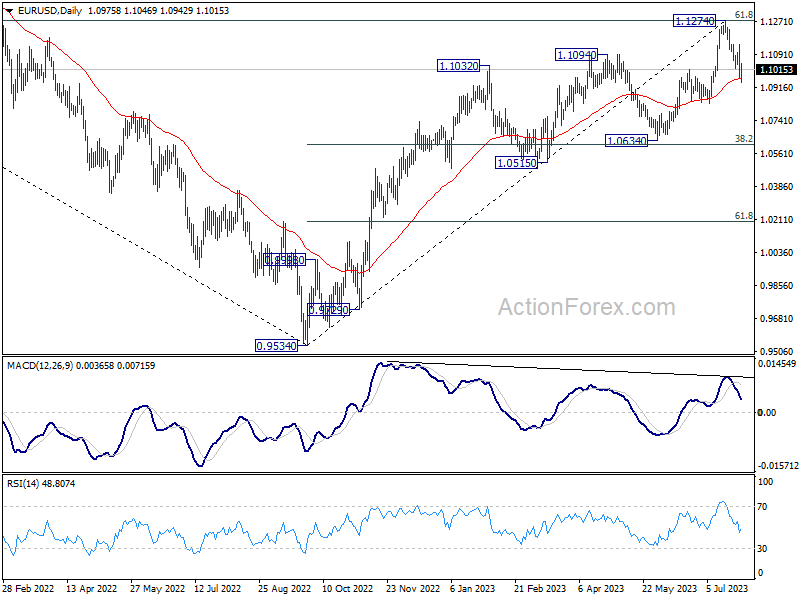
In the bigger picture, a medium term top could be formed at 1.1274, after failing to break through 61.8% retracement of 1.2348 (2021 high) to 0.9534 at 1.1273 decisively, on bearish divergence condition in D MACD. Sustained trading below 55 D EMA (now at 1.0963) will bring deeper correction to 1.0634 cluster support (38.2% retracement of 0.9534 to 1.1274 at 1.0609). Strong support could be seen there, at least on first attempt, to set the range for consolidation.
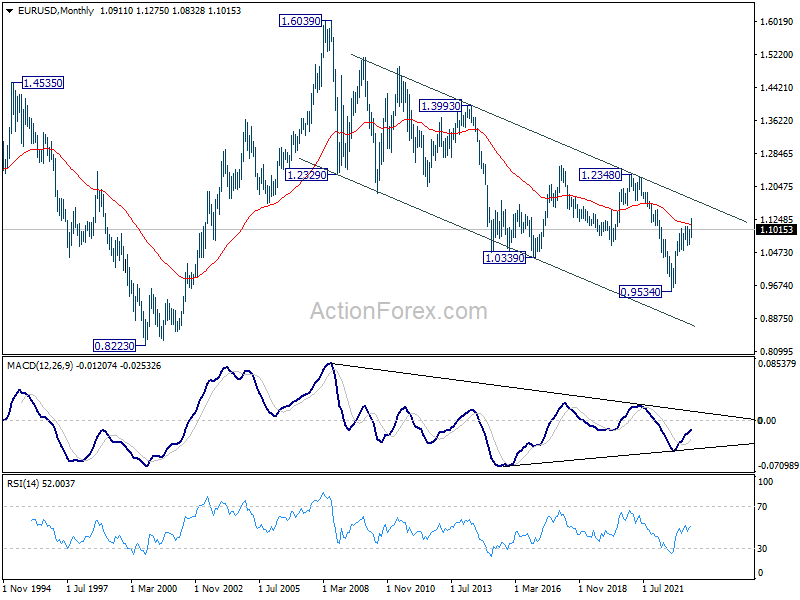
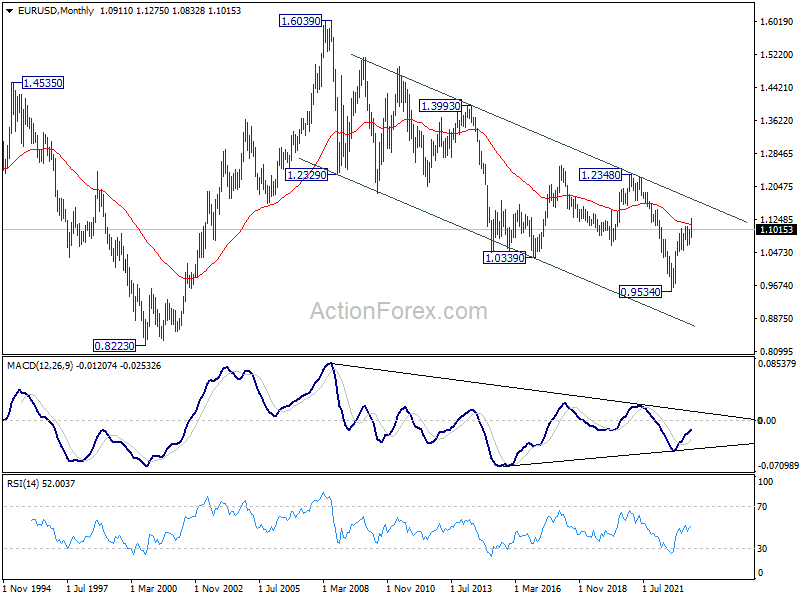
In the long term picture, focus stays on 55 M EMA (now at 1.1141). Rejection by this EMA will revive long term bearishness. However, sustained break above here will be affirm the case of long term bullish reversal and target 1.2348 resistance for confirmation.
EUR/USD Weekly Outlook
EUR/USD's fall from 1.1274 short term top extended last week and hit as low as 1.0942. Further fall is expected this week as long as 1.1148 resistance holds. Below 1.0942 will target 1.0832 support next. Nevertheless, break of 1.1148 will argue that the decline has completed and bring retest of 1.1274 high.
In the bigger picture, a medium term top could be formed at 1.1274, after failing to break through 61.8% retracement of 1.2348 (2021 high) to 0.9534 at 1.1273 decisively, on bearish divergence condition in D MACD. Sustained trading below 55 D EMA (now at 1.0963) will bring deeper correction to 1.0634 cluster support (38.2% retracement of 0.9534 to 1.1274 at 1.0609). Strong support could be seen there, at least on first attempt, to set the range for consolidation.
In the long term picture, focus stays on 55 M EMA (now at 1.1141). Rejection by this EMA will revive long term bearishness. However, sustained break above here will be affirm the case of long term bullish reversal and target 1.2348 resistance for confirmation.
USD/JPY Weekly Outlook
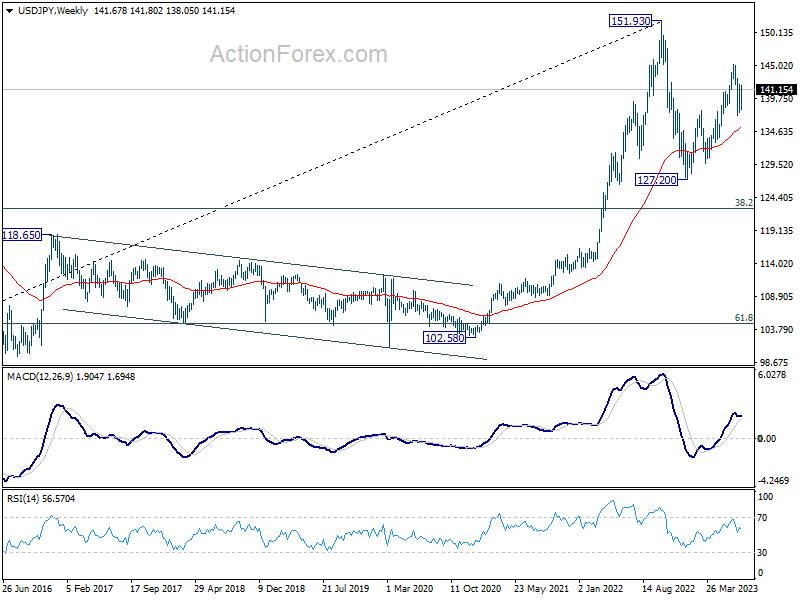
USD/JPY's retreated deeply to 138.05 last week but recovered to extend range trading. Initial bias is neutral this week first. On the upside, above 141.93 will resume the rebound from 137.22. More importantly, that would sign that whole rise from 127.20 is still in progress. Further rally should then be seen to 145.06 resistance and above. Nevertheless, on the downside, break of 137.22 will resume the whole decline from 145.06, and carries larger bearish implications.
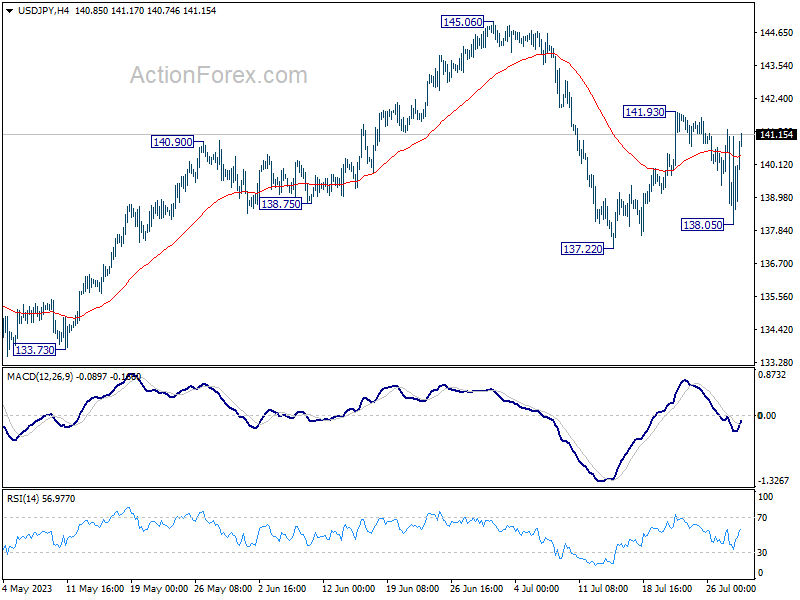
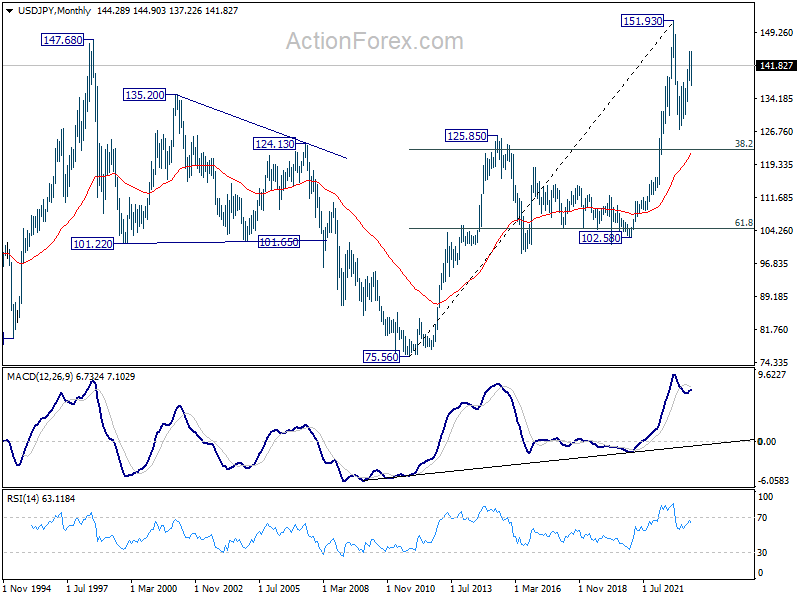
In the bigger picture, overall price actions from 151.93 (2022 high) are views as a corrective pattern. Rise from 127.20 the second leg of the pattern and could still be in progress. But even in case of extended rise, strong resistance should be seen from 151.93 to limit upside. Meanwhile, break of 137.22 support should confirm the start of the third leg to 127.20 (2023 low) and below.
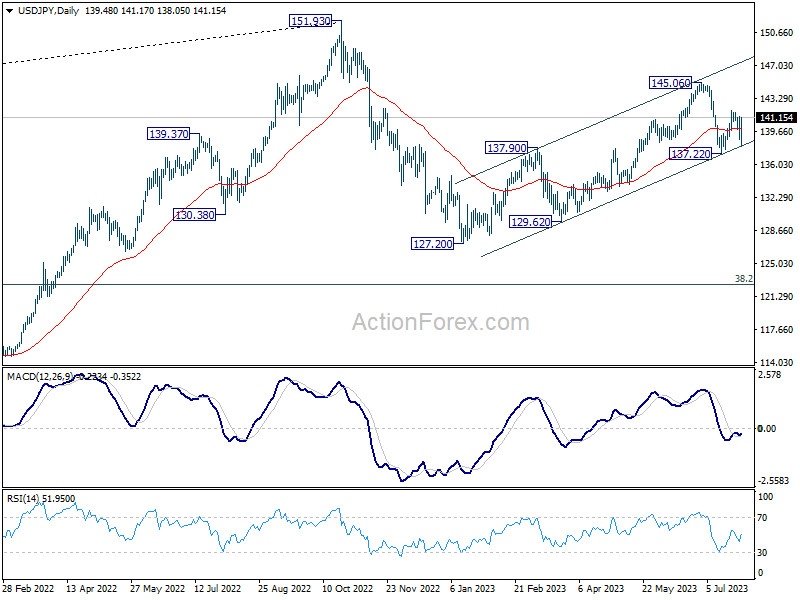
In the long term picture, price action from 151.93 is seen as developing into a corrective pattern to up trend from 75.56 (2011 low). While deeper decline cannot be ruled out, downside should be contained by 38.2% retracement of 75.56 to 151.93 at 122.75.
GBP/USD Weekly Outlook
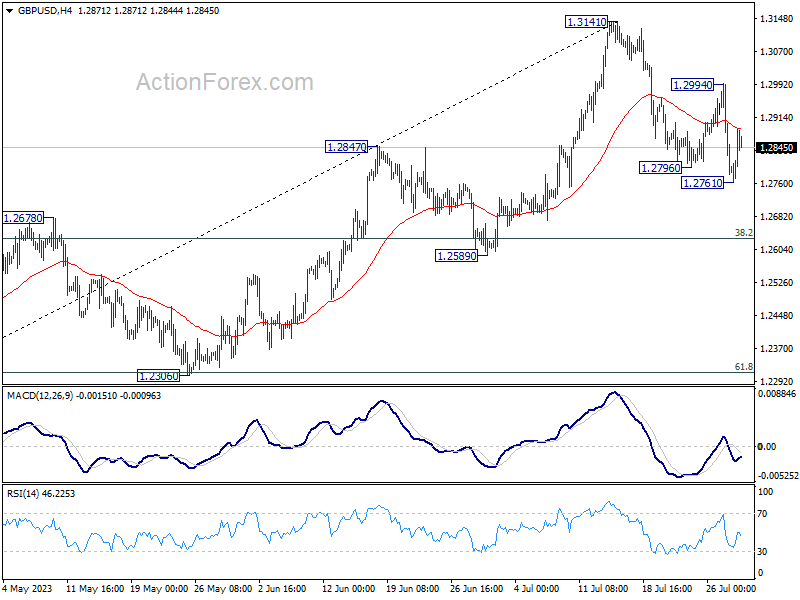
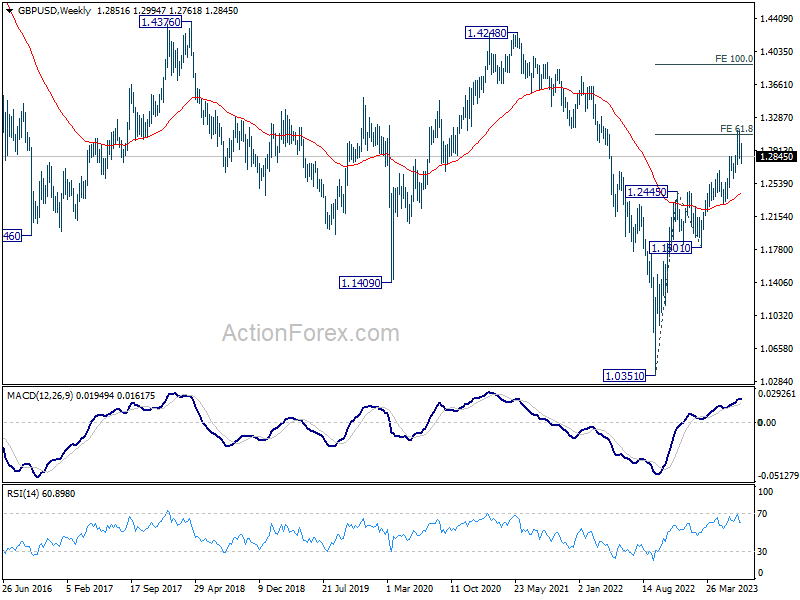
GBP/USD's decline from 1.3141 continued last week despite interim recovery. Further decline is in favor this week. Break of 1.2761 will target 55 D EMA (now at 1.2720) and below. Nevertheless, on the upside, break of 1.2994 resistance will argue that the pull back has completed, and bring retest of 1.3141 high.
In the bigger picture, as long as 1.2678 resistance turned support holds, rise from 1.0351 (2022 low) is expected to continue. Next target is 100% projection of 1.0351 to 1.2445 from 1.1801 at 1.3895. However, sustained break of 1.2678 will argue that it's at least correcting this rally, with risk of bearish reversal.
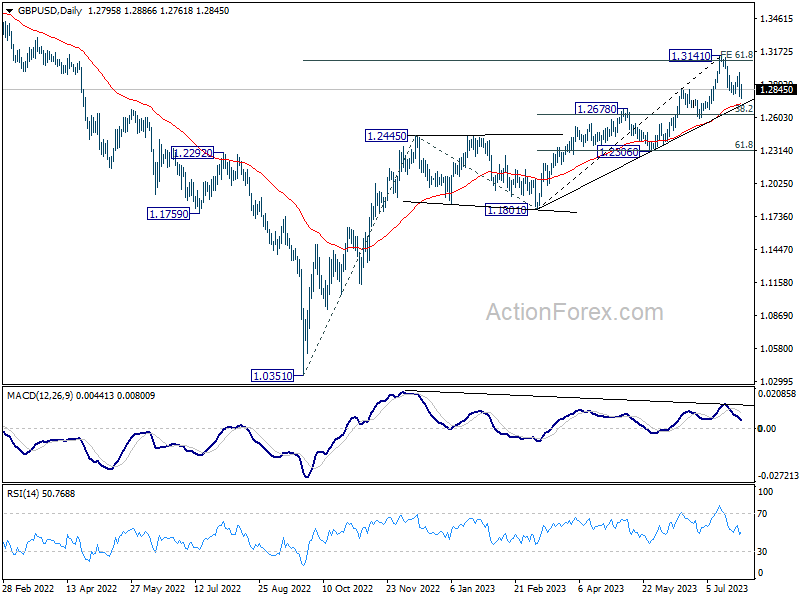
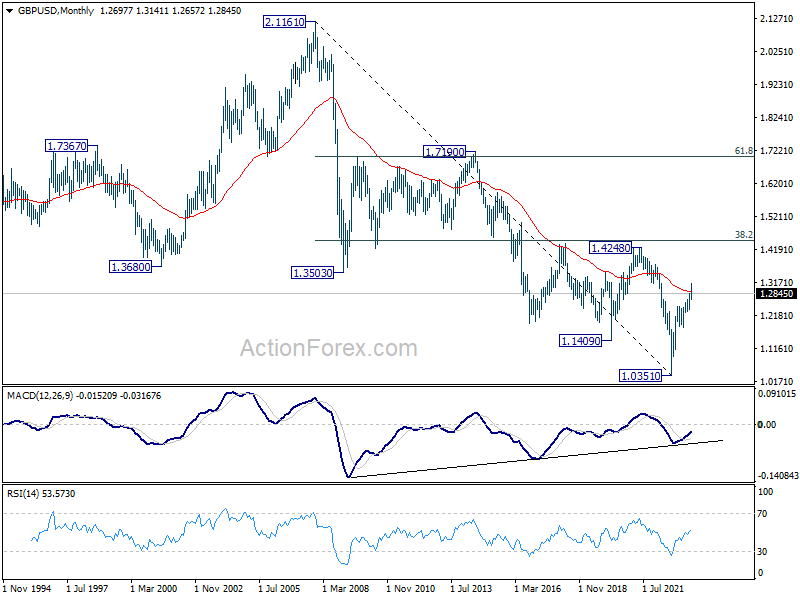
In the long term picture, sustained trading above 55 M EMA (now at 1.2909) will add to the case of long term bullish reversal. Decisive break of 1.4248 cluster resistance (38.2% retracement of 2.1161 (2007 high) to 1.0351 at 1.4480) will confirm completion of whole down trend from 2.1161. Nevertheless, rejection by 1.4248/4480 will keep long term outlook neutral at best.
USD/CHF Weekly Outlook
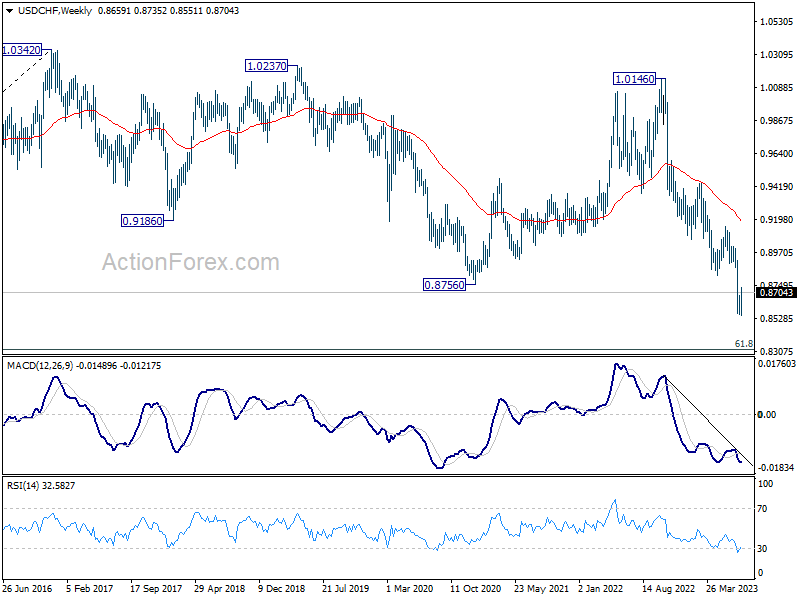
USD/CHF dropped to 0.8851 last week but quickly recovered since then. Initial bias is mildly on the upside this week for 0.8818 support turned resistance. Strong resistance could be seen there to complete the recovery and bring down trend resumption. On the downside, firm break of 0.8551 will resume larger down trend from 1.0146, targeting 0.8317 fibonacci level.
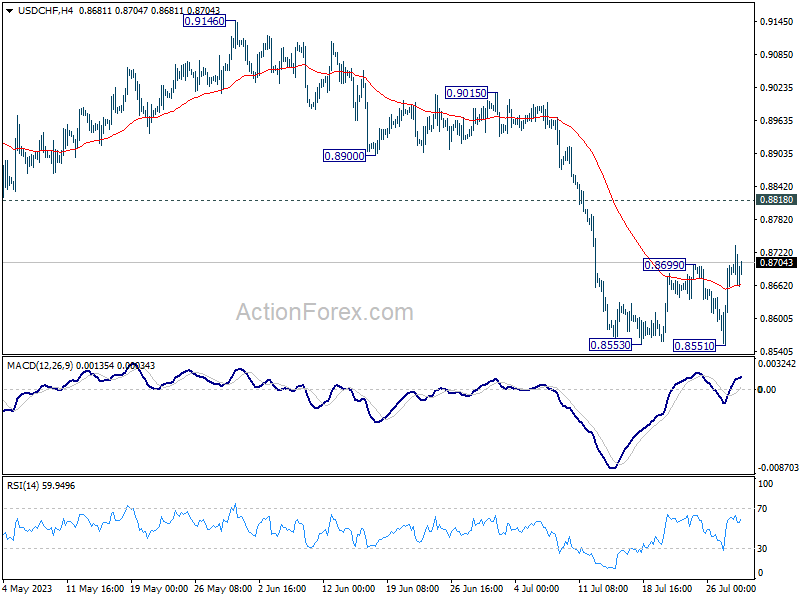
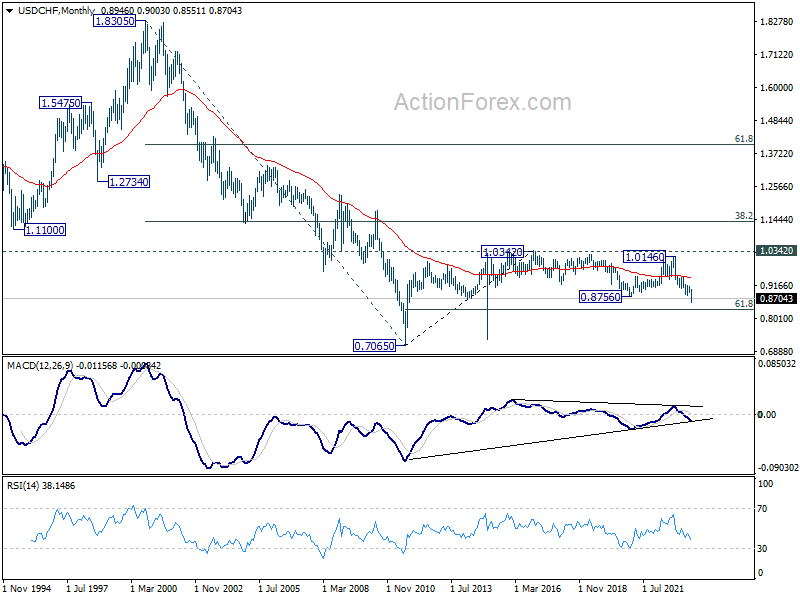
In the bigger picture, down trend from 1.0146 is seen as in progress as long as 0.8188 support turned resistance holds. Next target is 61.8% retracement of 0.7065 (2011 low) to 1.0342 (2016 high) at 0.8317. However, sustained break of 0.8818 will be the first sign of medium term bottoming, and turn focus back to 0.9146 resistance for confirmation.
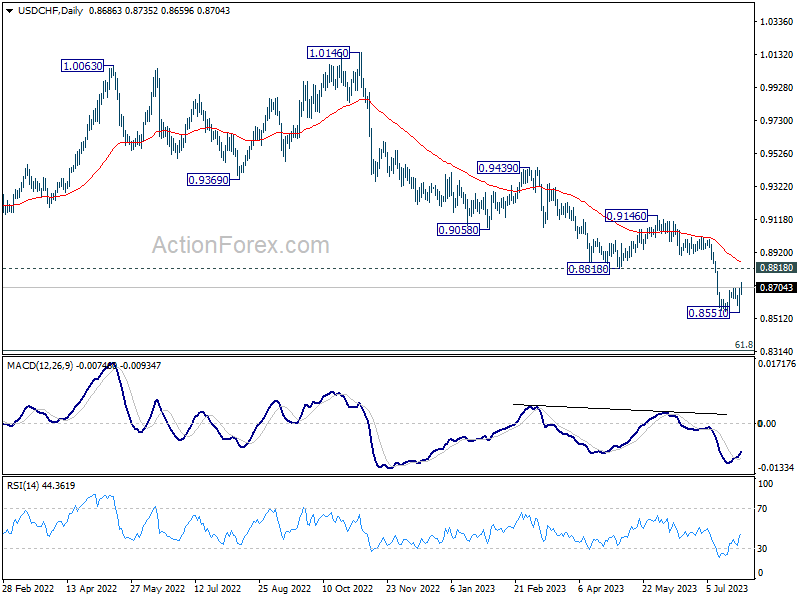
In the long term picture, there is no clear sign that down trend from 1.8305 (2000 high) has completed. With 38.2% retracement of 1.8305 to 0.7065 at 1.1359 intact, outlook is neutral at best. Sustained break of 61.8% retracement of 0.7065 (2011 low) to 1.0342 (2016 high) at 0.8317 will bring retest of 0.7065 low.
AUD/USD Weekly Report
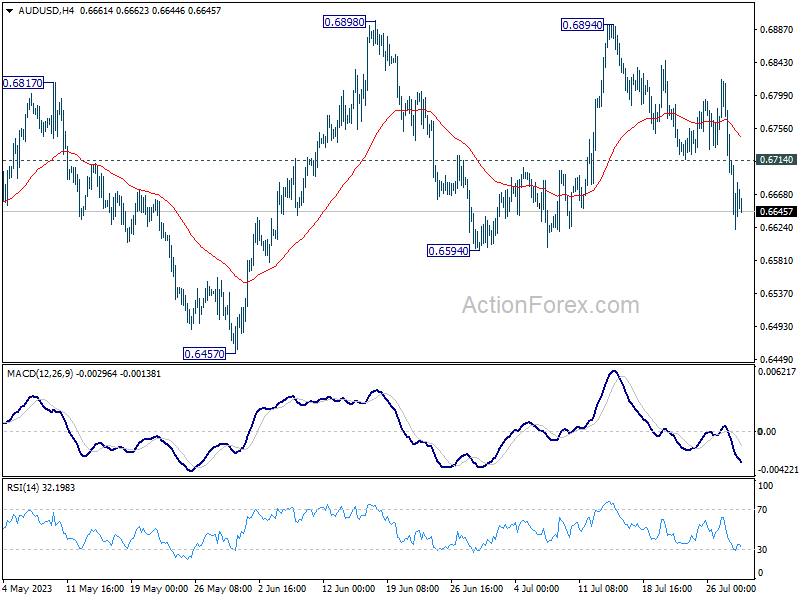
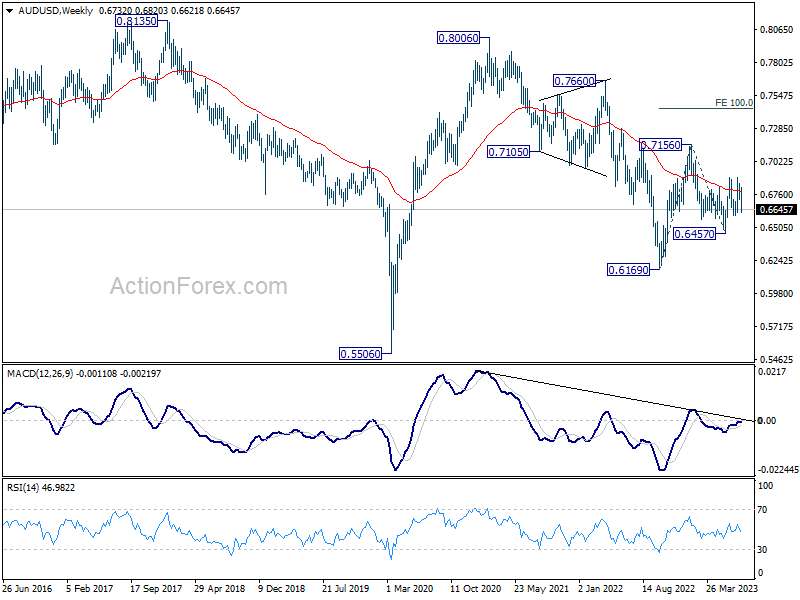
AUD/USD's decline from 0.6894 extended lower last week and hit as low as 0.6621. Deeper fall is in favor this week, but strong support should be seen from 0.6594 to complete to corrective pattern from 0.6898. On the upside, break of 0.6714 support turned resistance will turn bias back to the upside for retesting 0.6894/8 resistance zone. However, sustained break of 0.6594 will dampen this will and bring deeper fall towards 0.6457.
In the bigger picture, outlook is mixed for now as AUD/USD failed to sustain above both 55 D EMA (now at 0.6720) and 55 W EMA (now at 0.6784). On the upside, break of 0.65898 resistance will solidify the case that down trend from 0.8006 (2021 high) has already completed, and target 0.7156 resistance for confirmation. However, break of 0.6457 will likely resume the down trend through 0.6169 (2022 low).
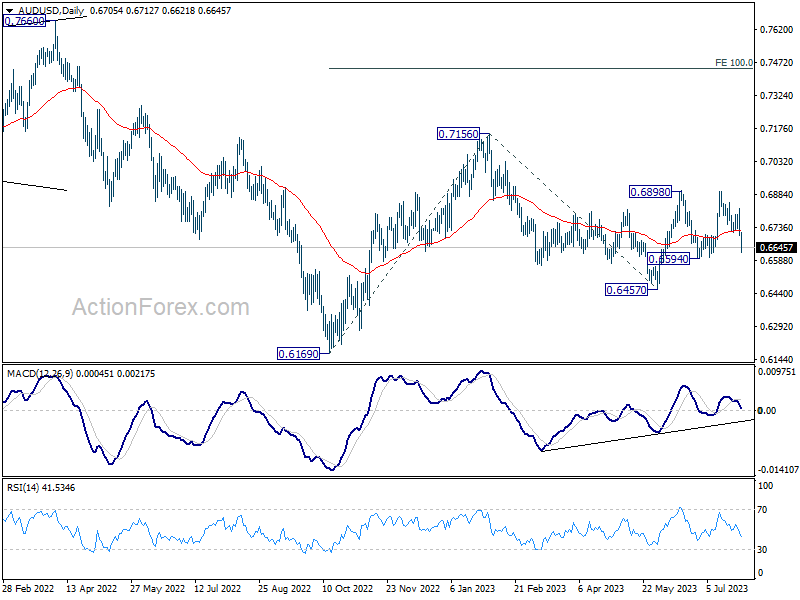
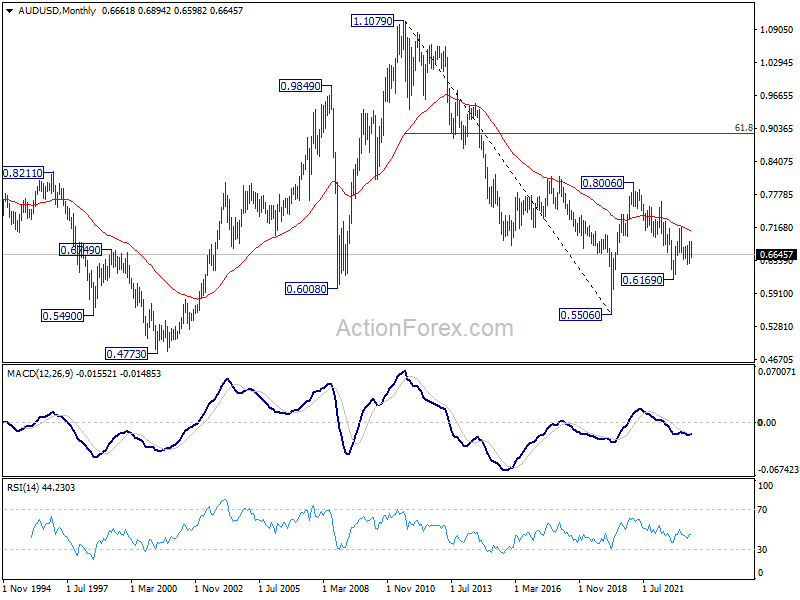
In the long term picture, fall from 0.8006 is seen as a corrective move to up rise from 0.5506 (2020 low). This correction could have completed at 0.6169. Sustained trading above 55 M EMA (now at 0.7085) will affirm this case, and indicate that rise from 0.5506 is ready to resume. However, firm break of 0.6169 will revive long term bearishness and turn focus back to 0.5506 low.
USD/CAD Weekly Outlook
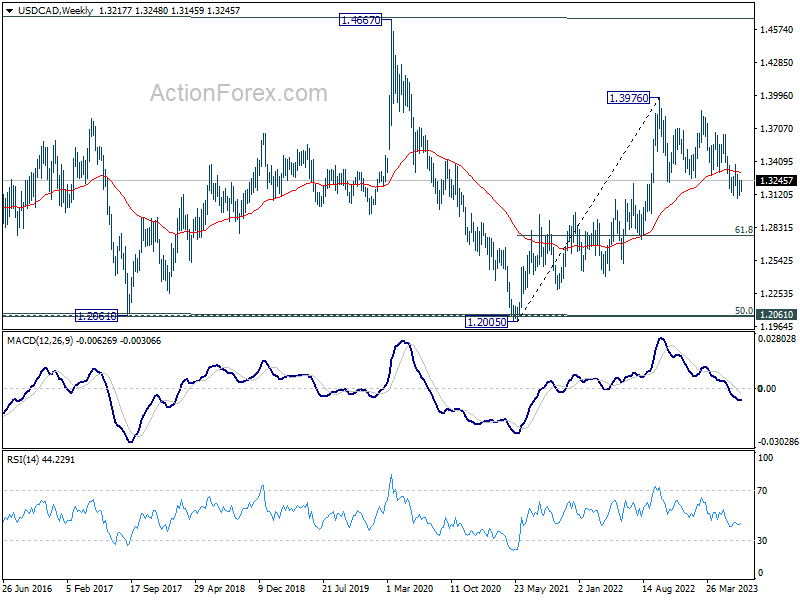
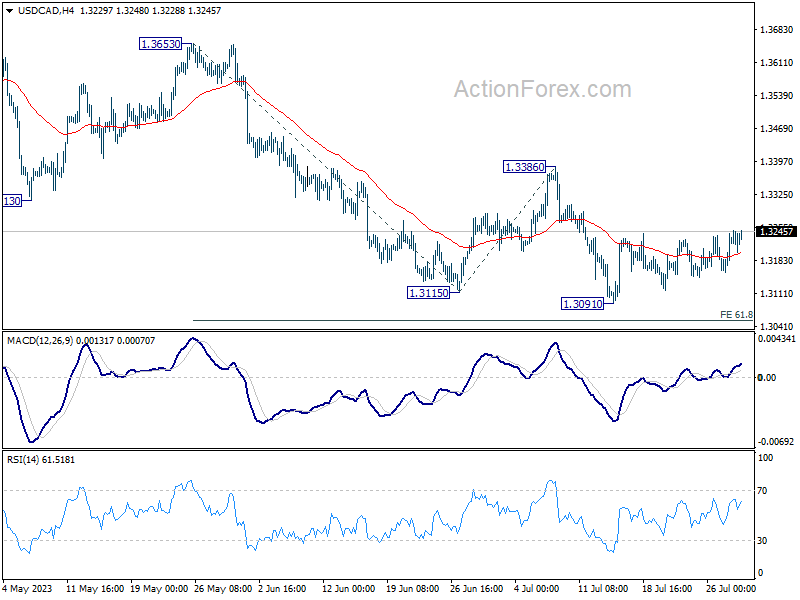
USD/CAD extended sideway trading above 1.3091 last week and outlook is unchanged. Initial bias stays neutral this week first. Outlook stays bearish for further decline with 1.3385 resistance intact. On the downside, break of 1.3091 will resume larger fall and target 61.8% projection of 1.3653 to 1.3115 from 1.3386 at 1.3054. However, firm break of 1.3386 will indicate near term reversal and turn outlook bullish.
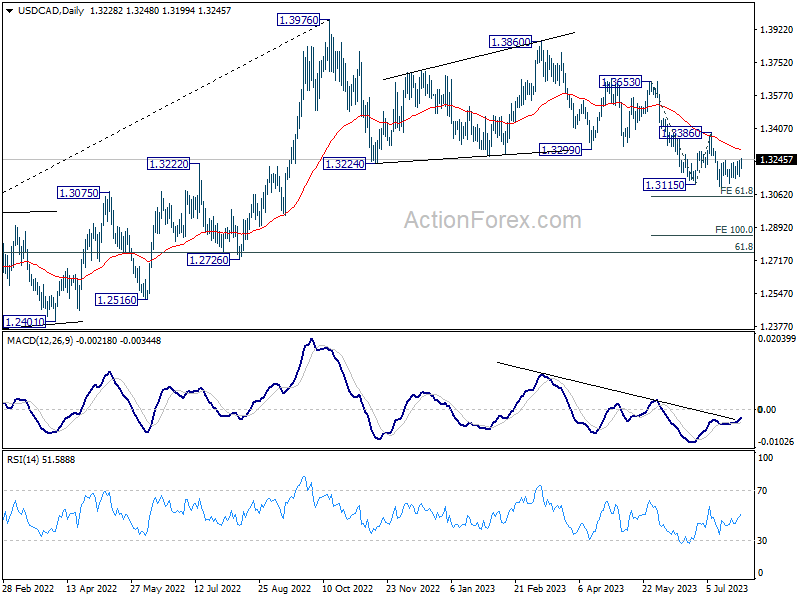
In the bigger picture, price actions from 1.3976 are viewed as a correction to up trend from 1.2005 (2021 low) only. But even so, deeper decline is expected as long as 1.3386 resistance holds. Further fall could be seen to 61.8% retracement of 1.2005 to 1.3976 at 1.2758. Meanwhile, break of 1.3386 will be a sign that the correction has completed and bring stronger rally back to retest 1.3976.
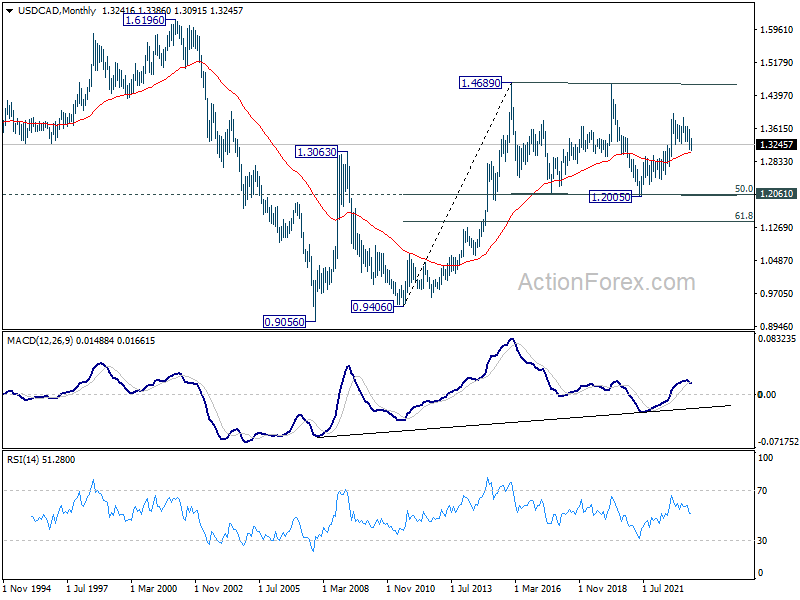
In the longer term picture, price actions from 1.4689 (2016 high) are seen as a consolidation pattern only, which might have completed at 1.2005. That is, up trend from 0.9506 (2007 low) is expected to resume at a later stage. This will remain the favored case as 55 M EMA (now at 1.3048) holds.