Sample Category Title
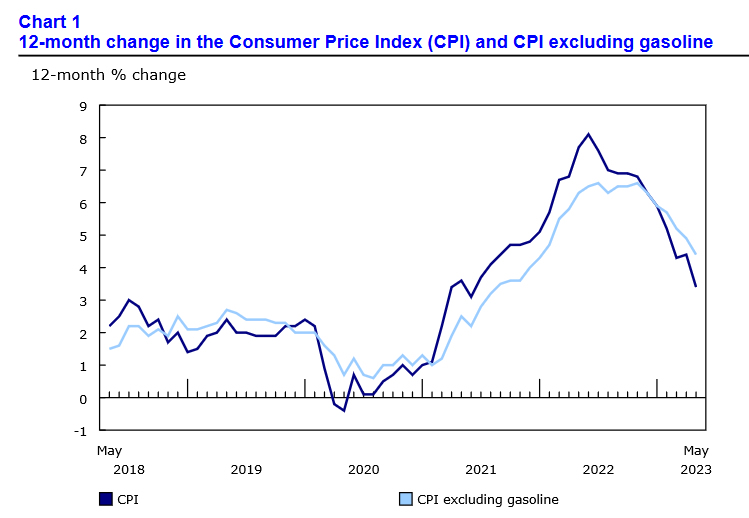
Canada CPI slowed to 3.4% yoy, lowest since Jun 2021
Canada CPI slowed from 4.4% yoy to 3.4% yoy in May, matched expectations. That's the lowest reading since June 2021, largely driven by lower year-over-year prices for gasoline (-18.3% ) resulting from a base-year effect.
Excluding gasoline, CPI also slowed from 4.9% yoy to 4.4% yoy. Mortgage interest cost index (+29.9%) remained the largest contributor to year-over-year CPI increase. Excluding mortgage interest cost, CPI rose slowed from 3.7% yoy to 2.5% yoy.
CPI median fell from 4.2% yoy to 3.9% yoy. CPI trimmed fell from 4.2% yoy to 3.8% yoy. CPI common fell from 5.7% yoy to 5.2% yoy.
On a monthly basis, CPI rose 0.4% mom, matched expectations.
Silver’s Golden Cross Points to Bright Prospects
Silver fell sharply last week but has recently shown encouraging signs of recovery. The tactical objectives of silver’s decline appear to have been achieved, and silver is now in demand, reinforcing confidence that the bulls have defended the long-term uptrend.
Last week, silver lost over 8.5% from Monday’s high to Friday’s low. This appeared to be the final chord of the sellers, followed by a tidy comeback by the buyers on Friday afternoon. Notably, this uptrend is going against the downtrends in other risk-sensitive markets.
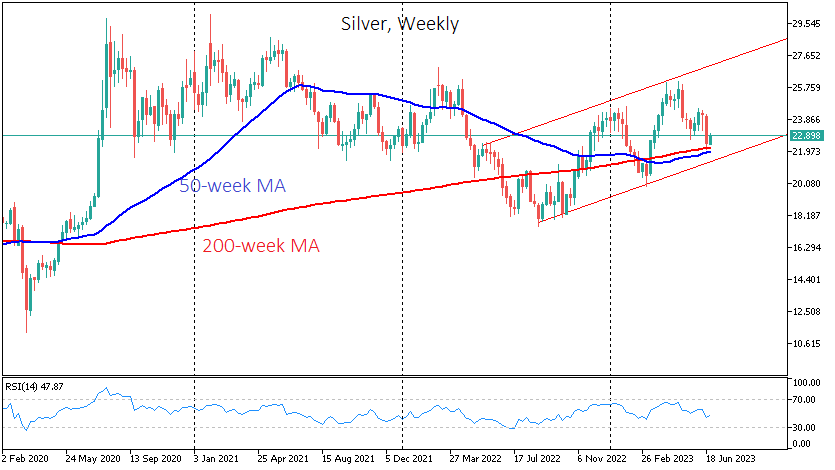
On the weekly timeframe, last week’s low was a touch of the 200-week moving average (now at $22.17), reflecting traders’ bullish sentiment. Slightly lower, at $22, is the faster 50-week MA. Both are pointing up, indicating a bullish market and the faster one is about to cross the slower one. Such a pattern in technical analysis is called a Golden Cross. It is often seen on the daily timeframe, but very rarely, and therefore can be even more significant on the weekly timeframe.
The closest analogy, in terms of price action and these key averages and fundamentals, was seen in 2009, which preceded the 200%+ rally of the following two years. However, it did not occur immediately after the cross.
The May-June decline also looks like a test of the lower boundary of the upward corridor formed last August. The upper limit is now at $26.6 and will rise to $29 by the end of the year.
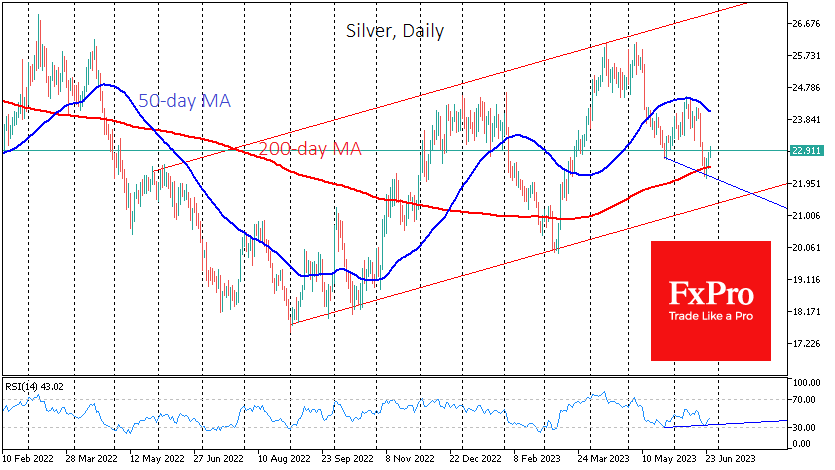
On the daily timeframe, the local picture is bullish. Silver quickly managed to get back above its 200-day MA, and with the price touching $23.0 on Tuesday morning, the question arises as to whether the recent rally is a bounce as part of a broader decline.
Separately, on the same daily timeframe, we note the divergence between the RSI and the silver price: lower price lows in June correspond to higher index lows. This suggests that the downward momentum is waning. The RSI has not even reached an oversold level for the second time.
If our view on silver is correct, we should see a return to the flat 24s and above and a repeat of the local highs at $26 before the end of the summer.
CHF/JPY Technical: Rallied Above 43-Year High
- Current impulsive up move of CHF/JPY has cleared above major resistances of 157.98 & 158.45.
- Short-term momentum remains bullish.
- 90 is the key short-term support to watch.
The CHF/JPY cross has continued to its relentless rally as it broke above key resistance levels; 157.98 (the high obtained right during the EUR/CHF unpegged shock in January 2015) and 158.45 (Oct 1979 major swing high).
Broke above Oct 1979 major swing high of 158.45
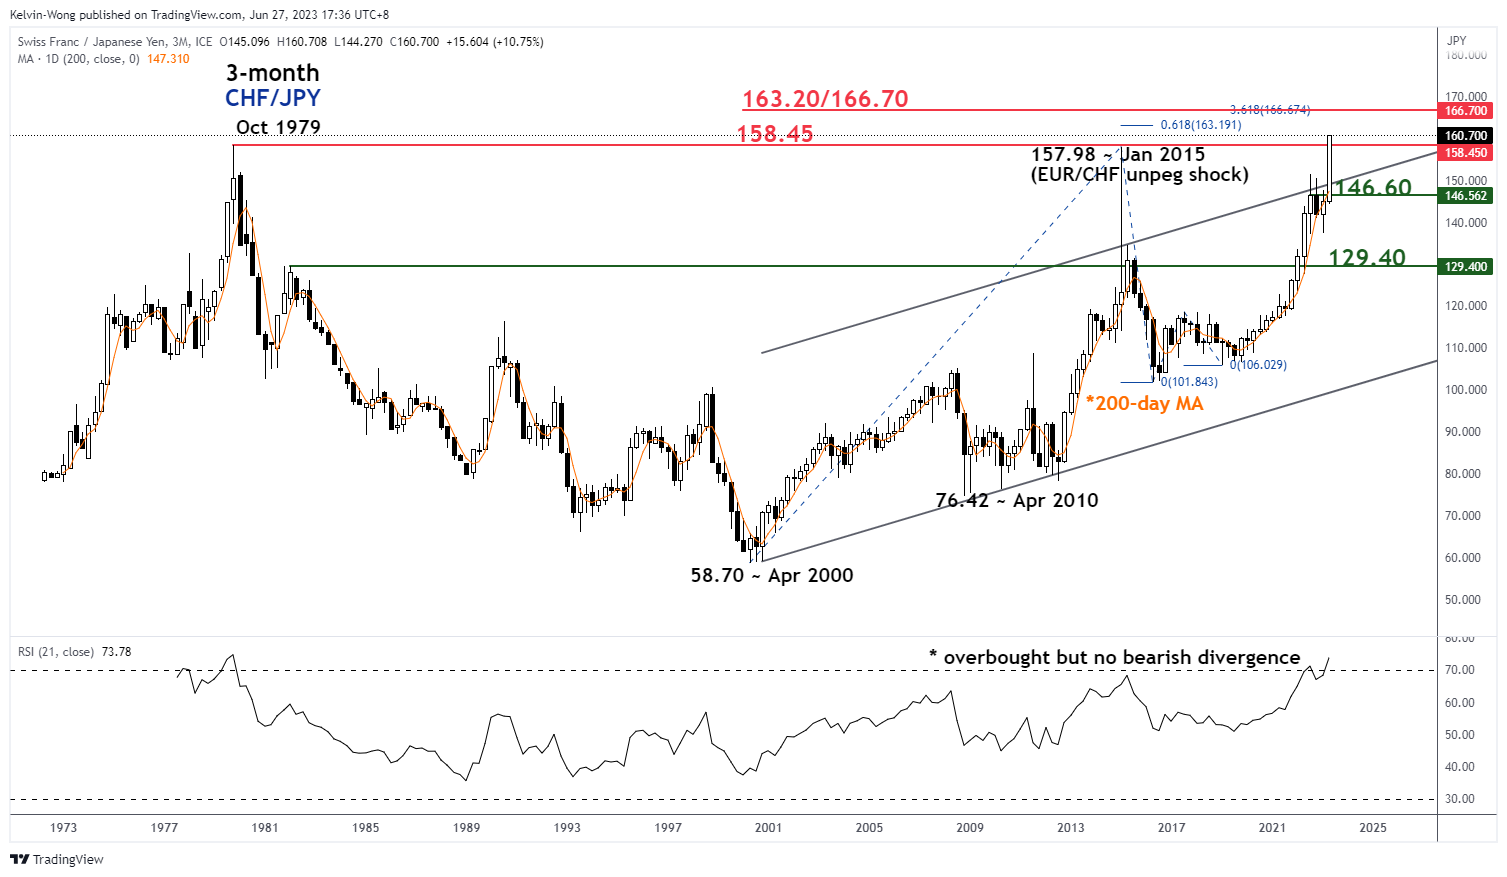
Fig 1: CHF/JPY long-term secular trend as of 27 Jun 2023 (Source: TradingView, click to enlarge chart)
The next key medium-tern resistance zone stands at 163.20/166.70 defined by a cluster of Fibonacci extension levels (see 3-month chart).
The key medium-term support rests at 146.60 defined by the 200-day moving average and the former swing highs of July/October 2022.
The short-term uptrend remains intact
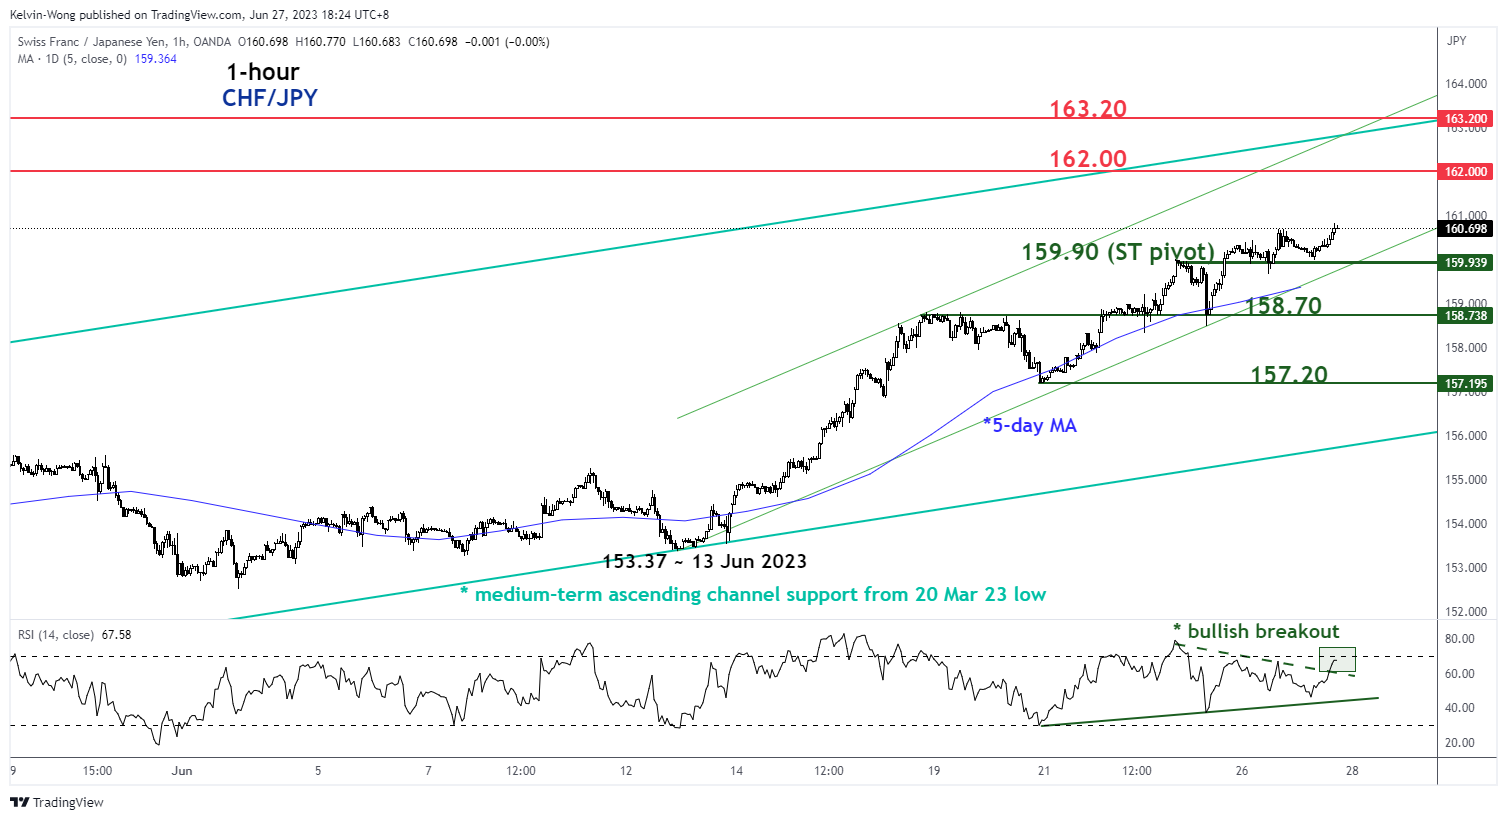
Fig 2: CHF/JPY minor short-term trend as of 27 Jun 2023 (Source: TradingView, click to enlarge chart)
The price actions of CHF/JPY have continued to evolve within a minor ascending channel in place since the 13 June 2023 low of 153.37 and traded above the upward-sloping 5-day moving average (see 1-hour chart).
The hourly RSI has just staged a bullish breakout which indicates that short-term momentum remains positive.
Watch the 159.90 key short-term pivotal support with the next resistances coming in at 162.00 (psychological level) and 163.20 (the intersection between the upper boundaries of both the medium-term and minor ascending channels).
However, a break below 159.90 negates the bullish tone to expose the next minor supports at 158.70 and 157.20.
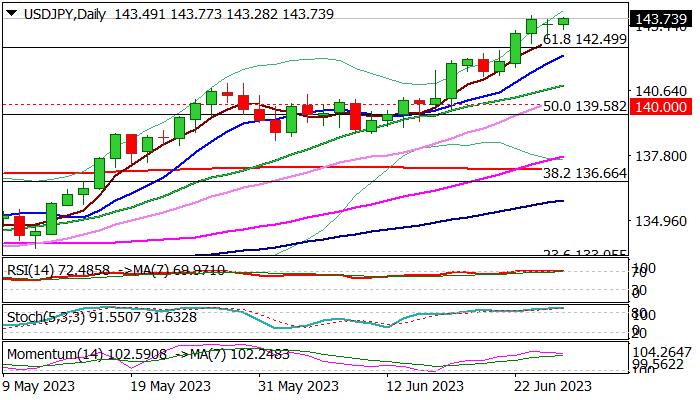
EUR/JPY Outlook: Hits 15-Year High
The EURJPY cross hit new highest since September 2008 on Tuesday, as larger bulls regained control after a two-day pause and a false signal from last Friday’s hanging man candle.
Broader weakness of Japanese yen extends, despite signals that Japan is ready to intervene and protect its currency.
Near-term action is so far ignoring strongly overbought daily studies, riding on extended third wave of five-wave cycle from 109.38 (June 2016 low) heading towards targets at 160 (psychological and 160.52 (Fibo 161.8% expansion of the wave C from 114.41 trough (May 2020).
Daily Tenkan-sen in a steep ascend marks strong support (154.49) which should keep the downside protected and maintain firm bullish stance., followed by lower pivot at 153.01 (daily Kijun-sen), violation of which would sideline bulls.
Res: 158.00; 159.41; 160.00; 160.52.
Sup: 156.93; 155.75; 155.05; 154.49.
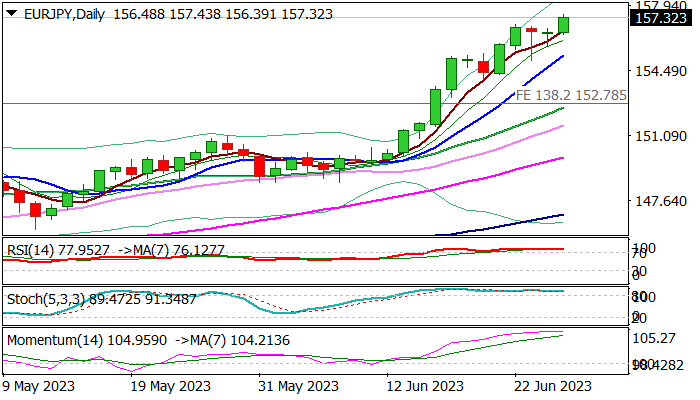
USD/JPY: Bulls Look for Further Upside But Markets Remain Cautious About Possible Intervention
USDJPY keeps firm bullish tone and trading near new multi-month high in European session on Tuesday, as bulls regain traction after pausing on Monday.
The pair stays above broken pivotal Fibo barrier at 142.50 (61.8% of 151.94/127.22) for the fourth consecutive day, which adds to bullish outlook.
Near-term action remains supported by bullish daily studies (strong positive momentum / MA’s in full bullish configuration), though overbought conditions warn of extended consolidation before bulls continue.
Bulls eye next target at 146.10 (Fibo 76.4%) which guards Oct 31 lower top at 148.84 and psychological 150 barrier.
However, traders remain cautious following recent comments from Japan’s official about possible intervention to stop yen’s slide, mainly driven by wide gap between Fed and BOJ’s monetary policies.
Japan is keeping on the table all available tools and signaled readiness to act and protect the currency from further slide, with trigger for action seen on USDJPY’s rise above 145.00 level.
Broken Fibo barrier at 142.50 reverted to solid support, along with nearby rising 10DMA (142.15), with break of these levels to sideline immediate bulls and signal deeper pullback towards 140.93/84 (former top of May 30 / 20DMA) and psychological 140.00 support.
June 1 higher low (138.43) marks key near-term support, loss of which would signal reversal and open way for deeper fall.
Res: 143.87; 144.56; 145.10; 146.10.
Sup: 142.94; 142.50; 142.15; 141.86.
ECB Lagarde reiterates further tightening in July
ECB President Christine Lagarde, while speaking at the ECB Forum today , emphasized that the bank"s job was far from over. She reiterated that "barring a material change to the outlook, we will continue to increase rates in July."
As ECB treads further into restrictive territory, Lagarde indicated that the central bank would be paying close attention to two aspects of its policy - the "level" of rates and the communication around future decisions, particularly in terms of "length" of time rates are expected to stay at that level.
She underscored the presence of two main uncertainties affecting the "level" and "length" of the bank"s interest rate policies.
The first is the uncertainty about inflation persistence, which makes the peak level of rates state-contingent. The second involves the uncertainty around monetary policy transmission, an issue heightened by the fact that Eurozone has not experienced a sustained phase of rate hikes since the mid-2000s and has never witnessed such swift rate rises.
EURJPY Jumps to a Fresh 15-Year High
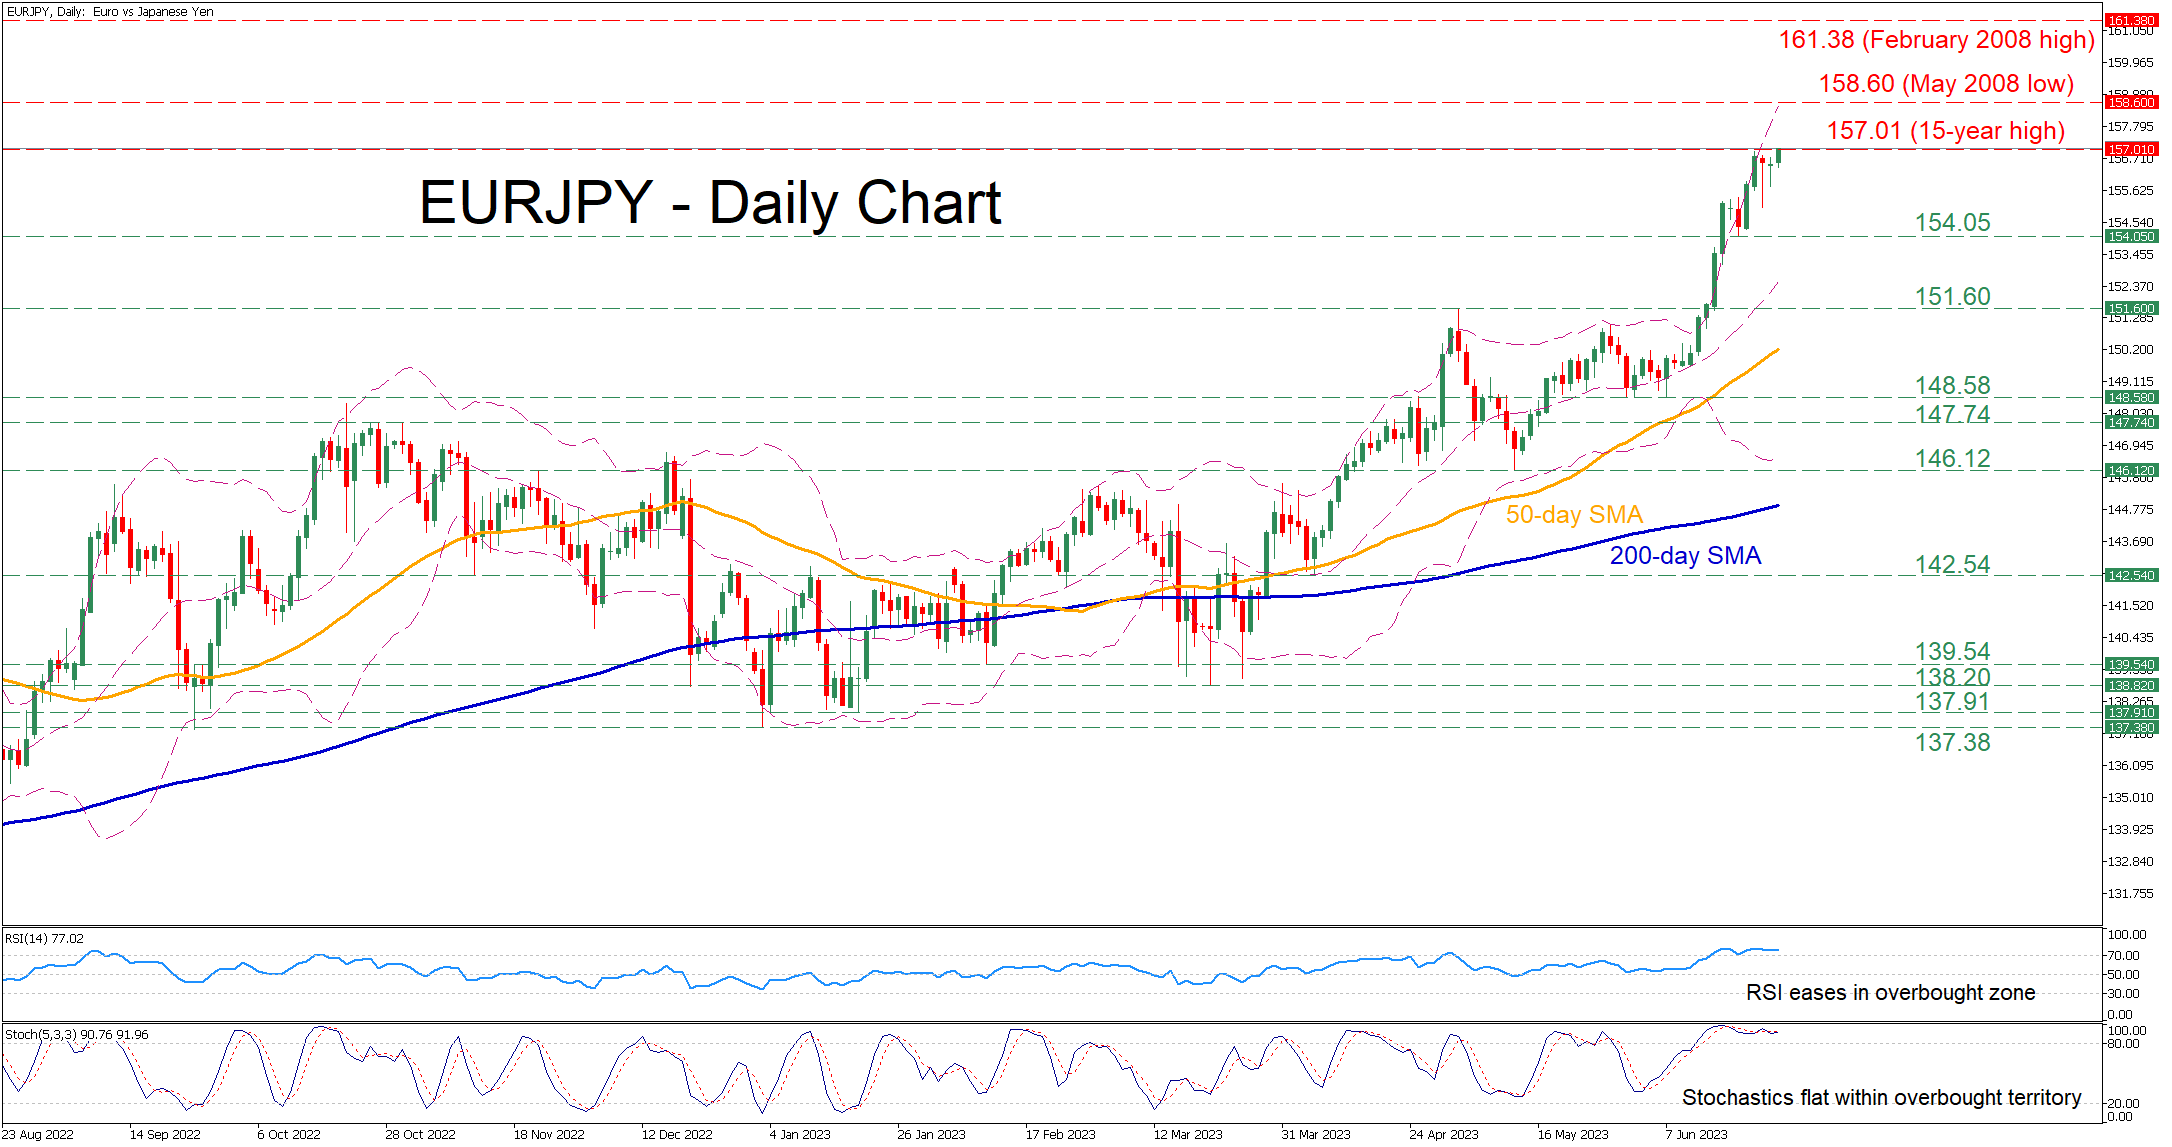
EURJPY has been in a strong uptrend since the beginning of the year, posting a fresh 15-year high of 157.20 in today’s session. However, this rally appears to have reached overbought conditions, thus a potential downside correction might be on the cards.
The momentum indicators currently suggest that bullish forces could be running out of juice. Specifically, both the RSI and the stochastic oscillator are flat within their overbought territories, hinting towards a rally exhaustion.
Should bearish pressures emerge, the price could initially test the recent support of 154.05. Diving lower, the pair could descend towards the previous resistance of 151.60, which could serve as support in the future. Even lower, the June bottom of 148.58 may provide downside protection.
On the flipside, if the price attempts to extend its advance, the recent 15-year high of 157.20 could prove to be the first barrier for buyers to conquer. Piercing through that wall, the pair might ascend to form fresh multi-year highs, where the May 2008 low of 158.60 could curb any upside moves. A violation of the latter could open the door for the February 2008 peak of 161.38.
Overall, even though EURJPY recorded a fresh 15-year high in today’s session, its rally appears to be fading. Hence, traders should not rule out a pullback as the price has reached overbought conditions.
USDCAD Analysis: Low of the Year
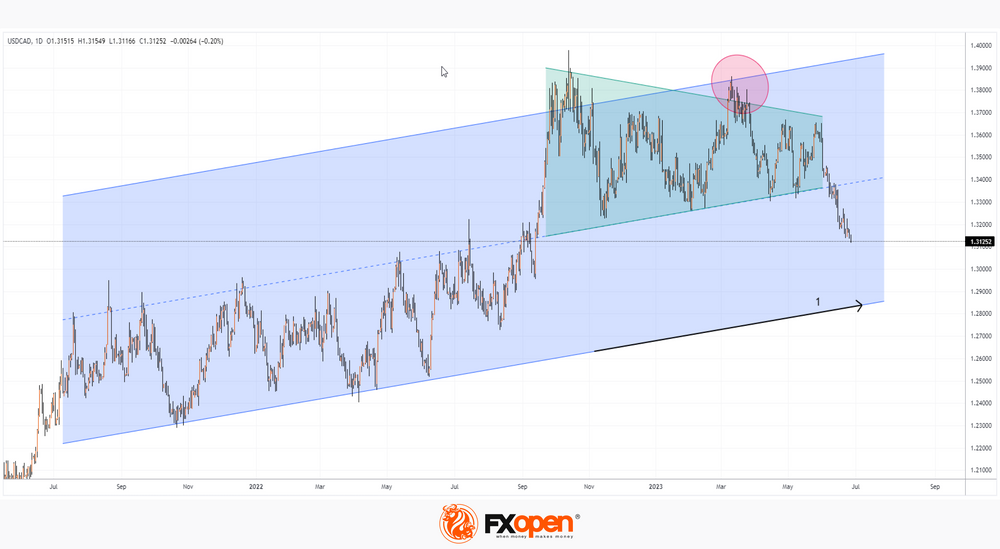
USD/CAD fell below 1.3130 this morning, a level not seen since September 2022. The strength of the Canadian dollar can be justified, among other things, by the fact that the inflation rate in Canada is lower than in the US.
In April, we wrote that a false bullish break (indicated by a circle) of a triangle (shown in green) could indicate that a genuine break would occur in a bearish direction and set a downtrend in the USD/CAD market. And so it happened.
Today's news on inflation in Canada (15:30 GMT+3) may significantly affect the dynamics of the current downtrend, which, if continued, has the prospect of reaching the bottom line (1) of the long-term channel.
Yield Curve and Stock Market Downside Risks
The yield curve compares three-month, two-year, five-year, 10-year and 30-year US Treasury bonds. Under a normal curve, the longer the maturity, the higher the yield.
However, analysts at Crescat Capital point to an inversion in the current bond market — yields on short-term bonds are clearly higher. This can be used as a harbinger of a sharp decline in the price of stock indices, as history shows: the inversion was observed before the crisis of 2008, during the dot-com bubble in 2000, and even during the sharp decline in the price of the S&P 500 during the pandemic in 2020.
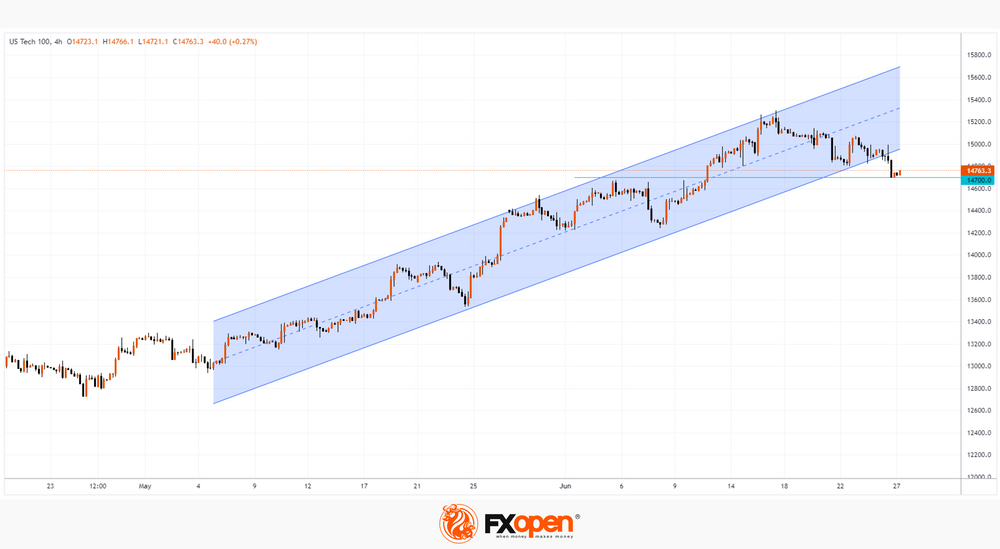
At the same time, the danger may lie primarily for the technology stocks included in the Nasdaq 100, because this market feels the hype due to AI. So, during yesterday's trading, futures for technology stocks E-mini Nasdaq 100 fell much faster than the E-mini S&P 500.
The Nasdaq 100 chart is also showing alarming signals. The price of the index broke down the channel (shown in blue) of the uptrend, which has been operating on the market since May. So far, the bulls are feeling support from the 14,700 level, which served as resistance earlier this month. But the support could be short-lived and the market could become bearish, adding to the urgency of the yield curve warning.
GBPUSD Still Threatened Despite Soft Upturn
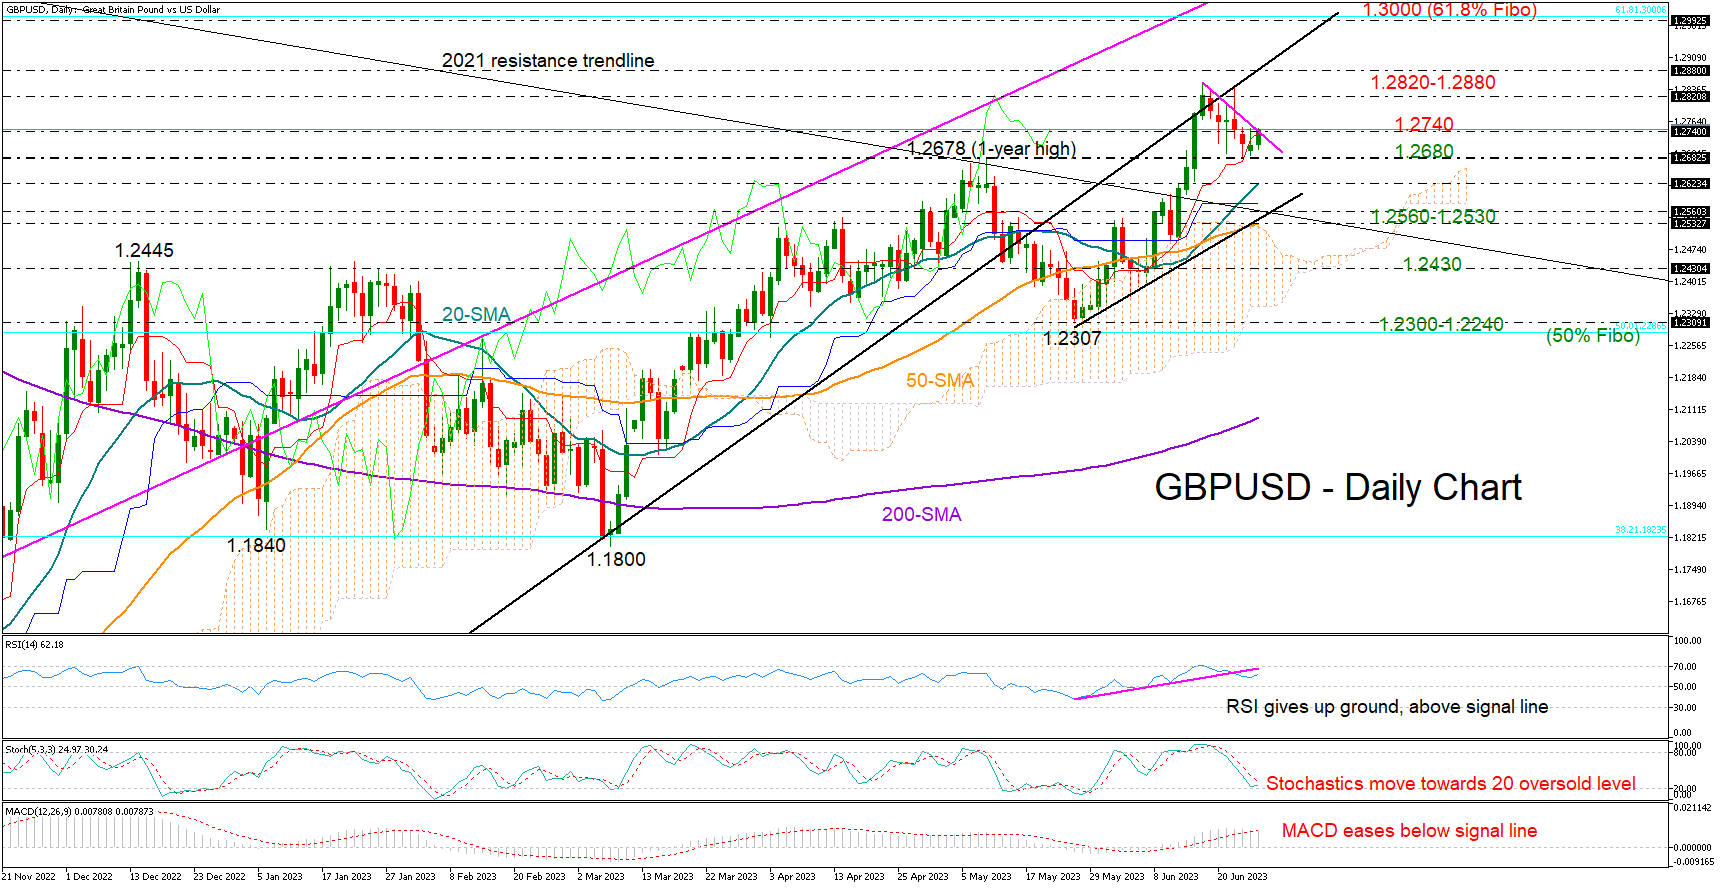
GBPUSD closed Monday’s session with marginal gains around 1.2700 after receiving strong protection from the 1.2680 base for the third consecutive trading day.
Bulls tried to increase the price on Tuesday, but the technical outlook stayed weak, casting doubt on whether there was enough strength for an upsurge. The pair seems to be trapped below a tough resistance trendline at 1.2740 and beneath the red Tenkan-sen line. Moreover, the MACD has slid below its red signal line and the RSI, although above its 50 neutral mark, has slipped below its previous high, reflecting weakening buying interest.
In trend signals, the price has paused its latest bearish correction near May’s highs and comfortably above its simple moving averages (SMAs), retaining a bullish structure in the medium and long-term picture. That said, the price seems to be hovering within a descending triangle in the four-hour chart, which is usually a bearish pattern.
A decisive extension above 1.2740 would reduce negative risks, prompting a rally towards the crucial 1.2820-1.2880 constraining zone, where the support-turned-resistance trendline from the 2022 record low is positioned. Beyond that wall, the pair could spike towards the 1.3000 psychological mark, which overlaps with the 61.8% Fibonacci retracement of the 2021-2022 downtrend. If the latter gives way too, upside pressures could intensify towards the spring 2022 barrier of 1.3080-1.3150.
Otherwise, a pullback below 1.2740 could bring the 1.2680 floor back under examination. If the bears claim that region, the 20-day SMA may attempt to block the way down to 1.2560-1.2530. The 50-day SMA and the short-term ascending trendline from May are making this territory important to watch. Failure to hold above that bar could squeeze the price to 1.2430.
All in all, despite the latest soft upturn in GBPUSD, the pair is still trading within a caution area. A sustainable extension above 1.2740 is required to eliminate downside risks, whereas a drop below 1.2680 is expected to worsen market sentiment.