Sample Category Title
AUD/USD Daily Report
Daily Pivots: (S1) 0.6664; (P) 0.6679; (R1) 0.6690; More...
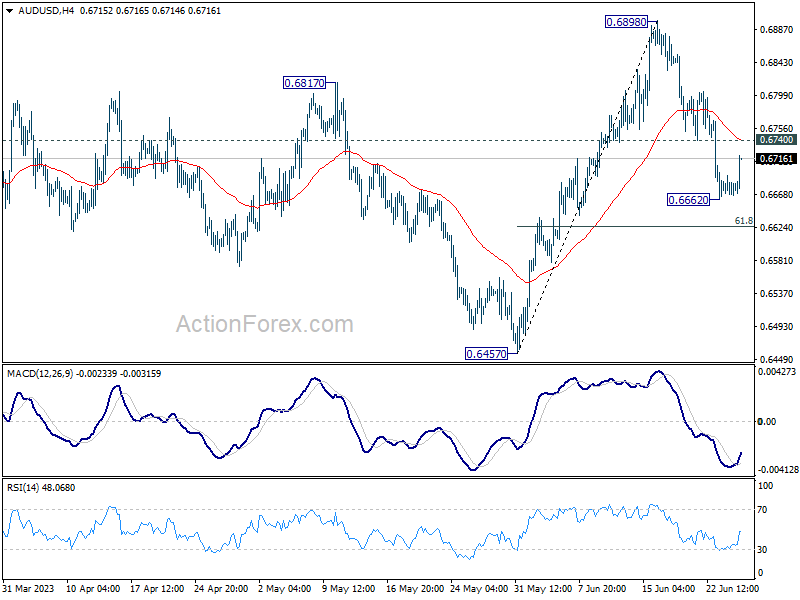
Intraday bias in AUD/USD is turned neutral with current recovery. On the upside, firm break of 0.6740 resistance will argue that pull back from 0.6898 has completed, and turn bias to the upside for stronger rebound. Nevertheless, break of 0.6662 will resume the fall to 61.8% retracement of 0.6457 to 0.6898 at 0.6625. Sustained break there would bring deeper decline back to 0.6457 support.
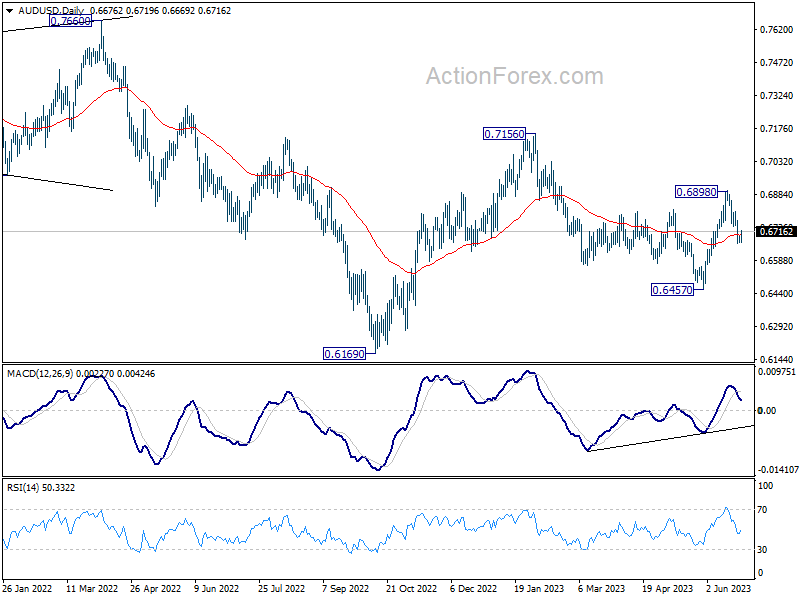
In the bigger picture, outlook is mixed up by the deeper the expected pull back from 0.6898. Still, price actions from 0.7156 are seen as a correction to rebound from 0.6169. Break of 0.6457 will resume the fall towards 0.6169 low. On the upside, though, break of 0.6898 resistance will argue that rise from 0.6169 is ready to resume through 0.7156.
Aussie Bounces Together with Yuan, Canadian Awaits CPI
In an otherwise lackluster Asian trading session, Chinese actions add a zing today. The rebound in Yuan, propelled by China's stepped-up measures to curb its slide, provided a boost to stock markets in both China and Hong Kong. The ripple effects are also being felt by Aussie and Kiwi, which are witnessing a bounce. Canadian Dollar also trades on the stronger side as investors await inflation data from Canada. Conversely, amid risk-on sentiment, Dollar, Yen, and Swiss Franc are trailing as the day's underperformers, while Euro and Sterling are trading mixed.
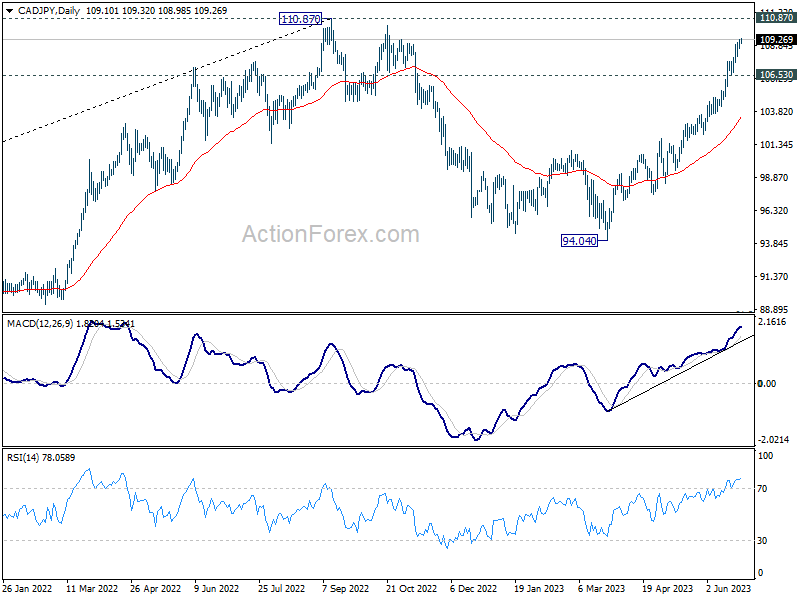
CAD/JPY would be an interesting one to watch today. On one side, robust consumer inflation data from Canada could strengthen the argument for another interest rate hike by BoC next month, thereby bolstering the Loonie. On the other hand, as Japanese officials grow increasingly vocal, the threat a Yen intervention looms large. Therefore, as CAD/JPY rally nears 110.87 high, it might start shedding momentum due to profit-taking. From a technical standpoint, breaking of 106.53 support level would confirm a short-term top and usher in a deeper pullback.
In Asia, at the time of writing, Nikkei is down -0.74%. Hong Kong HSI is up 1.56%. China Shanghai SSE is up 0.93%. Singapore Strait Times is up 0.41%. Japan 10-year JGB yield is up 0.0196 at 0.373. Overnight, DOW dropped -0.04%. S&P 500 dropped -0.45%. NASDAQ dropped -1.16%. 10-year yield dropped -0.020 to 3.719.
China steps up efforts to curb yuan's decline, defends 7.25
The Offshore Chinese Yuan (CNH) is witnessing a revival today, as China appears to be intensifying its efforts to curb the currency's recent slump. Market participants view 7.25 level against Dollar as a significant psychological threshold to uphold.
According to a report by Reuters, there's evidence that major state-owned Chinese banks are selling dollars in the offshore spot foreign exchange market. This activity suggests that authorities are keen to slow the yuan's precipitous decline in recent times.
In an additional bid to temper the yuan's slide, China set its daily reference rate for the managed currency at a stronger-than-anticipated level for a second consecutive day. This move underscores PBoC's dissatisfaction with the currency's recent rapid and unilateral depreciation, particularly the swift move from 7.25.
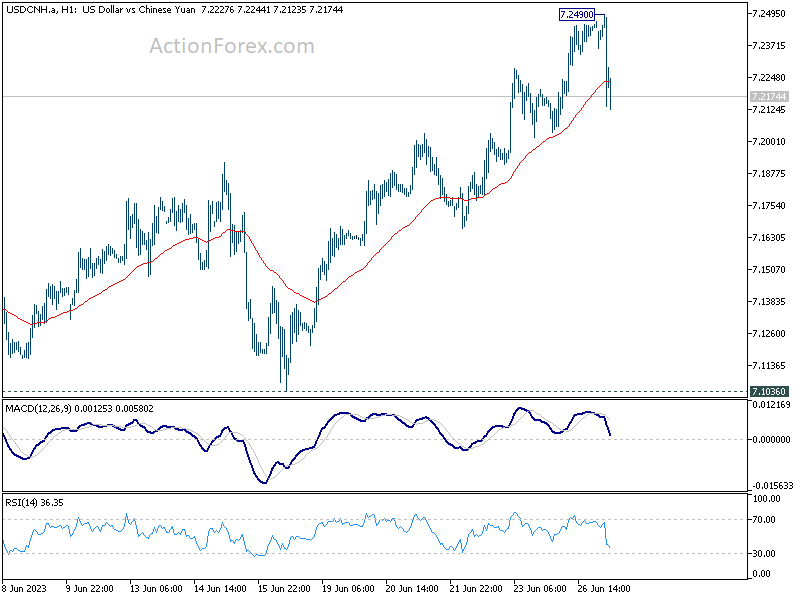
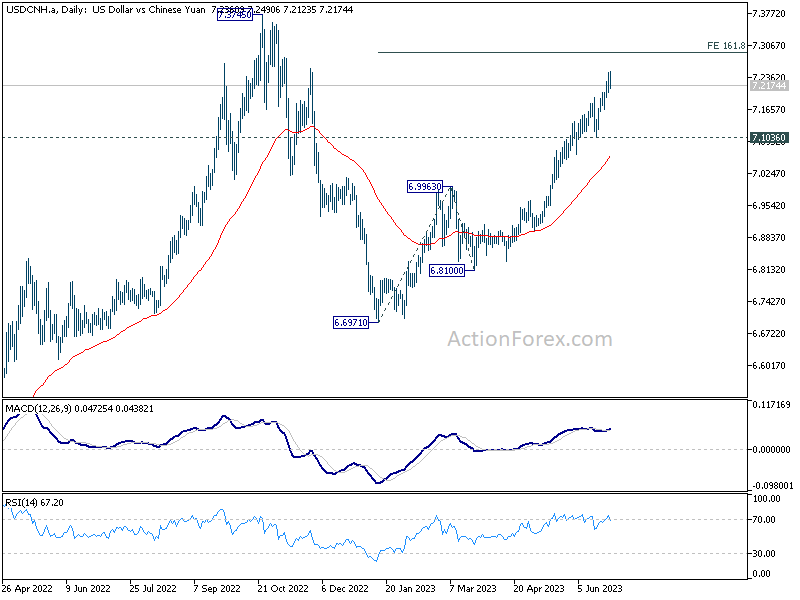
From a pure technical point of view, further rally is still in favor in USD/CNH as long as 7.1036 support holds. But the pair would likely lose upside momentum further as it approaches 161.8% projection of 6.6971 to 6.9963 from 6.8100 at 7.2941. It's unlikely for USD/CHN to break through 7.3745 high at the first attempt.
AUD/JPY bounces, ready for 97.66
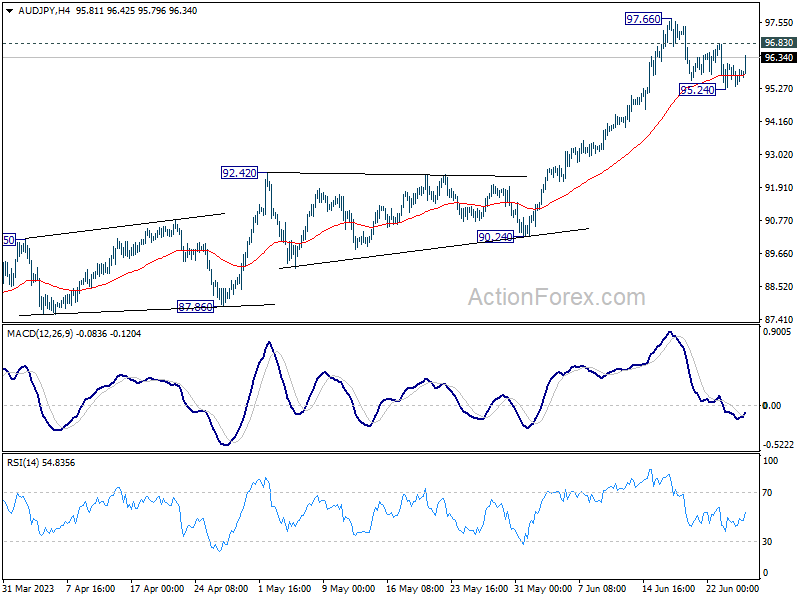
AUD/JPY bounces today as Aussie is somewhat lifted by the recovery in Chinese Yuan, after China stepped up efforts to slow its decline. From a technical perspective, the failure to sustain below 55 4H EMA is a near term bullish sign. Immediate focus is back on 86.83 minor resistance. Firm break there will suggest that pull back from 97.66 has completed at 95.24 already. Further rally should then be seen through this 97.66 resistance.
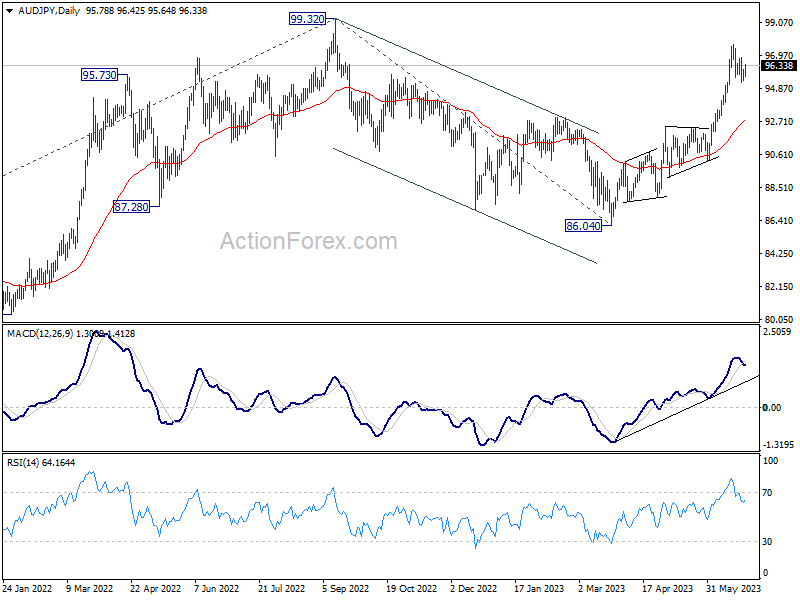
Overall, near term upside momentum is diminishing as seen in D MACD. Hence, while rise from 86.04 could extend further to retest 99.32 high, upside could be limited there on first attempt. Still, sustained break of 55 D EMA (now at 92.84) is needed to confirm topping. Otherwise, outlook will remain cautiously bullish even in case of another pull back.
Looking ahead
While the European calender is basically empty, there are some notable release to watch in North America session. Canada CPI will be crucial for BoC to determine whether to continue the restarted tightening cycle in July. From the US, focuses will be on durable goods orders and consumer confidence, while house price index and new home sales will also be featured.
AUD/USD Daily Report
Daily Pivots: (S1) 0.6664; (P) 0.6679; (R1) 0.6690; More...
Intraday bias in AUD/USD is turned neutral with current recovery. On the upside, firm break of 0.6740 resistance will argue that pull back from 0.6898 has completed, and turn bias to the upside for stronger rebound. Nevertheless, break of 0.6662 will resume the fall to 61.8% retracement of 0.6457 to 0.6898 at 0.6625. Sustained break there would bring deeper decline back to 0.6457 support.
In the bigger picture, outlook is mixed up by the deeper the expected pull back from 0.6898. Still, price actions from 0.7156 are seen as a correction to rebound from 0.6169. Break of 0.6457 will resume the fall towards 0.6169 low. On the upside, though, break of 0.6898 resistance will argue that rise from 0.6169 is ready to resume through 0.7156.
Economic Indicators Update
| GMT | Ccy | Events | Actual | Forecast | Previous | Revised |
|---|---|---|---|---|---|---|
| 12:30 | CAD | CPI M/M May | 0.50% | 0.70% | ||
| 12:30 | CAD | CPI Y/Y May | 3.40% | 4.40% | ||
| 12:30 | CAD | CPI Median Y/Y May | 4.00% | 4.20% | ||
| 12:30 | CAD | CPI Trimmed Y/Y May | 4.00% | 4.20% | ||
| 12:30 | CAD | CPI Common Y/Y May | 5.40% | 5.70% | ||
| 12:30 | USD | Durable Goods Orders May | -1.00% | 1.10% | ||
| 12:30 | USD | Durable Goods Orders ex Transportation May | 0.10% | -0.30% | ||
| 13:00 | USD | S&P/Case-Shiller Home Price Indices Y/Y Apr | -0.70% | -1.10% | ||
| 13:00 | USD | Housing Price Index M/M Apr | 0.30% | 0.60% | ||
| 14:00 | USD | Consumer Confidence Jun | 103.6 | 102.3 | ||
| 14:00 | USD | New Home Sales M/M May | 663K | 683K |
AUD/JPY bounces, ready for 97.66
AUD/JPY bounces today as Aussie is somewhat lifted by the recovery in Chinese Yuan, after China stepped up efforts to slow its decline. From a technical perspective, the failure to sustain below 55 4H EMA is a near term bullish sign. Immediate focus is back on 86.83 minor resistance. Firm break there will suggest that pull back from 97.66 has completed at 95.24 already. Further rally should then be seen through this 97.66 resistance.
Overall, near term upside momentum is diminishing as seen in D MACD. Hence, while rise from 86.04 could extend further to retest 99.32 high, upside could be limited there on first attempt. Still, sustained break of 55 D EMA (now at 92.84) is needed to confirm topping. Otherwise, outlook will remain cautiously bullish even in case of another pull back.
China steps up efforts to curb yuan’s decline, defends 7.25
The Offshore Chinese Yuan (CNH) is witnessing a revival today, as China appears to be intensifying its efforts to curb the currency's recent slump. Market participants view 7.25 level against Dollar as a significant psychological threshold to uphold.
According to a report by Reuters, there's evidence that major state-owned Chinese banks are selling dollars in the offshore spot foreign exchange market. This activity suggests that authorities are keen to slow the yuan's precipitous decline in recent times.
In an additional bid to temper the yuan's slide, China set its daily reference rate for the managed currency at a stronger-than-anticipated level for a second consecutive day. This move underscores PBoC's dissatisfaction with the currency's recent rapid and unilateral depreciation, particularly the swift move from 7.25.
From a pure technical point of view, further rally is still in favor in USD/CNH as long as 7.1036 support holds. But the pair would likely lose upside momentum further as it approaches 161.8% projection of 6.6971 to 6.9963 from 6.8100 at 7.2941. It's unlikely for USD/CHN to break through 7.3745 high at the first attempt.
GBP/USD Could Restart Rally Above This Resistance
Key Highlights
- GBP/USD started a downside correction from the 1.2850 zone.
- A major bearish trend line is forming with resistance near 1.2740 on the 4-hour chart.
- EUR/USD remained well-bid above the 1.0850 support zone.
- Gold price is showing bearish signs below the $1,940 resistance.
GBP/USD Technical Analysis
The British Pound rallied after it broke the 1.2750 resistance against the US Dollar. GBP/USD even tested the 1.2850 resistance before the bears appeared.
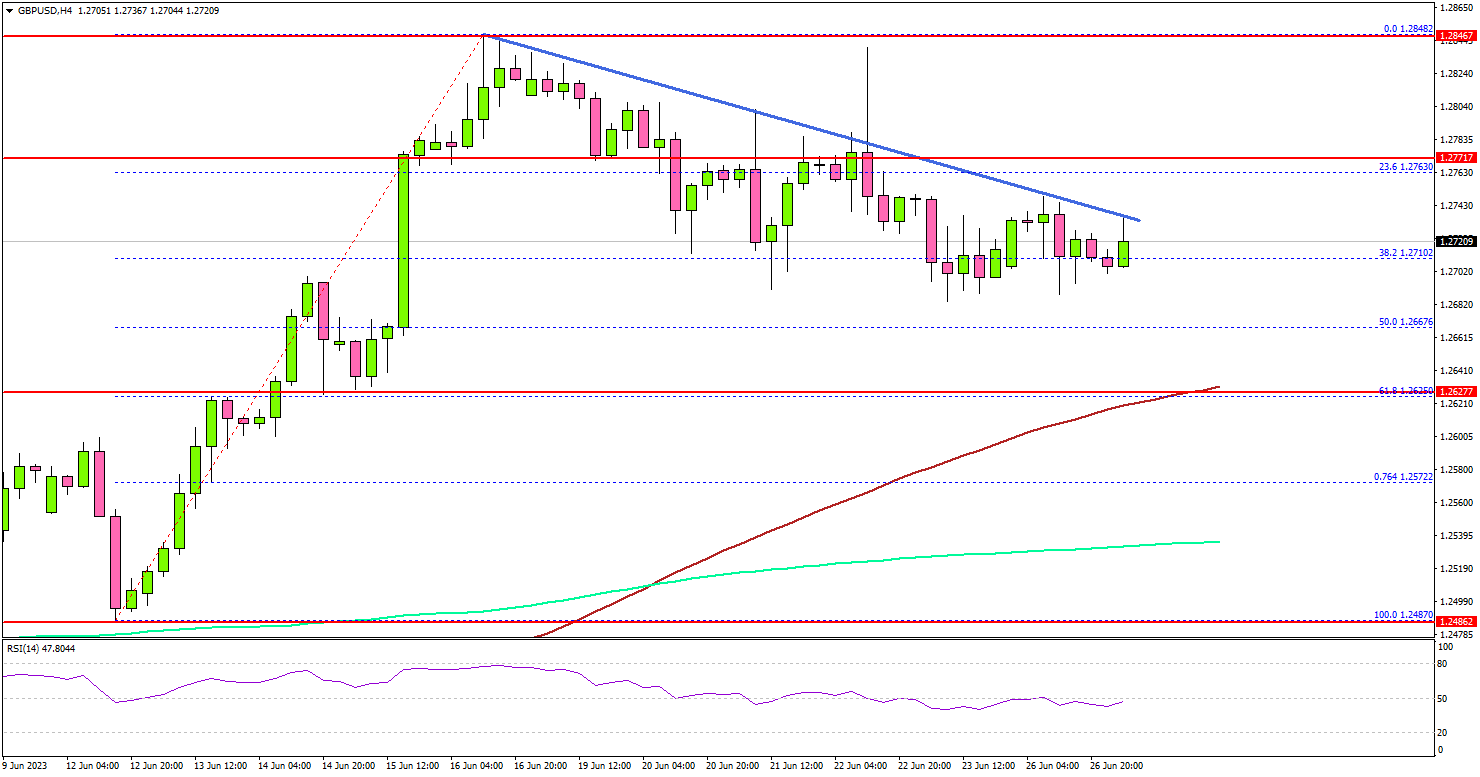
Looking at the 4-hour chart, the pair saw a downside correction from the 1.2850 zone. It traded below the 1.2800 and 1.2780 levels. There was a break below the 38.2% Fib retracement level of the upward move from the 1.2487 swing low to the 1.2848 high.
However, the pair is still well above the 100 simple moving average (red, 4 hours) and the 200 simple moving average (green, 4 hours).
Immediate support is near the 1.2665 level. It is close to the 50% Fib retracement level of the upward move from the 1.2487 swing low to the 1.2848 high. The next major support is near the 1.2620 level and the 100 simple moving average (red, 4 hours).
If there is a downside break below the 1.2620 support, the pair could decline toward the 1.2550 support. On the upside, the first major resistance is near the 1.2740 zone and a bearish trend line on the same chart.
If there is a move above the 1.2740 resistance, the pair could rise toward 1.2800. Any more gains might send EUR/USD toward the 1.2850 level.
Looking at EUR/USD, the pair remained well-bid above 1.0850 and is currently attempting a fresh increase toward 1.1000.
Economic Releases
- Canadian Consumer Price Index for May 2023 (MoM) – Forecast +0.5%, versus +0.2% previous.
- Canadian Consumer Price Index for May 2023 (YoY) – Forecast +1.7%, versus +1.6% previous.
- US New Home Sales for May 2023 (MoM) – Forecast -0.9% versus -3.4% previous.
AUDCAD Wave Analysis
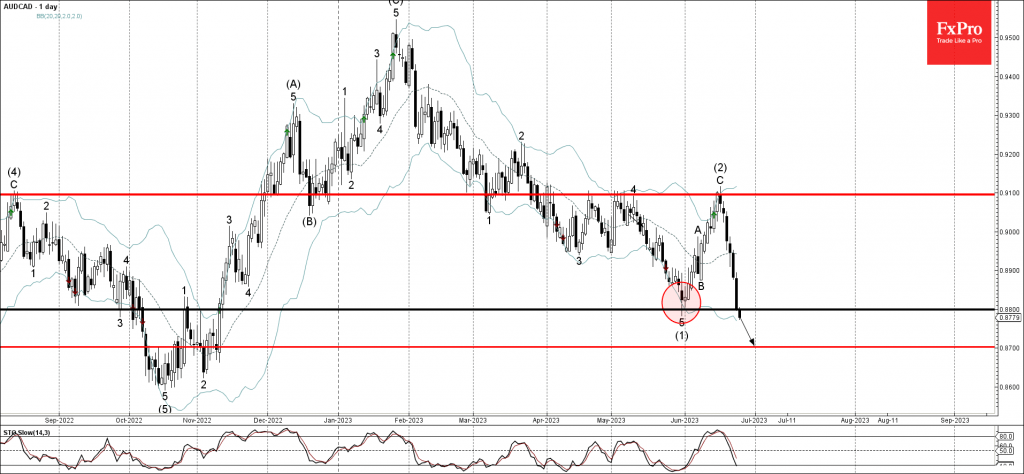
- AUDCAD broke key support level 0.8800
- Likely to fall to support level 0.8700
AUDCAD under the bearish pressure after the price broke the key support level 0.8800 (which stopped the previous sharp downward impulse wave (1) at the end of May).
The breakout of the support level 0.8800 should accelerate the active intermediate impulse wave (3).
Given the clear multi-month downtrend, AUDCAD can be expected to fall further toward the next support level 0.8700.
WTI crude oil Wave Analysis
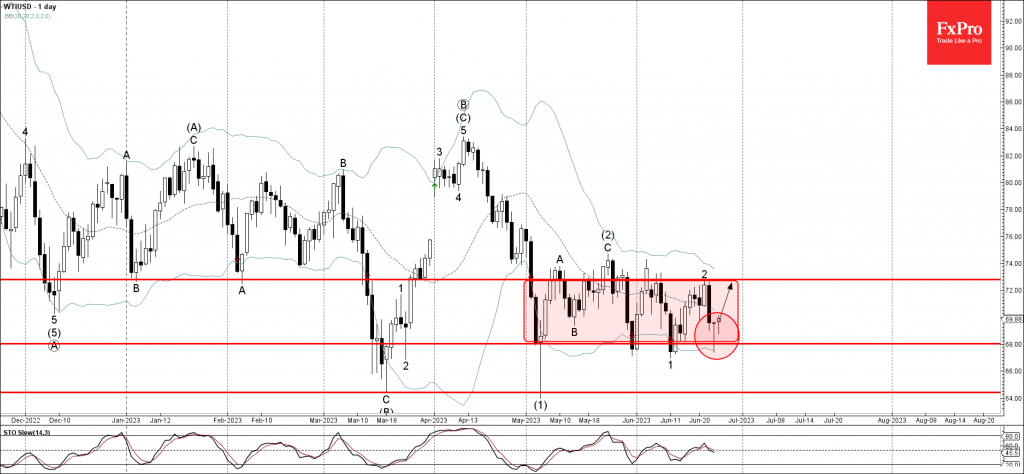
- WTI crude oil reversed from key support level 68.00
- Likely to rise to resistance level 72.80
WTI crude oil recently reversed up from the key support level 68.00 (which has been reversing the price from the start of May) , coinciding with the lower daily Bollinger Band.
The upward reversal from the support level 68.00 created the daily Japanese candlesticks reversal pattern Hammer.
Given the strength of the support level 68.00, WTI crude oil can be expected to rise further toward the next resistance level 72.80 (top of the previous correction 2).
AUD/USD: Bears Pausing But Hold Grip
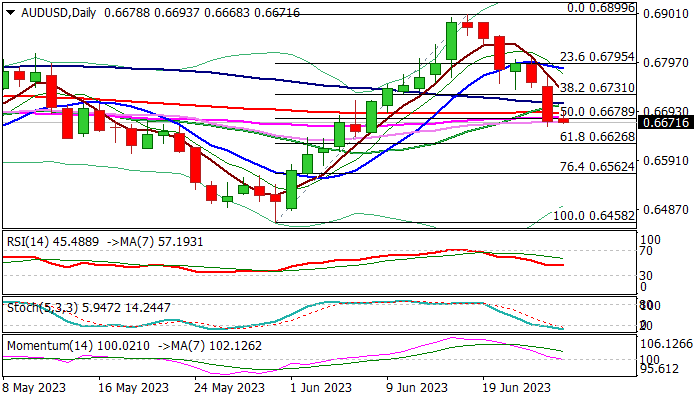
Bears are taking a breather after sharp fall in past two days, but remain fully in play, following bearish signals on Friday’s close below 200DMA (0.6690) and daily Kijun-sen / 50% retracement of 0.6458/0.6899 upleg (0.6679).
Weakening daily studies (MA’s turned to bearish setup, south-heading 14-d momentum is touching the border of negative territory) keep the downside at risk, with repeated daily close below these levels to keep the downside at risk for test of 0.6626 (Fibo 61.8% of 0.6458/0.6899 / weekly cloud base).
Bearish engulfing on weekly chart (the pair has registered the biggest weekly loss since the third week of Aug 2022), adds to negative outlook.
Broken 200DMA offers solid resistance at 0.6690, followed by converged 20/100DMA’s (0.6710) and broken Fibo 38.2% (0.6731).
Res: 0.6690; 0.6710; 0.6731; 0.6784
Sup: 0.6662; 0.6626; 0.6600; 0.6562
Oil’s Reduced Sensitivity to Geopolitics
Events in Russia at the end of last week have once again set the stage for a price rebound from the lower end of the range seen in recent months. However, deteriorating global macroeconomic conditions leave us guessing as to ‘when not if’ we will see a break of support and a move lower.
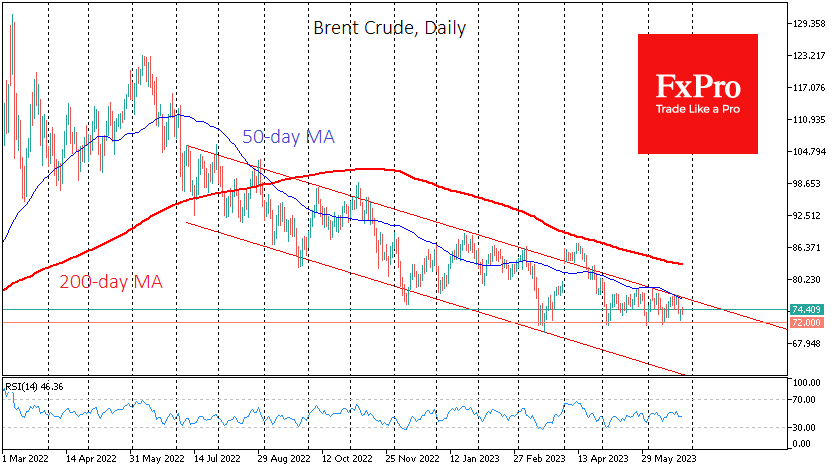
WTI crude fell to $67.5 on Friday, and Brent briefly traded below $72.5. Previously, oil was actively involved in OPEC+ efforts to cut production (actual or planned) from these levels. This time, the rebound came from reports from Russia.
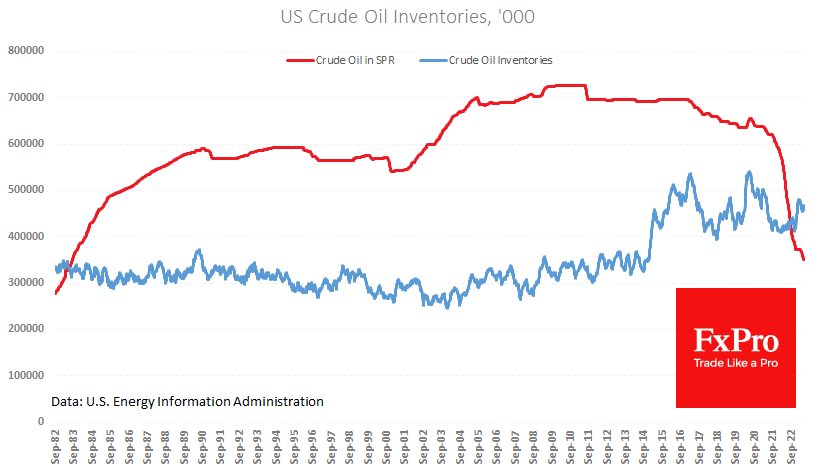
Data released in the second half of last week noted a reduction in supply, while producers were apathetic. Commercial reserves fell by 3.8mmbd, strategic reserves lost 1.7mmbd, but production averaged 12.2mmbd after a build rate of 12.4mmbd in the previous two weeks.
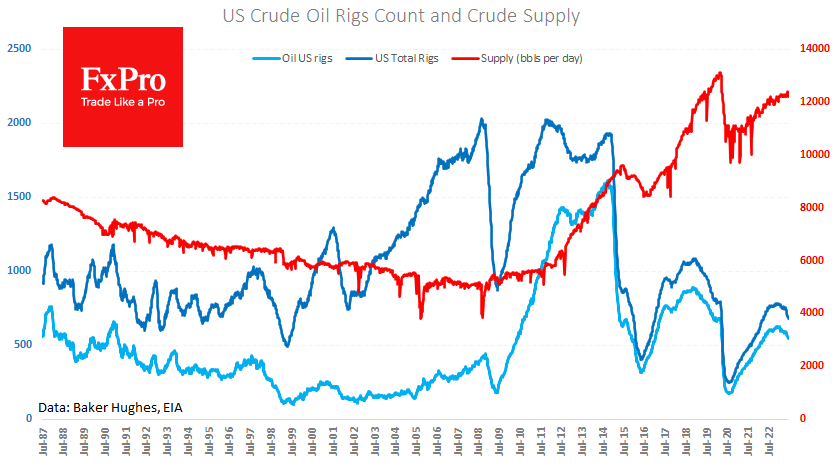
Friday’s Baker Hughes data highlighted the ongoing trend in drilling activity as the number of active rigs in the US fell by 5 to 682, of which 546 were producing rigs (-6 for the week). This dynamic clearly indicates the lack of appetite for upstream investment at current prices. Theoretically, it looks like a harbinger of falling production and, consequently, higher prices. In practice, however, preparing for a production surge against the highest interest rates since 2007 is hardly prudent.
WTI and Brent’s prices have repeatedly tested their horizontal support levels over the past three months. However, each time the rebounds have been less pronounced. With a few exceptions, the oil’s movements have been in a downtrend since last July, the upper boundary of which again held last week. This long-term resistance and horizontal support are rapidly approaching each other, promising a final decision on oil’s direction soon.
The downward movement of high and rising interest rates and declining economic indicators is advantageous in this battle. However, it is worth waiting for technical confirmation in the form of a break below $72 for Brent and $67 for WTI.