Sample Category Title
Bundesbank foresees difficult recovery for Germany, despite ended recession in Spring
In its latest monthly report, Bundesbank projected a somewhat gloomy economic outlook for Germany. The central bank expects the country's GDP to shrink by a calendar-adjusted -0.3% for 2023, with subsequent growth projected at 1.2% in 2024 and 1.3% in 2025.
Characterizing the economic recovery as a laborious process, the Bundesbank pointed to the lingering impacts of the crises Germany has endured over the past three years. The nation's recession, however, is anticipated to conclude in the spring quarter, with a slight increase in GDP predicted for April to June period.
Bundesbank anticipates that private consumption, a crucial component of economic health, will hit its lowest point and then begin to rebound. It highlighted that "Thanks to strongly rising wages, the real disposable incomes of private households are stabilizing despite inflation remaining very high."
Bitcoin Needs to Cool Off for Now after Proving its Ability to Grow
Market picture
The total capitalisation of the crypto market rose 10.8% over the week to $1.184 trillion, according to CoinMarketCap. Bitcoin rose 15% over the week to close at $30.4K. Ethereum gained 9.5% to $1890. Other leading altcoins in the top 10 showed mixed dynamics, ranging from a 2.8% decline (BNB) to an 11.1% gain (Cardano).
Bitcoin renewed its early June highs near $31.4K on Friday, but the rally was not sustained, and over the weekend, the recent momentum was dissipated, bringing the price back down to $30.3K in early Monday trading. The BTC rally is often attributed to hopes of launching spot bitcoin ETFs, which ease access of institutional capital to the flagship cryptocurrency.
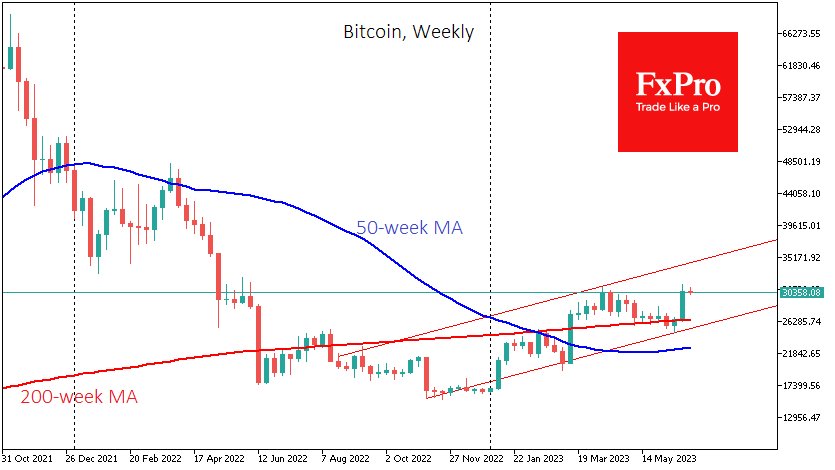
Besides, the technical factors have also supported the crypto’s recent march to the North. BTCUSD broke through the 50-day moving average resistance and consolidated above the upper boundary of the descending channel. A bounce off the 200-week MA was an even more critical bullish signal.
Strictly speaking, we saw a bounce and a rapid rise from the lower boundary of the longer-term bullish corridor formed by the November 2022 and March 2023 lows. In the short term, bitcoin will need to cool off after the march, but overall, it has a much better chance of touching the upper boundary at $34.5K within a month than the lower boundary at $26.1K. Despite the bullish outlook, the market needs to cool down in the coming days.
News background
Mark Yusko, a founder of Morgan Creek Capital, believes the recent rise in Bitcoin and other cryptocurrencies is a sign of the start of a new bullish cycle that will last until next spring’s halving. In his view, BTC will eventually replace gold as a store of value.
Bitwise CEO Matt Haugan said the crypto market is beginning a multi-year bull cycle as institutional investors start to invest in digital assets.
Hugh Hendry, a founder of hedge fund Eclectica Asset Management, said that rising interest rates in major economies would lead to a deterioration in macroeconomic conditions, which is good for Bitcoin. He believes the BTC exchange rate could triple against such a backdrop.
Major German software developer SAP has launched a pilot project for international payments using the Circle USDC and EUROC stablecoins on the Ethereum blockchain.
One of the oldest altcoins, Bitcoin Cash, rose 80% last week as crypto exchange EDX Markets backed BCH.
EURUSD Technical Picture Turns Bearish
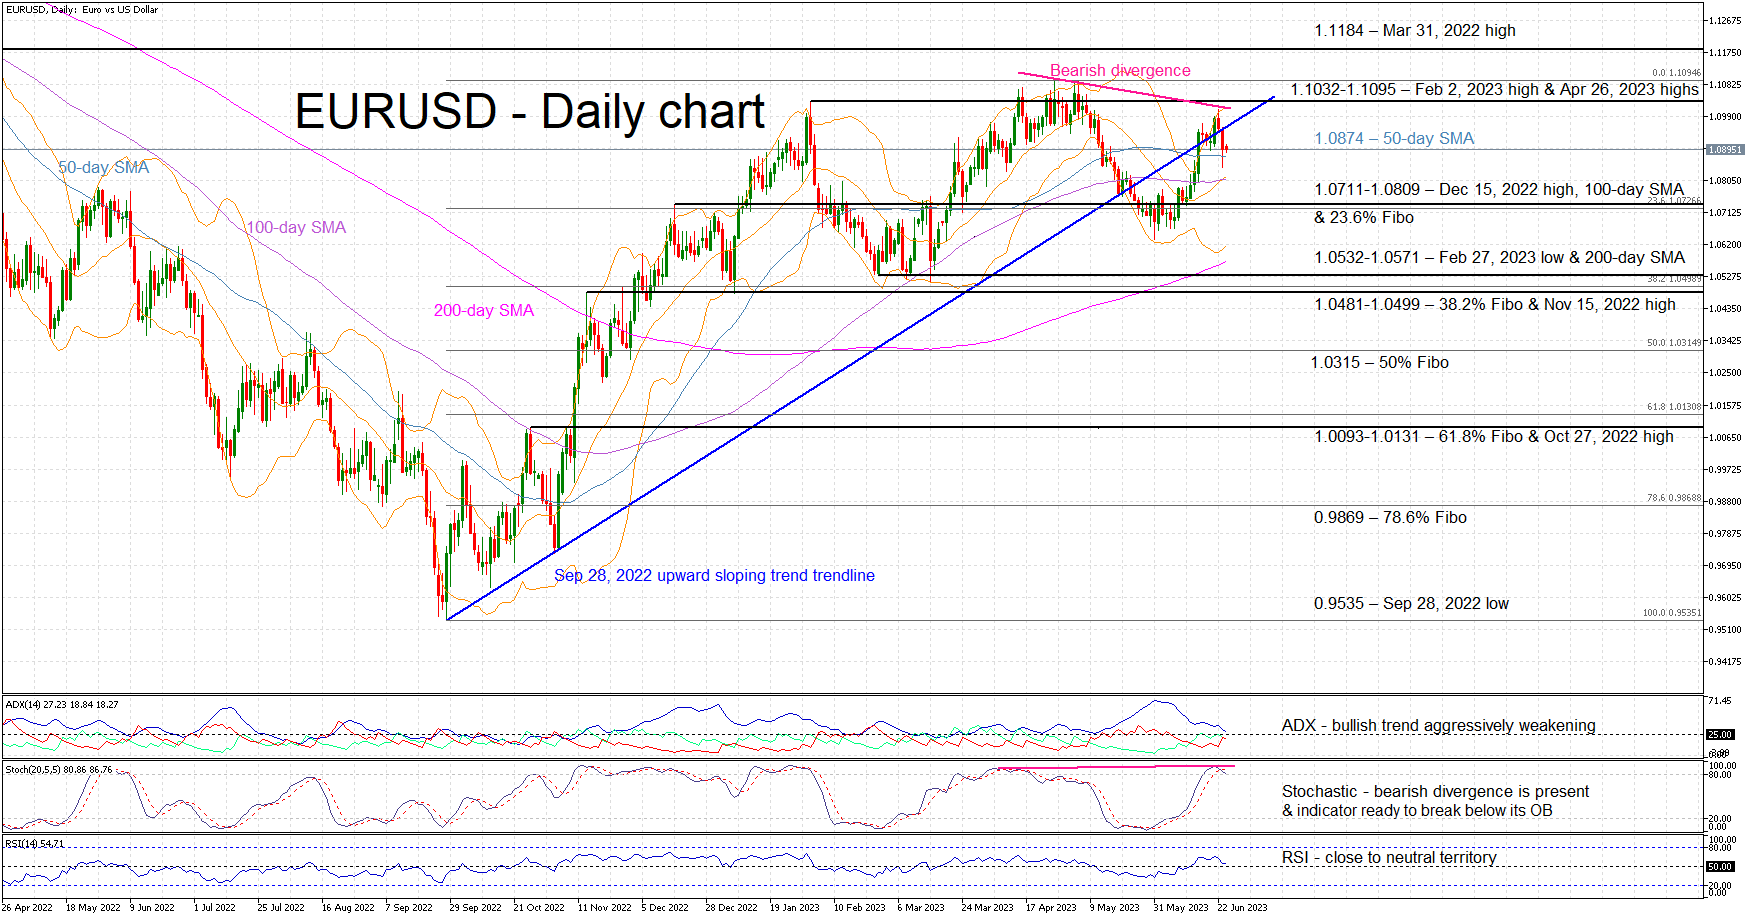
EURUSD is edging lower today as the short-term uptrend that started in early June appears to have halted. The September 28, 2022 upward sloping trendline has acted as strong resistance, pushing EURUSD towards the 50-day simple moving average at 1.0874. The current correction could also be a product of the bearish divergence that has formed between the stochastic oscillator and the recent EURUSD price action.
In addition, the remaining momentum indicators appear to be more balanced at this juncture. The Average Directional Movement Index (ADX) is rapidly approaching its 25-threshold and thus signaling a quickly evaporating bullish trend. Similarly, the RSI is a tad above its 50-midpoint and the stochastic is trying to break below its overbought territory. Such a move would clearly open the door to a sizeable correction and challenge the recent May 31, 2023 low of 1.0634.
Should the bears want to capitalize on the various bearish signals, they would have to first clear the 1.0874 level and test the support set by the 1.0711-1.0809 range that is defined by the December 15, 2022 high, the 100-day SMA and the 23.6% Fibonacci retracement of the September 28, 2022 – April 26, 2023 uptrend respectively. Even lower, they will have the chance of making a lower low in their attempt to push EURUSD towards the busier 1.0532-1.0571 range.
On the flip side, the bulls are keen on stopping the current correction by keeping EURUSD above 1.0874. They would then try to retest the 1.1032-1.1095 range that is populated by the February 2, 2023 and April 26, 2023 highs respectively. If successful, they could then record a new 2023 high and potentially set their eyes on the March 31, 2022 high at 1.1184.
To conclude, EURUSD bears are trying to take advantage of the formed bearish divergence and commence a significant downleg, eventually achieving a push below the recent 1.0634 low.
Japanese Yen Edges Lower after Verbal Intervention
- Tokyo sends warning over yen’s deprecation
- Yen has slumped over 7% against US dollar since April
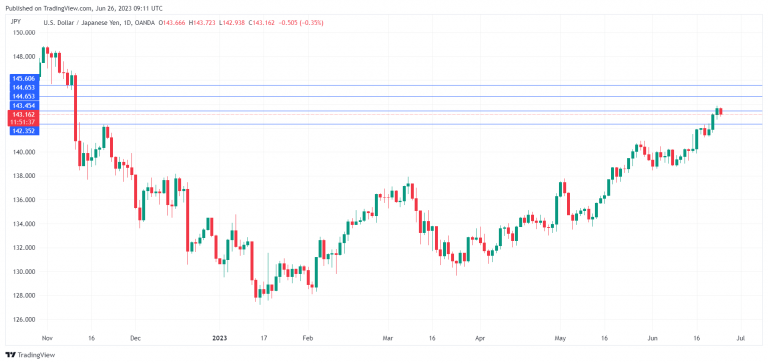
USD/JPY is in positive territory on Monday. In the European session, the yen is trading at 143.15, down 0.36%.
Tokyo issues warning over slumping yen
The Japanese yen continues to lose ground and the Japanese government is not amused. The yen slipped 1.26% last week and fell as low as 143.87 on Friday, its lowest level since November 7th. Since the start of April, the yen has plunged over 7% against the dollar.
On Monday, Japan’s top currency diplomat, Masota Kanda warned that the yen’s weakening was “rapid and one-sided”. Kanda said he would not rule out any options, including currency intervention. The markets have become accustomed to verbal intervention when the yen drops sharply and these verbal warnings don’t have much effect.
The concern is that the government could intervene and purchase yen, as it did in September and October 2022. At that time, the yen was below 151, but Tokyo could decide that it doesn’t want to wait for the yen to fall that low before it intervenes.
The Bank of Japan maintained its ultra-loose policy at last week’s meeting, and the divergence between the BoJ and other major central banks keeps hammering at the yen. The US/Japan rate differential has been widening as the Fed has tightened aggressively and is expected to raise rates further in the second half of the year.
The BoJ could provide some fast relief to the yen if it raised interest rates, but that doesn’t seem likely anytime soon. A more likely scenario is for the central bank to tweak its yield currency curve control, which sparked a yen rally when the BoJ widened its target band for interest rates. Governor Ueda, who took over in April, has sounded more receptive to tightening policy than his predecessor but so far he has toed the line and maintained a dovish stance.
USD/JPY Technical
- USD/JPY is testing support at 143.45. The next support level is 142.35
- There is resistance at 144.65 and 145.59
Gold Price Technical Analysis
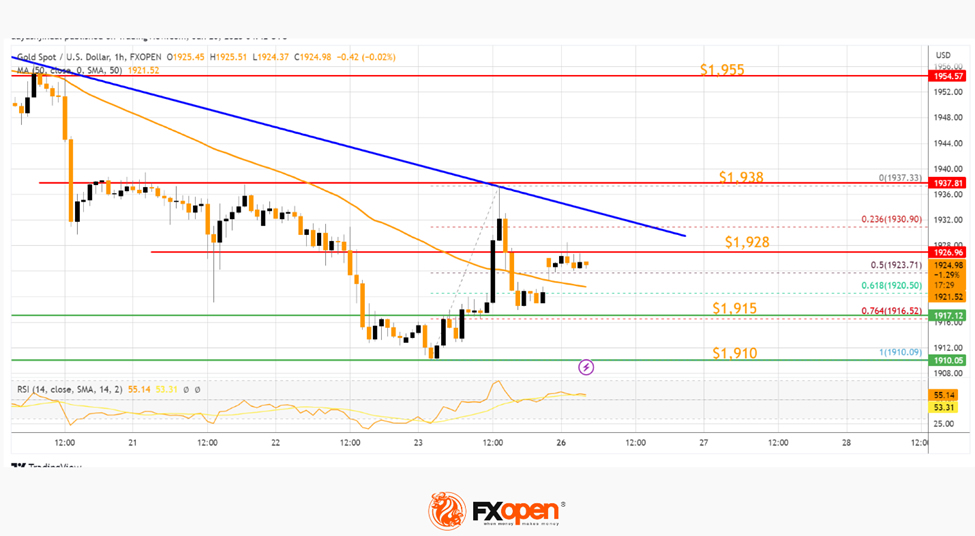
On the hourly chart of Gold on FXOpen, the price struggled to clear the $1,938 resistance against the US Dollar. The price is now consolidating above the 50-hour simple moving average.
On the upside, the price seems to be facing resistance near a connecting bearish trend line at $1,928. The next major resistance is near the $1,938 level (a multi-touch zone).
A clear move above the $1,938 resistance could send the price toward the $1,955 resistance. Any more gains might send the price toward $1,965.
On the downside, immediate support is near the $1,915 level. The next major support is near the $1,910 level, below which the price might decline toward the $1,900 support level in the near term. Any more losses may perhaps open the doors for a move toward the $1,888 zone.
US 500 Stock Index Stays Heavy But Could be Poised for a Rebound
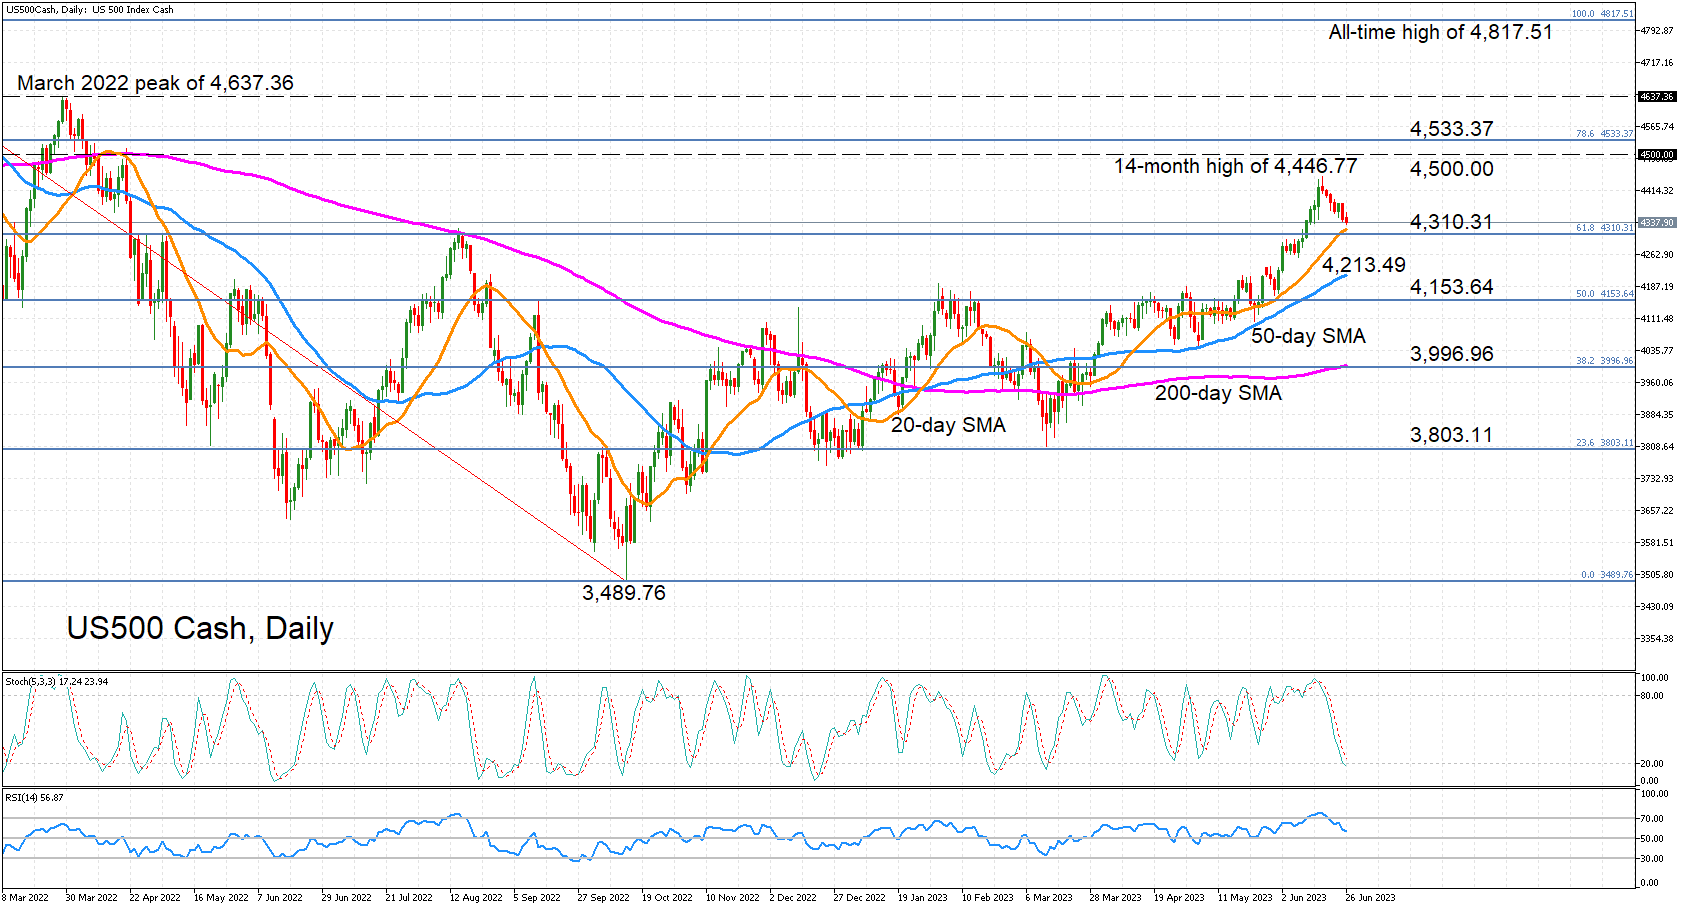
US 500 stock index (cash) is extending its slide from the June 16 high of 4,446.77, but the negative momentum appears to be weakening somewhat as the price approaches the 20-day simple moving average (SMA).
Technical indicators continue to point to a bearish bias in the near term but there are some early signs that the selling pressure is subsiding. The stochastic oscillator is headed towards the oversold territory, while the RSI’s decline is slowing even before reaching the 50 neutral mark.
Should the negative pressures ease off further, the 20-day SMA, which is being bolstered by the 61.8% Fibonacci retracement of the January-October 2022 downtrend in the 4,310 region, stands a good chance of halting the slide. A rebound off the 20-day SMA would switch the attention back to the 14-month high of 4,446.77.
However, this remains an extremely challenging area as there are several hurdles within this vicinity - the 4,500 level lies slightly higher, followed by the 78.6% Fibonacci of 4,533.37. Further up, the March 2022 peak of 4,637.36 poses one final test before the all-time high of 4,817.51 comes into scope.
But in the event that the bears prevail and the price breaches the 61.8% Fibonacci, the index would then be eying the 50-day SMA, currently at 4,213.49, and the 50% Fibonacci of 4,153.64. A drop below these key levels would risk shifting the bullish medium-term outlook back to neutral, which would be confirmed if the downside correction reaches the 200-day SMA just below the 4,000 handle.
To conclude, US 500 is still in selloff mode but the impending support at the 20-day SMA could help turn things around for the bulls. On the other hand, breaching it would endanger the positive outlook in the medium term.
GBP/JPY Daily Outlook
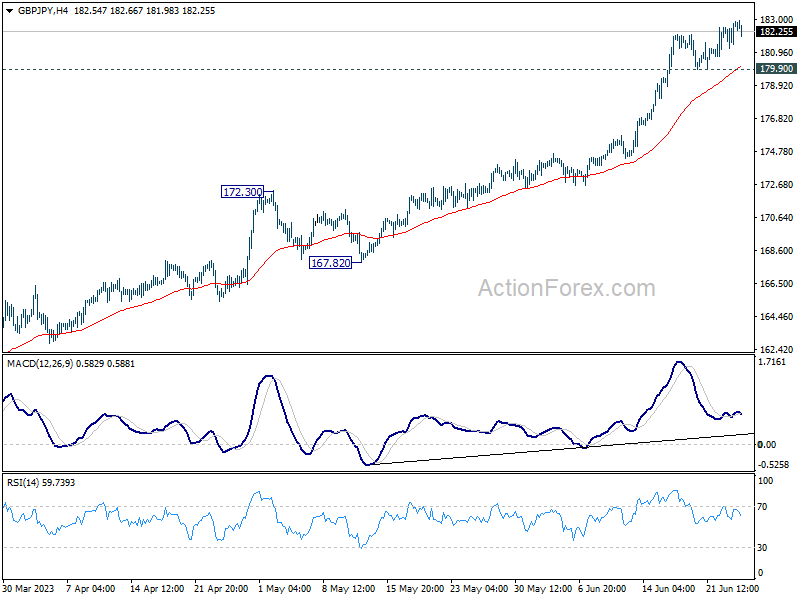
Daily Pivots: (S1) 181.70; (P) 182.33; (R1) 183.39; More...
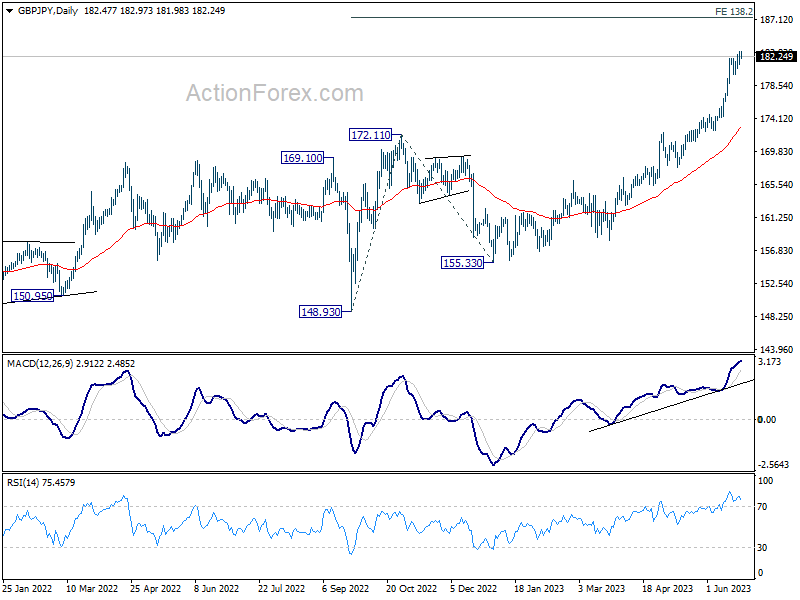
Intraday bias in GBP/JPY stays on the upside at this point. Current up trend is expected to target 138.2% projection of 148.93 to 172.11 from 155.33 at 187.36 next. On the downside, however, break of 179.90 support will confirm short term topping, and turn bias back to the downside for deeper pull back.
In the bigger picture, up trend from 123.94 (2020 low) is extending. Next target is 195.86 (2015 high). For now, medium term outlook will remain bullish as long as 172.11 resistance turned support holds, even in case of deep pull back.
EUR/JPY Daily Outlook
Daily Pivots: (S1) 155.49; (P) 156.20; (R1) 157.33; More....
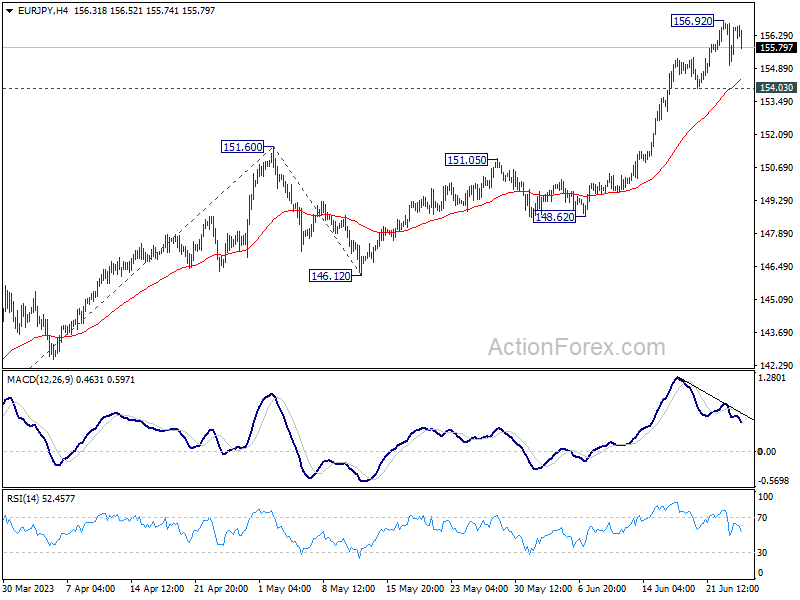
Intraday bias in EUR/JPY remains neutral as consolidation from 156.92 is extending. Further rally would remain in favor as long as 154.30 minor support holds. Above 156.92 will resume larger up trend to 100% projection of 139.05 to 151.60 from 146.12 at 158.67. On the downside, break of 154.03 will turn bias back to the downside for deeper pull back.
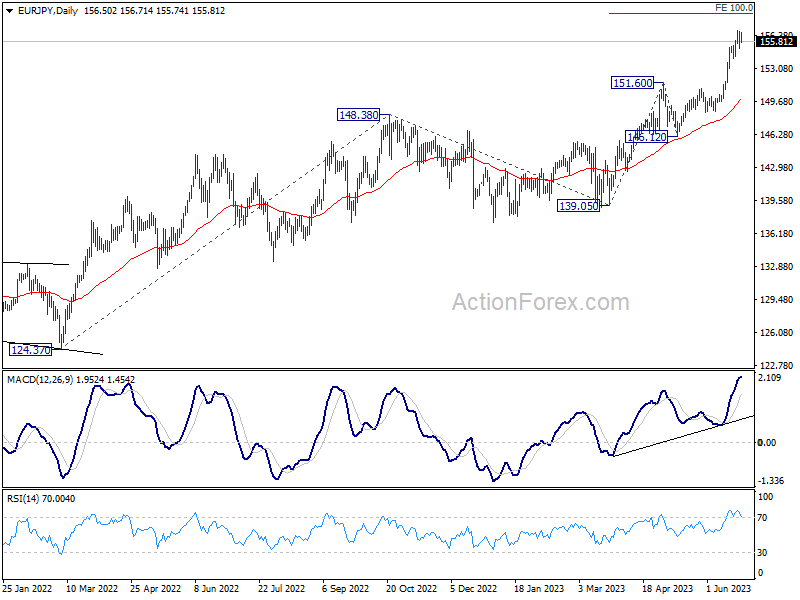
In the bigger picture, rise from 114.42 (2020 low) is in progress. Next target is 100% projection of 124.37 to 148.38 from 138.81 at 162.82. For now, medium term outlook will remain bullish as long as 148.38 resistance turned support holds, even in case of deep pull back.
EUR/GBP Daily Outlook
Daily Pivots: (S1) 0.8533; (P) 0.8570; (R1) 0.8605; More...
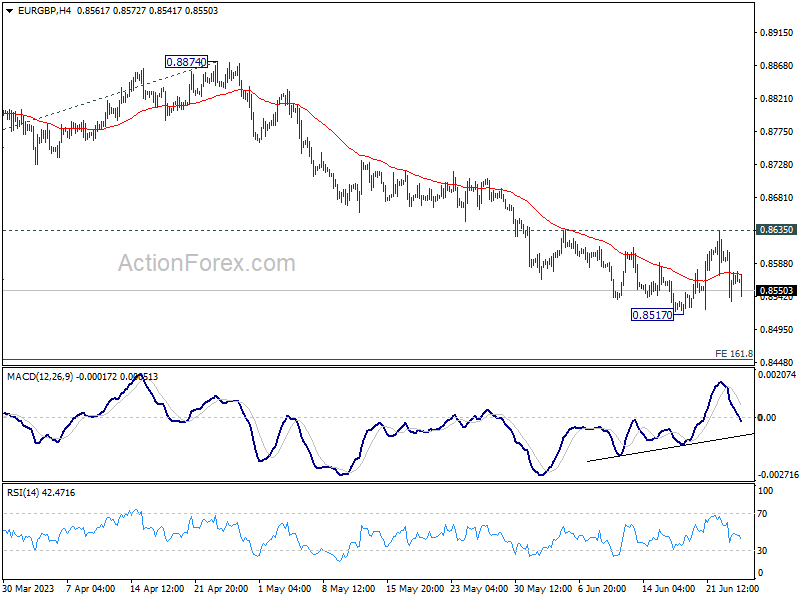
Intraday bias in EUR/GBP stays neutral and outlook remains bearish with 0.8635 resistance intact. Break of 0.8517 will resume the fall from 0.8977 to 161.8% projection of 0.8977 to 0.8717 from 0.8874 at 0.8453. Nevertheless, decisive break of 0.8635 will confirm short term bottoming, and bring stronger rebound to 55 D EMA (now at 0.8661) and above.
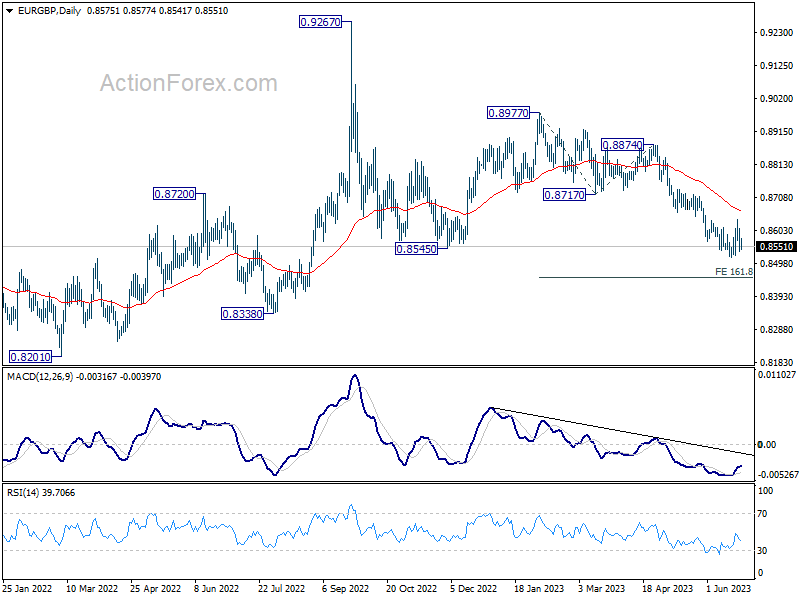
In the bigger picture, the down trend from 0.9267 (2022 high) is still in progress. It's seen as part of the long term range pattern from 0.9499 (2020 high). Deeper fall would be seen towards 0.8201 (2022 low). But strong support should be seen from there to bring reversal. This will now remain the favored case as long as 0.8717 support turned resistance holds.
EUR/AUD Daily Outlook
Daily Pivots: (S1) 1.6222; (P) 1.6280; (R1) 1.6370; More...
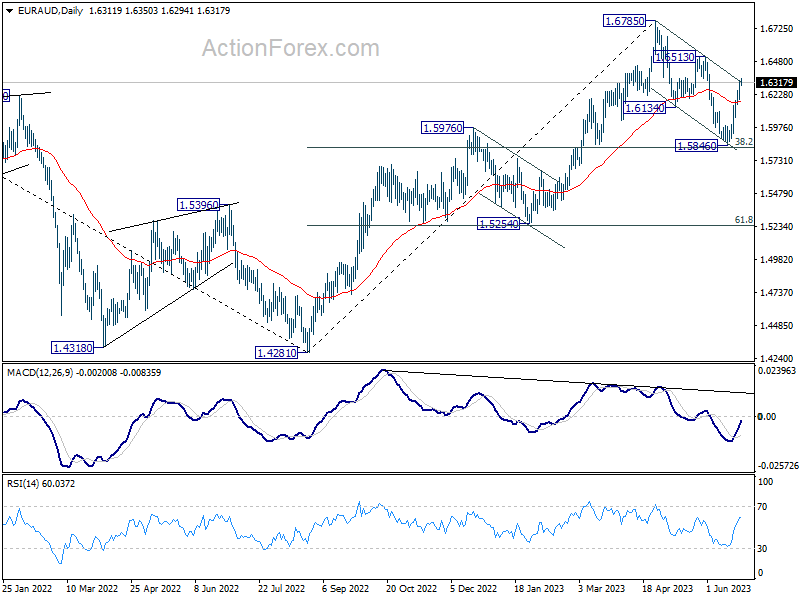
Outlook in EUR/AUD is unchanged. Corrective fall from 1.6785 should have completed with three waves down to 1.5846. Intraday bias stays on the upside for 1.6513 resistance. Firm break there will confirm this case and target 1.6785 high next. On the downside, though, break of 1.6187 minor support will mix up the outlook and turn intraday bias neutral first.
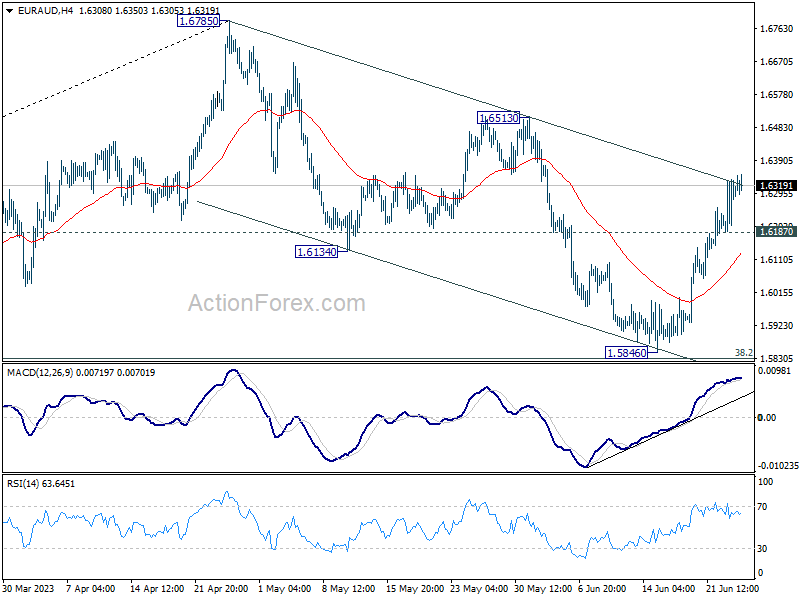
In the bigger picture, with 38.2% retracement of 1.4281 to 1.6785 at 1.5828 intact, rally from 1.4281 is still in progress. Firm break of 1.6785 will confirm rally resumption. Rejection by 1.6785 will extend the corrective pattern with another fall leg. But outlook will stay bullish as long as 1.5828 holds.