Sample Category Title
EUR/USD Daily Outlook
Daily Pivots: (S1) 1.0889; (P) 1.0904; (R1) 1.0921; More...
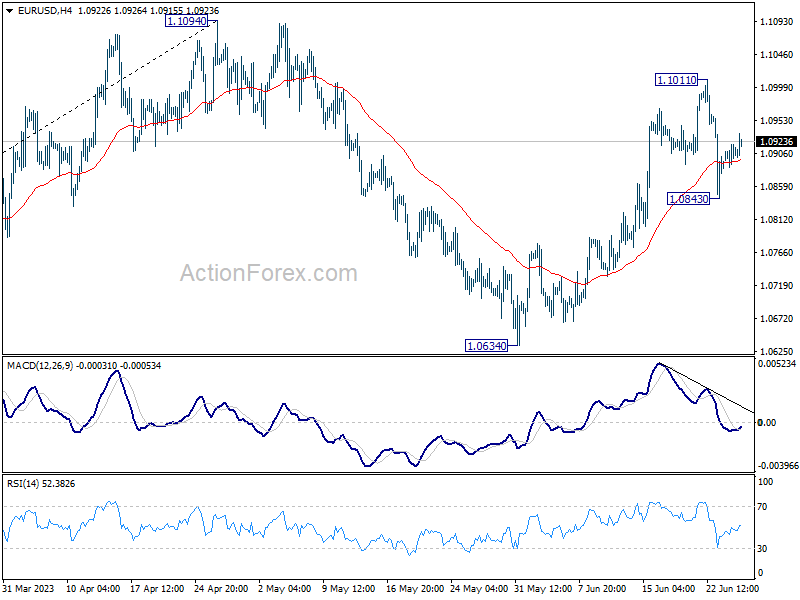
Intraday bias in EUR/USD is turned neutral with current recovery. But risk stays mildly on the downside for now. Fall from 1.1101 is seen as the third leg of the corrective pattern from 1.1094. Sustained break of 55 D EMA (now at 1.0838) will target 1.0634 support and below. however, break of 1.1011 will target a test on 1.1094 high instead.
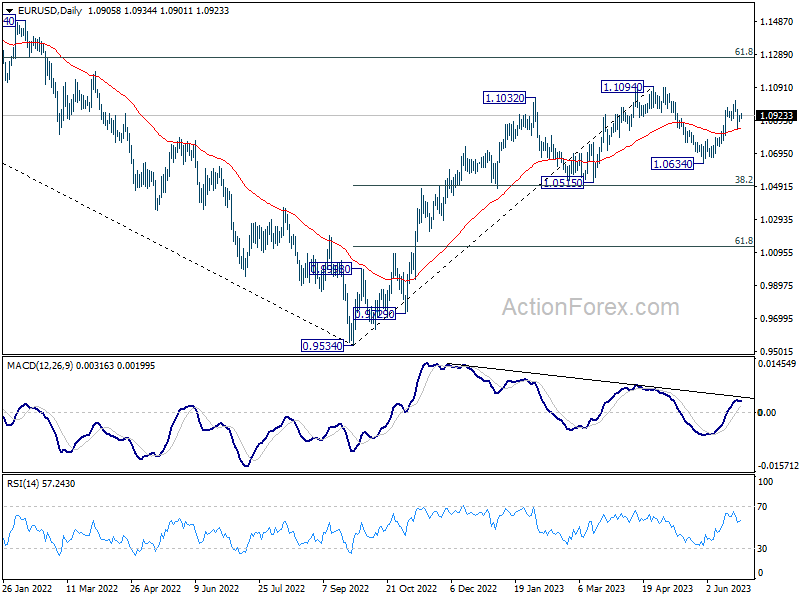
In the bigger picture, as long as 1.0515 support holds, rise from 0.9534 (2022 low) would still extend higher. Sustained break of 61.8% retracement of 1.2348 (2021 high) to 0.9534 at 1.1273 will solidify the case of bullish trend reversal and target 1.2348 resistance next (2021 high).
GBP/USD Daily Outlook
Daily Pivots: (S1) 1.2683; (P) 1.2716; (R1) 1.2744; More...
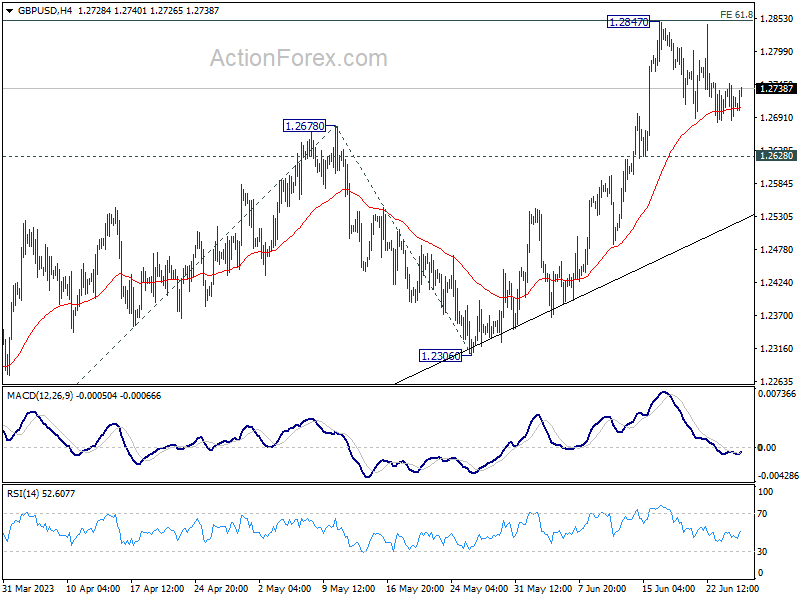
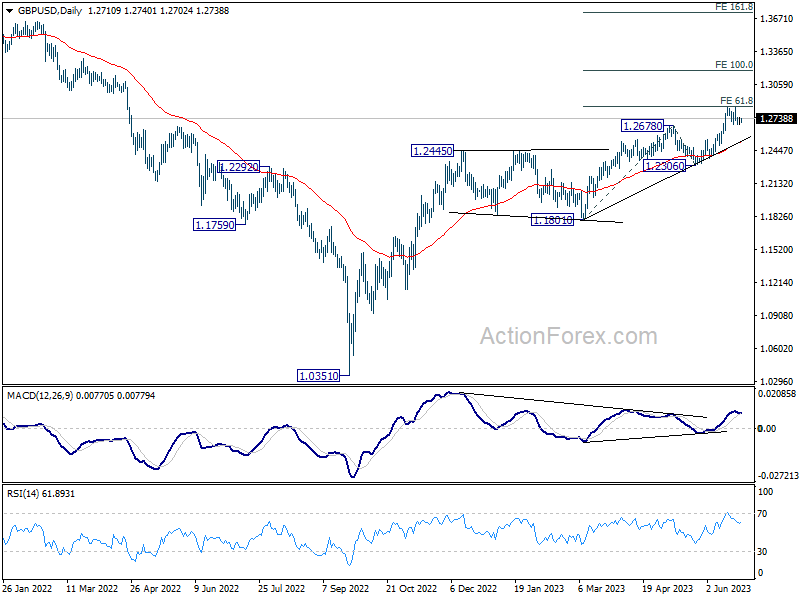
GBP/USD is extending the consolidation from 1.2847 and intraday bias remains neutral. Further rally is expected as long as 1.2628 support holds. On the upside, firm break of 1.2847 will resume larger up trend and target 100% projection of 1.1801 to 1.2678 from 1.2306 at 1.3183 next. However, firm break of 1.2628 will turn bias to the downside, for deeper fall to 1.2306 support instead.
In the bigger picture, the strong support from 55 W EMA (now at 1.2341) is a medium term bullish sign. Outlook will stay bullish as long as 1.2306 support holds. Rise from 1.0351 medium term bottom (2022 low) is expected to extend further to retest 1.4248 key resistance (2021 high).
USD/CHF Daily Outlook
Daily Pivots: (S1) 0.8921; (P) 0.8948; (R1) 0.8985; More...
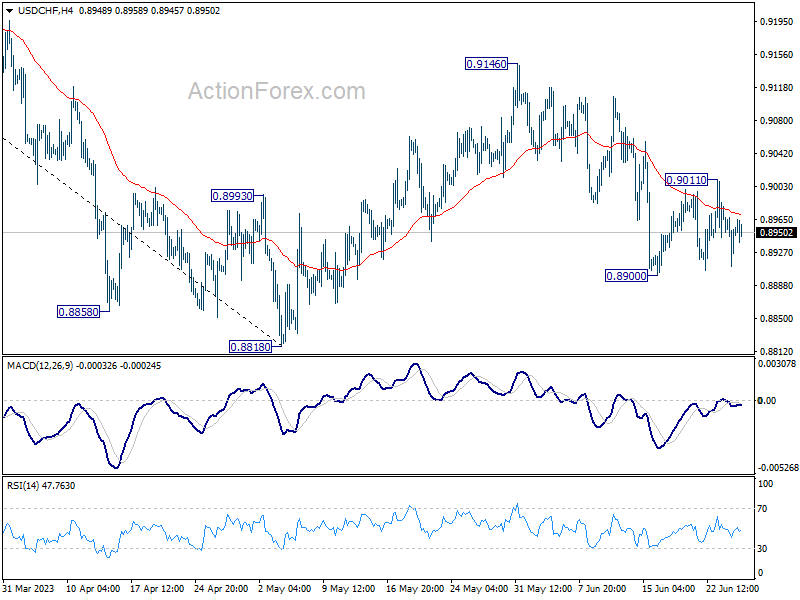
Intraday bias in USD/CHF stays neutral as sideway trading continues. Break of 0.8900 will resume the fall from 0.9146 to 0.8818 low or below. But for now, strong support is still expected from 0.8756 long term support to bring rebound. On the upside, above 0.9011 will bring stronger rise towards 0.9146 resistance.
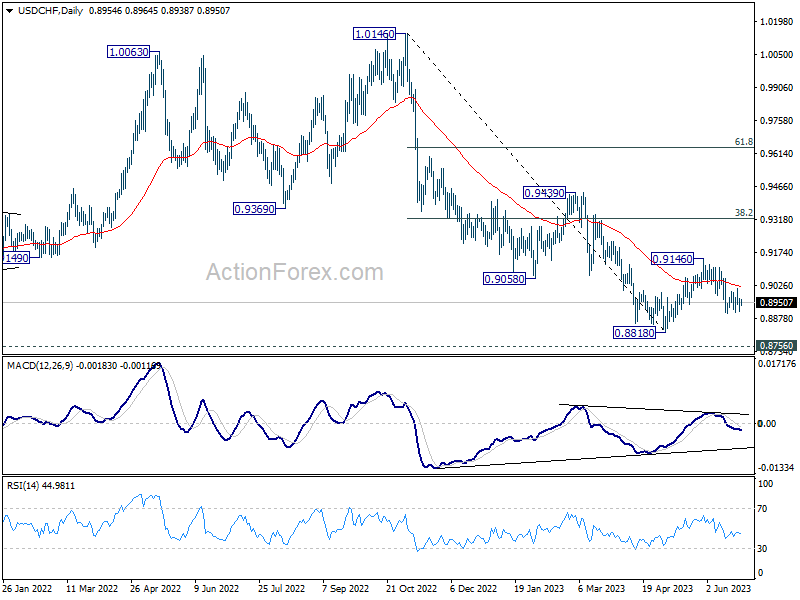
In the bigger picture, fall from 1.1046 (2022 high) is seen as a leg in the long term range pattern from 1.0342 (2016 high), which might have completed at 0.8818 already, just ahead of 0.8756 long term support. Sustained trading above 0.9058 support turned resistance should confirm medium term bottoming.
USD/JPY Daily Outlook
Daily Pivots: (S1) 143.07; (P) 143.39; (R1) 143.84; More...
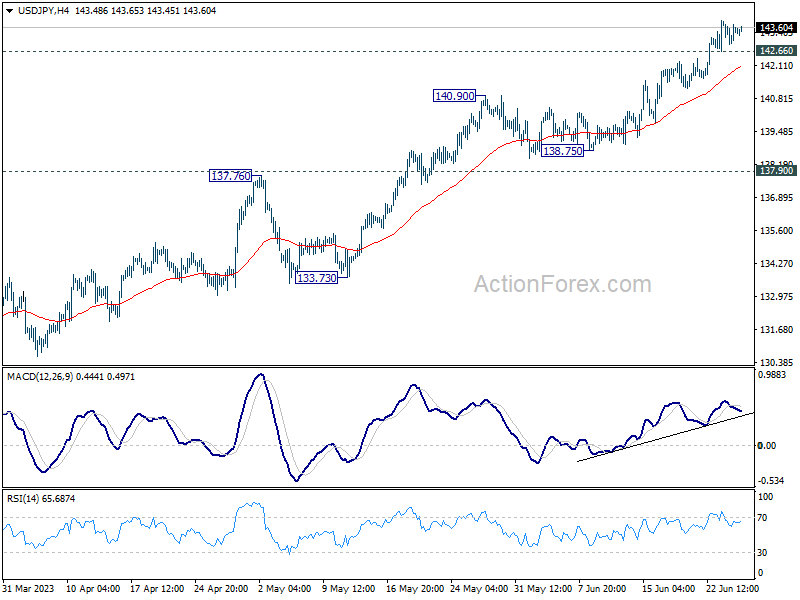
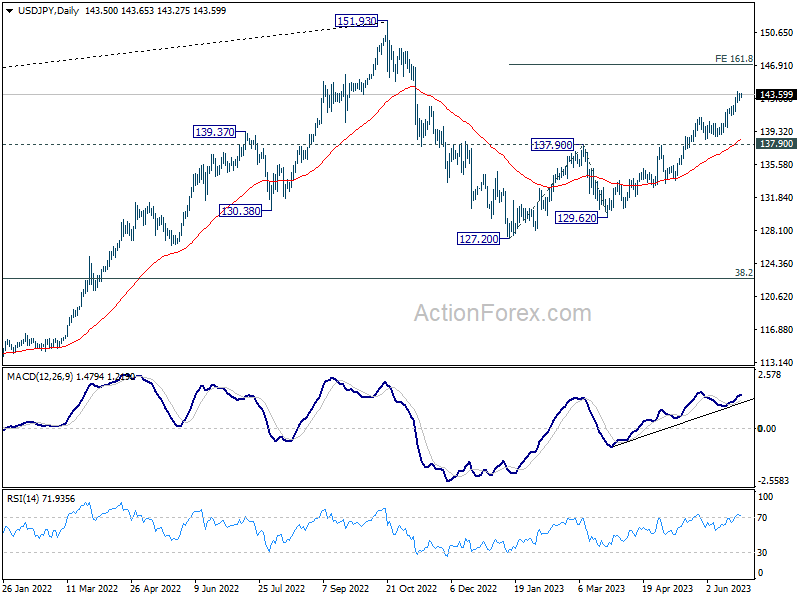
USD/JPY continues to lose upside momentum, but further rally is expected with 142.68 minor support intact. Current rise from 127.20 should target 161.8% projection of 127.20 to 137.90 from 129.62 at 146.93. On the downside, below 142.66 minor support will bring lengthier consolidations first.
In the bigger picture, rise from 127.20 is currently seen as the second leg of the corrective pattern from 151.93 high. Further rally is expected as long as 137.90 resistance turned support holds, to retest 151.93. But strong resistance could be seen there to limit upside. Break of 137.90 will indicate the the third leg has started back towards 127.20.
USD/CAD Daily Outlook
Daily Pivots: (S1) 1.3133; (P) 1.3159; (R1) 1.3182; More....
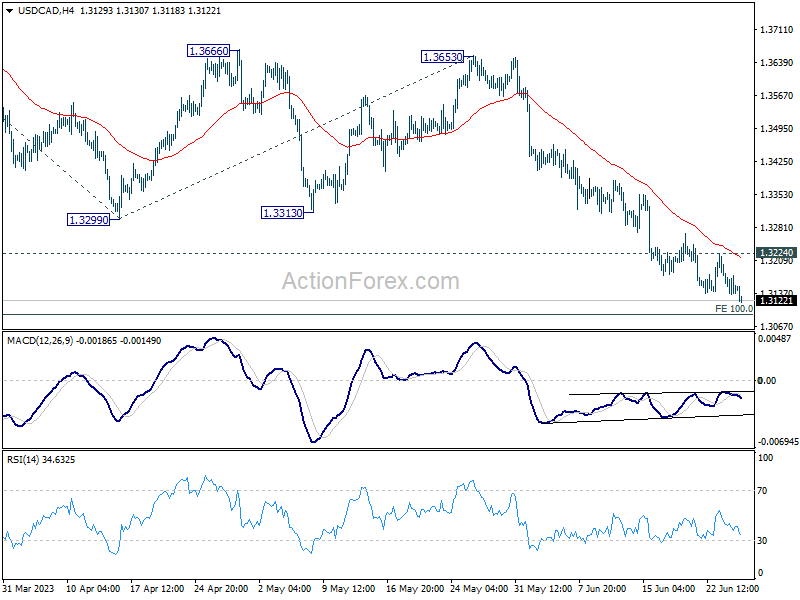
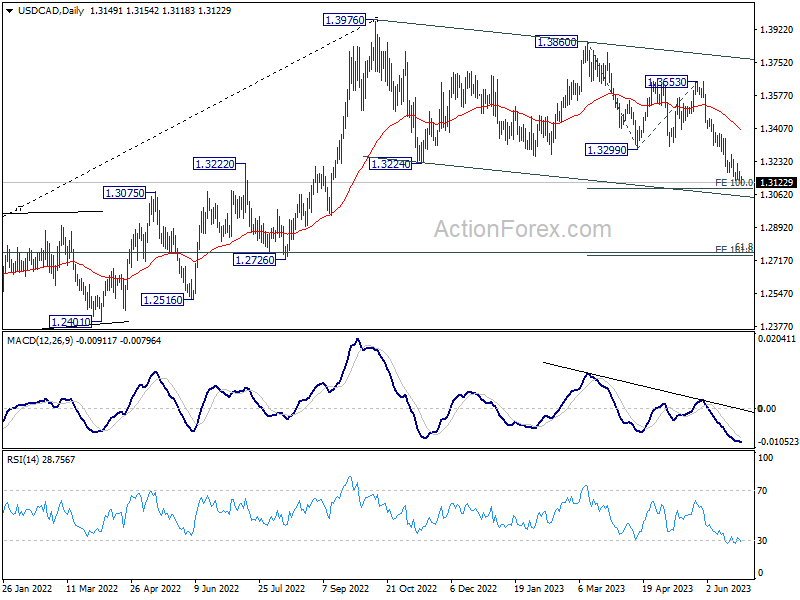
USD/CAD's continues today and intraday bias stays on the downside for 100% projection of 1.3860 to 1.3299 from 1.3653 at 1.3092. Decisive break there will target 161.8% projection at 1.2745. On the upside, however, break of 1.3224 resistance should now indicate short term bottoming, and turn bias back to the upside for rebound.
In the bigger picture, price actions from 1.3976 are still viewed as a correction to up trend from 1.2005 (2021 low), but chance of trend reversal is increasing with current decline. In either case, risk will stay on the downside as long as 1.3299 support turned resistance holds, even in case of strong rebound. Next target is 61.8% retracement of 1.2005 to 1.3976 at 1.2758.
Investors Finally Believe the Fed
Financial markets kicked off the week on a weak note, but not because of the Wagner’s mini, failed, or fake coup over the weekend, but because of the diminishing rate cut bets for the Federal Reserve (Fed) for this year - and the beginning of next year.
Activity on Fed funds futures gives more than 75% chance for another 25bp hike in July, and there is expectation for one more rate hike after that. A set of soft data could do the magic of bad news is good news, and that investors could gently return to longer-term quality bonds, as despite what the Fed says, the end of tightening is certainly near. We saw a heavy slump in open interest in US government bonds as a result of waning dovish bets, but we also see the US 2-year yield slump below a two-month rising trend this morning, as the 10-year yield remains paralyzed a touch below the 3.75% level. The dollar index hardly challenges the 50-100-DMA area, and the stock markets are down, with the S&P500 steadily giving back gains, while MAMAA stocks are seen most vulnerable to a further downside correction due to the recent AI-led rally. Nvidia for example lost almost 4% yesterday, while Tesla fell more than 6%. Small caps, on the other hand, were better bid this Monday, as a sign of a portfolio rebalancing effect before the quarter ends. In this respect, the Russell 2000 index saw support and traded above its 100-DMA despite a broad-basedselloff in big caps, and especially in Big Techs.
The softer US dollar maintains the EURUSD above the 50-DMA, near 1.0875. News from Germany were less than ideal yesterday. The German business climate and expectations deteriorated faster than expected in June, but the Spanish producer prices fell nearly 7% versus a steady deceleration of 4.5% expected by analysts. Slower inflation is the only way to soften the European Central Bank (ECB) rate hike expectations. The Italian PPI, due Wednesday, is expected to print a nearly 10% slump y-o-y in May, and more than 6% slump just in May.
Today, US durable goods orders and house prices will be under close watch while Canada will release the latest set of CPI data. Both headline and core inflation are expected to slow, as a result of continued policy efforts to bring price pressures lower. The dollar-CAD drifts lower, due to a hawkish Bank of Canada (BoC) stance and despite selling pressure in crude oil. The pair is now at the lowest levels since September and is preparing to test the 1.30 support shortly.
Speaking of oil, the barrel of US crude remains steady at around the $70pb level, bulls don’t want to join in given the hawkish central bank stances and rising recession odds, while bears are not willing to push hard, as the geopolitical uncertainties maintain a high level of upside risks.
OPEC lately claimed that the global oil demand would rise to 110 mio barrels per day, with a 23% rise in overall energy demand expected by 2045. That goes perpendicularly against the IEA forecast of higher short-term demand but waning long term demand for oil because of energy transition to greener sources. You believe who you want to believe but the higher the traditional, dirty energy prices, the faster the transition will be.
Risk Sentiment Recovering
Market movers today
Today is a fairly quiet day on the data front. We will keep an eye on Conference Board consumer confidence and new homes sales in the US.
At the ECB forum on central banking several ECB speakers are scheduled to speak, including Lagarde and Schnabel.
The 60 second overview
Risk sentiment seems to be recovering this morning with all but Japanese equities higher in Asia. Euro is marginally higher against the dollar and weaker versus the Nordic currencies. Brent oil is range-trading at the 74-75 level. The dramatic events in Russia over the weekend have not led to big market moves, at least not yet. Rates markets currently price in one more hike for the Fed by November and 47bp worth of hikes by the ECB by December.
Russia: Pieces of new information have come up since yesterday, but it is still largely a mystery what happened in Russia over the weekend and what to expect going forward. Yesterday, Russia's foreign minister Lavrov confirmed that Wagner operations in Africa will continue. Russian state media also reported that the criminal cases brought against Wagner leader Prigozhin have still not been closed. Prigozhin's whereabouts are unknown but he did release an audio message yesterday, where he said that Saturday's march was to demonstrate protest against the destruction of Wagner and bring responsibility to those who have made mistakes in the war. The objective, he said, was not to topple the Russian government, i.e. not a coup attempt. Putin also gave a televised address in the evening saying those who organised the revolt had betrayed their country and people. He also said Wagner fighters could now join the regular military, go home or relocate to Belarus.
China has been fairly muted in its response to developments in Russia over the weekend, although expressing support for Russia's actions to maintain national stability while stating that it is Russia's 'internal affairs'. China's Foreign Minister Qin Gang met with Russia's Deputy Foreign Minister Andrey Rudenko. China is probably watching the events with some concern as it generally dislikes instability and has spent several years building a good relationship with Russia and President Putin. Any Russian regime change would create uncertainty over what the future path for both Russia as well as the China-Russia relationship would look like.
Equities: Global equities ended lower yesterday in a relatively uncommon mix of sectors outperforming and underperforming. Energy and materials were the best performing sectors with communication service and tech being the laggards. That could sound like fear of stagflation but look at the bond market and you find the short end of the curve being lower yesterday. In the US we saw the odd combination of Nasdaq down 1.2% while small caps in Russell 2000 higher by 0.1%. The challenging environment is continuing this morning with tech stocks in Hong Kong making solid advances at the same time as Japanese stocks are coming lower. Futures in Europe and US are higher this morning.
FX: USD fell slightly vis-à-vis EUR and JPY yesterday with EUR/USD recovering back above 1.09 and USD/JPY briefly touching the 143 level. The ECB forum at Sintra marks the highlight for majors this week, where Largarde, Powell, Bailey and Ueda all are set to attend.
FI: Rates continued to move lower in yesterday's trading session, but there was no clear impact from the chaotic events in Russia over the weekend. Oil prices (spot Brent) gained about +1% during the day, but overall the reaction in energy markets did not indicate a reprising of geopolitical risks, nor the inflation impulse from volatility in the energy market (inflation forward swaps were broadly unchaged on the day).
Credit: It was a busy day for EUR credits in the primary market. In the corporate segment a number of issuers where active, including Abertis, Floene Energias, Porsche and Deutsche Post, the latter bringing its inaugural sustainability-linked bond to the market. Financial issuers were also active, with Permanent TSB, RBC and Santander Consumer Bank bringing senior unsecured deals, while Intesa proved that demand for higher-yielding EUR covered bonds remains intact even after a German Pfandbrief was pulled last week as it struggled to generate sufficient orders. iTraxx Main was unchanged during the day closing at 79bp, while Xover closed 6bp wider at 424bp.
ECB Kazaks: Rates will need to be raised past July
ECB Governing Council member Martins Kazaks expressed concerns about the persistent high inflation, indicating that an economic slowdown may not be enough to counter it. He also pushed back against market expectations of an ECB rate cut in the first half of next year.
Kazaks stated, "The softness of the economy is unlikely to deal with inflation, which is still very high, with strong risks of persistence."
Further suggesting the need for rate hikes beyond July, Kazaks said, "In my view, we will still need to raise rates and I don't think that in July we'll be comfortable enough to say: 'we're done'. I think rates will need to be raised past July but when and by how much will be data-dependent."
Highlighting the divergence between his stance and market sentiments, he remarked, "The major problem with market pricing is the expectation of rates coming down so quickly. In my view, it's wrong and the reason is that the market must be pricing in a different macro scenario with inflation coming down much more quickly."
His views on potential rate cuts were very clear. Kazaks sees the need for rate cuts only when "it becomes quite certain that inflation is about to start significantly and persistently undershooting our target of 2%. And not at the end of the forecast period but towards the middle of the forecast period."
Nasdaq 100 Technical: Risk of a Medium-Term Blow-off Top
- Yesterday’s price action of Nasdaq 100 has reintegrated back below the upper limit of the “Ascending Wedge” with a bearish breakdown below its daily RSI momentum indicator.
- Short-term momentum is still bearish as the Index has broken below the 20-day moving average which has also turned flat.
- 14,980 is the key short-term resistance to watch.
This is a follow-up on our prior analysis “Nasdaq 100 Technical: Squeezed up ahead of CPI and FOMC” published on 13 June 2023. It rallied and hit the key 15,100/270 resistance zone as expected.
Interestingly, after the Nasdaq 100, the top performer among the benchmark US stock indices (recorded a year-to-date return of +36.12% as of 23 June 2023) hit the 15,270 key medium-term pivotal resistance (printed on intraday high of 15,285 on 16 June 2023), it shed a weekly loss of -1.28% for the week of 20 June 2023 which was its worst weekly loss in around three months.
At the risk of forming a medium-term blow-off top
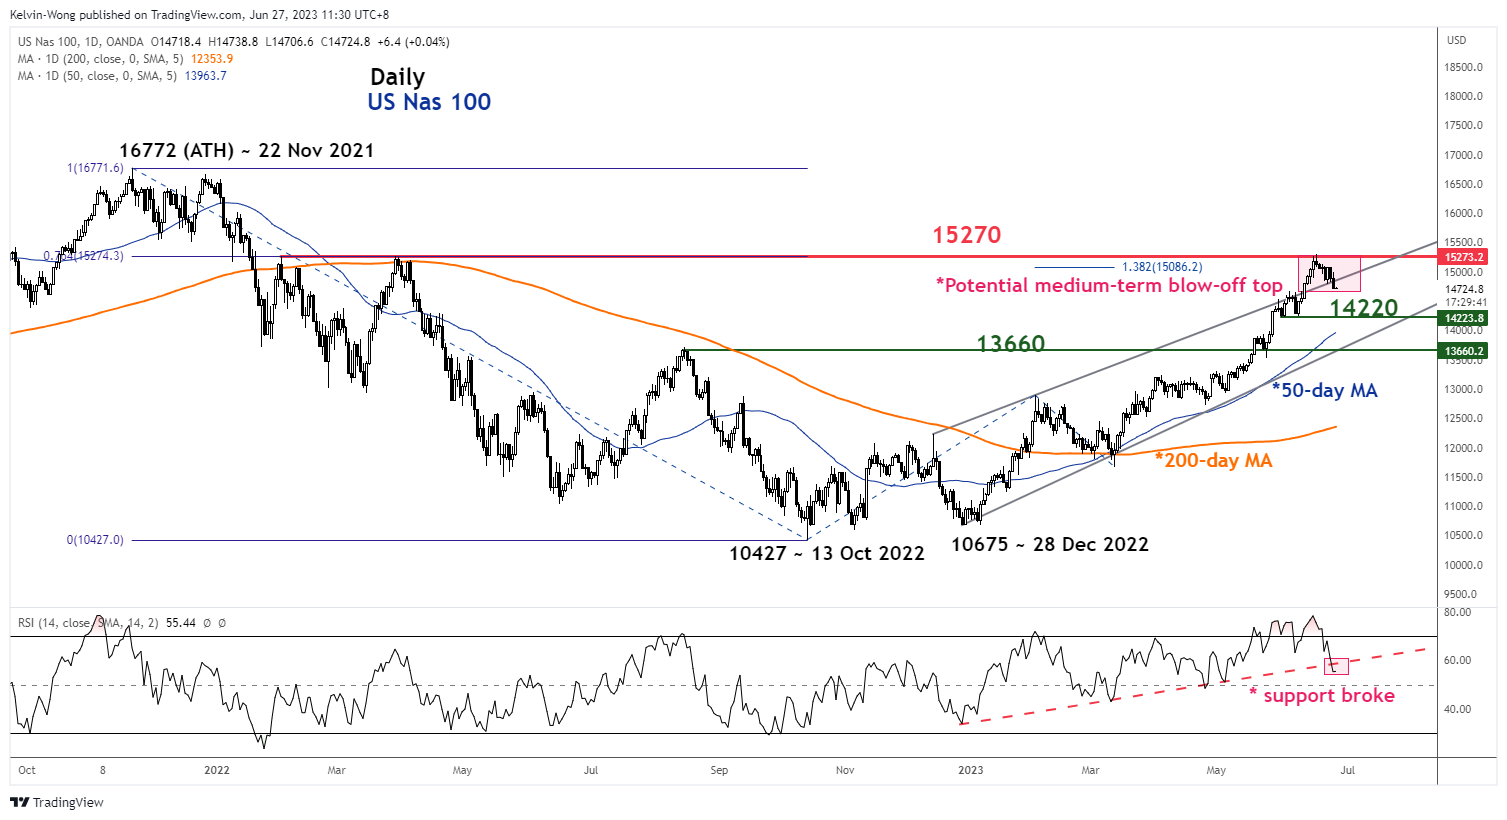
Fig 1: US Nas 100 medium-term trend as of 27 Jun 2023 (Source: TradingView, click to enlarge chart)
The recent price actions of the US Nas 100 (a proxy for the Nasdaq 100 futures) has reintegrated back below the upper limit of the bearish “Ascending Wedge” configuration yesterday, 26 June, and had a daily below it which indicates that the prior break above this upper limit on 12 June is considered as a failure bullish breakout (see daily chart).
In addition, the daily RSI oscillator has broken below its key corresponding ascending trendline support at the 58 level which suggests that medium-term momentum may have turned bearish that in turn reinforces the potential medium-term blow-off view.
The key medium-term support to watch will be at 13,660 (lower limit of the “Ascending Wedge”, 50-day moving average, former swing high area of 15 August 2022 & close to the 38.2% Fibonacci retracement of the up move from 28 December 2022 low to 16 June 2023).
Short-term momentum remains bearish
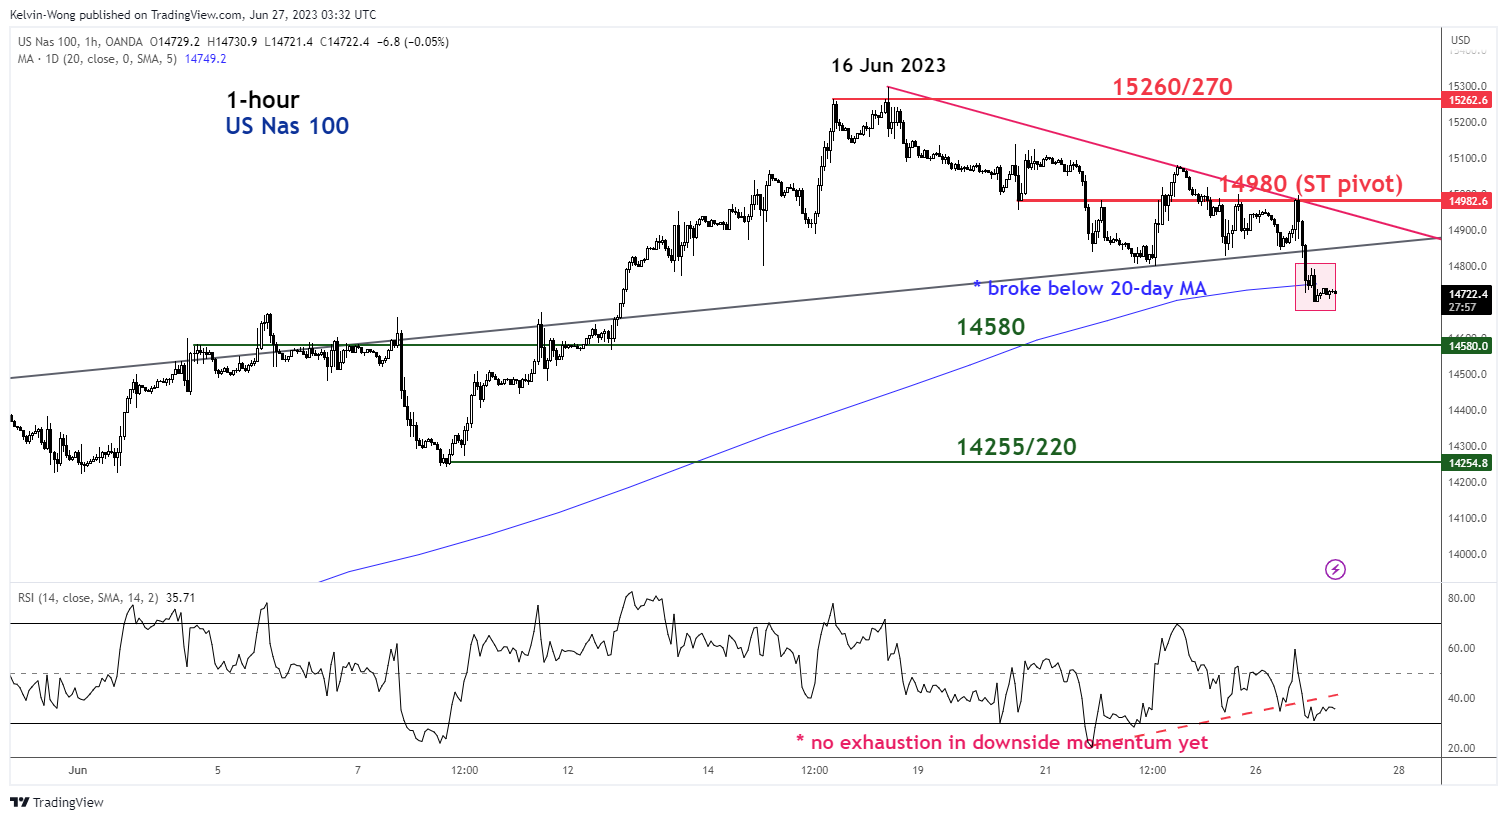
Fig 2: US Nas 100 short-term minor trend as of 27 Jun 2023 (Source: TradingView, click to enlarge chart)
Price actions of the Index have broken below the 20-day moving average that has started to turn flat (see 1-hour chart). The hourly RSI oscillator has continued to inch downwards towards the oversold level of below 30 but no bullish divergence signal yet.
Watch the 14,980 key short-term pivotal resistance and a break below 14,580 support exposes the next support at 14,255/220.
On the flip side, a clearance above 14,980 negates the bullish tone to see a retest on the 15,260/270 key medium-term resistance.
Technical Outlook and Review
DXY:
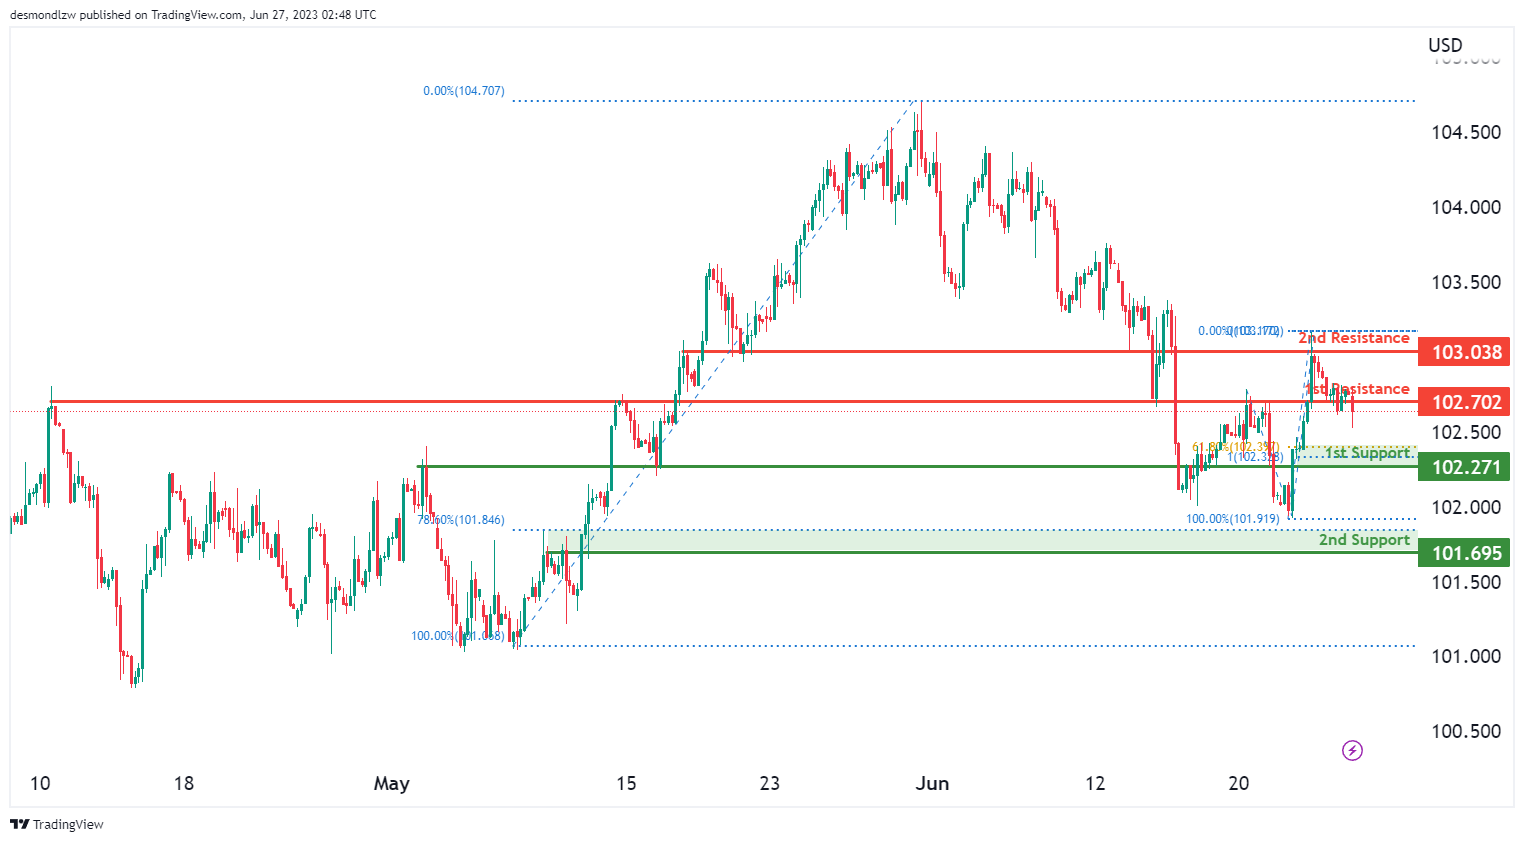
The DXY (US Dollar Index) chart indicates a bearish momentum, suggesting the potential for further downward movement. There is a possibility of a bearish continuation towards the 1st support level at 102.27, which is supported by the presence of pullback support, as well as the 61.80% Fibonacci Retracement and 100% Fibonacci Projection, indicating Fibonacci confluence. Additionally, the 2nd support level at 101.69 acts as an overlap support, further reinforcing its significance.
On the upside, the 1st resistance level at 102.70 represents an overlap resistance, potentially impeding upward price advancement. Similarly, the 2nd resistance level at 103.03 serves as another overlap resistance, further emphasising its importance.
EUR/USD:
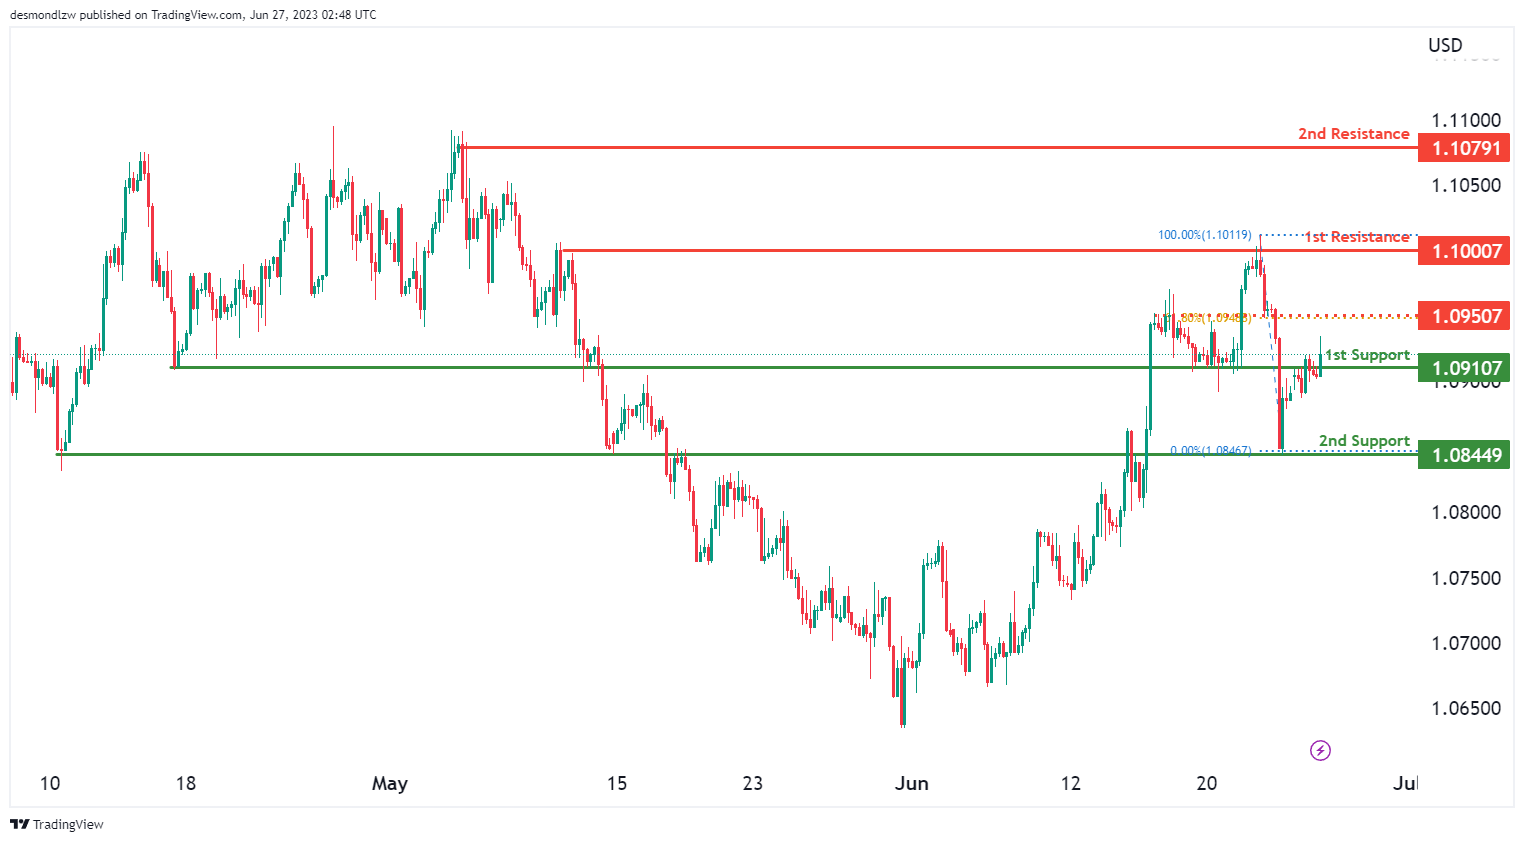
The EUR/USD chart indicates a bullish momentum, suggesting the potential for further upward movement. There is a possibility of a bullish continuation towards the 1st resistance level at 1.1000, which is characterized as a swing high resistance. Additionally, the 2nd resistance level at 1.1079 acts as a multi-swing high resistance, further reinforcing its significance.
On the downside, the 1st support level at 1.0910 provides potential support as a pullback support, while the 2nd support level at 1.0844 acts as an overlap support, adding to its importance.
Furthermore, there is an intermediate resistance level at 1.0950, serving as a pullback resistance and coinciding with the 61.80% Fibonacci Retracement.
GBP/USD:
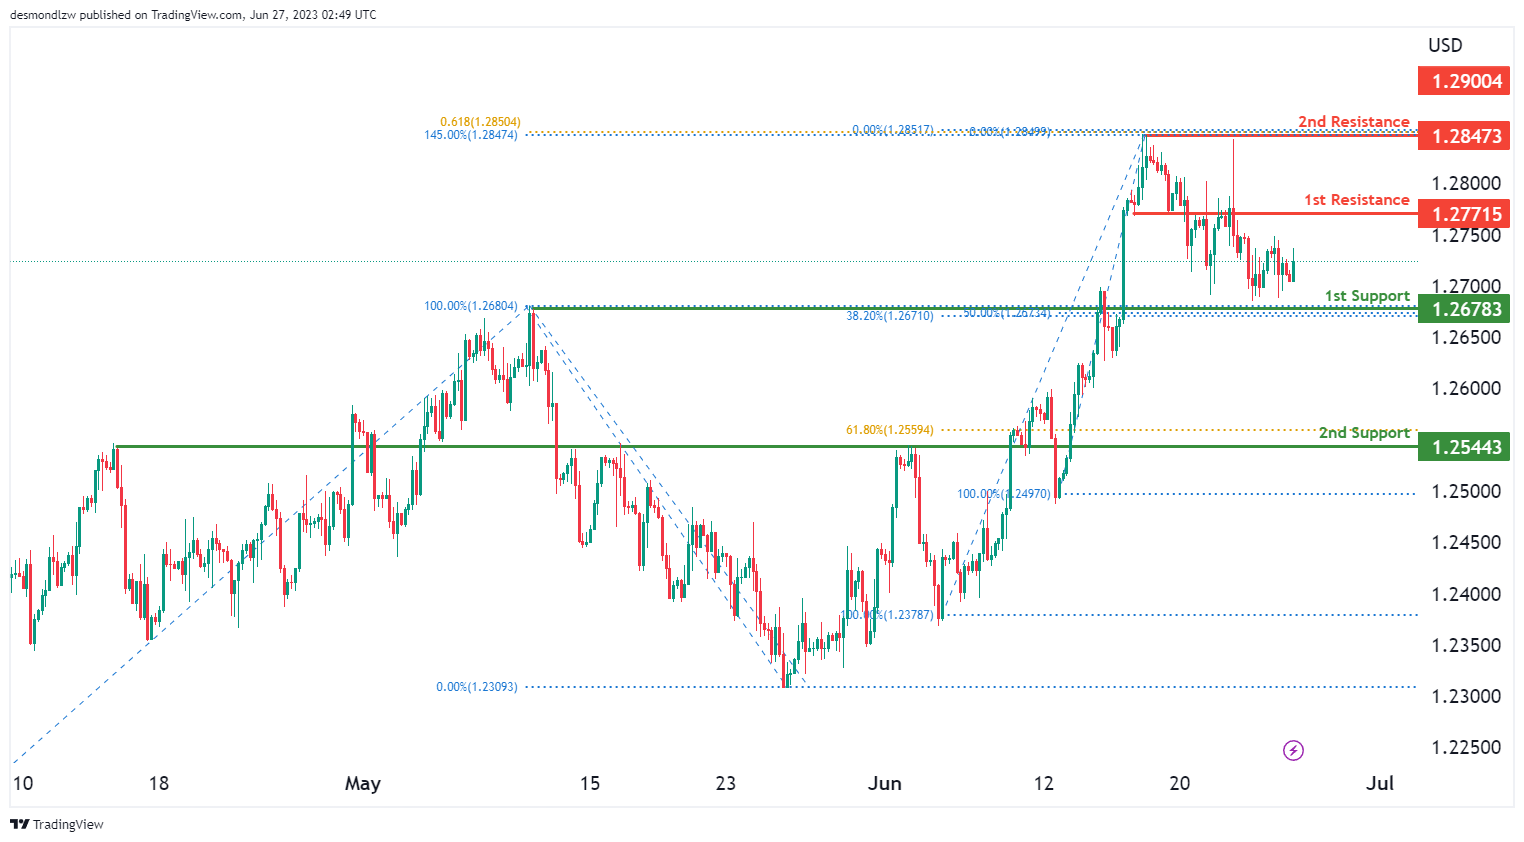
The GBP/USD chart currently exhibits a neutral momentum, indicating a lack of clear direction in the market. As a result, there is a possibility for price to fluctuate between the 1st resistance level at 1.2771 and the 1st support level at 1.2678.
The 1st support level at 1.2678 is considered significant as it represents an overlap support, further reinforced by the presence of the 38.20% and 50% Fibonacci Retracement, suggesting a Fibonacci confluence. Additionally, the 2nd support level at 1.2544 acts as a pullback support, adding to the potential strength of the support zone.
On the upside, the 1st resistance level at 1.2771 serves as a pullback resistance, potentially impeding further upward price movement. Furthermore, the 2nd resistance level at 1.2847 acts as a swing high resistance, supported by the presence of the 145.00% Fibonacci Extension and 61.80% Fibonacci Projection.
USD/CHF:
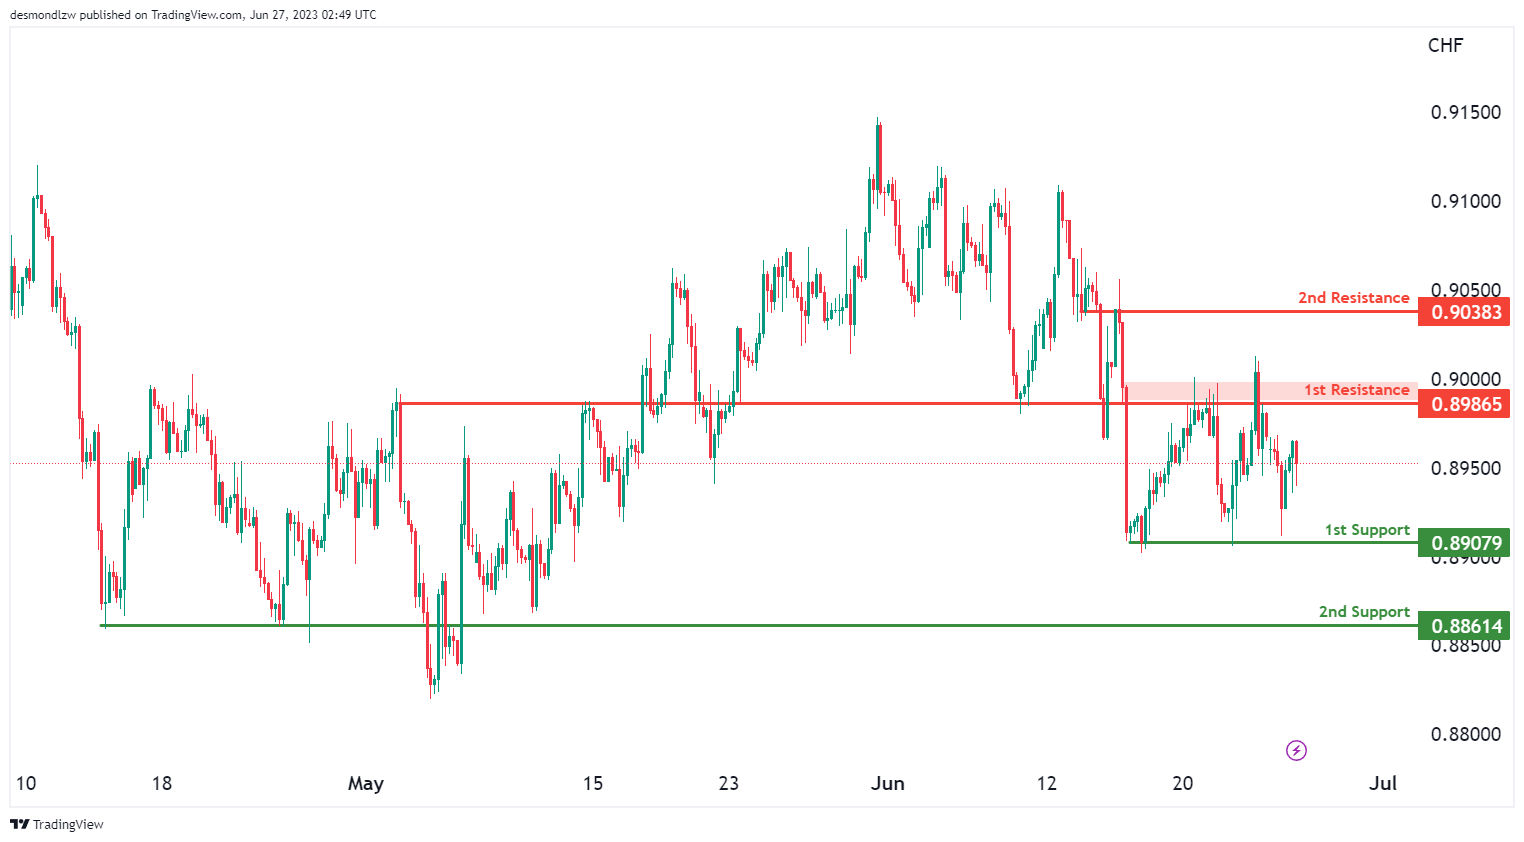
The USD/CHF chart currently exhibits a neutral momentum, indicating a lack of clear direction in the market. As a result, there is a possibility for price to fluctuate between the 1st resistance level at 0.8986 and the 1st support level at 0.8907.
The 1st support level at 0.8907 is considered a multi-swing low support, suggesting potential strength in the support zone. Additionally, the 2nd support level at 0.8861 acts as a pullback support, providing further support to the price.
On the upside, the 1st resistance level at 0.8986 represents an overlap resistance, potentially impeding further upward price movement. Furthermore, the 2nd resistance level at 0.9038 also acts as an overlap resistance, reinforcing its significance.
USD/JPY:
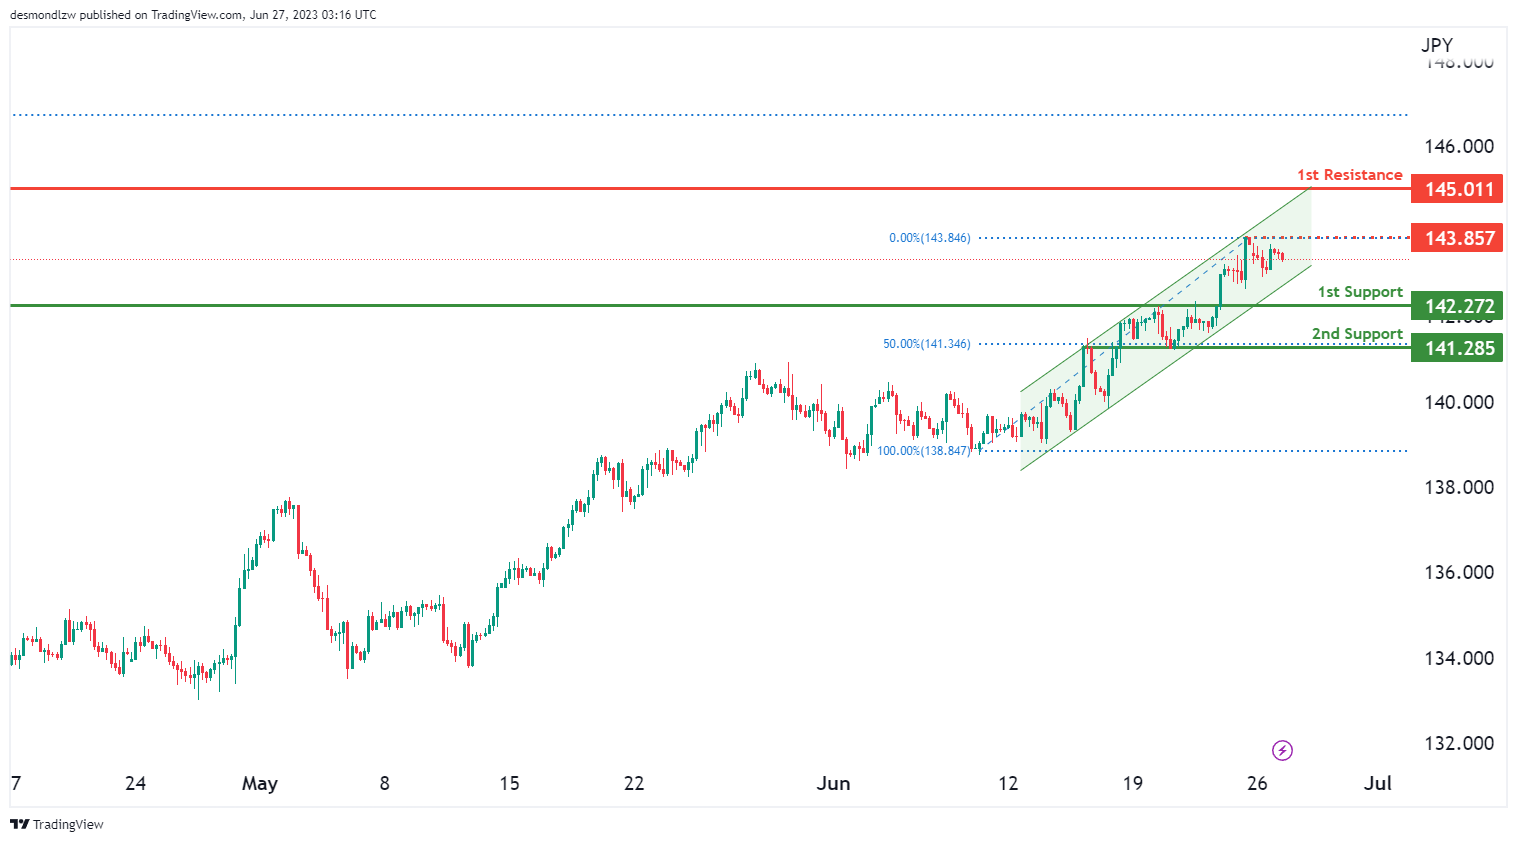
The USD/JPY chart currently exhibits a bullish momentum, characterised by the price movement within a bullish ascending channel, suggesting a potential for further upward movement.
There is a possibility for a bullish continuation towards the 1st resistance level at 145.01, which acts as a pullback resistance. Additionally, the 2nd support level at 143.85 serves as a swing high resistance, further reinforcing its significance in potentially impeding upward price advancement.
On the downside, the 1st support level at 142.27 represents a pullback support, providing potential strength to the support zone. Another support level, the 2nd support at 141.28, acts as an overlap support, further confirming its importance.
USD/CAD:
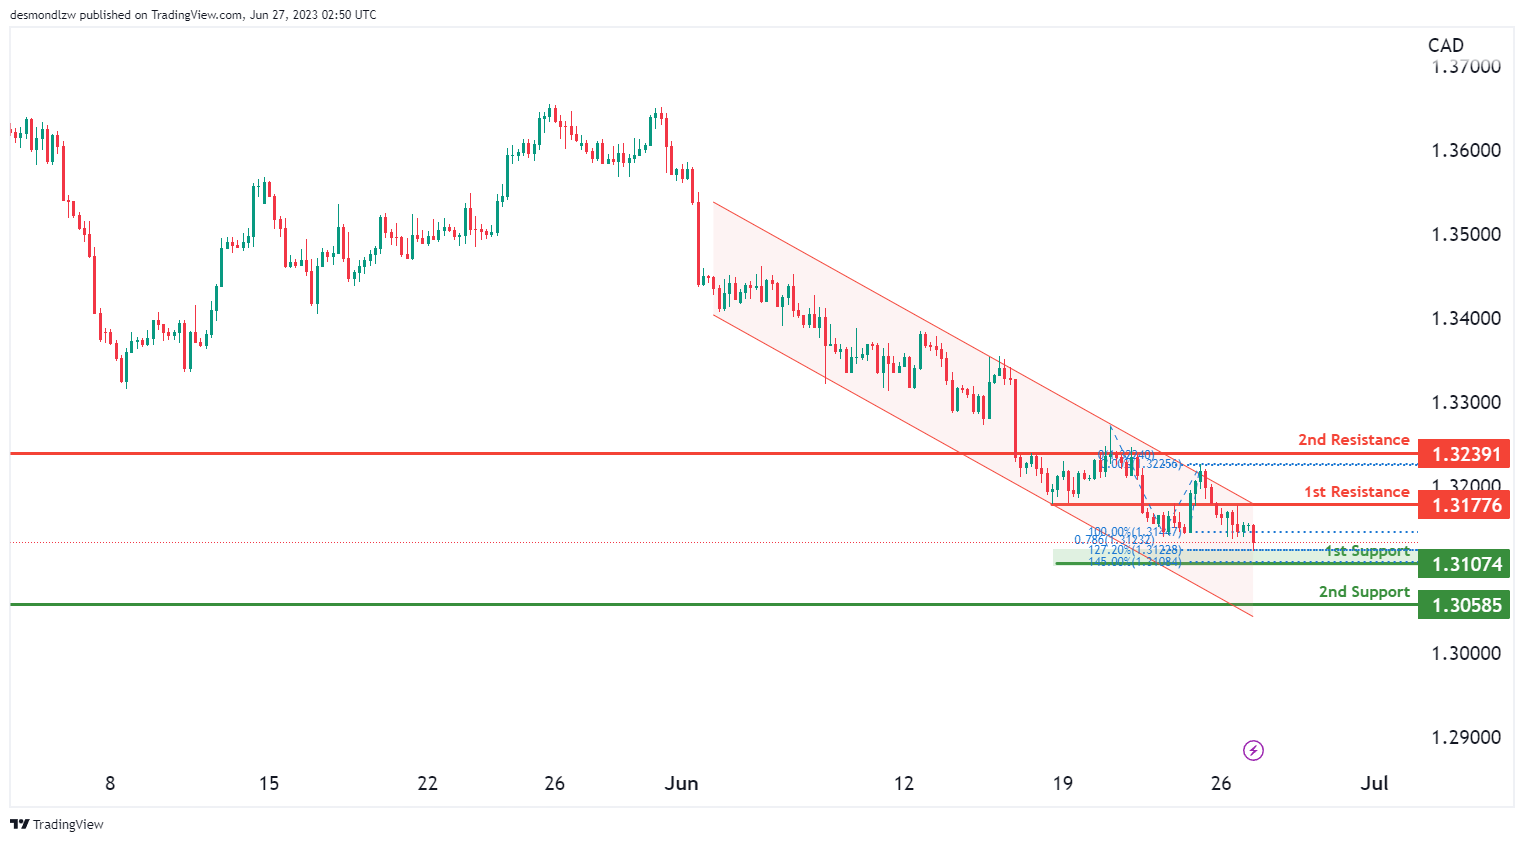
The USD/CAD chart currently demonstrates a bearish momentum, characterized by the price movement within a bearish descending channel, suggesting a potential for further downward movement.
There is a possibility of a short-term rise towards the 1st resistance level at 1.3177, which acts as an overlap resistance. However, it is anticipated that the price may reverse off this resistance level and subsequently drop towards the 1st support level at 1.3107. The confluence of the 127.20% Fibonacci Extension and the 78.60% Fibonacci Projection reinforces the significance of this support level.
Additionally, the 2nd support level at 1.3058 serves as a pullback support, further contributing to its importance in potentially providing a supportive zone. On the upside, the 2nd resistance level at 1.3239 acts as another overlap resistance, emphasizing its significance in hindering further upward price advancement.
AUD/USD:
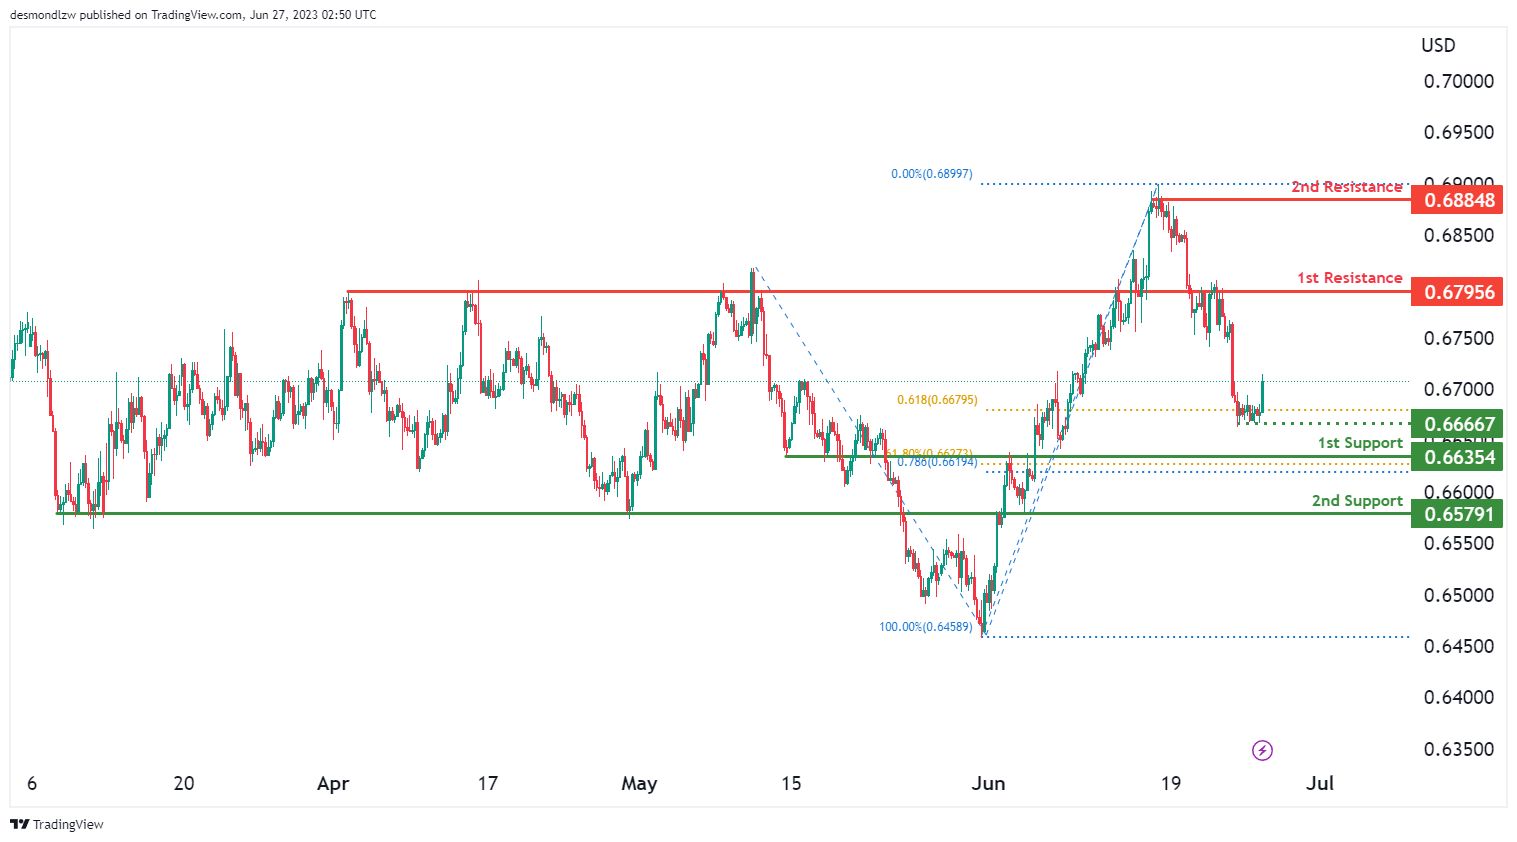
The AUD/USD chart currently shows a bearish momentum, indicating a potential for continued downward movement in the market.
There is a possibility of a bearish continuation towards the 1st support level at 0.6635. This support level is significant as it represents a pullback support and is further reinforced by the presence of the 61.80% Fibonacci Retracement and the 78.60% Fibonacci Projection, indicating Fibonacci confluence. Additionally, the 2nd support level at 0.6579 acts as an overlap support, further emphasizing its importance in potentially providing a supportive zone.
On the upside, the 1st resistance level at 0.6795 represents an overlap resistance, potentially impeding upward price advancement. Furthermore, the 2nd resistance level at 0.6884 serves as a multi-swing high resistance, further reinforcing its significance in hindering further upward movement.
NZD/USD
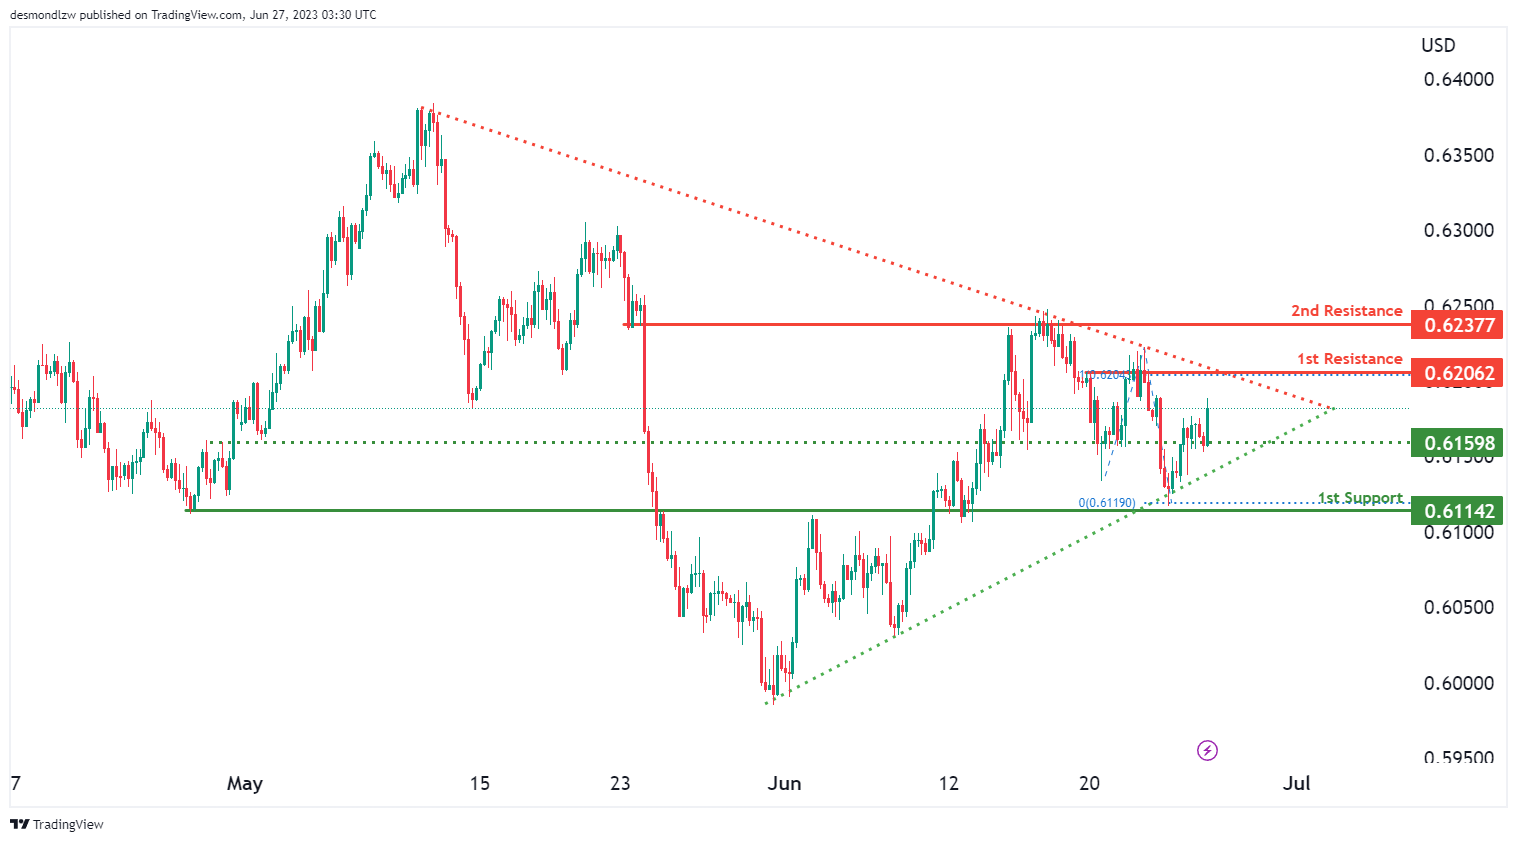
The NZD/USD chart currently shows a neutral momentum, suggesting a lack of clear direction in the market. The price could potentially fluctuate between the 1st resistance level at 0.6206 and the 1st support level at 0.6114.
The 1st support level at 0.6114 is identified as an overlap support, providing potential strength to the support zone. Additionally, there is an intermediate support level at 0.6159, acting as another overlap support.
On the upside, the 1st resistance level at 0.6206 represents a multi-swing high resistance, potentially impeding upward price advancement. Furthermore, the 2nd resistance level at 0.6237 acts as an overlap resistance, further confirming its significance.
It is worth noting that a symmetrical triangle chart pattern is also present, indicating a period of consolidation. Breakouts above the upper trendline of the pattern could signal a bullish breakout, while breakouts below the lower trendline may indicate a bearish breakdown.
DJ30:
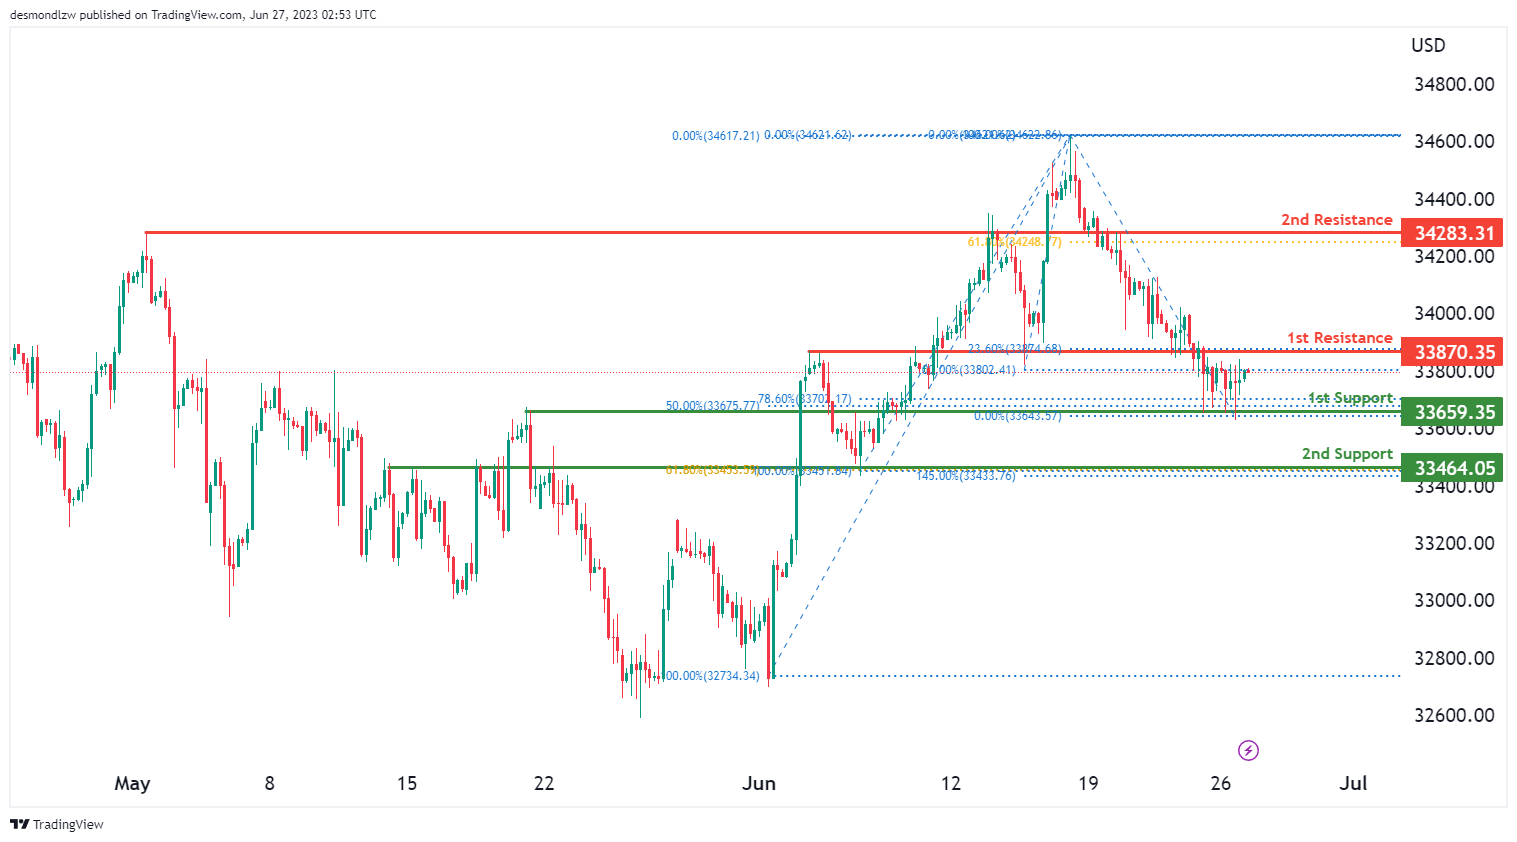
The DJ30 (Dow Jones 30) chart currently shows a neutral momentum, indicating a lack of clear direction in the market. The price could potentially fluctuate between the 1st resistance level at 33870.35 and the 1st support level at 33659.35.
The 1st support level at 33659.35 is identified as an overlap support and is reinforced by the presence of the 50% Fibonacci Retracement and the 78.60% Fibonacci Retracement. Additionally, the 2nd support level at 33464.05 acts as another overlap support and coincides with the 61.80% Fibonacci Retracement and the 145.00% Fibonacci Extension.
On the upside, the 1st resistance level at 33870.35 represents an overlap resistance and is further supported by the presence of the 23.60% Fibonacci Retracement. Furthermore, the 2nd resistance level at 34283.31 acts as an overlap resistance and coincides with the 61.80% Fibonacci Retracement.
GER30:
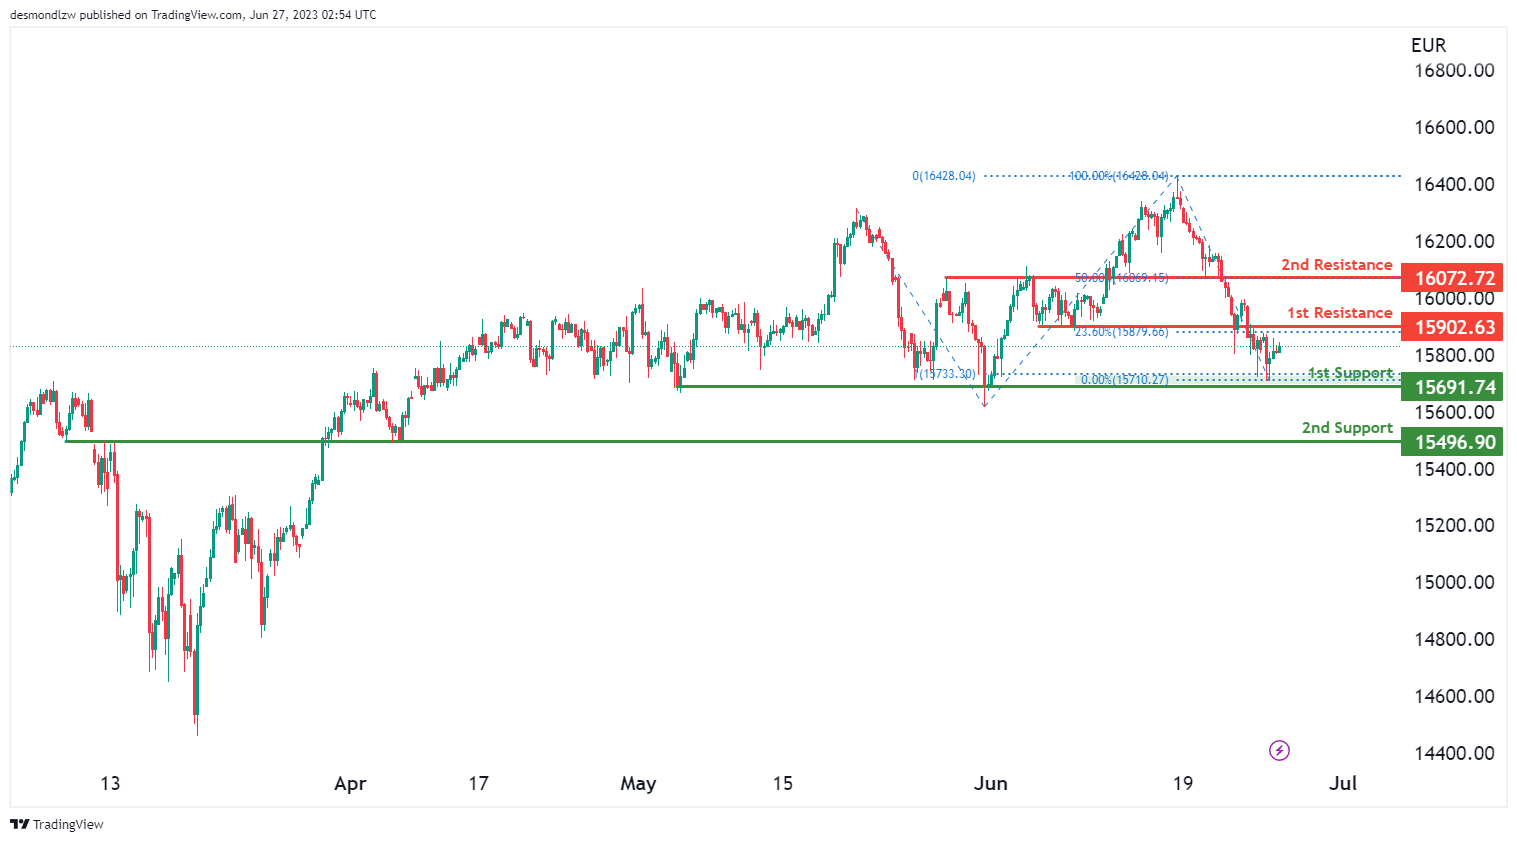
The GER30 (Germany 30) chart is currently showing a neutral momentum, suggesting a lack of clear direction in the market. The price could potentially fluctuate between the 1st resistance level at 15902.63 and the 1st support level at 15691.74.
The 1st support level at 15691.74 is identified as a multi-swing low support and is further reinforced by the presence of the 100% Fibonacci Projection. Additionally, the 2nd support level at 15496.90 acts as an overlap support, providing additional strength to the support zone.
On the upside, the 1st resistance level at 15902.63 represents an overlap resistance and is further supported by the presence of the 23.60% Fibonacci Retracement. Furthermore, the 2nd resistance level at 16072.72 acts as a pullback resistance and coincides with the 50% Fibonacci Retracement.
US500
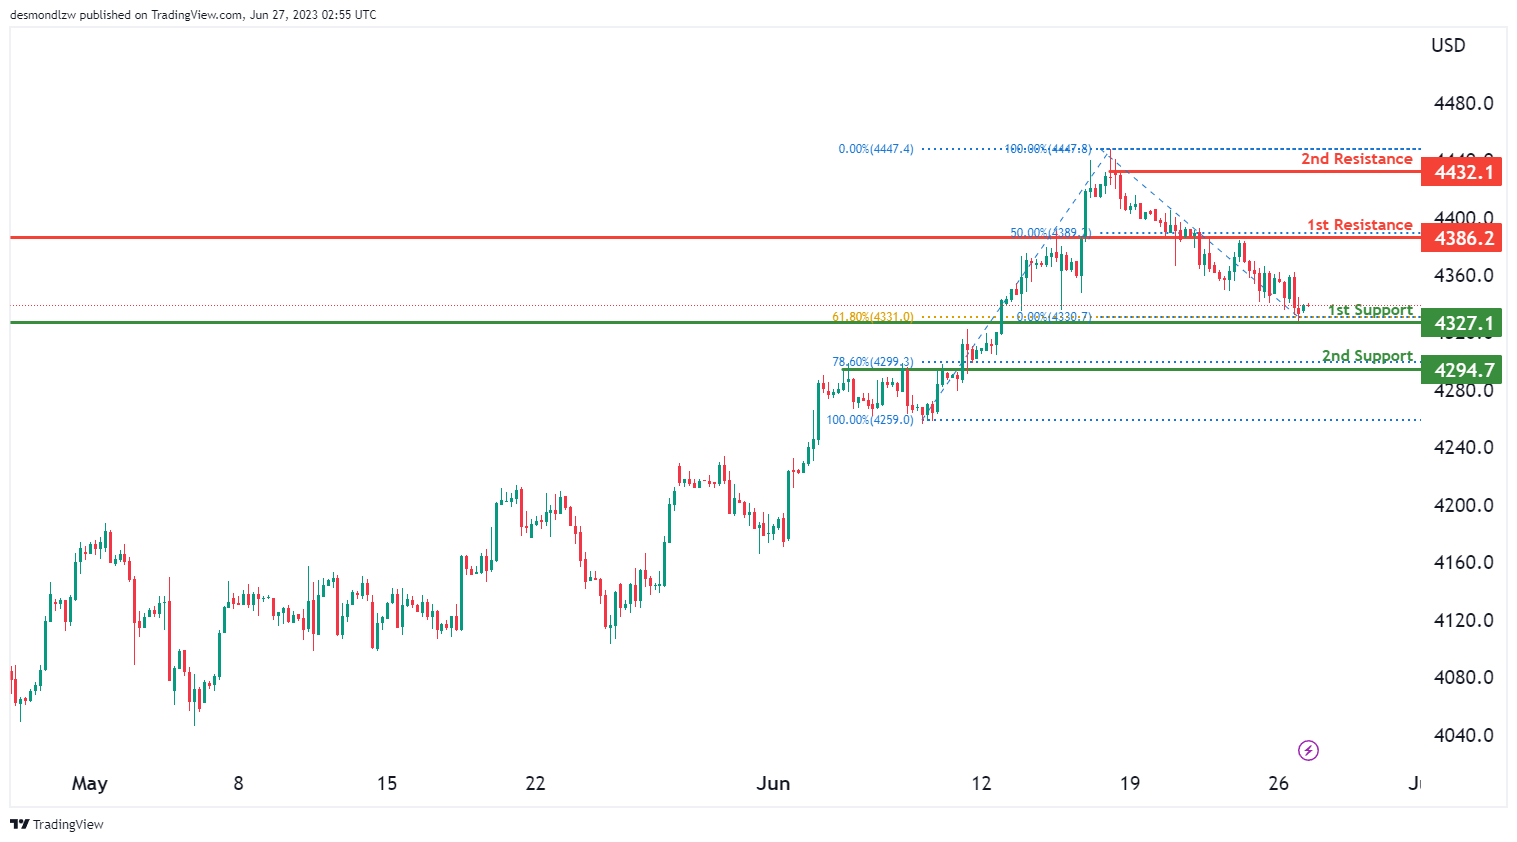
The US500 (S&P 500) chart currently exhibits a weak bullish momentum with low confidence, suggesting a cautious market sentiment.
There is a possibility of a bullish bounce off the 1st support level at 4327.10, which is identified as an overlap support and is further reinforced by the presence of the 61.80% Fibonacci Retracement. Additionally, the 2nd support level at 4294.70 acts as another overlap support, providing further strength to the support zone.
On the upside, the 1st resistance level at 4386.20 represents an overlap resistance and may impede upward price movement. Furthermore, the 2nd resistance level at 4432.10 serves as a swing high resistance, reinforcing its significance in hindering further upward advancement.
BTC/USD:
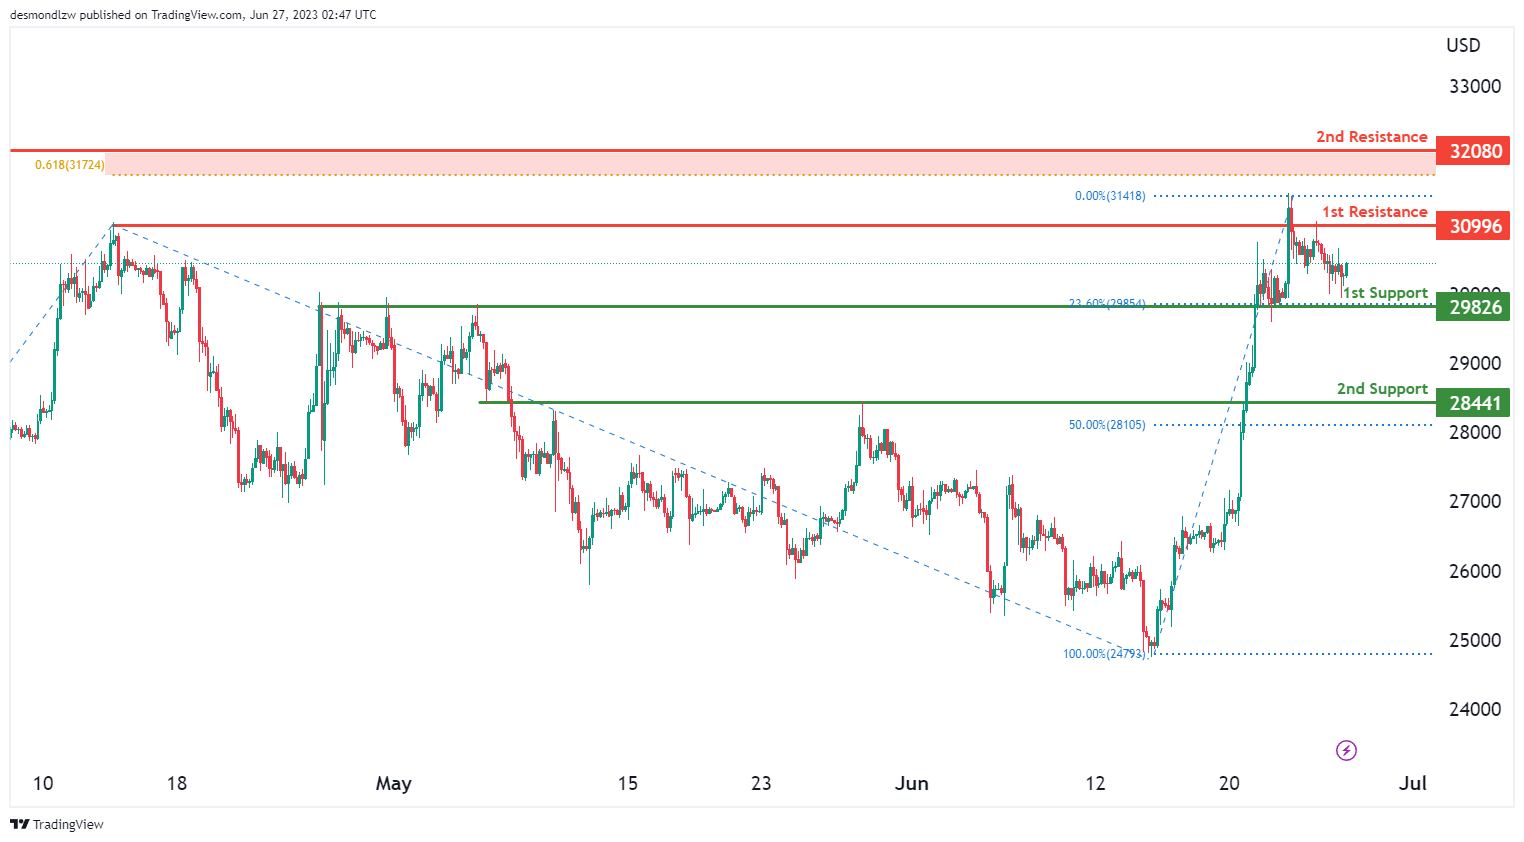
The BTC/USD (Bitcoin) chart currently exhibits a neutral momentum, indicating a lack of clear direction in the market.
There is a possibility of price fluctuating between the 1st resistance level at 30996.00, which acts as a pullback resistance, and the 1st support level at 29826.00. The 1st support level is considered an overlap support and is further supported by the presence of the 23.60% Fibonacci Retracement. Additionally, the 2nd support level at 28441.00 acts as another overlap support and coincides with the 50% Fibonacci Retracement.
On the upside, the 2nd resistance level at 32080.00 represents a swing high resistance and is identified as the potential barrier for further upward movement.
ETH/USD:
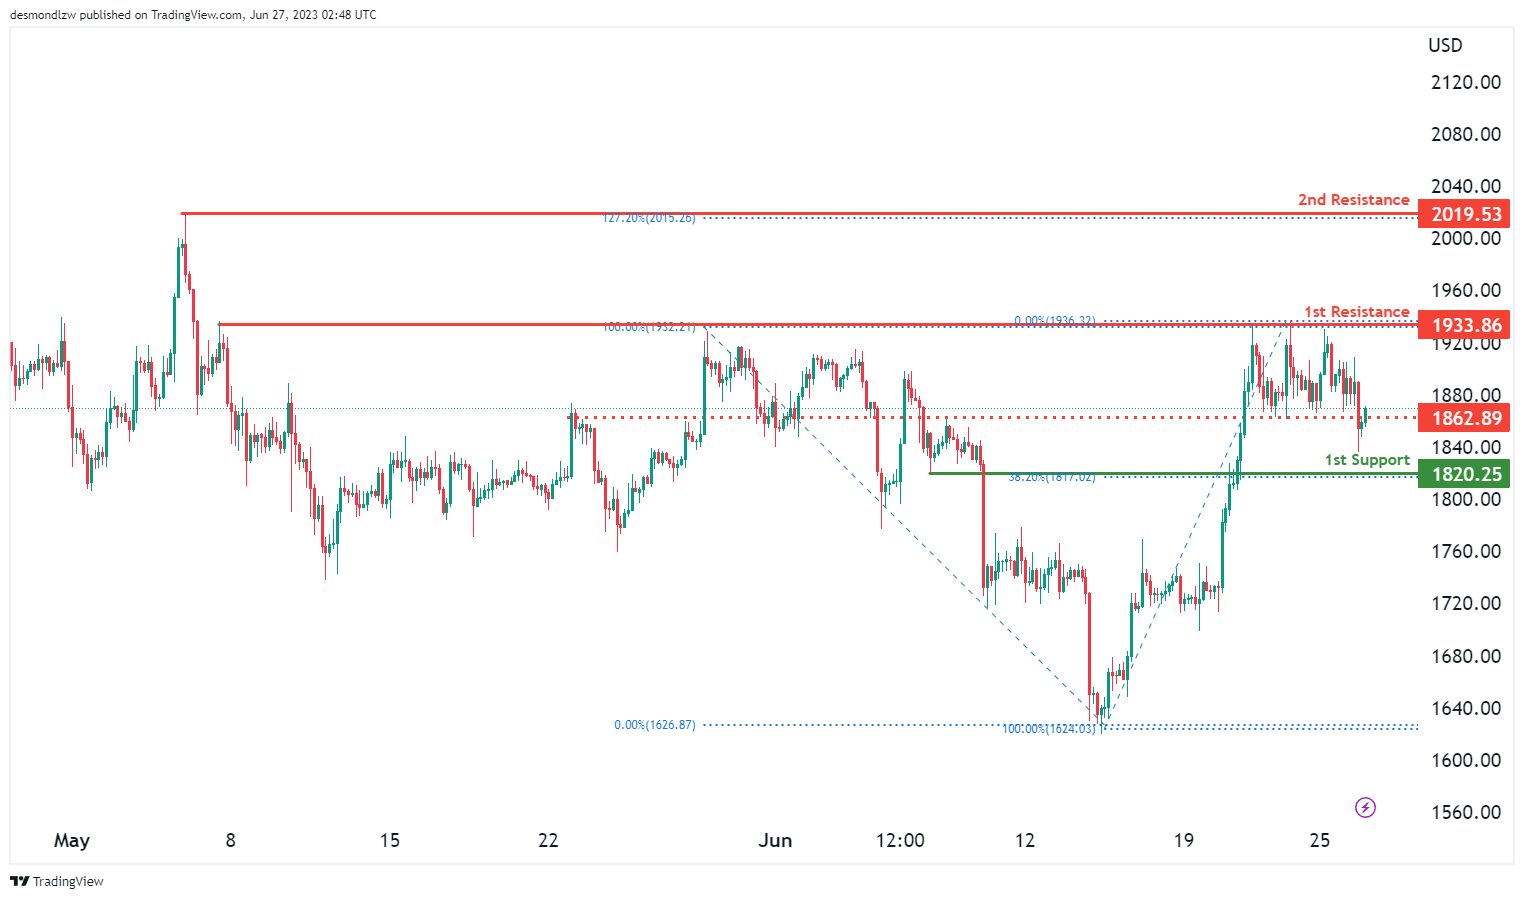
The ETH/USD (Ethereum) chart currently shows a weak bullish momentum with low confidence, suggesting a tentative upward movement in the market.
There is a potential for a bullish continuation towards the 1st resistance level at 1933.86. This resistance level is characterized as a multi-swing high resistance, indicating its significance in potentially impeding further upward price advancement. Additionally, the 2nd resistance level at 2019.53 acts as a swing high resistance, reinforcing its role as a potential barrier for the price.
On the downside, the 1st support level at 1820.25 is identified as a pullback support, potentially providing a level of price support. Further analysis may be required to determine additional support levels.
WTI/USD:
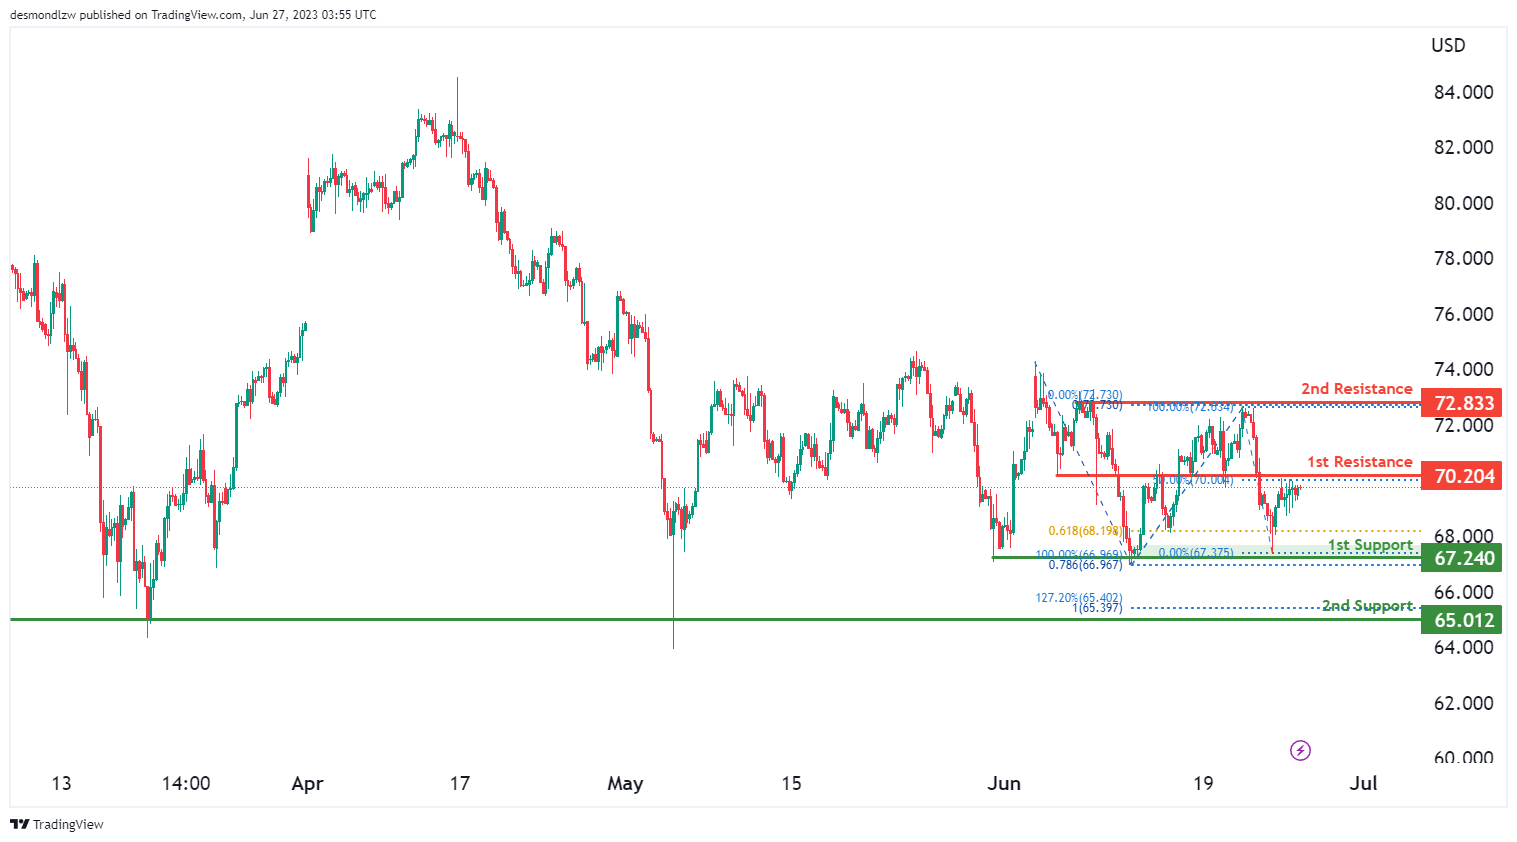
The WTI (West Texas Intermediate) chart currently exhibits a neutral momentum, indicating a lack of clear direction in the market.
There is a potential for price to fluctuate between the 1st resistance level at 70.20 and the 1st support level at 67.24. The 1st support level is identified as a multi-swing low support, further reinforced by the presence of the 50% Fibonacci Retracement. Additionally, the 2nd support level at 65.01 acts as another multi-swing low support, indicating potential strength in the support zone. This level is further supported by the 100% Fibonacci Projection and 127.20% Fibonacci Extension.
On the upside, the 1st resistance level at 70.20 represents an overlap resistance, potentially impeding further upward price movement. Furthermore, the 2nd resistance level at 72.83 is identified as a multi-swing high resistance, reinforcing its significance in potentially hindering upward advancement.
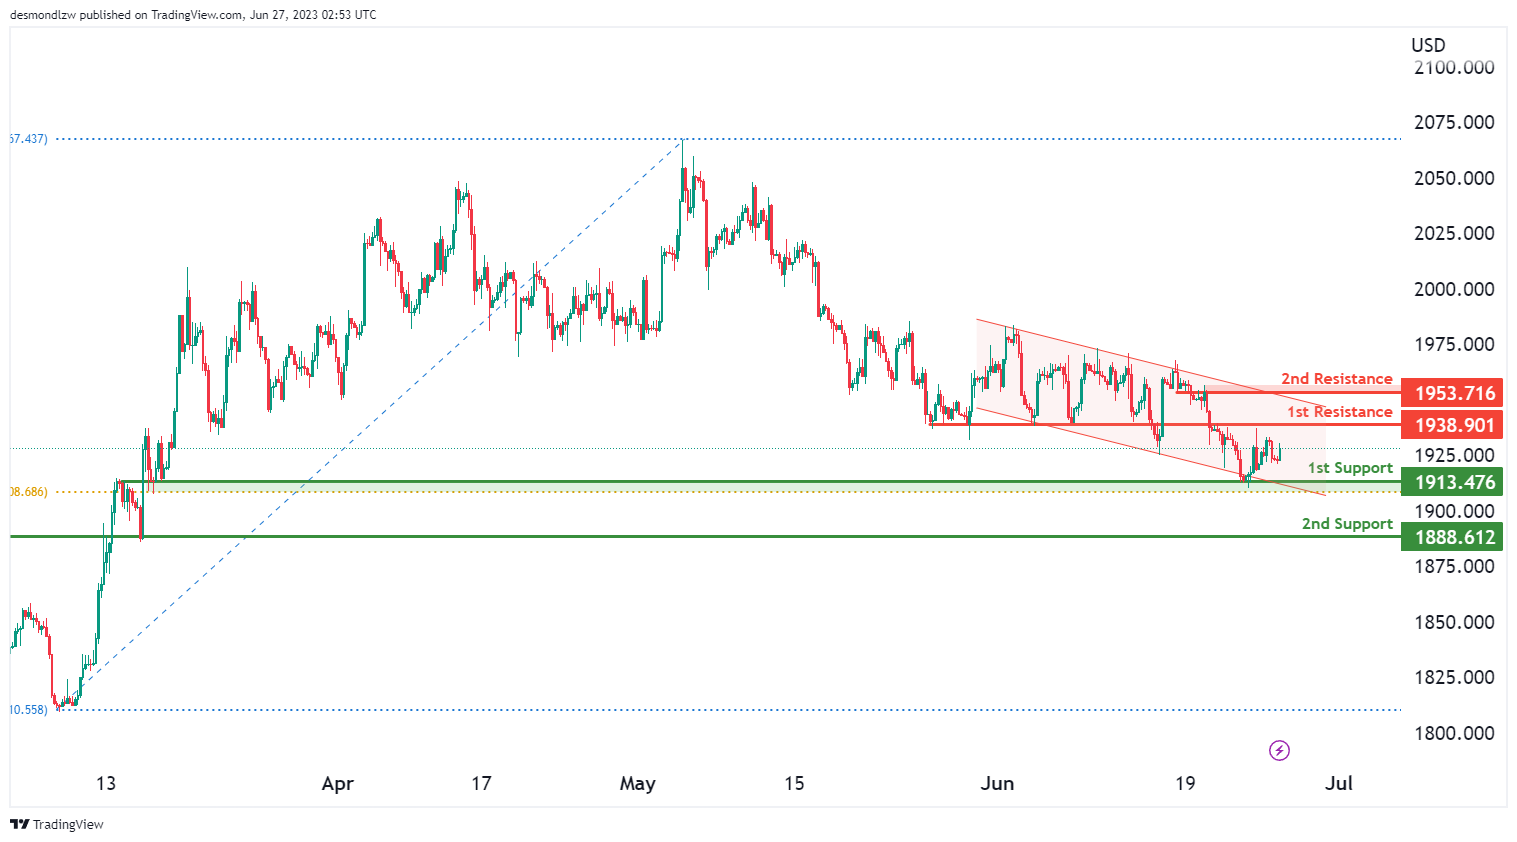
XAU/USD (GOLD):
The XAU/USD (Gold/US Dollar) chart currently demonstrates a bearish momentum, as indicated by the price being within a bearish descending channel.
There is a potential for price to fluctuate between the 1st resistance level at 1938.90 and the 1st support level at 1913.47. The 1st support level is considered an overlap support, suggesting its significance in providing potential price stability. Additionally, the 2nd support level at 1888.61 acts as another overlap support, reinforcing its importance.
On the upside, the 1st resistance level at 1938.90 is identified as an overlap resistance, potentially impeding upward price movement. Furthermore, the 2nd resistance level at 1953.71 is also categorized as an overlap resistance, adding to its potential role in hindering price advancement.