

Sample Category Title
Gold Price Takes a Breather But Bearish Pressure Persists
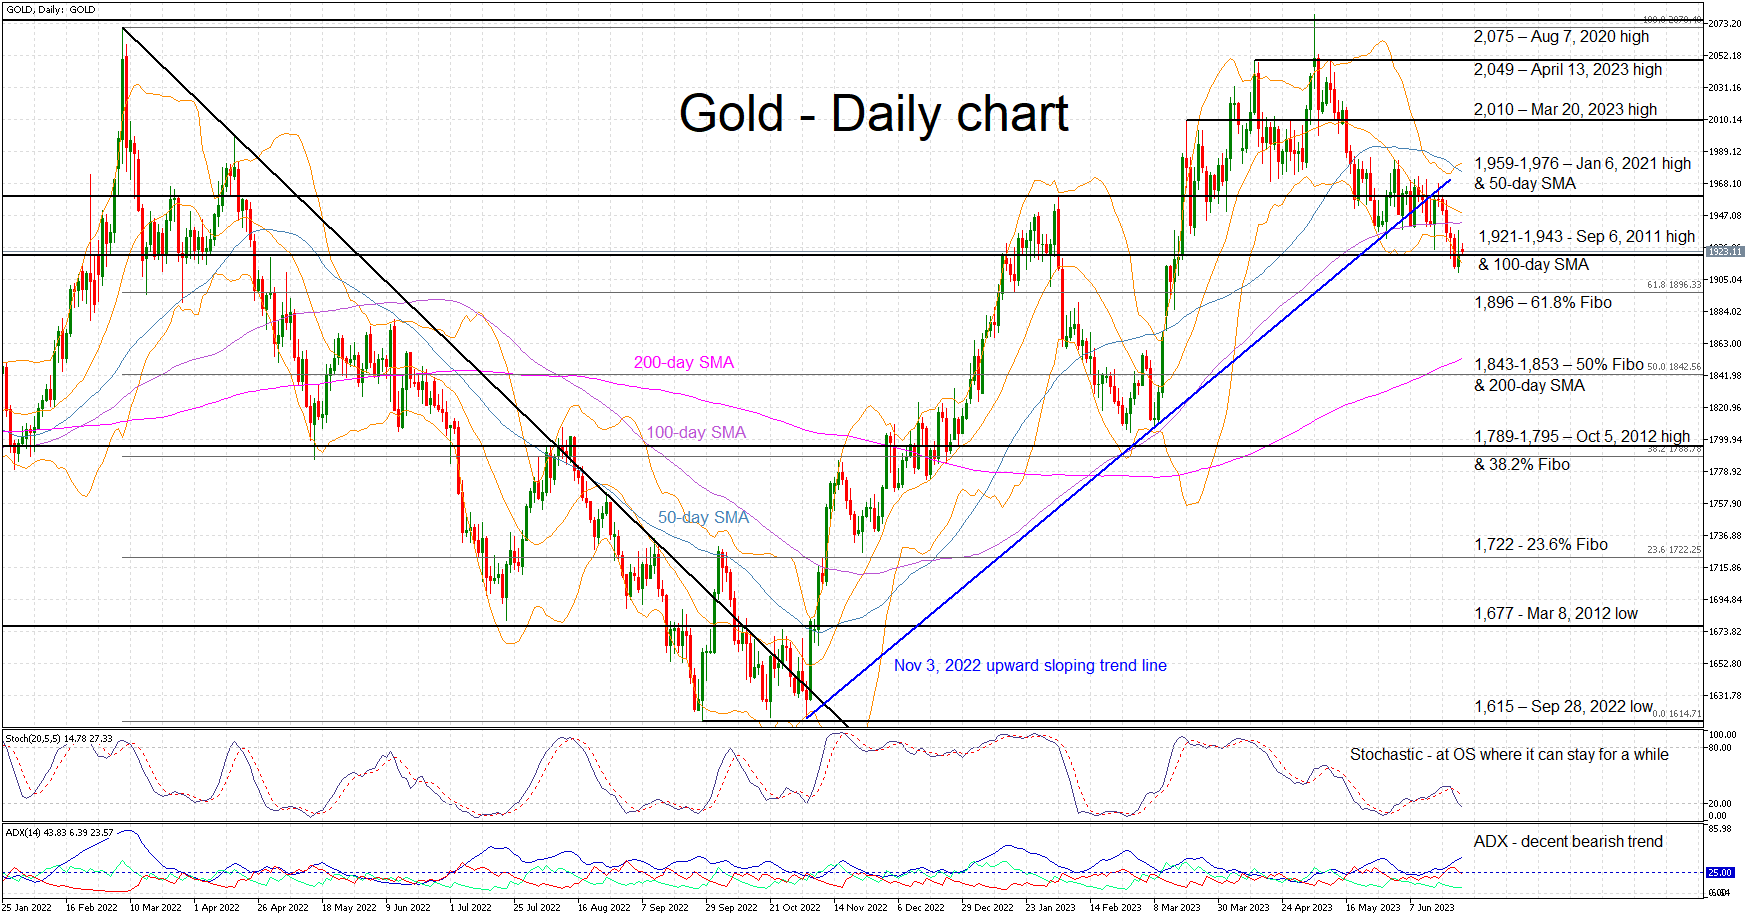
Gold is hovering inside the 1,921-1,943 area, a tad above its 3-month low and around 7.5% lower than the May 5, 2023 high of 2,079. The bulls are anxiously trying to put a temporary stop to the current short-term bearish trend and the bearish series of lower highs and lower lows.
The momentum indicators are still mostly on the bears’ side. The Average Directional Movement Index (ADX) is pointing to a bearish trend, the strongest one since the February-March 2023 correction, and the stochastic oscillator has just moved to its oversold (OS) territory. Although it can stay inside its OS area for a while, allowing gold to record lower lows, this drop is also an early sell-off exhaustion sign.
Should the bears decide to push the gold price even lower, they would quickly try to break the 1,921-1,943 area defined by the September 6, 2011 high and the 100-day simple moving average (SMA). Lower, the 61.8% Fibonacci retracement of March 8, 2022 – September 28, 2022 downtrend at 1,896 is unlikely to trouble the bulls as they would then set their eyes on the key 1,843-1,853 area.
On the other hand, the bulls would love to keep gold above 1,943 and gradually target the busier 1,959-1,976 area that is populated by January 6, 2021 high and the 50-day SMA. If successful, they would then have the chance to record a higher high, breaking the recent bearish pattern of lower highs, and open the door to a move above the 2,000 threshold.
To sum up, the bulls are trying to put a temporary stop to gold’s freefall by defending the 1,921-1,943 level, but there is still some gas left in the bearish tank.
Geopolitical Chaos, FX Intervention, and US Banks’ Stress Test Results
- Russia’s weekend mutiny cast doubts on Putin’s grip on power.
- No major impact on markets but keep a lookout on Gold, which bounced off the key support zone of US$1,913/1,896 per ounce.
- Stern FX verbal intervention from Japan’s top currency official. Watch USD/JPY key near-term support at 142.50/25.
- US banking stocks tumbled ahead of annual key Fed’s banks’ stress test results
Before the start of this new trading week, market participants were being jolted from their weekend leisure activities to shift their focus to the internal coup in Russia that may put President Putin’s power grip in jeopardy.
Yevgeny Prigozhin, leader of the Wagner Group, a Russian key independent military contractor that has played a significant role in the ongoing Russia-Ukraine territorial conflict voiced displeasure with Russia’s top leadership in handling the Russia-Ukraine situation, took over two Russian cities and order his mercenaries to march towards Moscow on Saturday.
Russia’s weekend mutiny started fast and ended fast
Upon reaching 200 km within Moscow, Prigozhin’s troops halted and made a U-turn back to their field camps. In addition, Putin dropped earlier treason charges on the Wagner Group and allowed Prigozhin to head to Belarus, Russia’s western neighbour for exile.
In less than 48 hours, the mutiny in Russia is over without any clear details on what has transpired that led to Prigozhin’s retreat as Putin has not made any official speech or press conference yet. US Secretary of State Blinken commented that the weekend’s uprising by Prigozhin, a former Putin royalist has posed a direct challenge to Putin’s grip on power in Russia and provided a battlefield advantage to Ukraine.
On the other hand, several geopolitical commenters have analyzed the situation to be in favour of Putin in which Wagner Group’s mutiny may be used as a cover for Putin to remove the top brass in Russia’s Ministry of Defence; Shoigu, the defence minister and Gerasimov, chief of the general staff as they posed a threat to Putin’s rule. Thus, the change of Russia’s military leadership may be part of the “deal” package that the Kremlin and Prigozhin agreed on.
No significant movements in markets but watch gold
In today’s Asian session, both the S&P 500 and Nasdaq 100 e-mini futures were up slightly by around +0.20% after posting their worst weekly losses last week in three months. Major Asian stock indices were mixed at this time of the writing, Nikkei 225 (-0.24%), Kospi 200 (+0.60%), Hang Seng Index (-0.14%), Hang Seng China Enterprises Index (+0.13%), and CSI 300 (-0.70%).
The US dollar is almost unchanged on average with the US Dollar Index inching down by a meagre -0.1%. Gold, a traditional safe haven asset that tends to benefit in light of major geopolitical risks upheaval in the past has exhibited some interesting price actions movement from a technical analysis perspective.
Gold’s decline has managed to bounce off from a key support zone of US$1,913/1,896 per ounce
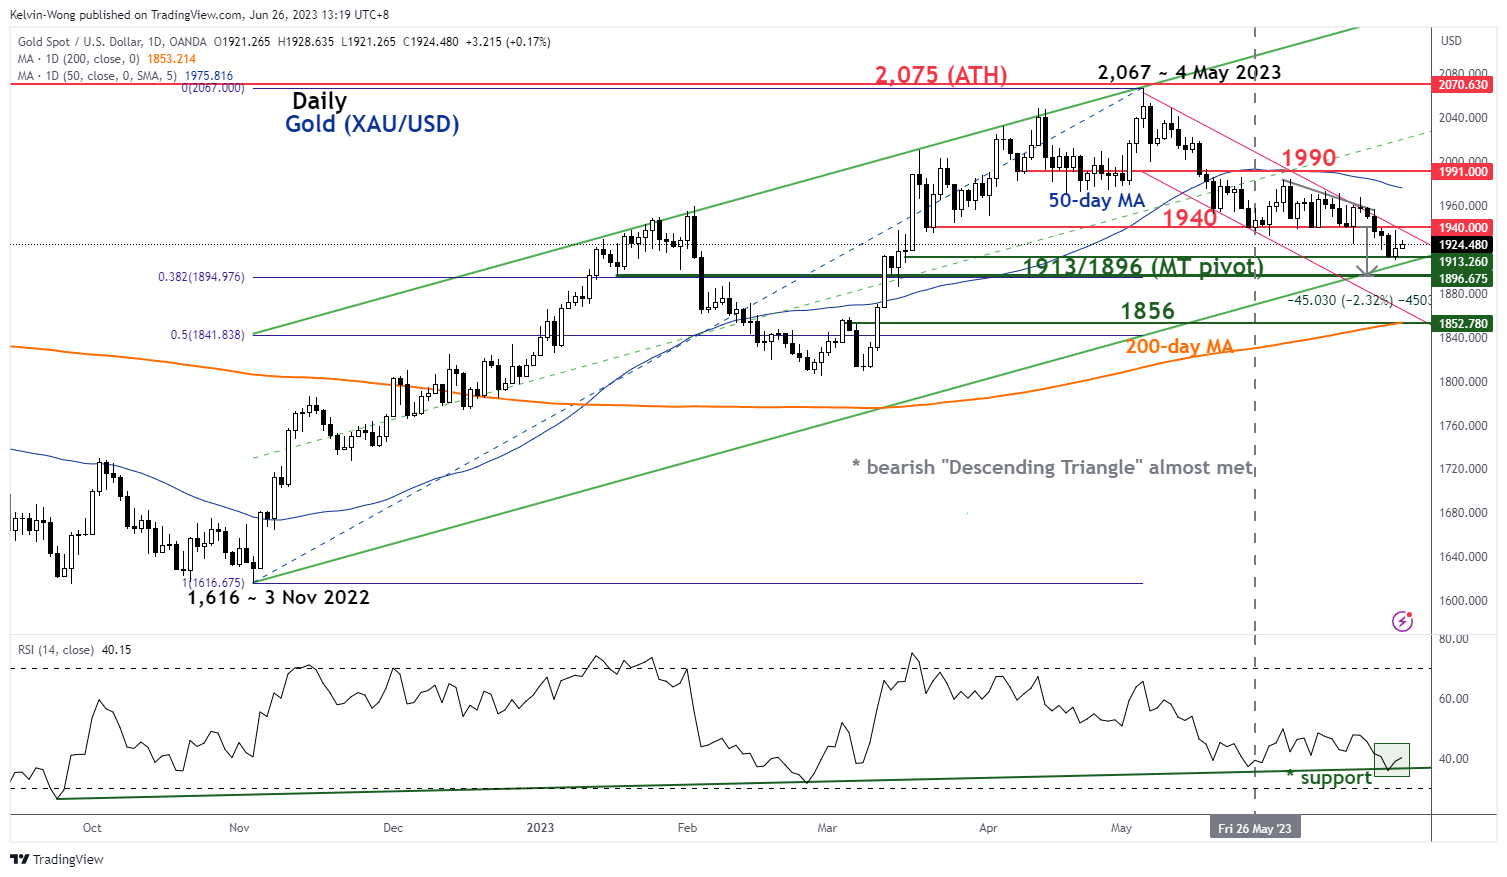
Fig 1: Gold (XAU/USD) medium-term trend as of 26 Jun 2023 (Source: TradingView, click to enlarge chart)
Last week’s decline seen in Gold (XAU/USD) has led its price actions to hit a crucial medium-term pivotal support zone of US$1,913/US$ 1,896 per ounce (printed an intraday low of US$1,910 last Friday, 23 June) which is being defined by a confluence of elements; the lower boundary of the medium-term ascending channel in place since 3 November 2022 low, 38.2% Fibonacci retracement of the prior medium-term up move from 3 November 2022 low to 4 May 2023 high, and approximately the downside price objective of recent “Descending Triangle” bearish breakdown.
Momentum has also improved as the daily RSI oscillator has managed to stage a bounce off the key corresponding support at the 36 level. Watch the US$1,896 key medium-term pivotal support and a clearance above US1,940 intermediate resistance sees the next resistance coming in at US$1,990 (also the 50-day moving average).
FX verbal intervention from Japan
After a strong upside movement seen in the USD/JPY that recorded a weekly gain of +1.3% last week which outperformed other major USD crosses, the US Dollar Index only rose by +0.56% over the same period, Japan’s Vice Finance Minister Masato Kanda, a top currency official that has oversight over foreign exchange market matters has sounded the alarm in today’s morning Asian session.
Based on a Reuters report, Kanda said that the authorities will respond to any excessive moves in the foreign exchange market, warned that the recent yen moves were rapid and will not rule out any chance of an FX intervention.
He said, “Regardless of the direction, it’s generally not good for the economy if exchange rates move excessively in a way that deviates from economic fundamentals.” Today’s verbal intervention was the most pronounced made by any of Japan’s finance ministry officials in the past month when USD/JPY sailed past the prior 141.00 and 142.00 psychological levels “effortlessly”.
USD/JPY has shed -0.2% intraday and broke key near-term support at 143.45 at this time of the writing, the next support to watch will be at 142.50/25 (former swing highs of 11/21/22 November 2022).
Fed’s annual banks stress test results out on Wednesday
The US Federal Reserve will unveil the results of its annual stress tests on the 23 biggest US banks on Wednesday, 28 June. The key focus will be on a section of the test, labelled as “exploratory market shock”, this is the first time such a test is being conducted on the trading books of the largest US banks.
The urgency and significance of the “exploratory market shock” stress test come after the US regional banks’ turmoil. Hence, monitoring of fixed income duration risk is paramount now given that the latest Fed’s hawkish monetary policy guidance is to keep interest rates higher for a longer period.
Last week, the US banking stocks shed by -6.80% as indicated by the SPDR S&P Bank exchange-traded fund, its worse weekly performance in seven weeks and underperformed the S&P 500.
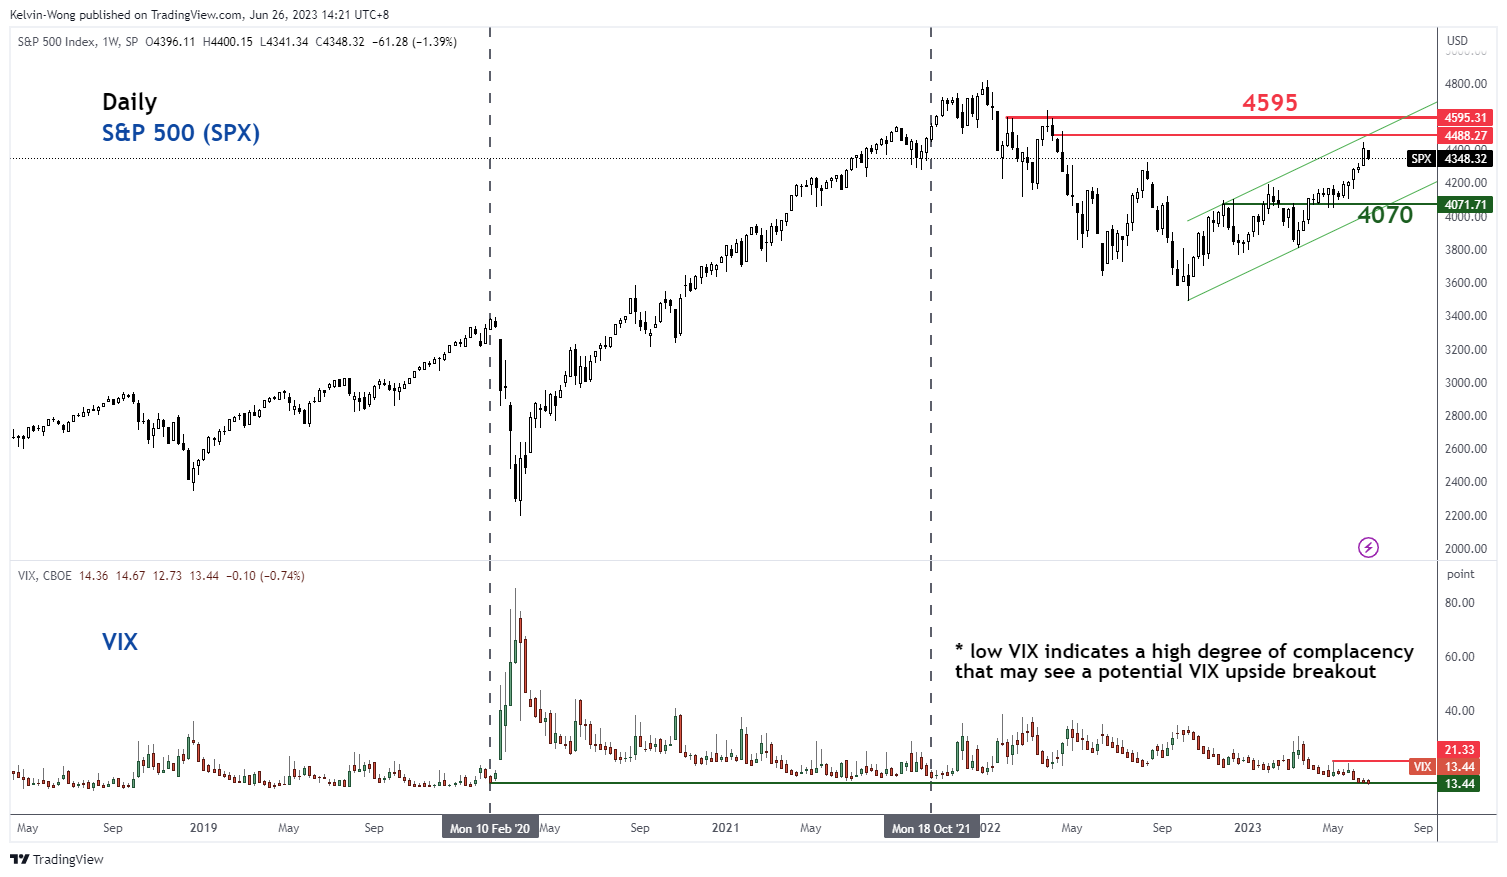
Fig 2: S&P 500 major trend with VIX as of 26 Jun 2023 (Source: TradingView, click to enlarge chart)
If the “exploratory market shock” stress test results come in unfavourable, it may put more downside pressure on US banking stocks which in turn may trigger a volatility upside breakout in the VIX, a measurement of implied volatility on the S&P 500 as it has compressed to a low level of 13.44 not seen since early February 2020 before the pandemic. A sudden spike in VIX may dampen the current bullish mood for US stock indices.
EUR Pulls Back
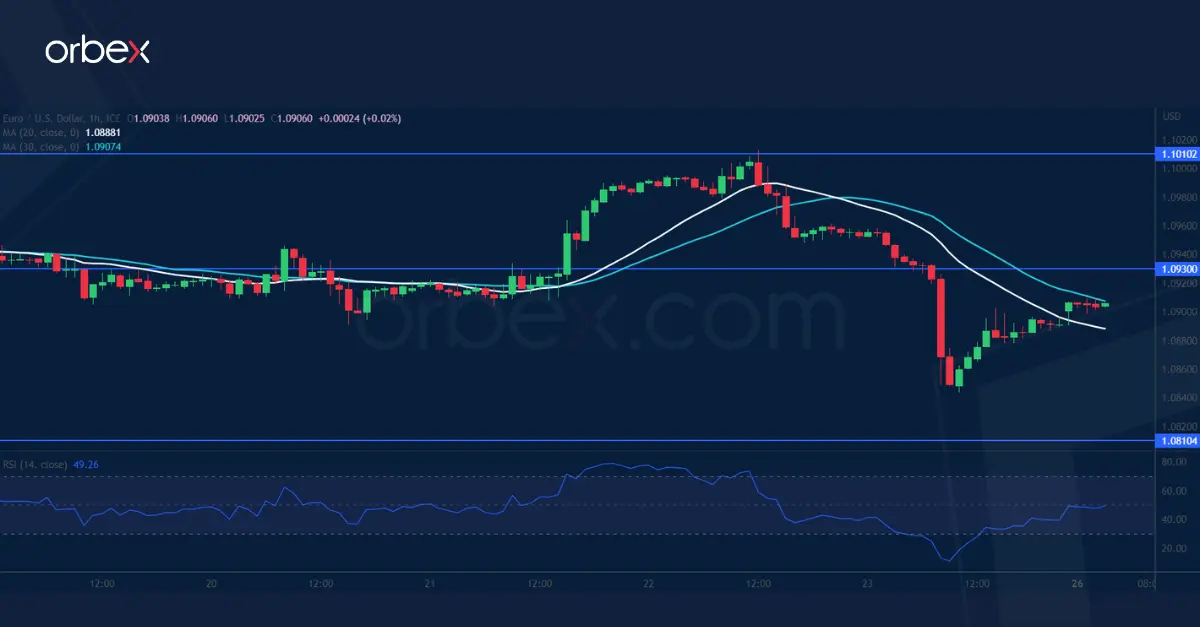
EUR/USD probes support
The euro fell after lacklustre PMI showed a manufacturing recession. The rally first came to a halt in the supply zone around 1.1010 from the early May sell-off and a subsequent tumble below 1.0900 indicates a lack of follow-through bids, prompting more buyers to close their positions. 1.0810 on the bullish MA cross on the daily chart is a major level to gauge the bulls’ commitment. A close above the fresh resistance of 1.0930 is necessary to ease the selling pressure. Otherwise, a correction might send the euro to 1.0700.
XAG/USD struggles to recover
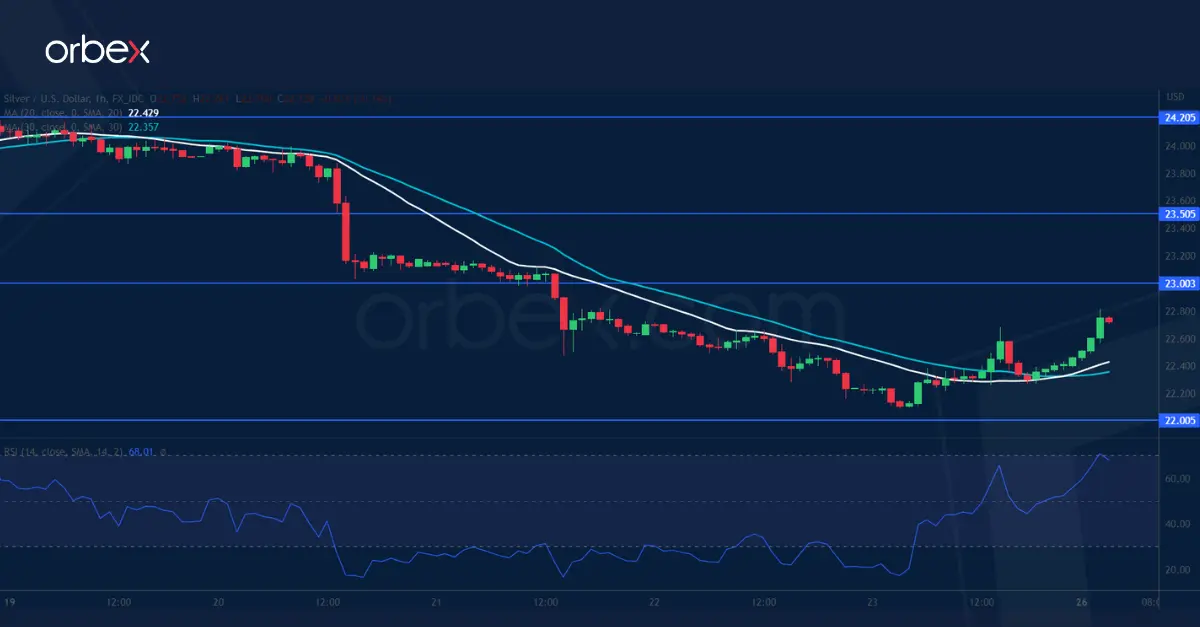
Silver slips in the wake of hawkish comments by Fed officials. The precious metal continues lower after it invalidated this month’s rebound by breaking below the daily support of 22.70. The round number of 22.00 is a key level where buying interests have shown up again as the RSI rises back from the oversold area. 23.00 from the previous demand zone is a key resistance where the bears could be eager to fade a rebound after sentiment turned downbeat. 23.45 would be a second layer of resistance in case of a breakout.
DAX 40 grinds key support
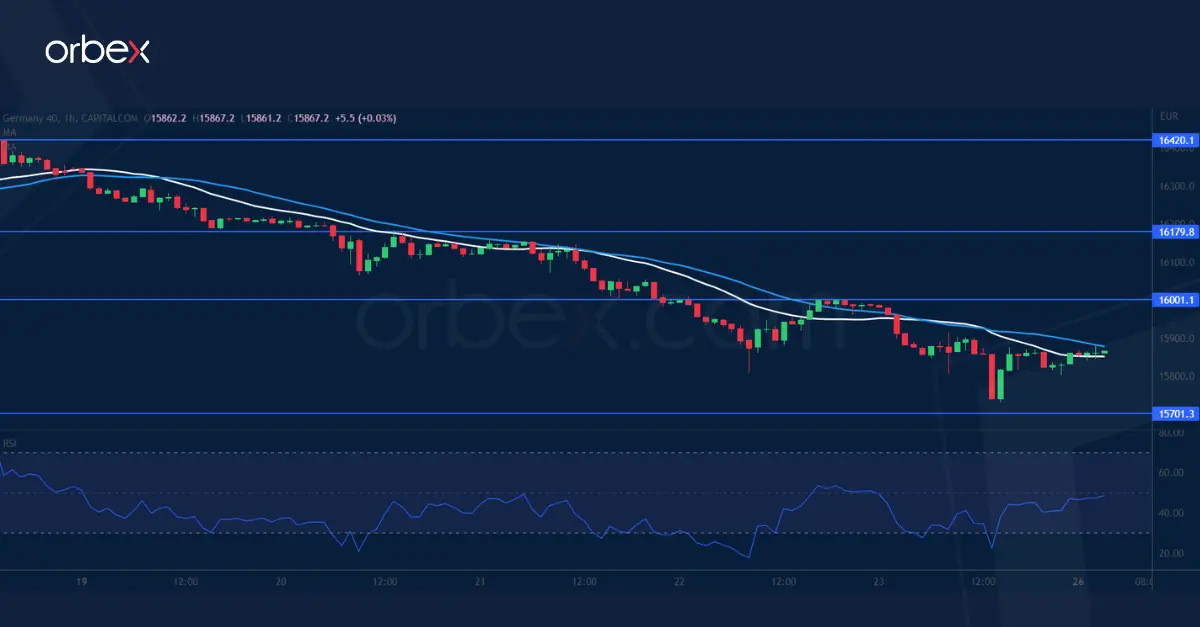
The Dax 40 weakens over concerns of protracted tightening cycles by major central banks. A break below the lower band (15900) of a previous consolidation range has dented the market mood. Then a brief bounce came under pressure at the psychological level of 16000, which is a sign of a strong bearish cap. The daily support of 15700 at the base of the June rally is a critical floor to keep the index afloat as its breach could trigger a correction towards 15200. 16000 is the first hurdle to lift to help the bulls regain confidence.
USD/CAD Daily Outlook
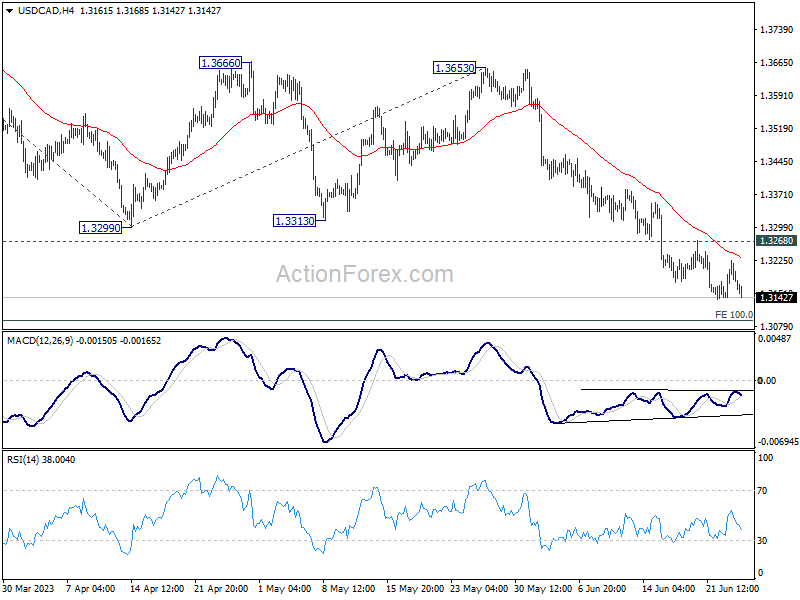
Daily Pivots: (S1) 1.3141; (P) 1.3183; (R1) 1.3224; More....
Further decline is expected in USD/CAD with 1.3268 resistance intact. Current fall from 1.3653 should target 100% projection of 1.3860 to 1.3299 from 1.3653 at 1.3092. Decisive break there will target 161.8% projection at 1.2745. On the upside, however, break of 1.3268 resistance should now indicate short term bottoming, and turn bias back to the upside for rebound.
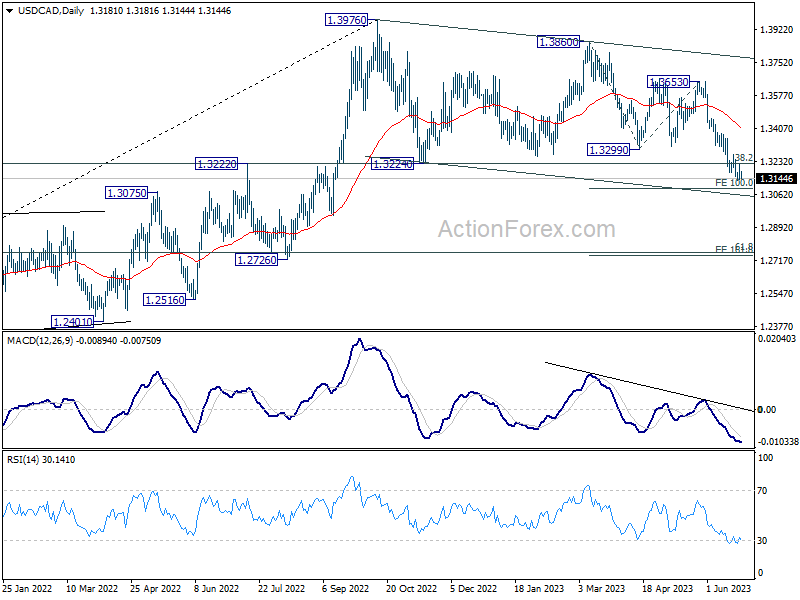
In the bigger picture, price actions from 1.3976 are still viewed as a correction to up trend from 1.2005 (2021 low), but chance of trend reversal is increasing with current decline. In either case, sustained trading below 38.2% retracement of 1.2005 to 1.3976 at 1.3233 will pave the way to 61.8% retracement at 1.2758. Risk will stay on the downside as long as 1.3299 support turned resistance holds, even in case of strong rebound.
Markets Staying in Tight Range, Inflation and Sentiment Data to Highlight the Week
The financial markets are rather steady in Asian session today, showing little reaction to the brief "uprising" in Russia. Major indexes generally traded in tight range, with the exception of China which is just catching up the holidays on Thursday and Friday. In the currency markets, Aussie is the worst performer for now, followed by Kiwi by a distant. Yen is the stronger one, followed by Canadian. But overall, other than a few Aussie pairs, major pairs and crosses are bounded inside Friday's range.
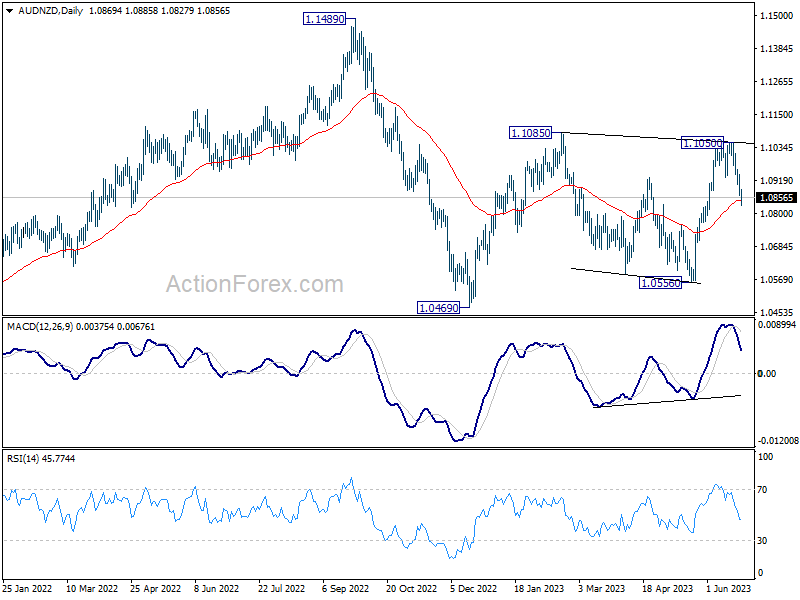
Technically, AUD/NZD's decline from 1.1050 extended lower today and it's now pressing 55 D EMA (now at 1.0846). Sustained trading below the EMA would pave the way down towards 1.0556 support. For now, break of 1.0469 is not envisaged unless further downside acceleration is seen. However, if this scenario does come to fruition, a deeper fall in AUD/NZD could potentially hinder the recovery of Aussie elsewhere.
In Asia, Nikkei closed down -0.25%. Hong Kong HSI is down -0.40%. China Shanghai SSE is down -1.51%. Singapore Strait Times is up 0.02%. Japan 10-year JGB yield is down further by -0.126 at 0.359.
Japan's top officials voice concern over 'rapid and one-sided' yen moves
In the face of Yen's swift depreciation, top Japanese currency diplomat Masato Kanda expressed concern on Monday, describing the recent changes as "rapid and one-sided. He added that "We have all options available and we are not ruling out any options."
Kanda, Vice Finance Minister for International Affairs, however, refrained from using the phrase "decisive action," a term he used before Japan intervened in the currency market last year. This careful choice of words suggests that while officials are monitoring the situation, they may not be ready to step in just yet.
Adding to this sentiment, Finance Minister Shunichi Suzuki highlighted the ongoing vigilance of the government, stating that "we will continue to watch the forex market with a sense of urgency."
In keeping with this sense of readiness, Suzuki assured that authorities would respond "appropriately" to any excessive currency swings, indicating that the government is primed to intervene if necessary.
BoJ opinions: Persistent monetary easing stance upheld, first call YCC Debate
Summary of opinions from BoJ Monetary Policy Meeting on June 15-16 shed light on the prevailing sentiment among policymakers regarding the nation's current monetary easing stance.
Among the opinions expressed, there was an evident call for maintaining the current monetary easing policy to support rising wage growth, which was described as "the highest in around 30 years."
Board members noted, "In order to achieve the price stability target of 2 percent in a sustainable and stable manner, price rises accompanied by wage increases, rather than those caused by cost-push factors, are necessary."
The Bank was thus urged to "keep supporting such momentum for wage hikes through continuation of the current monetary easing."
Significantly, there was a focus on the potential risks associated with premature policy revisions. It was stated, "It would be premature to revise monetary policy if it would hinder such developments," referring to increasing wage and investment willingness among small and medium-sized firms.
Policymakers also warned against a "hasty policy change" that could miss the chance to achieve the price stability target.
However, one board member signaled a notable dissent, explicitly calling for an early discussion about tweaking the BoJ's yield curve control (YCC) - a tool for monetary easing.
This marked the first time a BOJ summary displayed a member's open expression for an early debate on modifying the YCC, hinting at possible future shifts in the Bank's policy discussions.
SNB: Monetary policy isn't tight enough to anchor price stability
In a radio interview with public broadcaster SRF, SNB President Thomas Jordan subtly hinted at the potential need for a tighter monetary policy. This comes on the heels of the Swiss central bank's recent interest rate hike, which saw an increase of 25 basis points to 1.75% last Thursday.
Interpreting SNB's inflation forecasts, Jordan said, "If you look at our inflation forecasts and interpret them correctly, then you'll see that from today's perspective monetary policy possibly isn't tight enough to anchor price stability."
Acknowledging the inevitable, Jordan added, "We can't completely prevent second-round effects — that would be an illusion — but we have to fight them." These second-round effects typically refer to changes in wages and prices in response to initial inflationary shocks, underlining the broader impact of inflation on the economy.
Inflation figures and sentiment data: Main attractions for final week of H1
As we approach the final week of the first half of the year, markets will be keenly watching a deluge of consumer inflation data that will likely dictate future monetary tightening policies. Core PCE figures from US, Eurozone's CPI flash estimate, and CPI from both Canada and Australia stand out as key barometers that their respective central banks will use to gauge the needed extent of further monetary tightening.
Additionally, the pulse of consumer and business sentiment will also come under scrutiny, with US consumer confidence, Germany's Ifo business climate index, and New Zealand's ANZ business confidence all on the docket. Moreover, PMI figures from China are set to offer insights into the country's recovery trajectory and could provoke volatility in Asian and commodity markets.
Here are some highlights for the week:
- Monday: BoJ summary of opinions, Japan corporate services prices; Germany Ifo business climate.
- Tuesday: Canada CPI; US durable goods orders, house price index, consumer confidence, new home sales.
- Wednesday: Australia monthly CPI; Germany Gfk consumer sentiment; Eurozone M3 money supply; Swiss Credit Suisse economic expectations; US goods trade balance.
- Thursday: Japan retail sales, consumer confidence; New Zealand ANZ business confidence; Australia retail sales; Germany CPI flash; Eurozone monthly bulletin; UK M4 money supply, mortgage approvals; US GDP final, jobless claims, pending home sales.
- Friday: Japan Tokyo CPI, unemployment rate, industrial production, housing starts; Australia private sector credit; China PMIs; Germany import prices, retail sales; UK current account, GDP final; Swiss retail sales, KOF economic barometer; France consumer spending; Germany unemployment; Eurozone CPI flash, unemployment rate; Canada GDP, US personal income and spending and PCE price index, Chicago PMI.
USD/CAD Daily Outlook
Daily Pivots: (S1) 1.3141; (P) 1.3183; (R1) 1.3224; More....
Further decline is expected in USD/CAD with 1.3268 resistance intact. Current fall from 1.3653 should target 100% projection of 1.3860 to 1.3299 from 1.3653 at 1.3092. Decisive break there will target 161.8% projection at 1.2745. On the upside, however, break of 1.3268 resistance should now indicate short term bottoming, and turn bias back to the upside for rebound.
In the bigger picture, price actions from 1.3976 are still viewed as a correction to up trend from 1.2005 (2021 low), but chance of trend reversal is increasing with current decline. In either case, sustained trading below 38.2% retracement of 1.2005 to 1.3976 at 1.3233 will pave the way to 61.8% retracement at 1.2758. Risk will stay on the downside as long as 1.3299 support turned resistance holds, even in case of strong rebound.
Economic Indicators Update
| GMT | Ccy | Events | Actual | Forecast | Previous | Revised |
|---|---|---|---|---|---|---|
| 23:50 | JPY | Corporate Service Price Index Y/Y May | 1.60% | 1.80% | 1.60% | |
| 23:50 | JPY | BoJ Summary of Opinions | ||||
| 08:00 | EUR | Germany IFO Business Climate Jun | 91.2 | 91.7 | ||
| 08:00 | EUR | Germany IFO Current Assessment Jun | 93.5 | 94.8 | ||
| 08:00 | EUR | Germany IFO Expectations Jun | 88 | 88.6 |
Asian Trading Shows Little Impact of Insurrection
Markets
Core bonds ended last week on a solid footing. German Bunds outperformed US Treasuries in more of a one-off reset after very weak French PMI’s. German yields fell by 10 bps to 15 bps with the belly of the curve outperforming the wings. US Treasuries lost 5 to 6 bps across the curve. Risk sentiment took a hit with main European and US equity indices losing 0.5% to 1%. The dollar profited in this environment, with the trade-weighted (DXY) index closing at 103.16 from a start at 102.38. EUR/USD set an intraday low at 1.0845, but the single currency turned more resilient in the end, managing a close at 1.0894 (from 1.0956). EUR/GBP followed the intraday trading pattern of EUR/USD with an intraday low at 0.8536 and a close at 0.8567.
The Russian uprising dominated headlines this weekend. The mutiny of the Wagner Group already ended following a deal with Moscow, but the episode highlights Russian instability and suggests signs of weakness. Asian trading shows little impact of insurrection though. Today’s eco calendar is rather light, giving little guidance for trading. Friday’s market direction is the likely way, if any, to follow. June German Ifo Business Climate is the sole data point, but is normally a reflection of the earlier published PMI. The German composite PMI unexpectedly declined from 53.9 to 50.8 with the manufacturing recession deepening (41 from 43.2) and with the services sector losing momentum (54.1 from 57.2). The US Treasury starts its end-of-month refinancing operation with a $42bn 2-yr Note auction. We expect it to go well given the yield increase of the past month even as the US Treasury is in full replenishing mode following the debt ceiling deal. The ECB’s annual forum starts in Sintra, which will result in an avalanche of central bank speakers. A panel discussion with ECB Lagarde, Fed Powell, BoE Bailey and BoJ Ueda on Wednesday is the key event. European and Japanese inflation numbers on Thursday and on Friday are this week’s other key events.
News Headlines
Rating agency Fitch on Friday affirmed Hungary’s BBB rating with a negative outlook. The country’s ratings are supported by strong structural indicators relative to BBB peers, economic growth fueled by investments and solid net FDI inflows. These positives are balanced against a high public debt, unorthodox fiscal and monetary policy moves and worsening governance indicators. The negative outlook reflects risks around the credibility of macroeconomic policy. Fitch mentions, amongst others, the cost of energy support measures, the regulatory burden of windfall taxes and high inflation despite (ineffective) price caps. The external position improved substantially due to lower cost of energy imports, but energy dependence on Russia is still seen an important risk. Fitch expects Hungary to reach an agreement European Union on EU funds the but timing and size remain uncertain. The agency sees Hungarian growth stagnating in 2023 as domestic demand will contract. Growth in 2024/25 is expected to average 3% again. Inflation is expected to ease to 8-10% by the end of this year and to average 5.1% next year and 3.1% in 2025. The budget deficit is expected to narrow to 4.1% this year and 2.9% in 2024.
Minutes of the June Bank of Japan meeting showed one policy member calling for an early revision of Yield Curve Control (YCC). According to the member, the BOJ should maintain its overall framework of monetary easing, but a revision to the treatment of YCC should be discussed at an early stage as the cost of YCC is high taking into account factors as preventing sharp fluctuations in interest rates in the future phase of an exit from the current policy, in terms of improvement in market functioning, and enabling smoother dialogue with market participants. While representing a minority within the MPC, markets will look out for more signals/comments on a potential tweak in the YCC in the run-up to the next BoJ meeting on July 28. In the meantime, persistent yen weakness again caused Japan’s vice finance minister for international affairs, Masato Kanda, to warn on rapid and one-sided moves in the yen. With regard to potential interventions, Kanda said that all options are available and the government isn’t ruling out any option. Finance Minister Suzuki said authorities will respond appropriate to excessive FX moves.
Slow Start Following an Eventful Weekend
The weekend was eventful with the unexpected rebellion of the Wagner Group against the Kremlin. Yevgeny Prigozhin’s men, who fight for Putin in the deadliest battles in Ukraine walked towards Moscow this weekend as Prigozhin accused the Kremlin of not providing enough arms to his troops. But suddenly, Prigozhin called off the attack following an agreement brokered by Belarus and agreed to go into exile. The Kremlin took back control of the situation, but we haven’t seen Vladimit Putin, or Prigozhin talk since then. The Wagner incident may have exposed Putin’s weakness, and was the most serious threat to his rule in two decades. It could be a turning point in the war in Ukraine. But nothing is more unsure. According to Volodymyr Zelensky, there are no indications that Wagner fighters are retreating from the battlefield.
The first reaction of the financial markets to Wagner’s mini coup was relatively calm. Gold for example, which is a good indication of market stress at this kind of moment, remained flat, and even sold into the $1930 level. The dollar-swissy moved little near the 90 cents level. Crude oil was offered into the $70pb level, as nat gas futures jumped more than 2% at the weekly open, and specific stocks like United Co. Rusal International, a Russian aluminum producer that trades in Hong Kong, gapped lower at the open but recovered losses.
Equities in Asia were mostly under pressure from last week’s selloff in the US, while US futures ticked higher and are slightly positive at the time of writing.
The Wagner incident will likely remain broadly ignored by investors, unless there are fresh developments that could change the course of the war in Ukraine. Until then, markets will be back to business as usual. There is nothing much on today’s economic calendar, but the rest of the week will be busy with a series of inflation reports from Canada, Australia, Europe, the US, and Japan.
Except for Japan, where the Bank of Japan (BoJ) doesn’t seem urged to hike the rates, higher-than-expected inflation figures could further fuel the hawkish central bank expectations and add to the weakening appetite in risk assets.
The Federal Reserve (Fed) will carry its annual bank stress test this week, to see how many more rate hikes the baking sector could take in and the potential for changes in capital requirements down the road. The big banks are likely not very vulnerable to higher capital requirements, yet the profitability of the US regional banks could be at jeopardy and that could cause investors to remain skeptical regarding the US banking stocks altogether. Invesco’s KBW bank ETF slipped below its 50-DMA, following recovery in May on the back of decidedly aggressive Fed to continue hiking rates, and stricter requirements could further weigh on appetite.
Zooming out, the S&P500 is down by more than 2% since this month’s peak, Nasdaq 100 lost more than 3% while Europe’s Stoxx 600 dipped 3.70% between mid-June and now on the back of growing signs that the aggressive central bank rate hikes are finally slowing economic activity around the world. A series of PMI data released last Friday showed that activity in euro area’s biggest economies fell to a 5-month low as manufacturing contracted faster and services grew slower than expected. The EURUSD tipped a toe below its 50-DMA last Friday but found buyers below this level. Weak data weakens the European Central Bank (ECB) expectations, but that could easily reverse with a strong inflation read given that the ECB is ready to induce more pain on the Eurozone economy to fight inflation.
Across the Channel, the picture isn’t necessarily better. Both services and manufacturing came in softer than expected. And despite the positive surprise on the retail sales front, retail sales in Britain slumped more than 2% in May, due to the rising cost of living that led the Brits back from loosening their purse string. One thing though. UK’s largest lenders agreed to give borrowers a 12-month grace period if they missed their mortgage payments as a result of whopping costs of keeping their mortgages due to the aggressively rising interest rates. Unless an accident – in real estate for example, the Bank of England (BoE) will continue hiking the rates and reach a peak rate of 6.25% by December. The only way to slow down the pace of hikes is to find a solution to the sticky inflation problem. And because the BoE has limited influence on prices, Jeremy Hunt will meet industry regulatory this week to discuss how they could prevent companies from taking advantage of inflation and raising prices more than needed, which adds to inflationary pressures through what we call ‘greeflation’. But until he finds a solution, the BoE has no choice but to keep hiking and the UK’s 2-year gilt yield has further to run higher, whereas the widening gap between the 2 and 10-year yield hints at growing odds of recession in the UK, which should also prevent the pound from gaining strength on the back of hawkish BoE. Cable will more likely end up going back to 1.25, than extending gains to 1.30.
Geopolitics is Back on the Agenda
Market movers today
Today IFO figures will give further perspective on the German slowdown in June indicated by PMIs on Friday. It will be interesting to see if they are as weak.
We will also be listening in to ECB president Lagarde's speech on the ECB Forum on Central Banking in Sintra tonight.
Through the remainder of the week, the Riksbank meeting and euro area inflation data will be in markets' focus.
We will also keep an eye on the situation in Russia, following the dramatic events over the weekend.
The 60 second overview
Russia: Over the weekend, all eyes were on Russia where an armed mutiny against the country's military leadership instigated by Wagner group leader, Yevgeny Prigozhin, took place. Prigozhin and his troops started a 'march of justice' towards Moscow after easily seizing control of a southern city Rostov-on-Don early Saturday morning. President Putin threatened Wagner with a criminal charge for treason and announced tightening of legislation against those breaking martial law. As Prigozhin and his troops quickly advanced towards Moscow, the city was preparing to fence itself from the attack. However, eventually, the revolt was over in less than 24 hours when Prigozhin announced he had accepted conditions of a deal brokered by Belarusian President Lukashenko. As part of the deal, he would move to Belarus and all charges against him would be dropped. Overall, many open questions remain regarding Prigozhin's motivations and objectives. It is unclear what has been agreed exactly and what will happen to Wagner group going forward. It is clear geopolitical risk has again raised its head and that Russia has become very unstable. We stress that the situation remains fluid. Yet, here is our best effort to understand what is going on: Geopolitical radar - Making sense of what is happening in Russia, 26 June.
Market sentiment: Asian markets mostly shrugged off geopolitical concerns and risk sentiment remains resilient ahead of the European markets opening. Euro is slightly stronger against the dollar and stock market futures are mixed, while gold and oil prices are only marginally higher. It is possible markets largely ignore the events in Russia at this point as it is still so unclear what really happened and at least the most chaotic scenario of Russia spiralling into a civil war has been avoided for now. However, we think geopolitical risks are now very much back on the agenda, and we highlight that rising instability in Russia could have very severe implications for Europe.
PMIs: Euro area June PMIs came in much weaker than expected on Friday as particularly service sector activity took a hit. Also, sub-indices showed both input and output prices declined despite the still persistent wage pressures in the service industry, which is good news for the ECB. The weak PMI prints are a surprise considering the otherwise solid macro data during the first half of the year. They could signal that higher interest rates are starting to pass through to consumption, particularly as savings buffers are gradually eroded. In the US, manufacturing PMI also surprised to the downside, but overall, the composite indicator held up above the 50 level, indicating economic growth.
Equities: Global equities ended lower on Friday across countries and regions. Defensives were outperforming but considering past period with strong cyclical outperformance, we find it surprising that defensives were not able to make a more solid outperformance. Banks and financials performing in line with market and hence investors were not increasing the recession fear but rather readjusting for higher for longer or a soft version of stagflation. We would have expected that markets had paid more attention to the very weak PMI prints. In the US, Dow -0.6%, S&P 500 -0.8%, Nasdaq -1.0% and Russell 2000 -1.4%. Asian markets are mixed this morning while European and US futures slightly stronger.
FI: On Friday, the weak European PMI set the stage for a significant rally with the 2y Germany declining 10bp to 3.1% and slightly more in the 5 to 10y area. The German curves continue to hover around the lows since 1992. Markets also repriced the front end ECB peak 5bp lower just below 4%. Through June, markets have added a full 25bp rate hike to the peak policy rate. Furthermore the 'higher-for-longer' narrative has pushed the point of policy rate cut further out, see also our discussion here: COTW: EUR liquidity tightening, kicking the can and higher for longer, 23 June.
FX: EUR/USD fell well below 1.09 on Friday following weak Eurozone PMIs. EUR/NOK recovery on Friday after the brief drop induced by Norges Bank's big rate hike on Thursday. USD/JPY ignored a drop in 10Y US yield and oil prices and rose close to 144.
Credit: Soft PMI data sent credit markets into risk-off mode on Friday, despite a rally in underlying rates. Itrax main widened 1.5bp to close at 78.9bp and Itrax Xover widened 9.6bp to close at 417.6bp. The Xover close was the widest level in around three weeks. Primary markets were relatively quiet on Friday.
Technical Outlook and Review
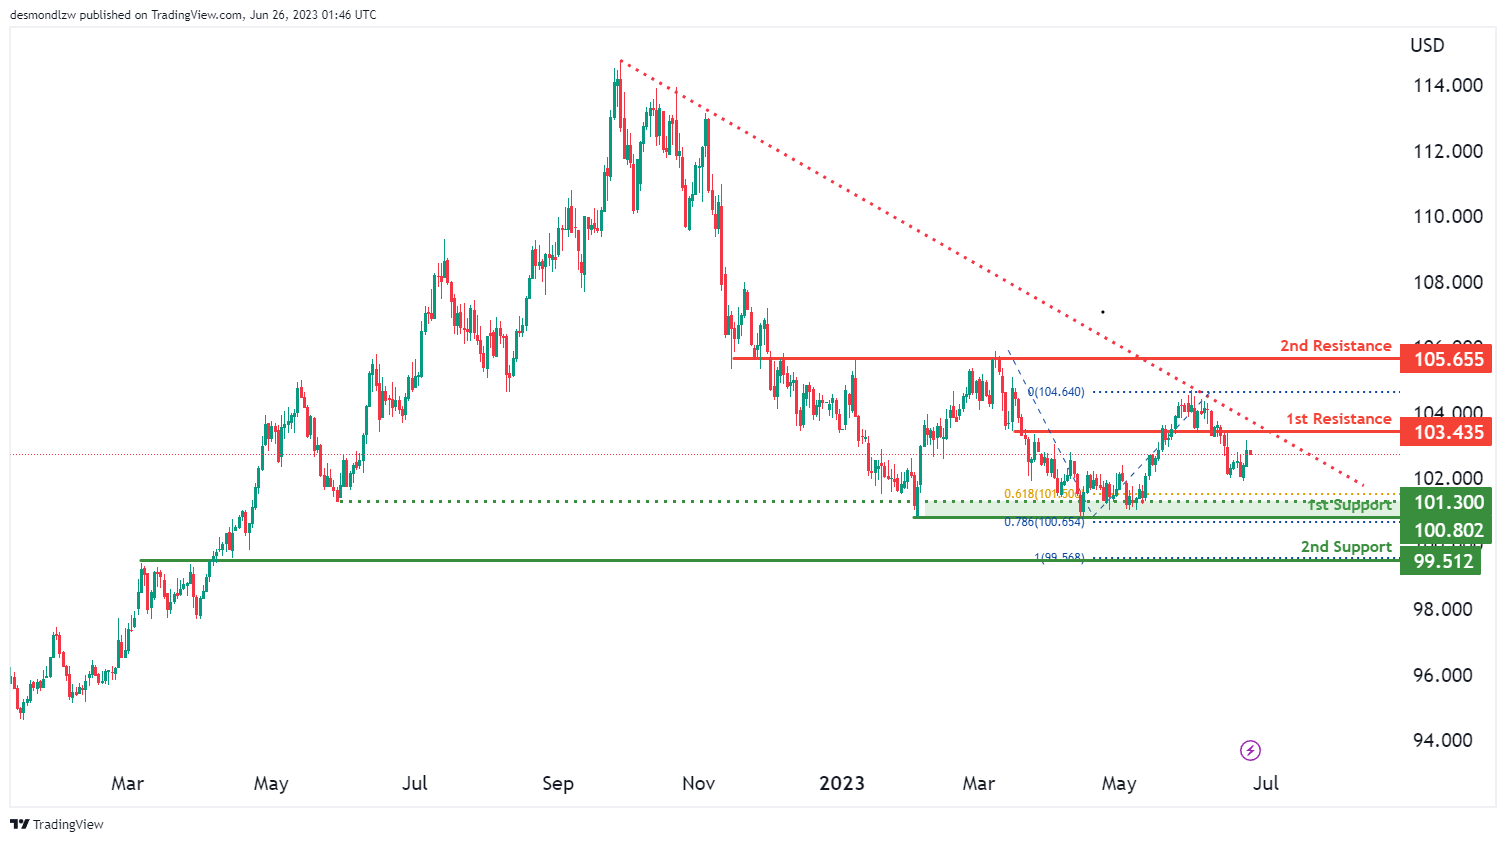
DXY:
The DXY (US Dollar Index) chart demonstrates a bearish momentum, indicated by the price being below a major descending trend line, suggesting the potential for continued downward movement.
The price has the potential to experience a bearish reaction off the 1st resistance level at 103.43, which is an overlap resistance. This level may trigger a bearish response, leading to a drop towards the 1st support level at 100.80.
The 1st support at 100.80 is significant as it represents a multi-swing low support and is reinforced by the 78.60% Fibonacci Projection. Additionally, the 2nd support at 99.51 acts as an overlap support, further strengthening the support zone.
Conversely, the 1st resistance at 103.43 is an overlap resistance that could hinder upward movement. Similarly, the 2nd resistance at 105.65 serves as another overlap resistance, further emphasizing its importance in restricting further upward price movement.
Additionally, there is an intermediate support level at 101.30, which adds to the potential support for the price.
EUR/USD:
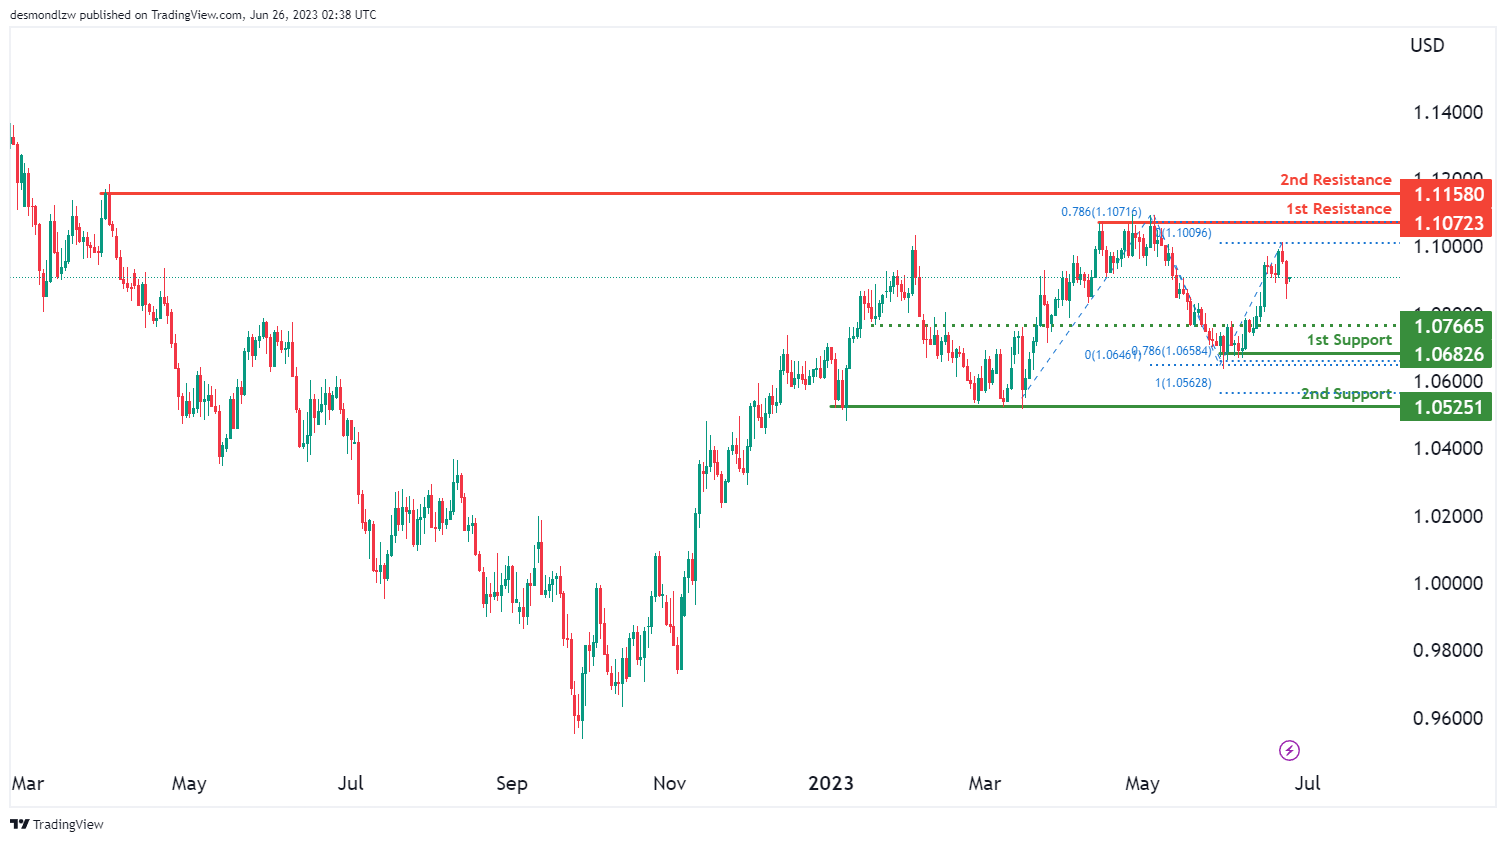
The overall momentum of the EUR/USD chart is currently neutral, indicating a lack of clear direction in the market.
There is a potential for price to fluctuate between the 1st support level at 1.0682, which is characterized as a multi-swing low support and reinforced by the presence of the 78.60% Fibonacci Projection, and the 1st resistance level at 1.1072, representing a multi-swing high resistance and coinciding with the 78.60% Fibonacci Retracement.
Additionally, the 2nd support level at 1.0525 acts as another multi-swing low support, providing further significance to the support zone. On the upside, the 2nd resistance level at 1.1158 acts as a swing high resistance, potentially impeding upward price movement.
Furthermore, an intermediate support level at 1.0766 is recognized as a pullback support, contributing to the overall support structure.
GBP/USD:
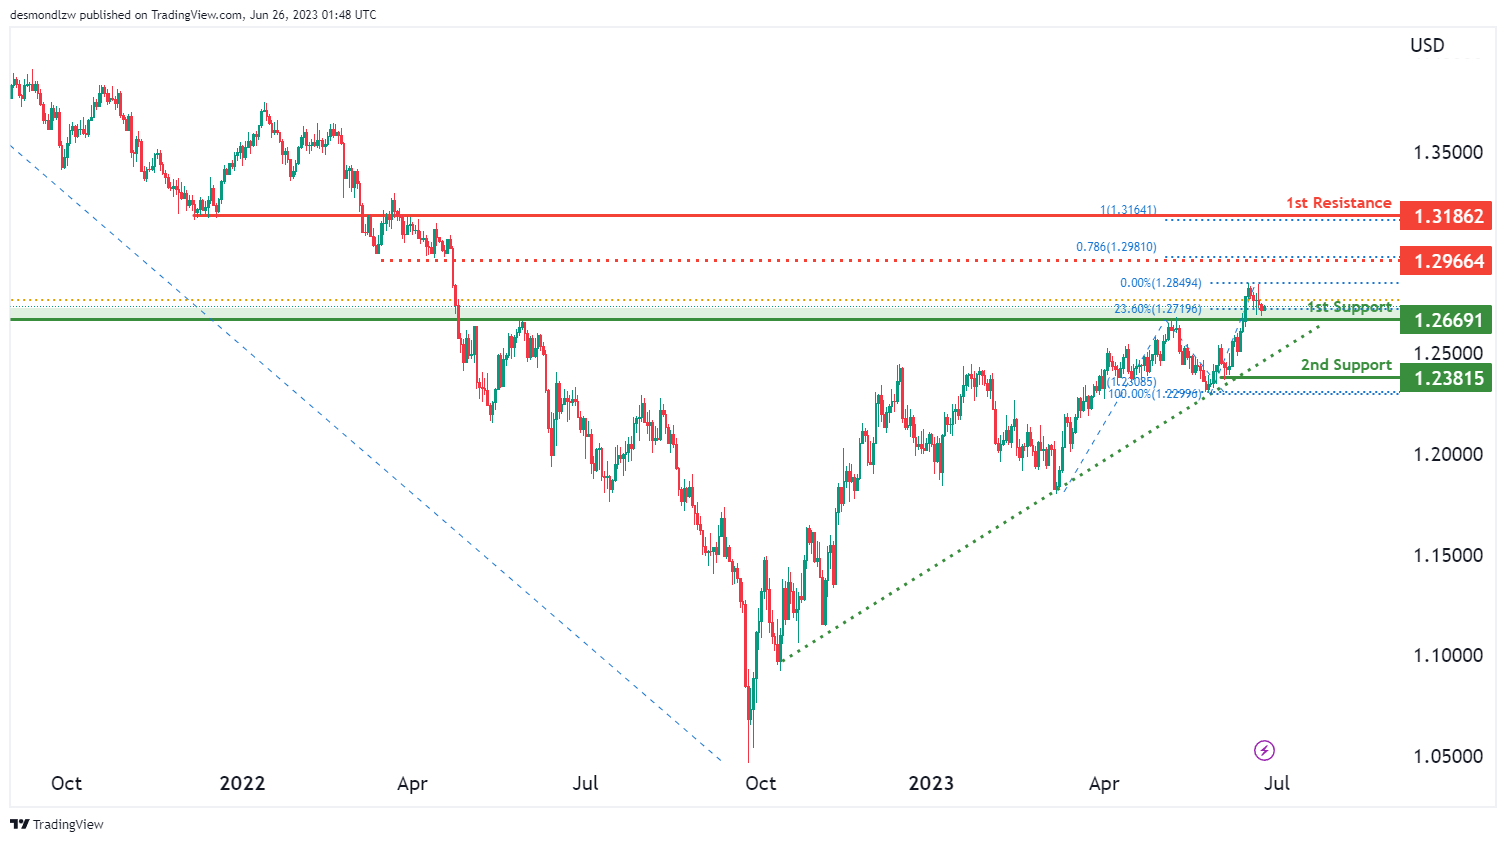
The GBP/USD chart exhibits a bullish momentum, supported by the fact that the price is positioned above a major ascending trend line, indicating potential for further upward movement.
There is a possibility of a bullish bounce off the 1st support level at 1.2669, which is considered a pullback support and further reinforced by the presence of the 23.60% Fibonacci Retracement. Another support level, the 2nd support at 1.2381, acts as a swing low support, providing additional strength to the support zone.
On the upside, the 1st resistance level at 1.3186 represents an overlap resistance, potentially impeding further upward price advancement. Additionally, there is an intermediate resistance level at 1.2966, acting as a pullback resistance and coinciding with the 78.60% Fibonacci Projection.
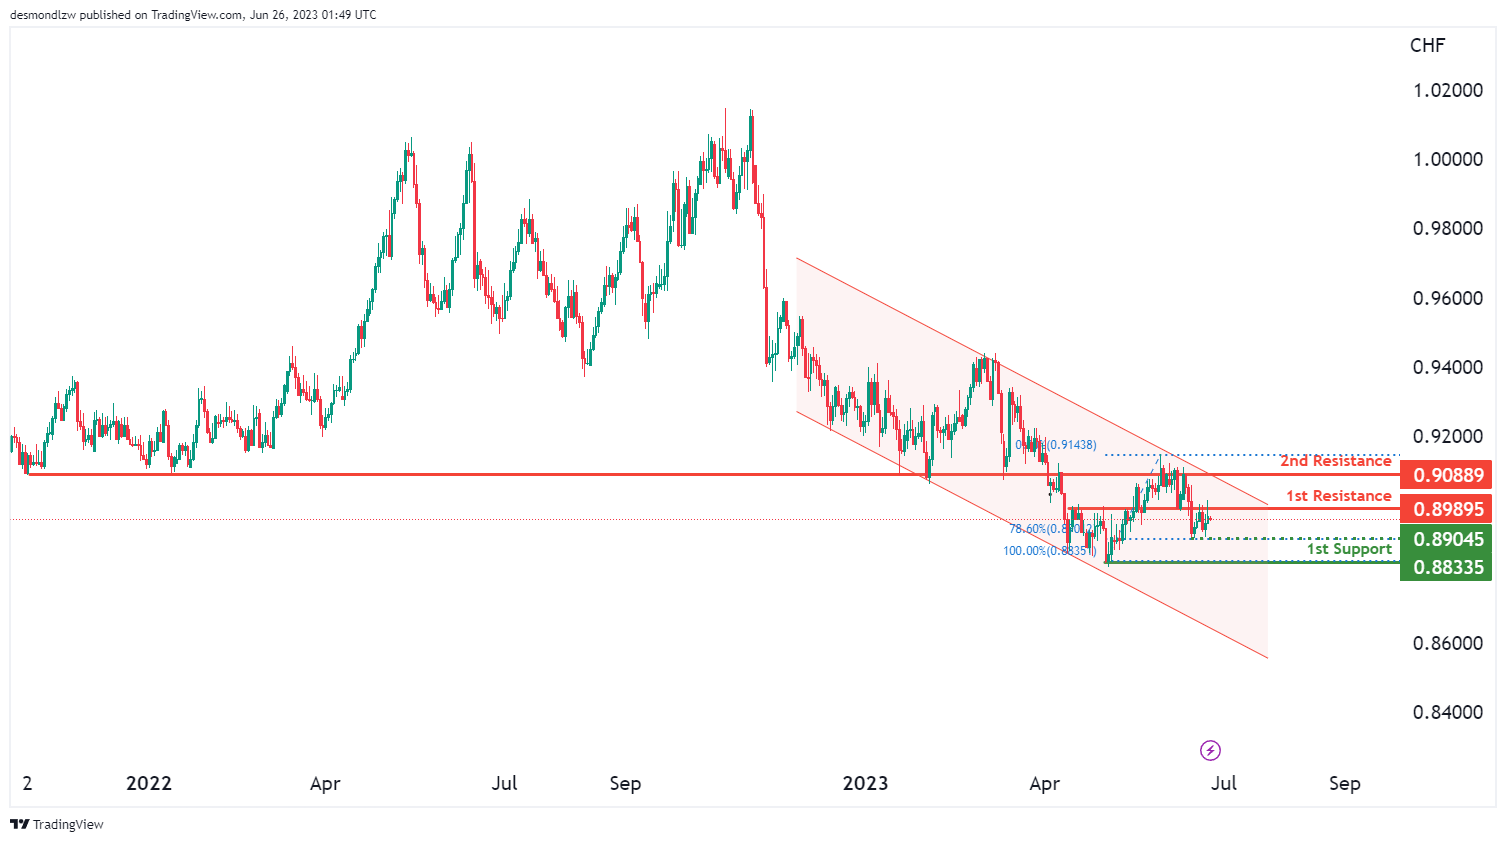
USD/CHF:
The USD/CHF chart demonstrates a bearish momentum, supported by the fact that the price is within a bearish descending channel, suggesting a potential for further downward movement.
There is a possibility of a bearish continuation towards the 1st support level at 0.8833, which acts as a swing low support. Additionally, there is an intermediate support level at 0.8904, reinforcing the support zone and coinciding with the 78.60% Fibonacci Retracement.
On the upside, the 1st resistance level at 0.8989 represents an overlap resistance, potentially impeding upward price movement. Another resistance level, the 2nd resistance at 0.9088, also acts as an overlap resistance, further strengthening its significance.
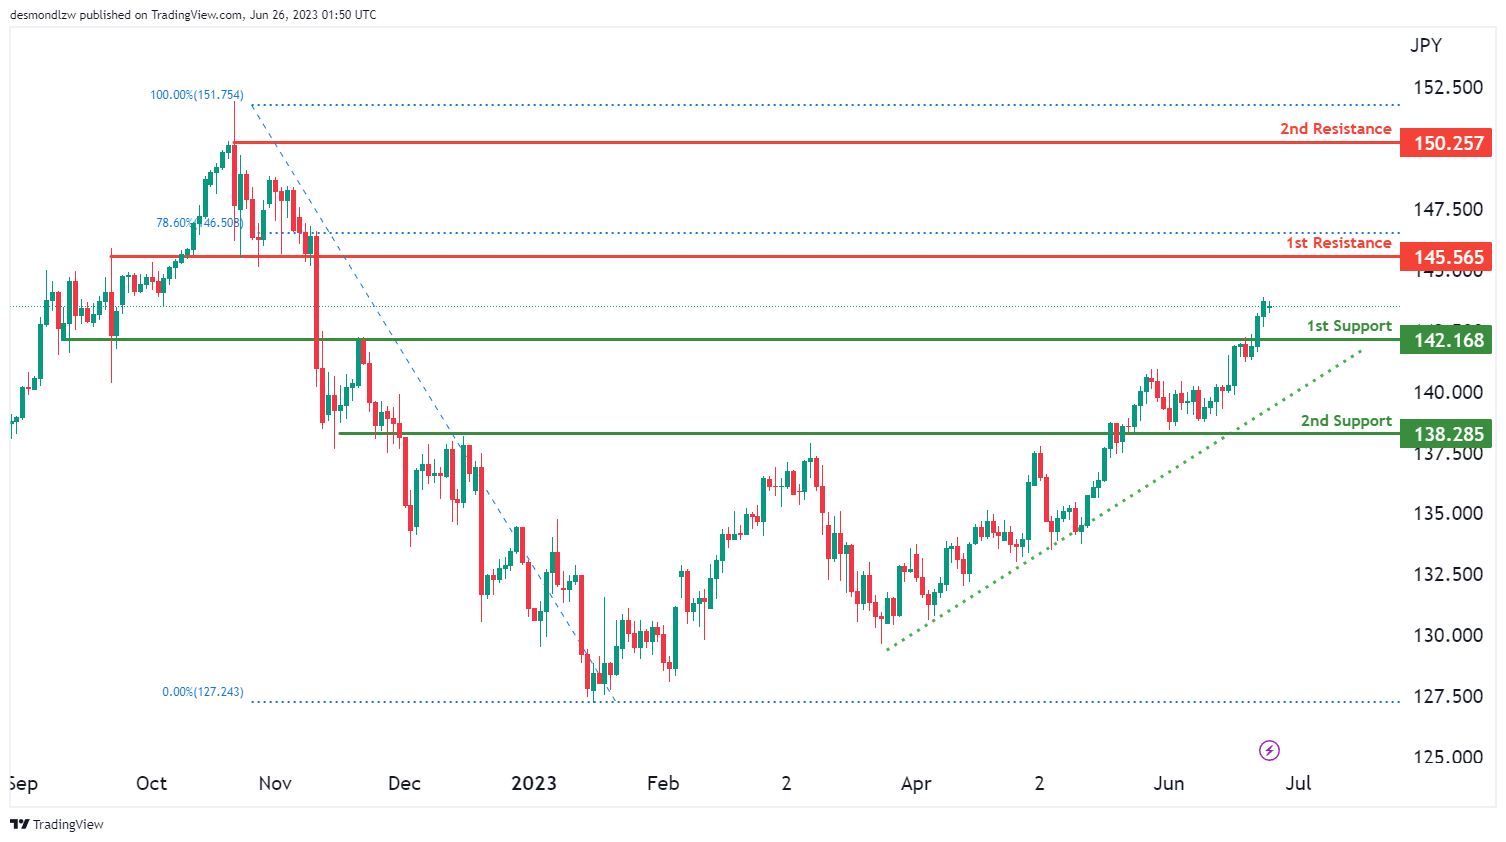
USD/JPY:
The USD/JPY chart exhibits a bullish momentum, supported by the fact that the price is above a major ascending trend line, indicating a potential for further upward movement.
There is a possibility of a bullish continuation towards the 1st resistance level at 145.56, which serves as a pullback resistance. Additionally, the 2nd support level at 150.25 acts as a swing high resistance, further reinforcing its significance.
On the downside, the 1st support level at 142.16 represents a pullback support, providing potential strength to the support zone. Another support level, the 2nd support at 138.28, acts as an overlap support, further confirming its importance.
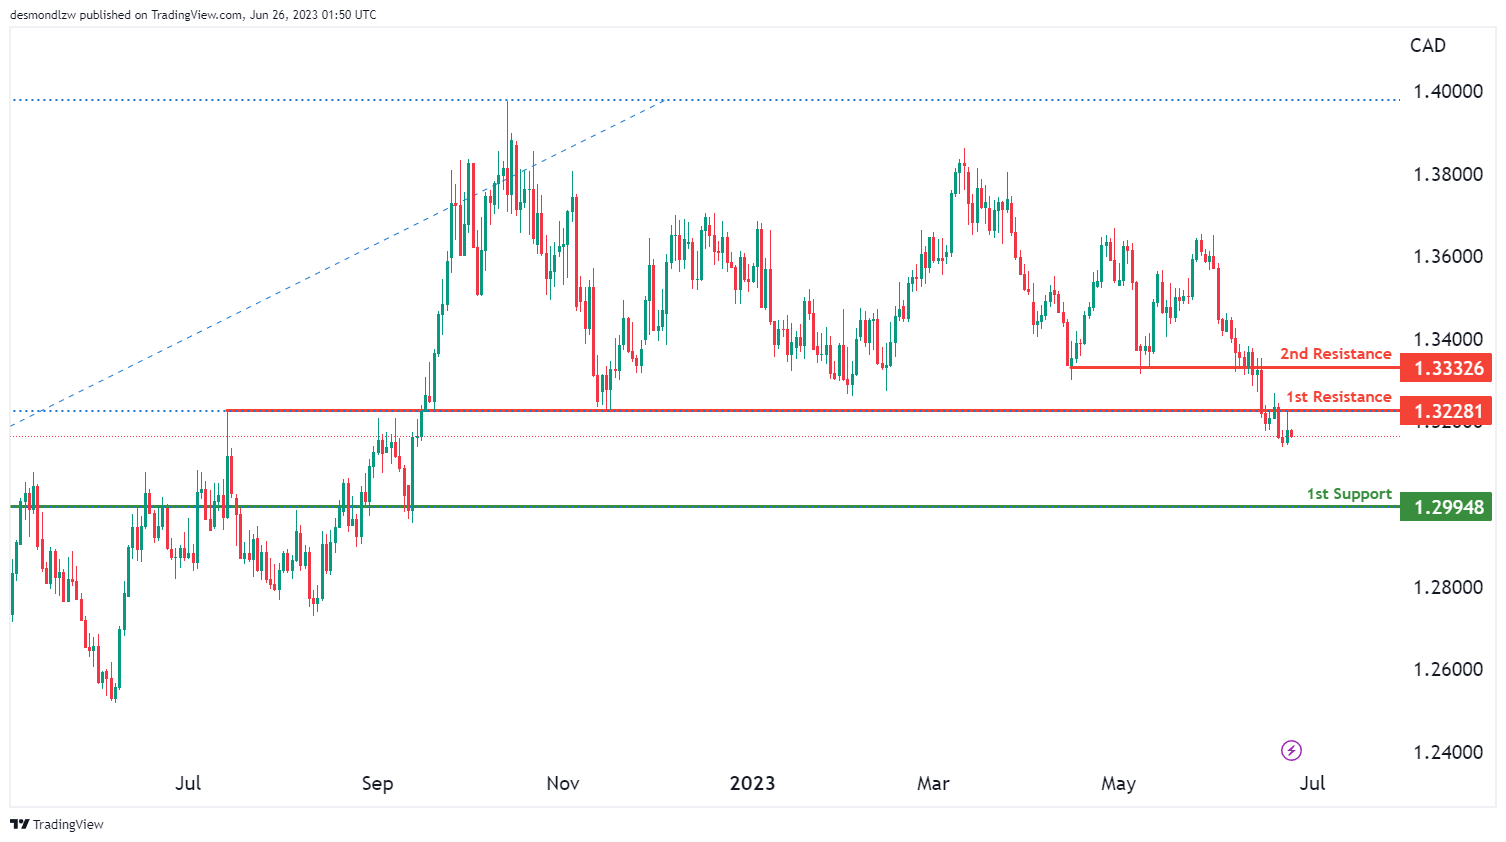
USD/CAD:
The USD/CAD chart exhibits a bearish momentum, indicating a potential for continued downward movement in the market.
There is a likelihood of a bearish continuation towards the 1st support level at 1.2994, which is considered an overlap support.
Conversely, the 1st resistance level at 1.3228 represents an overlap resistance that could potentially hinder upward movement. Similarly, the 2nd resistance level at 1.3332 acts as another overlap resistance.
These factors contribute to the prevailing bearish momentum observed in the chart, suggesting a scenario where the price may continue its downward trajectory towards the 1st support level.
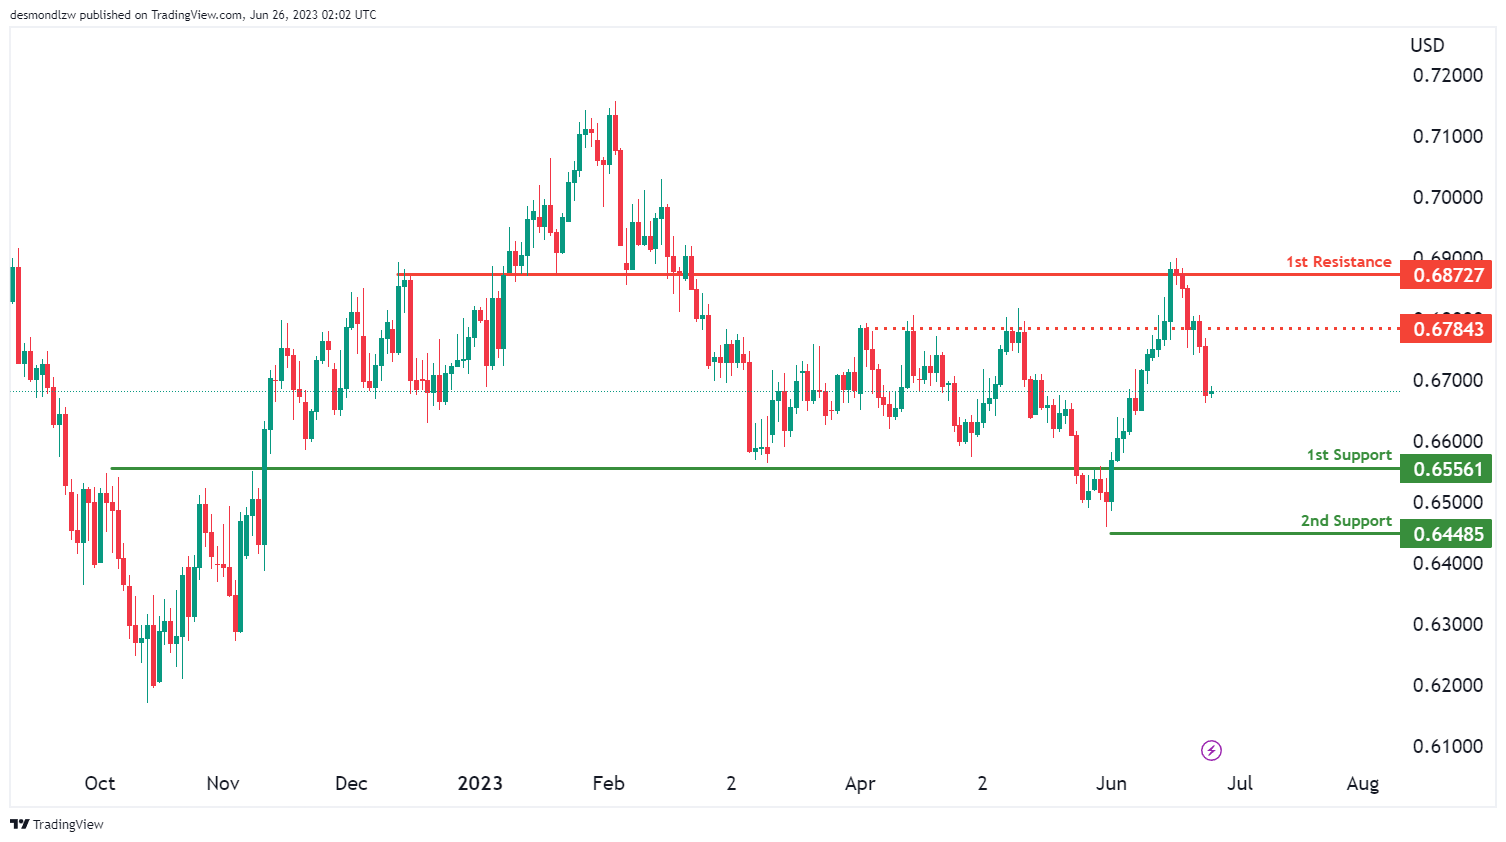
AUD/USD:
The AUD/USD chart indicates a bearish momentum, suggesting a potential for continued downward movement in the market.
There is a possibility of a bearish continuation towards the 1st support level at 0.6556, which is identified as a pullback support. Additionally, the 2nd support level at 0.6448 acts as a swing low support, providing further strength to the support zone.
On the upside, the 1st resistance level at 0.6872 represents an overlap resistance that could impede upward movement. Furthermore, an intermediate resistance at 0.6784 acts as a pullback resistance, adding to the potential barriers for upward price advancement.
NZD/USD
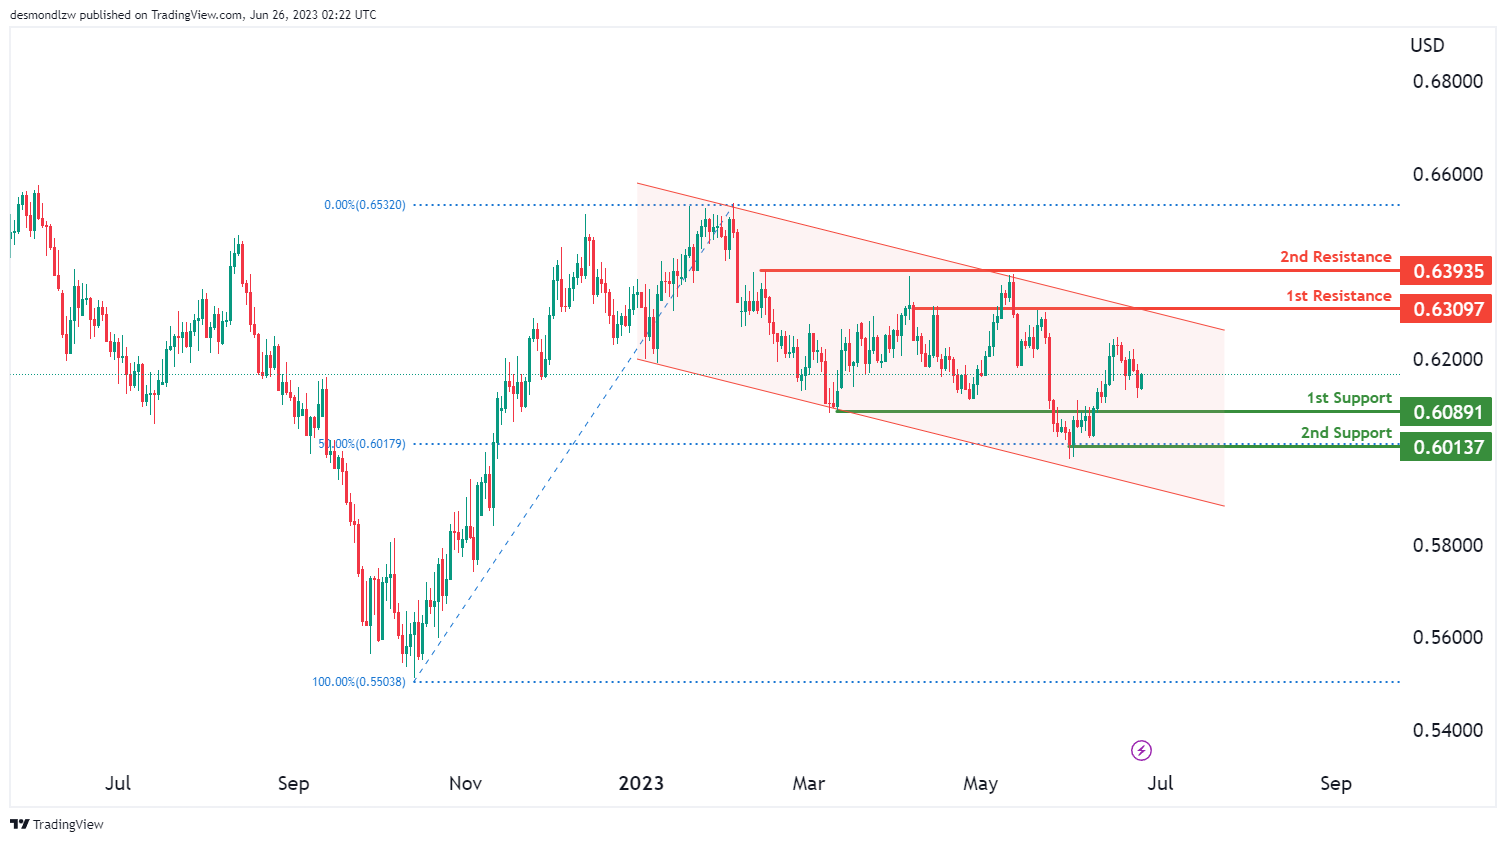
The NZD/USD chart exhibits a bearish momentum, indicating a potential for continued downward movement in the market. The price is currently within a bearish descending channel, reinforcing the bearish sentiment.
There is a possibility of a bearish continuation towards the 1st support level at 0.6089, which is considered a pullback support. Additionally, the 2nd support level at 0.6013 acts as a swing low support, providing additional strength to the support zone.
On the upside, the 1st resistance level at 0.6309 represents an overlap resistance that may impede upward movement. Furthermore, the 2nd resistance level at 0.6393 acts as a pullback resistance, potentially adding further resistance to the price’s upward advancement.
DJ30:
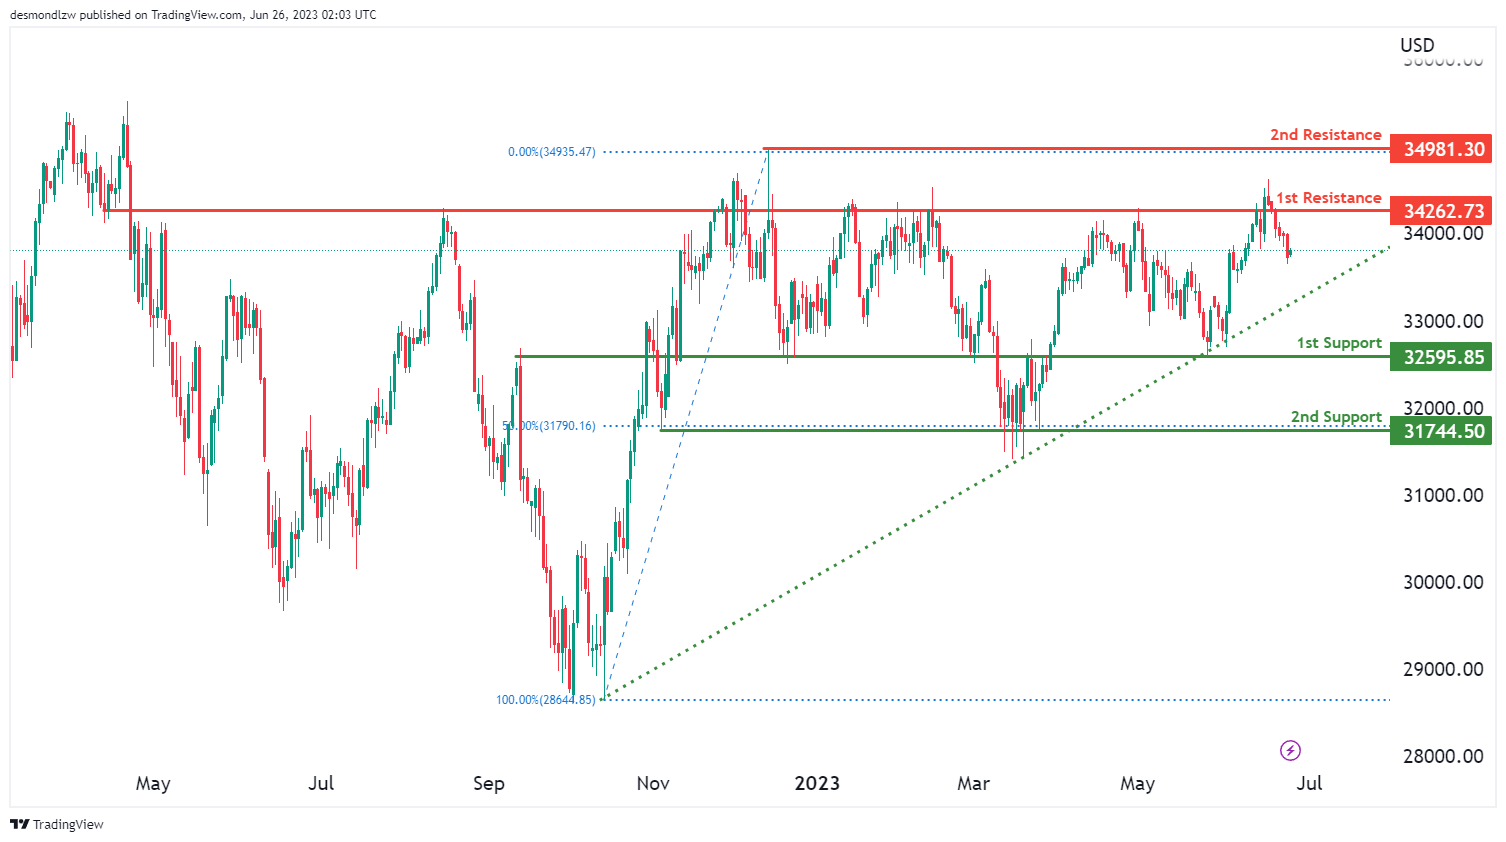
The DJ30 (Dow Jones Industrial Average) chart demonstrates a bullish momentum, indicating a potential for further upward movement in the market. The price is currently above a major ascending trend line, which serves as a support level and reinforces the bullish sentiment.
In the short term, there is a possibility of a drop towards the 1st support level at 32595.85 before bouncing back from there and rising towards the 1st resistance level at 34262.73.
The 1st support level at 32595.85 is considered an overlap support, providing a potential area of price consolidation or a bounce. Additionally, the 2nd support level at 31744.50 acts as a multi-swing low support, further reinforcing its significance as a potential support zone.
On the upside, the 1st resistance level at 34262.73 represents an overlap resistance, which may impede further upward movement. Furthermore, the 2nd resistance level at 34981.30 acts as a swing high resistance, potentially adding resistance to the price’s upward advancement.
GER30:
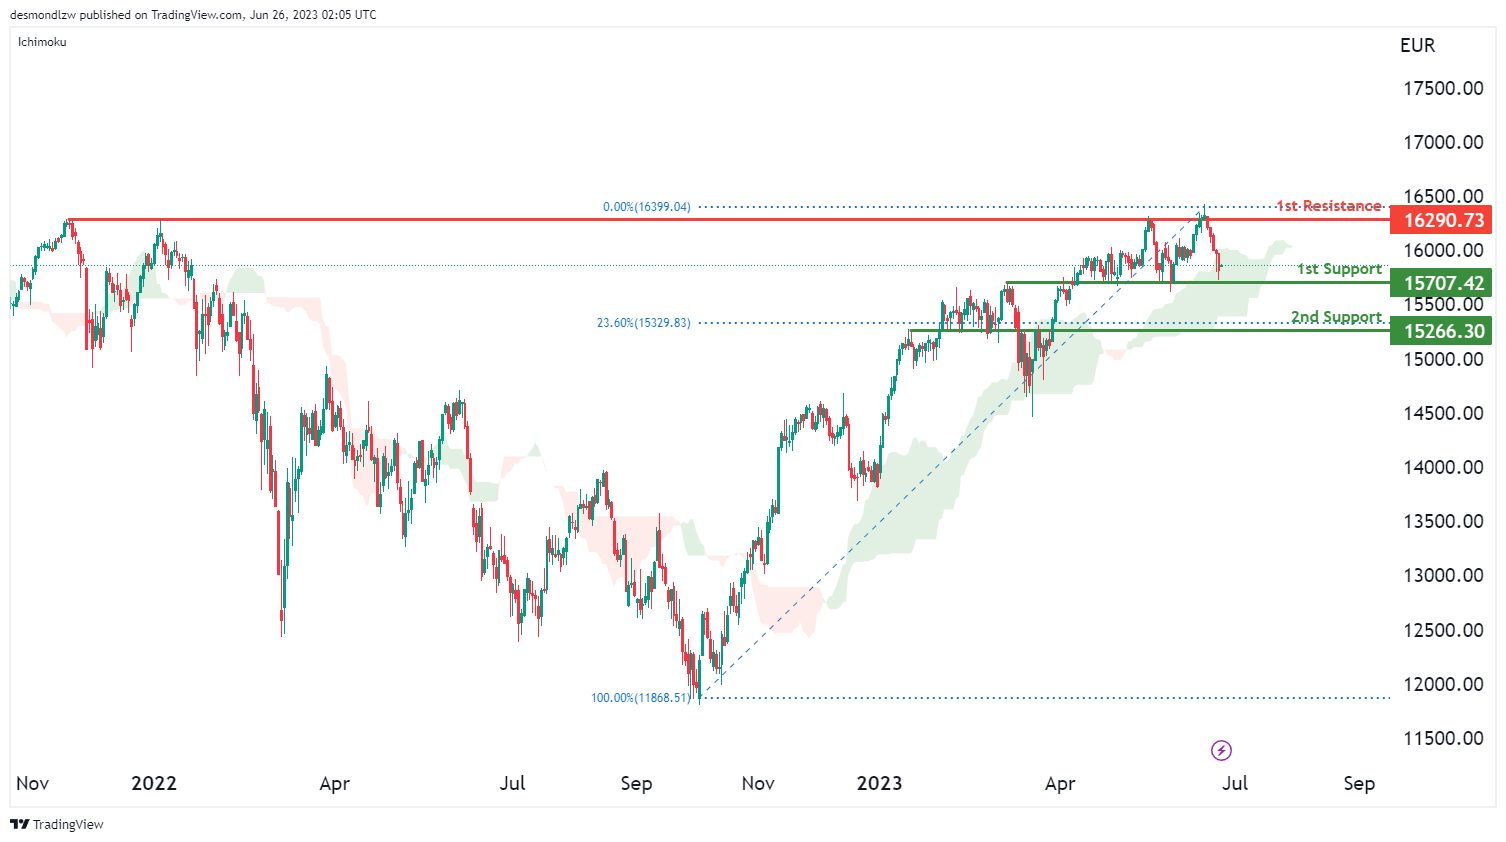
The GER30 chart shows a bullish momentum, supported by the price being above the bullish Ichimoku cloud, indicating a positive sentiment in the market.
There is a potential for a bullish bounce off the 1st support level at 15707.42, followed by a move towards the 1st resistance level at 16290.73.
The 1st support level at 15707.42 is considered an overlap support, providing a significant level where buyers may enter the market. Additionally, the 2nd support level at 15266.30 acts as a pullback support, further strengthening the support zone with the presence of the 23.60% Fibonacci Retracement.
On the upside, the 1st resistance level at 16290.73 represents a multi-swing high resistance, potentially posing a challenge for further upward movement.
US500
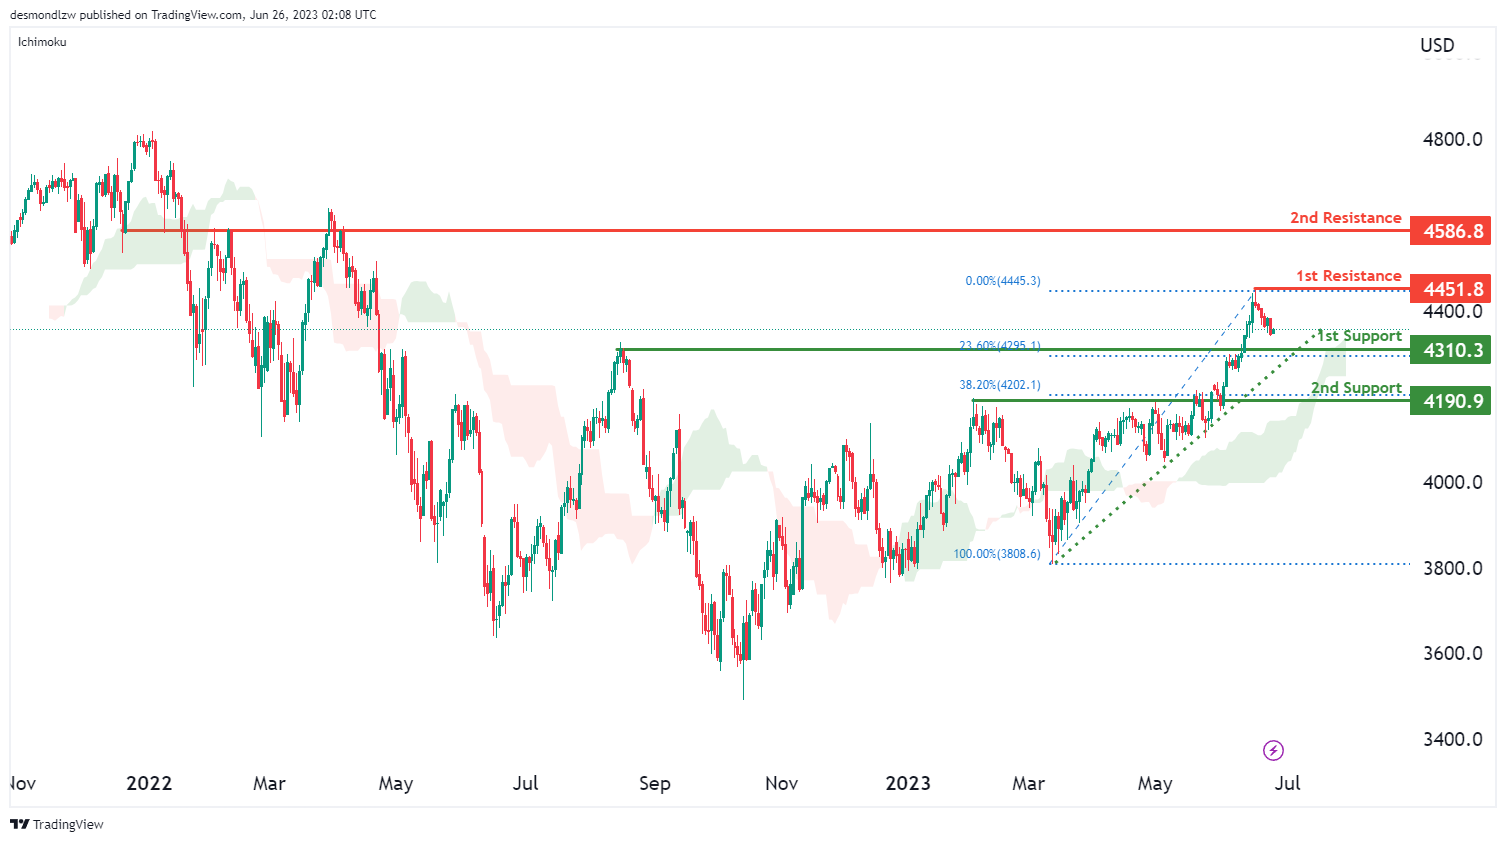
The US500 (S&P 500) chart demonstrates a bullish momentum, supported by two factors. Firstly, the price is currently above the bullish Ichimoku cloud, indicating a positive sentiment in the market. Secondly, it remains above a major ascending trend line, suggesting the potential for further upward movement.
There is a possibility of a short-term drop towards the 1st support level at 4310.3 before the price bounces from there and rises towards the 1st resistance level at 4451.8.
The 1st support level at 4310.3 acts as a pullback support, providing a significant level where buyers may enter the market. Additionally, the 2nd support level at 4190.9 serves as another pullback support, reinforcing the support zone with the presence of the 38.20% Fibonacci Retracement.
On the upside, the 1st resistance level at 4451.8 represents a swing high resistance, potentially posing a challenge for further upward movement. Similarly, the 2nd resistance level at 4586.8 is an overlap resistance, further reinforcing its significance.
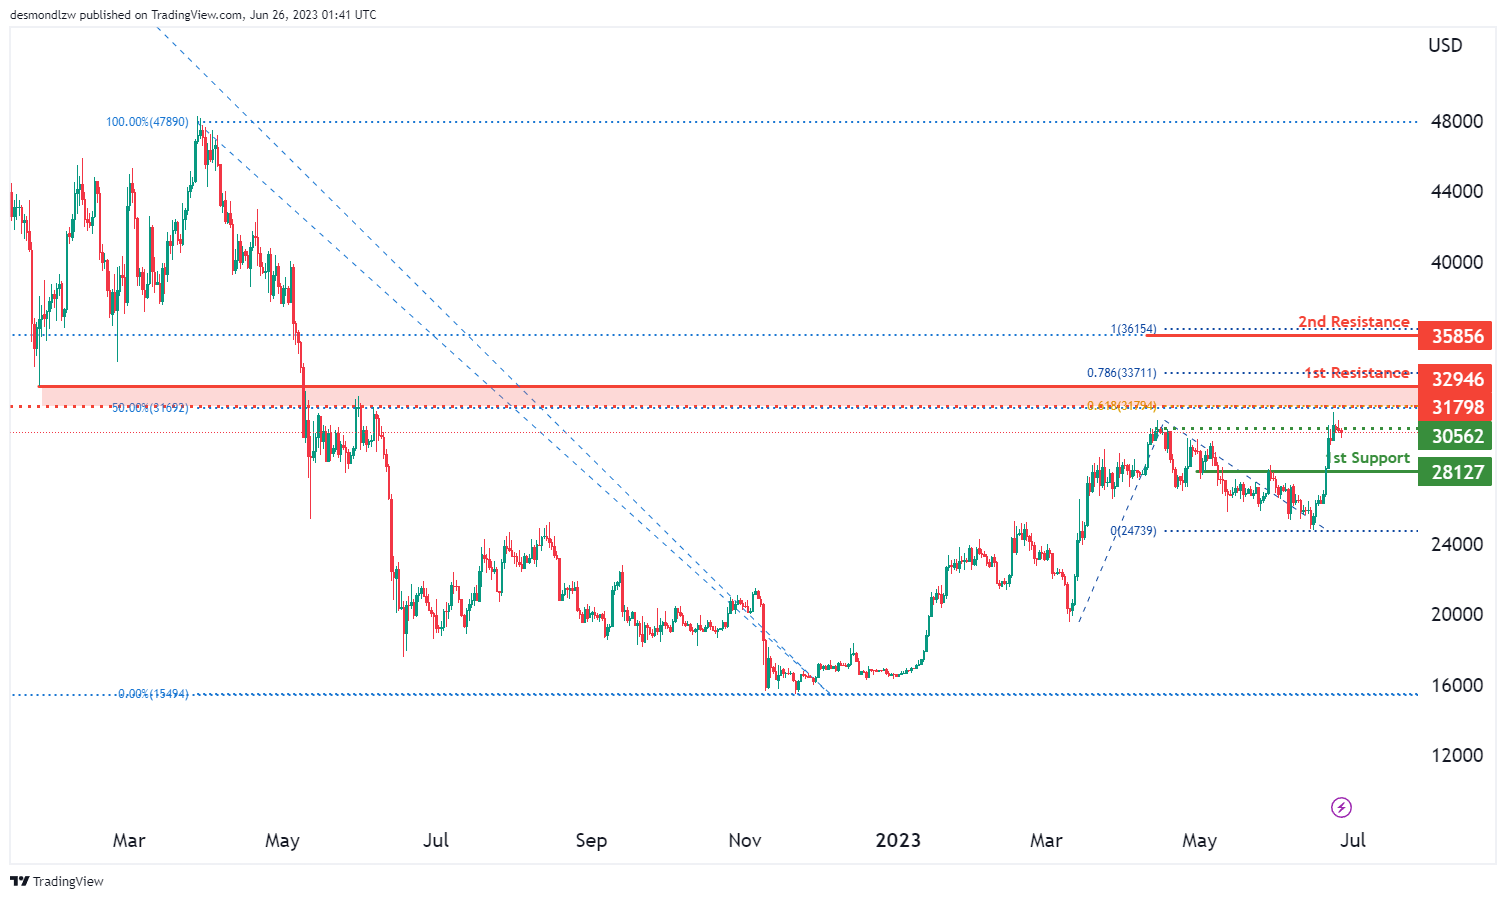
BTC/USD:
The BTC/USD chart currently exhibits a bearish momentum, indicating a downward trend in the market.
There is a possibility of a bearish reaction at the 1st resistance level of 32946, potentially causing the price to drop towards the 1st support level at 28127.
The 1st support level at 28127 acts as a pullback support, providing a significant level where buyers may enter the market. Additionally, the intermediate support at 30562 serves as a multi-swing low support, further reinforcing its importance as a potential price floor.
On the upside, the 1st resistance level at 32946 represents a pullback resistance, which could impede further upward movement. Similarly, the 2nd resistance level at 35856 is significant as it aligns with the 100% Fibonacci Projection.
Furthermore, the intermediate resistance at 31798 acts as an overlap resistance, reinforced by the presence of the 50% Fibonacci Retracement and the 61.80% Fibonacci Projection. This confluence of Fibonacci levels enhances the significance of this resistance level.
ETH/USD:
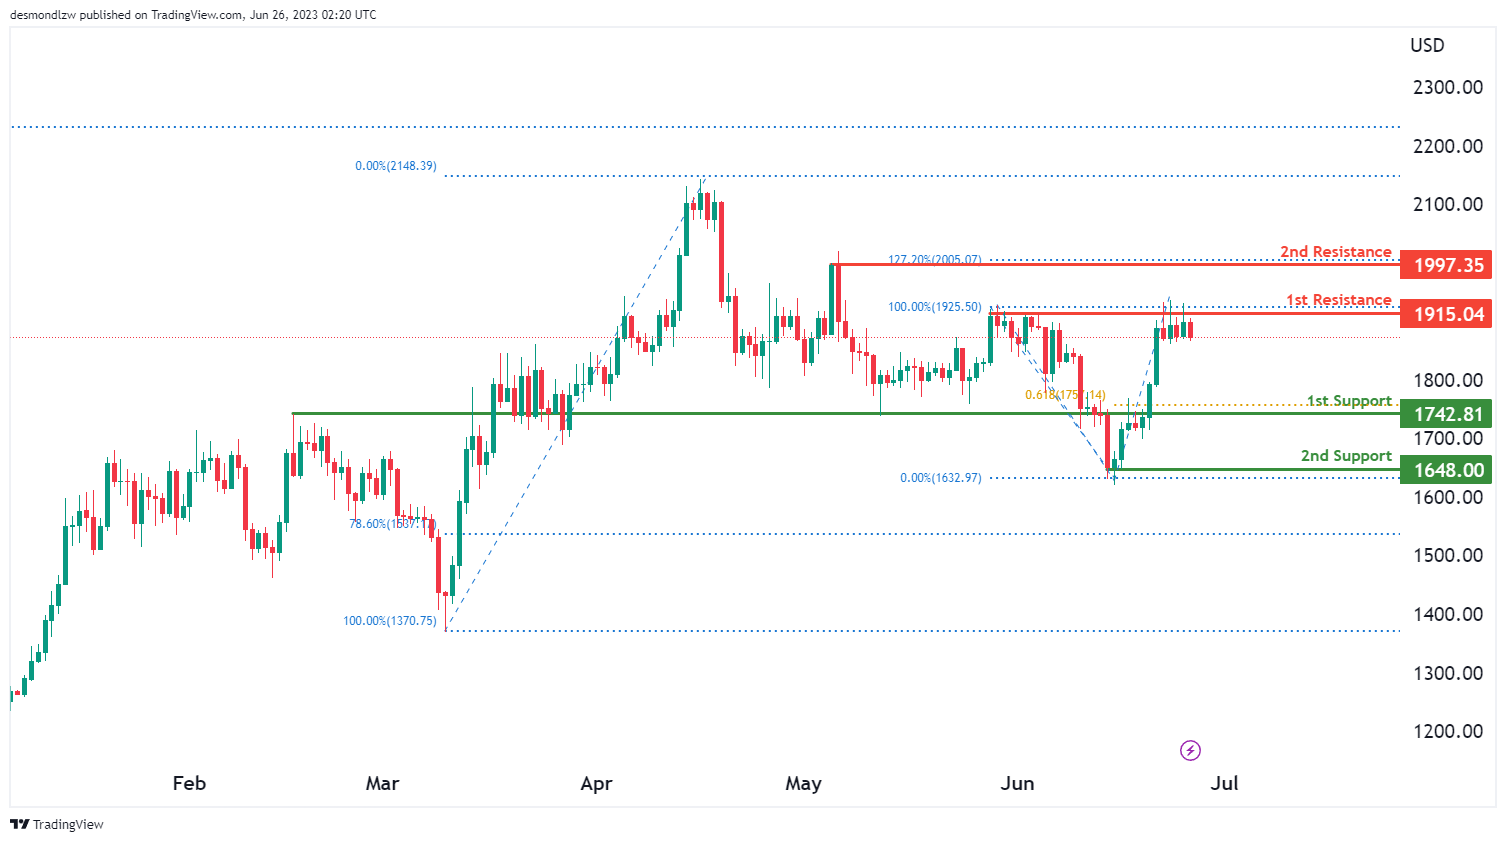
The ETH/USD chart currently shows a bearish momentum, indicating a downward trend in the market.
There is a potential for a bearish reaction at the 1st resistance level of 1915.07, which may lead to a drop towards the 1st support level at 1742.81.
The 1st support level at 1742.81 is considered a pullback support, offering a significant level where buyers could enter the market. Additionally, the 2nd support level at 1648.00 acts as a swing low support, further reinforcing its importance as a potential price floor.
On the upside, the 1st resistance level at 1915.07 represents a multi-swing high resistance, potentially impeding further upward movement. Similarly, the 2nd resistance level at 1997.35 acts as a swing high resistance, strengthened by the presence of the 127.20% Fibonacci Extension.
WTI/USD:
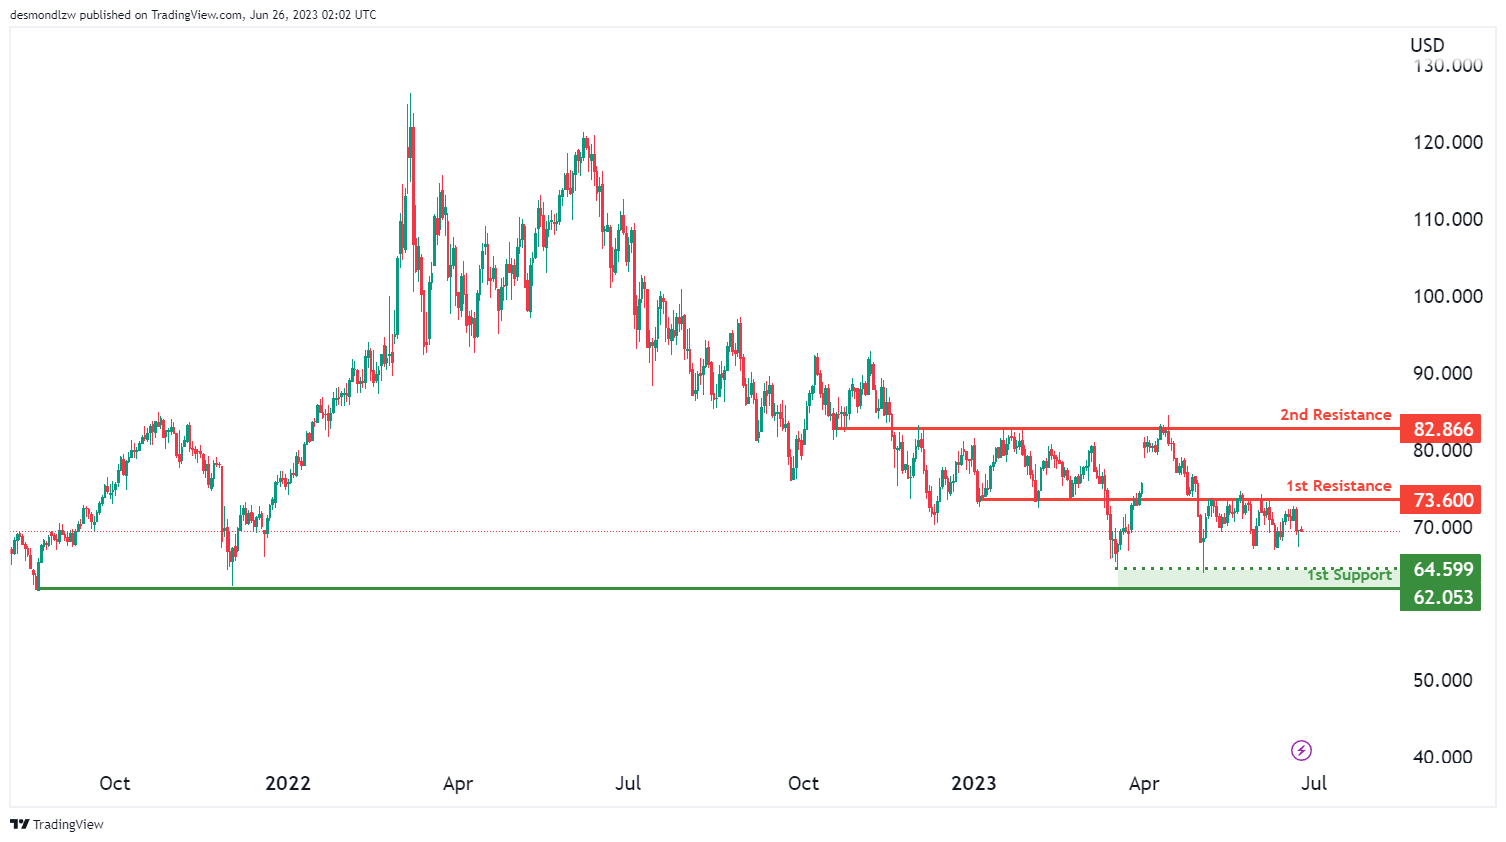
The WTI chart currently shows a neutral momentum, indicating a lack of clear direction in the market.
There is a potential for price to fluctuate between the 1st resistance level at 73.60 and the 1st support level at 62.05.
The 1st support level at 62.05 acts as a swing low support, providing a level where buyers could enter the market. Additionally, the intermediate support level at 64.59 further reinforces the support zone.
On the upside, the 1st resistance level at 73.60 represents an overlap resistance, potentially impeding further upward movement. Similarly, the 2nd resistance level at 82.86 acts as another overlap resistance, indicating its significance in hindering price advancement.
XAU/USD (GOLD):
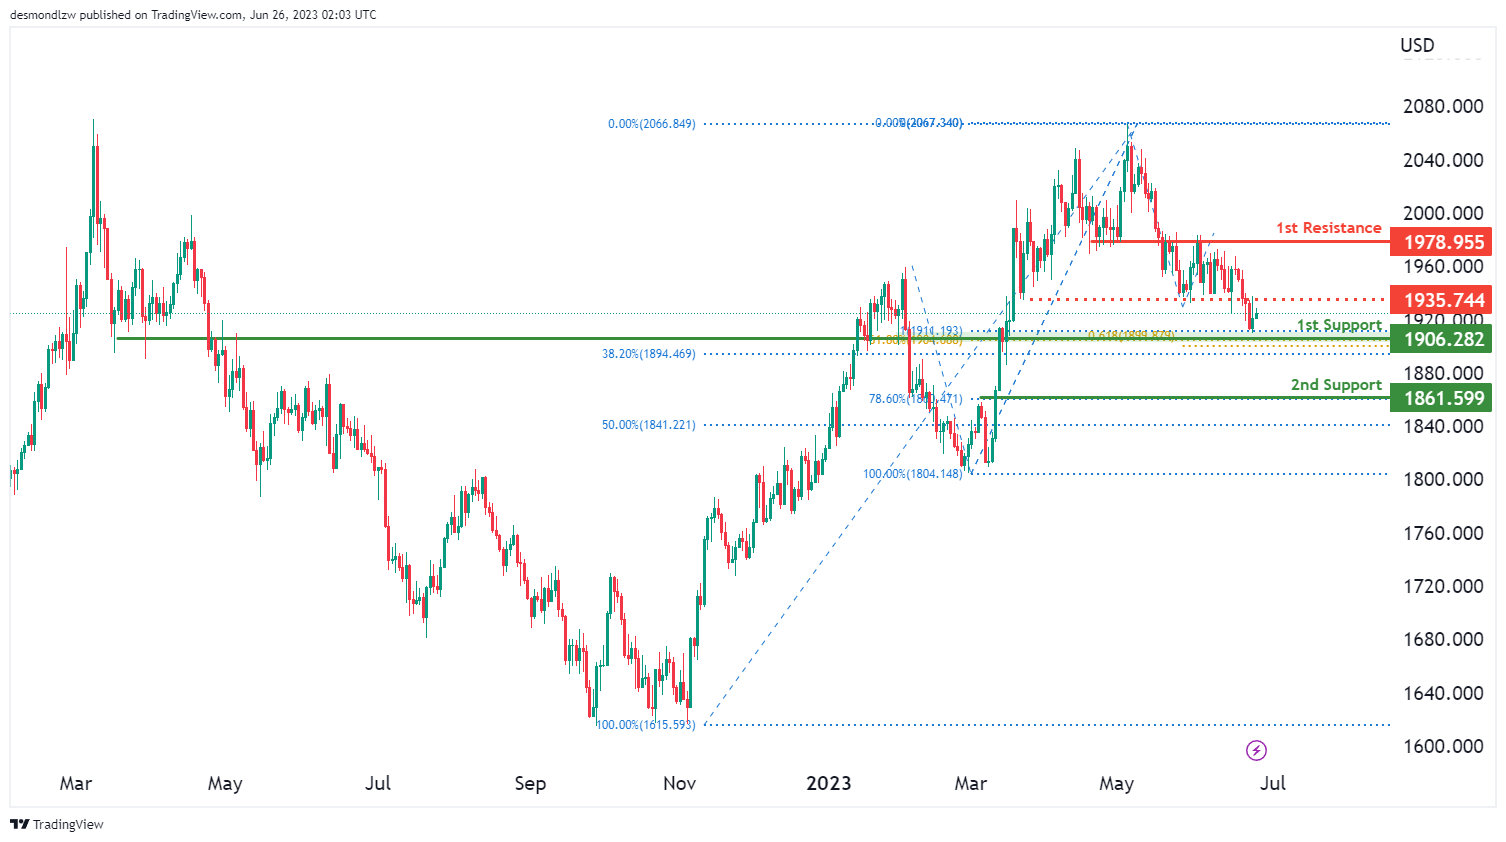
The XAU/USD chart exhibits a bullish momentum, indicating a potential upward movement.
There is a possibility for price to experience a bullish bounce off the 1st support level at 1906.28, which is characterised as an overlap support. This support level is further reinforced by the presence of the 61.80% Fibonacci Retracement and the 61.80% Fibonacci Projection, indicating a Fibonacci confluence. Additionally, the 2nd support level at 1861.59 acts as a pullback support, providing additional strength to the support zone.
On the upside, the 1st resistance level at 1978.95 represents an overlap resistance, potentially hindering further upward price advancement. Similarly, the intermediate resistance level at 1935.74 also acts as an overlap resistance, adding to its significance.
Japan’s top officials voice concern over ‘rapid and one-sided’ yen moves
In the face of Yen's swift depreciation, top Japanese currency diplomat Masato Kanda expressed concern on Monday, describing the recent changes as "rapid and one-sided. He added that "We have all options available and we are not ruling out any options."
Kanda, Vice Finance Minister for International Affairs, however, refrained from using the phrase "decisive action," a term he used before Japan intervened in the currency market last year. This careful choice of words suggests that while officials are monitoring the situation, they may not be ready to step in just yet.
Adding to this sentiment, Finance Minister Shunichi Suzuki highlighted the ongoing vigilance of the government, stating that "we will continue to watch the forex market with a sense of urgency."
In keeping with this sense of readiness, Suzuki assured that authorities would respond "appropriately" to any excessive currency swings, indicating that the government is primed to intervene if necessary.