

Sample Category Title
EUR/AUD Daily Outlook
Daily Pivots: (S1) 1.6222; (P) 1.6280; (R1) 1.6370; More...
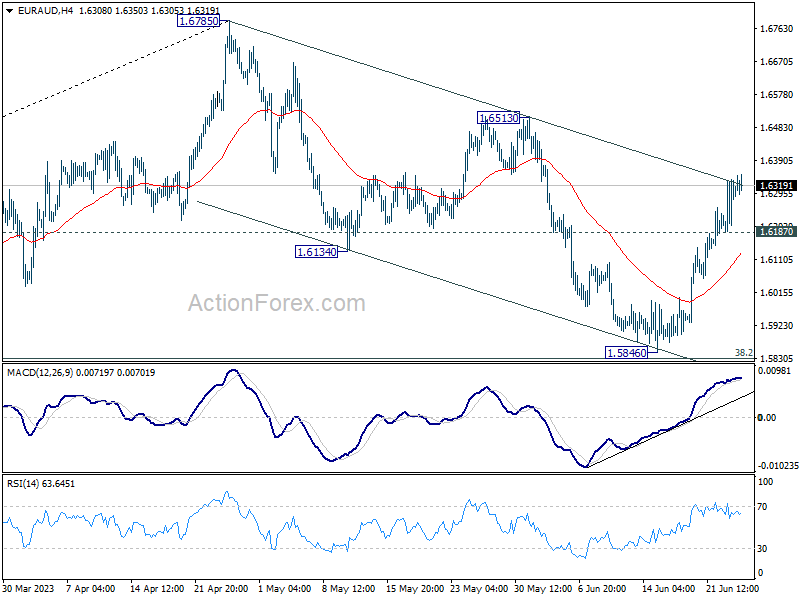
Outlook in EUR/AUD is unchanged. Corrective fall from 1.6785 should have completed with three waves down to 1.5846. Intraday bias stays on the upside for 1.6513 resistance. Firm break there will confirm this case and target 1.6785 high next. On the downside, though, break of 1.6187 minor support will mix up the outlook and turn intraday bias neutral first.
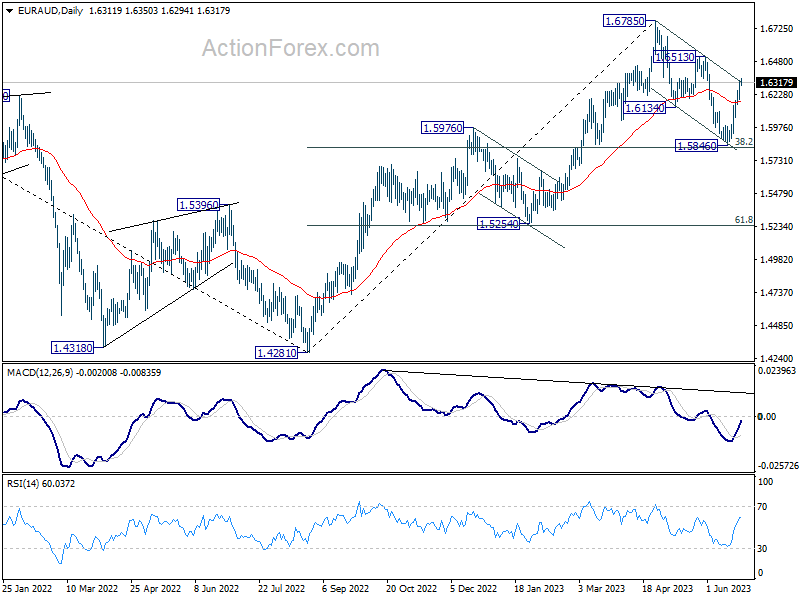
In the bigger picture, with 38.2% retracement of 1.4281 to 1.6785 at 1.5828 intact, rally from 1.4281 is still in progress. Firm break of 1.6785 will confirm rally resumption. Rejection by 1.6785 will extend the corrective pattern with another fall leg. But outlook will stay bullish as long as 1.5828 holds.
EUR/CHF Daily Outlook
Daily Pivots: (S1) 0.9743; (P) 0.9779; (R1) 0.9808; More...
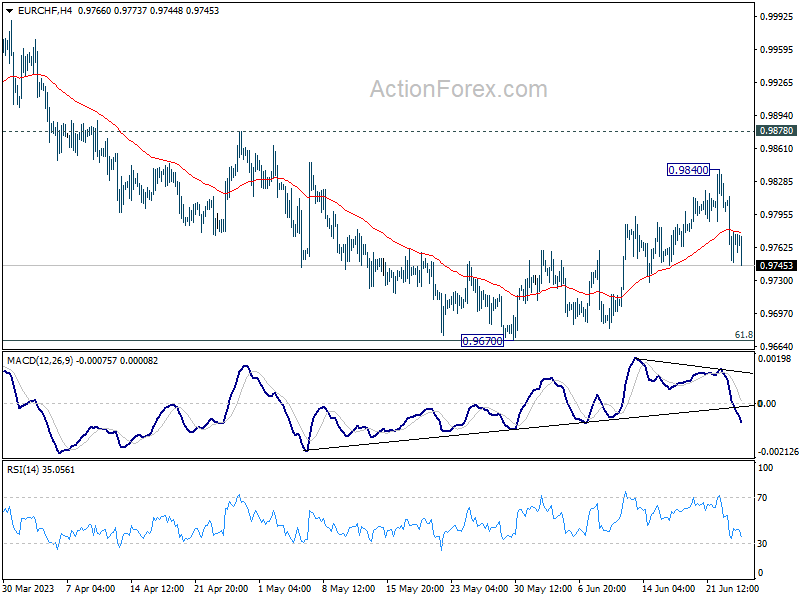
Intraday bias in EUR/CHF stays on the downside at this point. Corrective rebound from 0.9670 could have completed at 0.9840 already. Deeper fall would be seen to retest 0.9670 low. Sustained break there will resume the whole fall from 1.0095. Nevertheless, break of 0.9840 will resume the rebound to 0.9878 resistance.
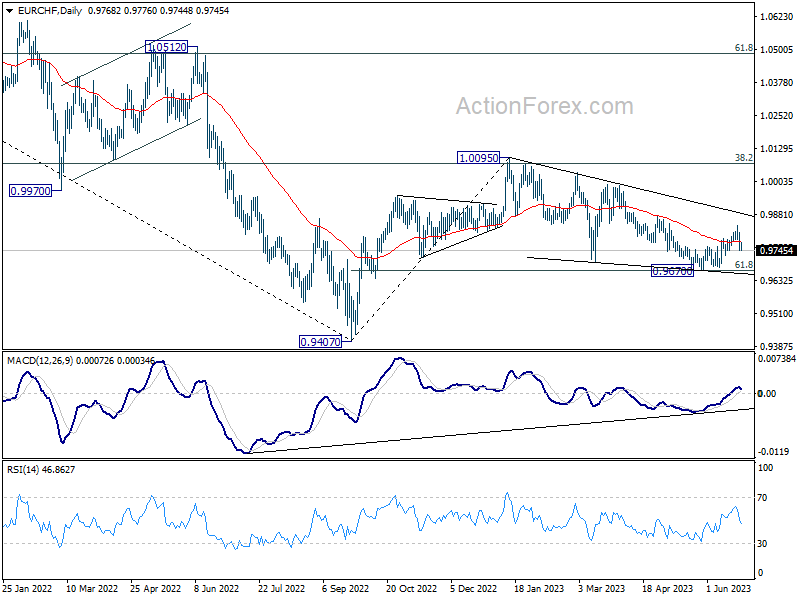
In the bigger picture, medium term outlook is staying bearish as the pair is capped below falling 55 W EMA (now at 0.9918). Down trend form 1.2004 (2018 high) is in favor to extend through 0.9407 at a later stage. Nevertheless, decisive break of 38.2% retracement of 1.1149 to 0.9407 will raise the chance of bullish trend reversal.
EUR/USD: Bearish Bias Under Daily Ccloud Top/10DMA
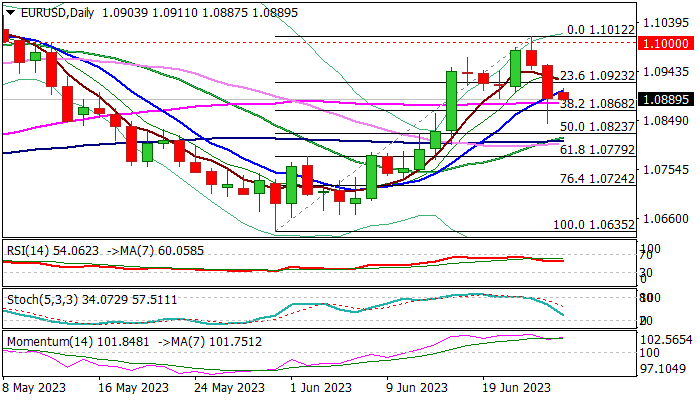
EURUSD is consolidating within a narrow range in early Monday trading, following 0.85% drop last Thu/Fri, on pullback from new multi-week high at 1.1012 (June 22).
Near-term action remains weighed by a bull-trap above 1.0983 Fibo barrier and strong rejection above psychological 1.10 resistance, with repeated close below 10DMA / daily cloud top (1.0907/05) seen as minimum requirement to keep fresh bears in play.
Close below cracked pivotal Fibo support at 1.0868 (38.2% of 1.0635/1.1012) is needed to confirm signal and open way for deeper pullback towards pivotal supports at 1.0823/05 (Fibo 50% / 20DMA / daily cloud base).
Conversely, returning and closing above 10DMA / cloud top, would ease downside pressure on formation of a bear-trap under 1.0868 Fibo support and add to scenario of healthy correction preceding fresh attack at 1.10 zone.
Markets did not show any significant reaction on turmoil in Russia over the weekend, though the Euro was pressured by fresh drop in German business morale in June.
Res: 1.0905; 1.0923; 1.0958; 1.1000.
Sup: 1.0868; 1.0844; 1.0820; 1.0805.
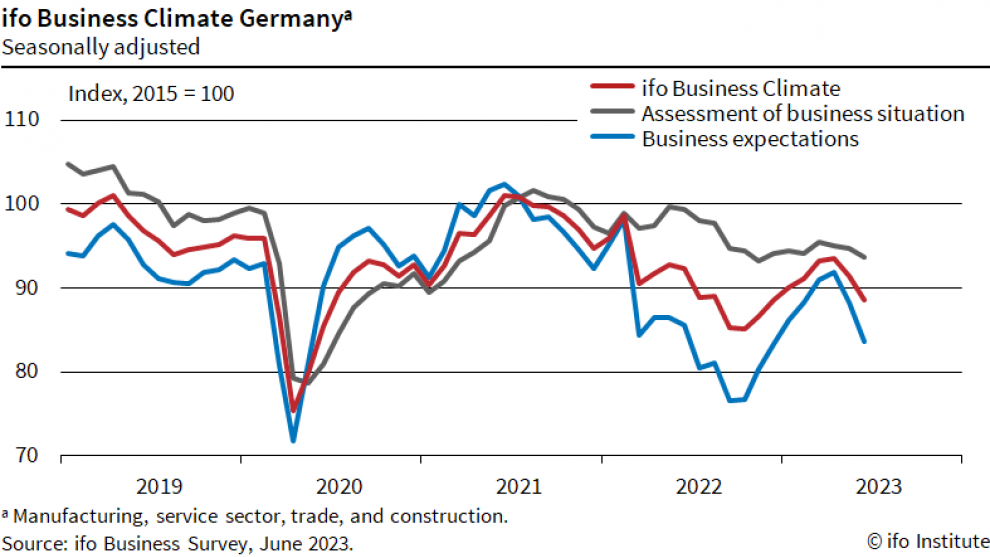
Germany Ifo down to 88.5, manufacturing weakness steering economy into turbulent waters
Germany Ifo Business Climate fell from 91.5 to 88.5 in June, below expectation of 91.2. Current Assessment Index dropped form 94.8 to 93.7, slightly above expectation of 93.5. Expectations Index tumbled further from 88.3 to 83.6, below expectation of 88.0.
By sector, manufacturing fell sharply from -0.1 to -6.6, lowest since November. Services dropped from 6.8 to 2.7. Trade edged down from -19.1 to -20.2. Construction decreased from -18.5 to -20.1.
Ifo said: "Sentiment in the German economy has clouded over considerably... Above all, the weakness in the manufacturing sector is steering the German economy into turbulent waters."
EUR/USD Daily Outlook
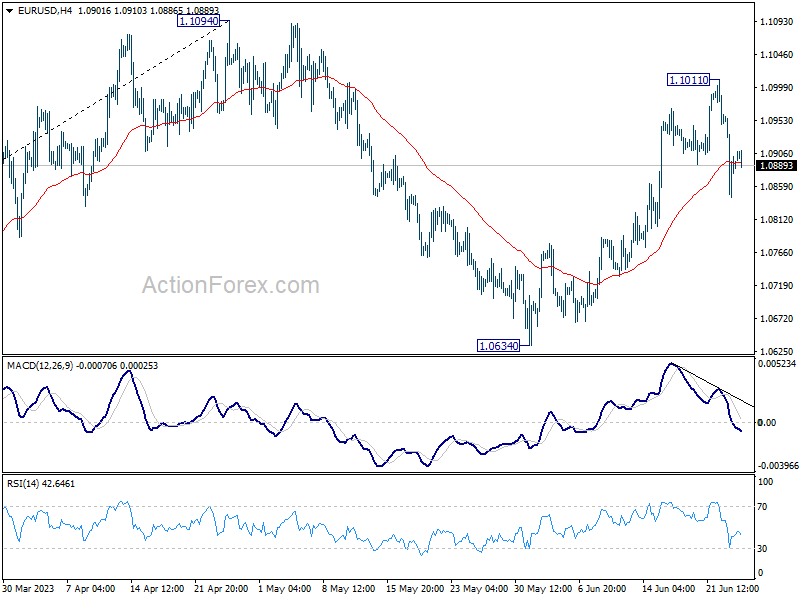
Daily Pivots: (S1) 1.0835; (P) 1.0903; (R1) 1.0960; More...
Intraday bias in EUR/USD stays mildly on the downside at this point. Fall from 1.1101 is seen as the third leg of the corrective pattern from 1.1094. Sustained break of 55 D EMA (now at 1.0838) will target 1.0634 support and below. Nevertheless, rebound from current level, followed by break of 1.1011 will target a test on 1.1094 high instead.
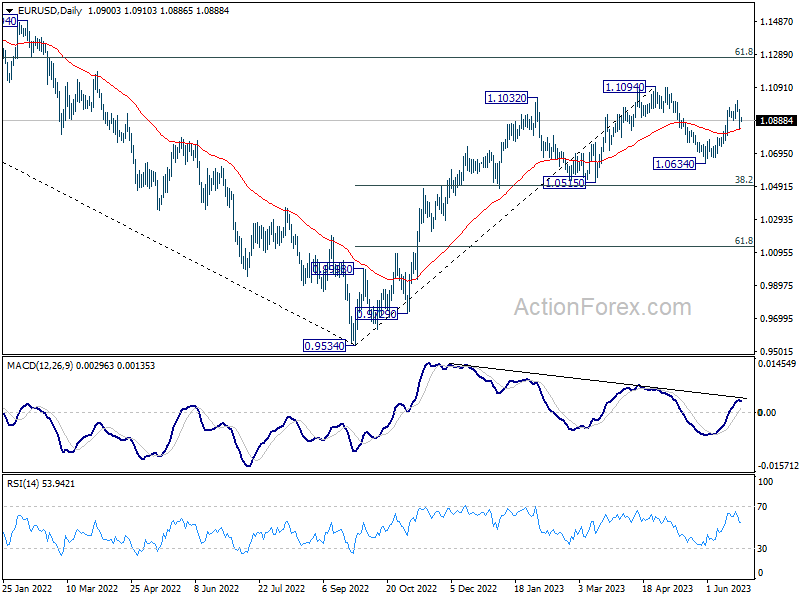
In the bigger picture, as long as 1.0515 support holds, rise from 0.9534 (2022 low) would still extend higher. Sustained break of 61.8% retracement of 1.2348 (2021 high) to 0.9534 at 1.1273 will solidify the case of bullish trend reversal and target 1.2348 resistance next (2021 high).
GBP/USD Daily Outlook
Daily Pivots: (S1) 1.2683; (P) 1.2719; (R1) 1.2753; More...
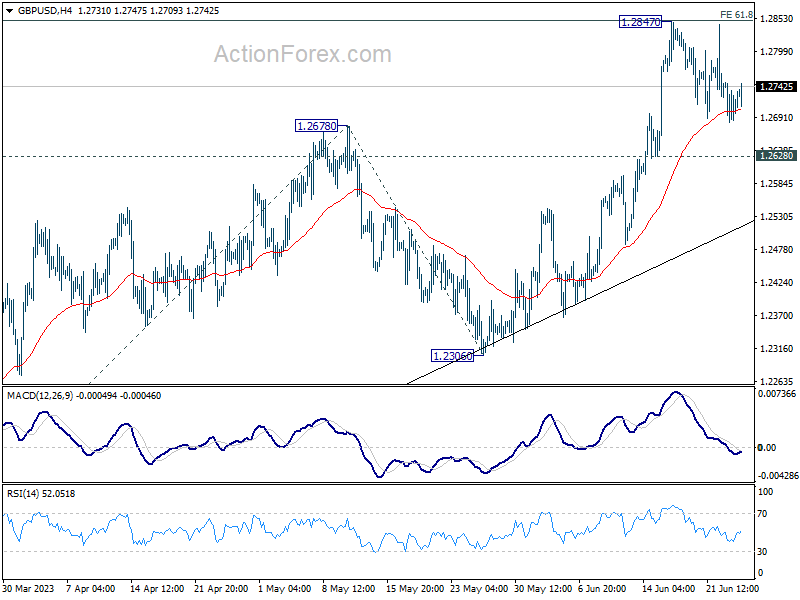
GBP/USD is extending the consolidation from 1.2847 and intraday bias stays neutral at this point. Further rally is expected as long as 1.2628 support holds. On the upside, firm break of 1.2847 will resume larger up trend and target 100% projection of 1.1801 to 1.2678 from 1.2306 at 1.3183 next. However, firm break of 1.2628 will turn bias to the downside, for deeper fall to 1.2306 support instead.
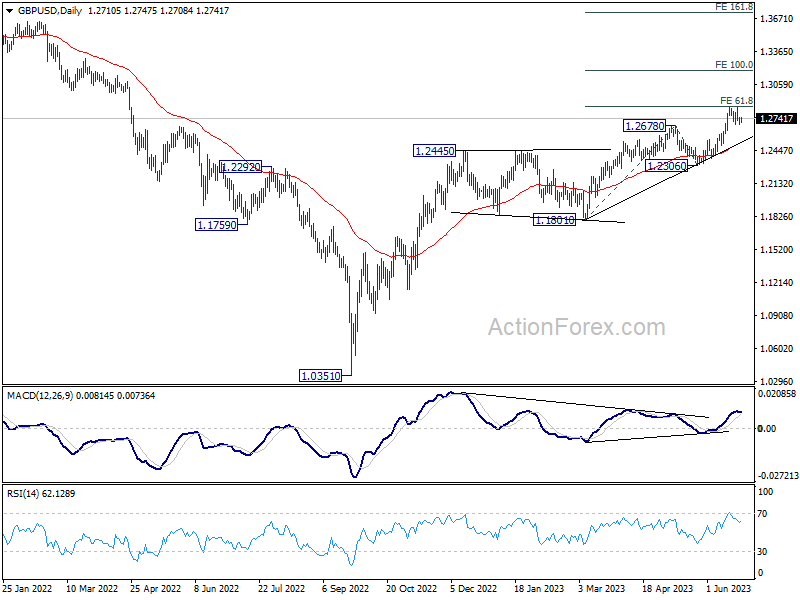
In the bigger picture, the strong support from 55 W EMA (now at 1.2341) is a medium term bullish sign. Outlook will stay bullish as long as 1.2306 support holds. Rise from 1.0351 medium term bottom (2022 low) is expected to extend further to retest 1.4248 key resistance (2021 high).
USD/JPY Daily Outlook
Daily Pivots: (S1) 143.03; (P) 143.45; (R1) 144.14; More...
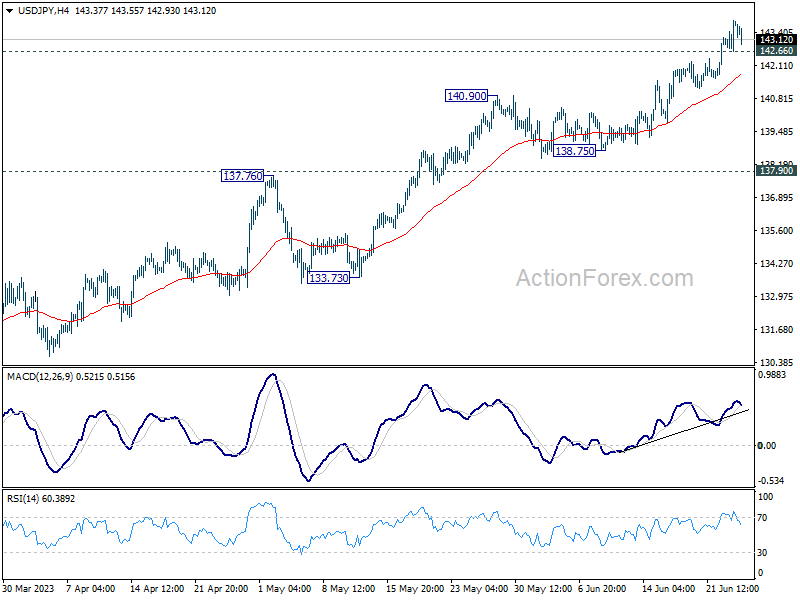
Intraday bias in USD/JPY stays on the upside and current rally from 127.20 should target 161.8% projection of 127.20 to 137.90 from 129.62 at 146.93. On the downside, below 142.66 minor support will turn intraday bias neutral first. But further rally will now remain in favor as long as 137.90 resistance turned support holds.
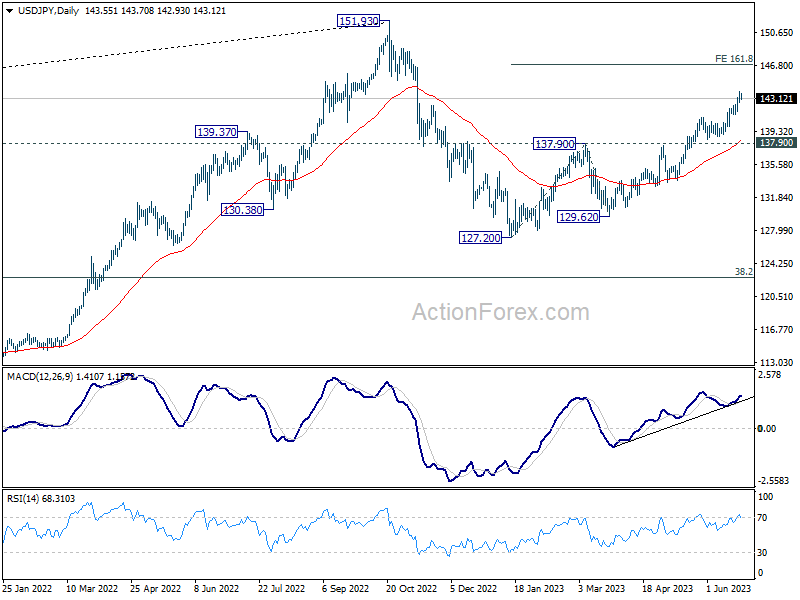
In the bigger picture, rise from 127.20 is currently seen as the second leg of the corrective pattern from 151.93 high. Further rally is expected as long as 137.90 resistance turned support holds, to retest 151.93. But strong resistance could be seen there to limit upside. Break of 137.90 will indicate the the third leg has started back towards 127.20.
USD/CHF Daily Outlook
Daily Pivots: (S1) 0.8934; (P) 0.8973; (R1) 0.9010; More...
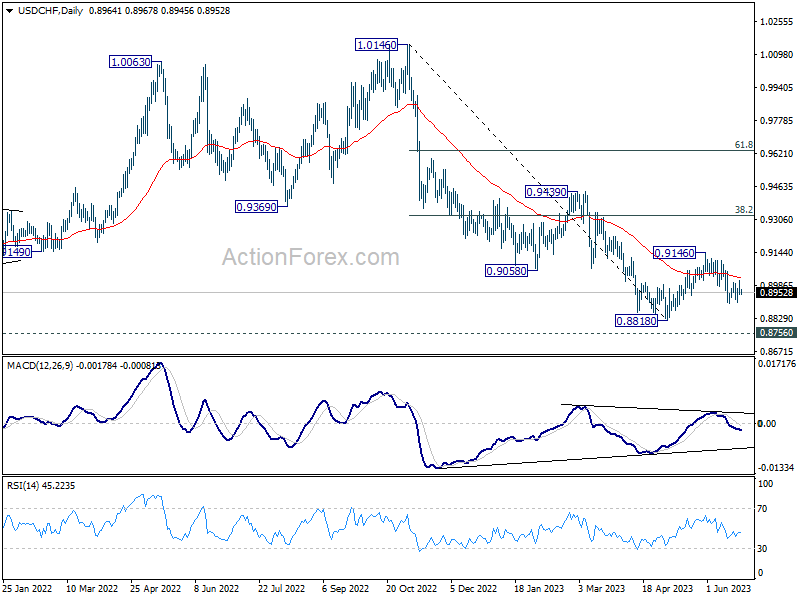
Intraday bias in USD/CHF remains neutral for the moment. On the upside, above 0.9011 will bring stronger rise towards 0.9146 resistance. On the downside, through, break of 0.8900 will target 0.8818 and possibly below.
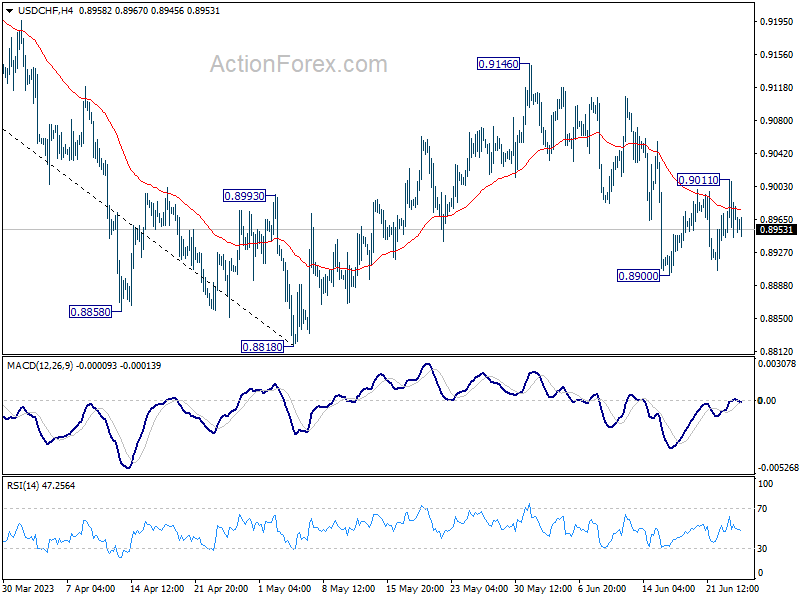
In the bigger picture, fall from 1.1046 (2022 high) is seen as a leg in the long term range pattern from 1.0342 (2016 high), which might have completed at 0.8818 already, just ahead of 0.8756 long term support. Sustained trading above 0.9058 support turned resistance should confirm medium term bottoming.
AUD/USD Daily Report
Daily Pivots: (S1) 0.6637; (P) 0.6703; (R1) 0.6742; More...
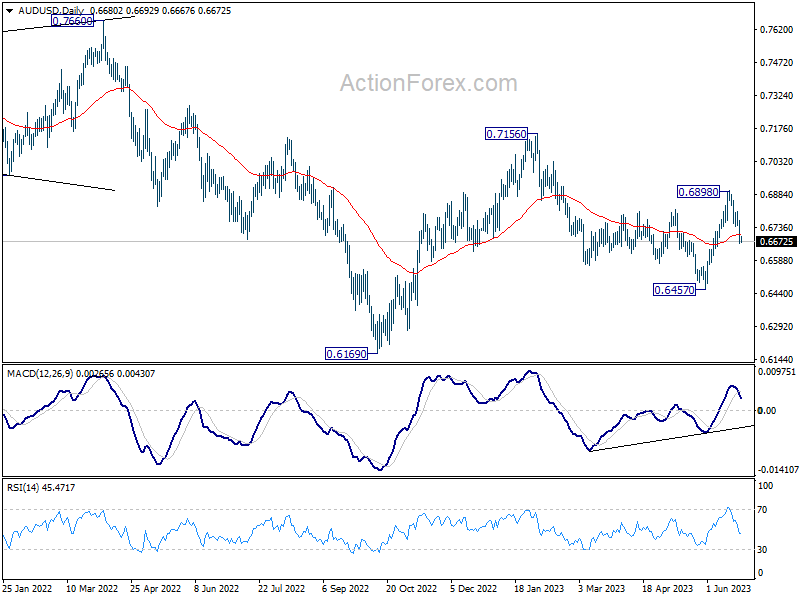
Intraday bias in AUD/USD remains on the downside at this point. Fall from 0.6898 would target 61.8% retracement of 0.6457 to 0.6898 at 0.6625. Sustained break there would bring deeper decline back to 0.6457 support. On the upside, above 0.6740 will turn intraday bias neutral first.
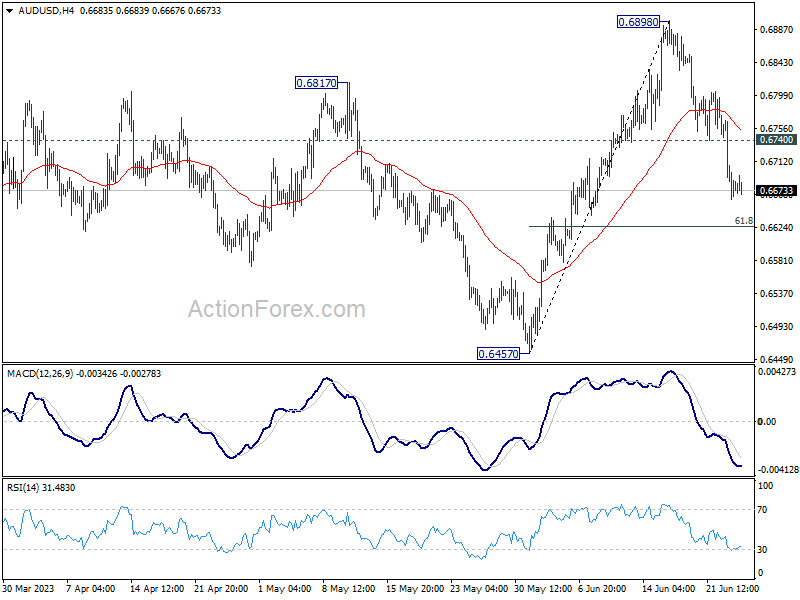
In the bigger picture, price actions from 0.7156 are seen as a correction to the rebound from 0.6169 for now. Break of 55 D EMA (now at 0.6701) raises the chance that it's in progress. Break of 0.6457 will resume the fall form 0.7156. On the upside, though, break of 0.6898 resistance will argue that rise form 0.6169 is ready to resume through 0.7156.
GBP/USD Eyes Fresh Increase, USD/CAD Could Extend Losses
GBP/USD faced resistance near 1.2845 and started a downside correction. USD/CAD is struggling below 1.3210 and might decline further.
Important Takeaways for GBP/USD and USD/CAD
- The British Pound started a downside correction below the 1.2845 zone.
- There is a key bearish trend line forming with resistance near 1.2740 on the hourly chart of GBP/USD at FXOpen.
- USD/CAD declined below the 1.3210 and 1.3185 support levels.
- A connecting bearish trend line is forming with resistance near 1.3185 on the hourly chart at FXOpen.
GBP/USD Technical Analysis
On the hourly chart of GBP/USD at FXOpen, the pair was able to climb above the 1.2800 resistance zone. However, the bears were active near the 1.2845 zone.
As a result, the pair started a downside correction below the 1.2780 and 1.2740 support levels. The pair even spiked below 1.2700 before the bulls appeared near 1.2690. A low is formed near 1.2684 and the pair is now consolidating losses.
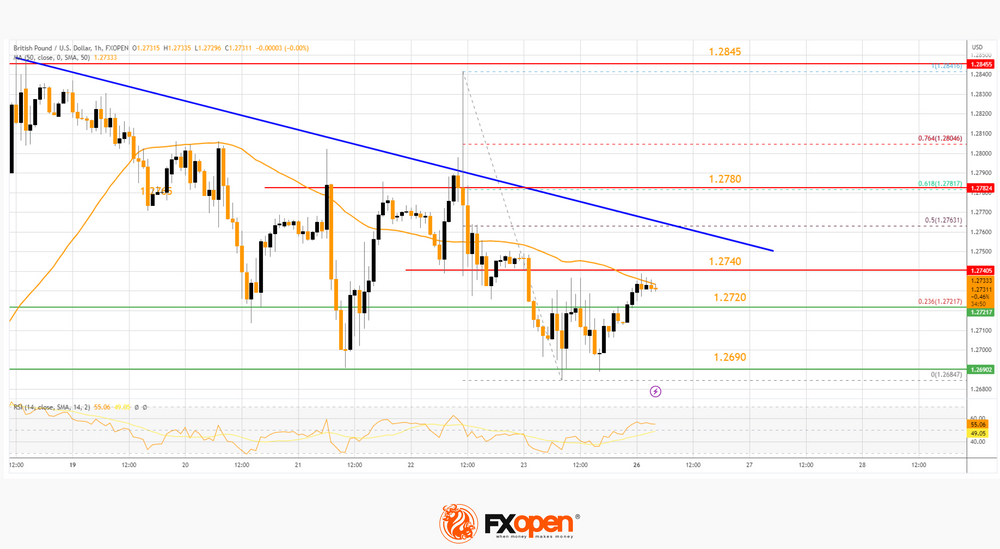
There was a move above the 23.6% Fib retracement level of the downward move from the 1.2841 swing high to the 1.2684 low. Immediate resistance on the GBP/USD chart is forming near the 50-hour simple moving average at 1.2732.
The next resistance is near a key bearish trend line at 1.2740. An upside break above the 1.2740 zone, the pair could rise toward 1.2780. It coincides with the 61.8% Fib retracement level of the downward move from the 1.2841 swing high to the 1.2684 low.
Any more gains might open the doors for a test of 1.2845. On the downside, initial support is near the 1.2720 area. The next major support is near the 1.2690 level. If there is a break below 1.2690, the pair could extend its decline. The next key support is near the 1.2640 level. Any more losses might call for a test of the 1.2580 support.
USD/CAD Technical Analysis
On the hourly chart of USD/CAD at FXOpen, the pair started a fresh decline from the 1.3240 resistance zone. The US Dollar gained bearish momentum below the 1.3210 support against the Canadian Dollar.
The bears were able to push the pair below the 50% Fib retracement level of the upward move from the 1.3138 swing low to the 1.3225 high. It is now trading below the 50-hour simple moving average.
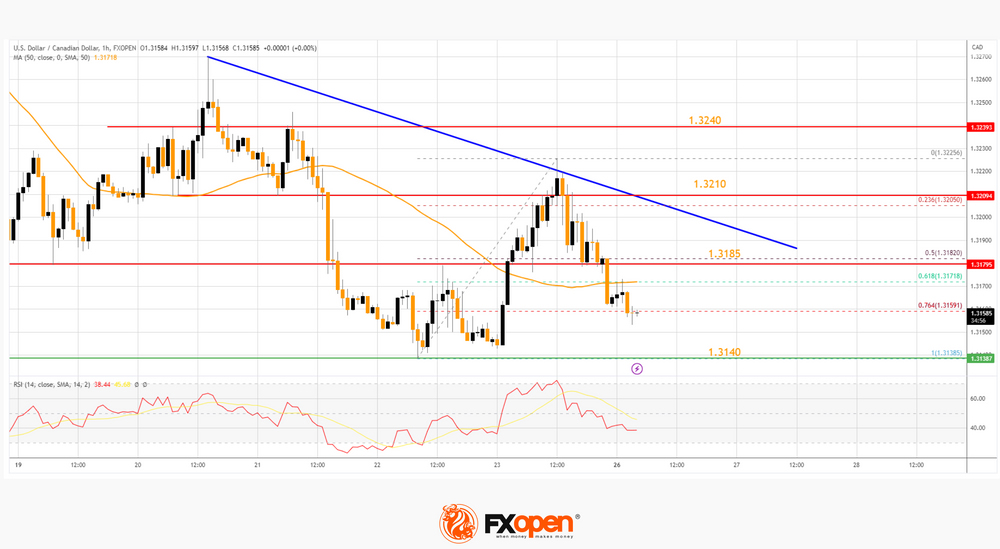
It is also showing bearish signs below the 76.4% Fib retracement level of the upward move from the 1.3138 swing low to the 1.3225 high. Immediate support is near the 1.3140 level. A close below the 1.3140 level might trigger a strong decline.
In the stated case, USD/CAD might test 1.3100. Any more losses may possibly open the doors for a drop toward the 1.3040 support.
On the upside, the pair is facing resistance near a connecting bearish trend line at 1.3185. If there is an upside break above the trend line, the pair could rise toward the 1.3210 resistance.
If the bulls pump USD/CAD above the 1.3210 resistance, there might be a decent increase toward the 1.3240 level. The next major resistance is near the 1.3280 level, above which it could rise steadily toward the 1.3335 resistance zone.