

Sample Category Title
AUD/USD Could Restart Increase, 100 SMA Is The Key
Key Highlights
- AUD/USD started a downside correction from the 0.6900 zone.
- It traded below a major bullish trend line with support near 0.6840 on the 4-hour chart.
- EUR/USD could rise further toward 1.1050 and 1.1080.
- Bitcoin price rallied above the $29,200 and $29,500 resistance levels.
AUD/USD Technical Analysis
The Aussie Dollar traded above the 0.6800 resistance against the US Dollar. AUD/USD tested the 0.6900 zone before it started a downside correction.
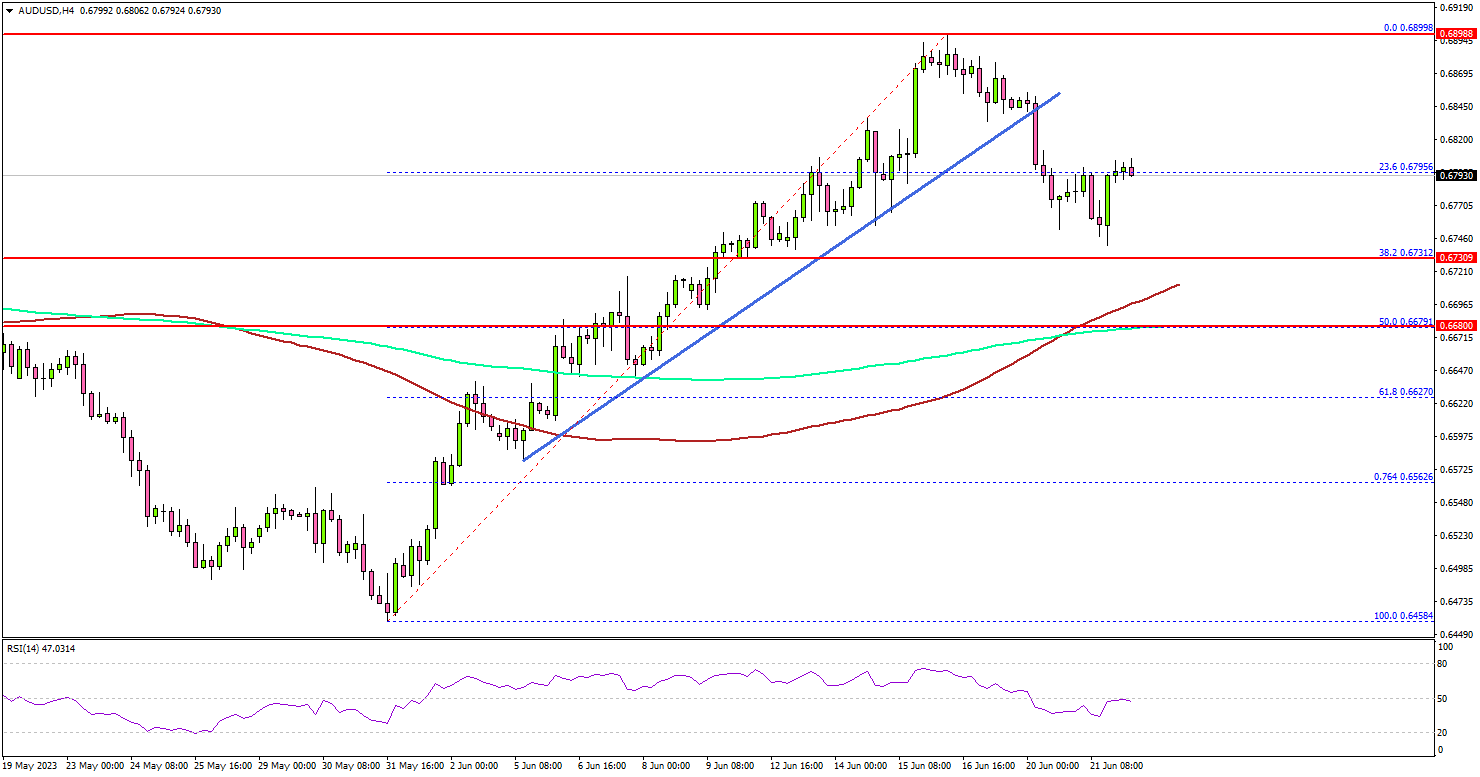
Looking at the 4-hour chart, the pair traded below the 0.6850 support level. It also traded below a major bullish trend line with support near 0.6840.
The bears pushed the pair below the 23.6% Fib retracement level of the upward move from the 0.6458 swing low to the 0.6899 high. However, the pair is still well supported above the 100 simple moving average (red, 4 hours) and the 200 simple moving average (green, 4 hours).
Immediate support is near the 0.6730 level. It is close to the 38.2% Fib retracement level of the upward move from the 0.6458 swing low to the 0.6899 high.
The next major support is near the 0.6680 level. If there is a downside break below the 0.6680 support, the pair could decline toward the 0.6600 support.
If there is a fresh increase, the pair could face resistance near 0.6850. The first major resistance is near the 0.6900 level. If there is a move above the 0.6900 resistance, the pair could rise toward 0.6950.
Looking at EUR/USD, the pair remained stable above the 1.0880 support and might for aim more upsides above the 1.1000 resistance.
Economic Releases
- BoE Interest Rate Decision - Forecast 4.75%, versus 4.50% previous.
- US Initial Jobless Claims - Forecast 260K, versus 262K previous.
Bitcoin (BTCUSD) Has Started the Next Bullish Leg
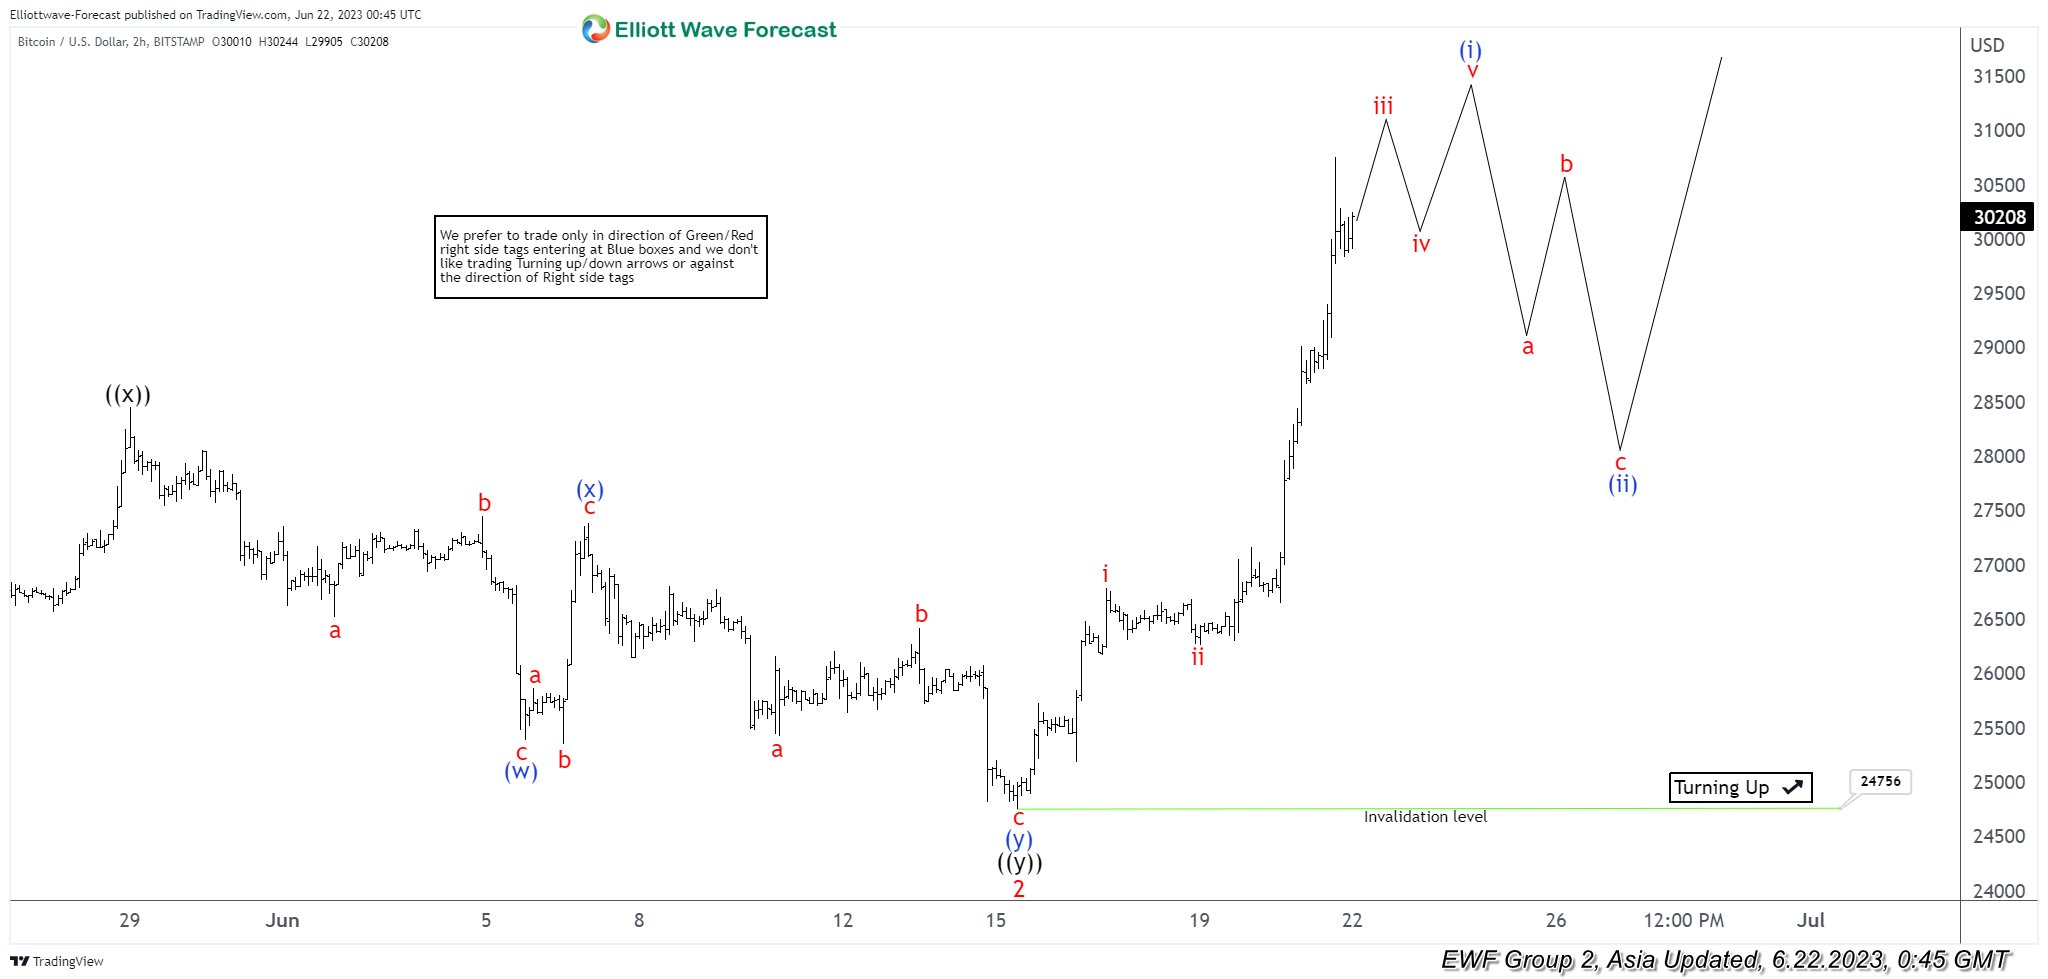
Short term view in Bitcoin (BTCUSD) from November 21, 2022 low is in progress as a 5 waves impulse with extension (nesting). Up from November 21, 2022 low, wave (1) ended at 25270 and dips in wave (2) ended at 19569 as the chart below shows. The crypto-currency has extended higher in wave (3) with internal subdivision as a 5 waves impulse. Up from wave (2), wave ((i)) ended at 26533 and pullback in wave ((ii)) ended at 23940. Bitcoin has extended higher in wave ((iii)) towards 29380, pullback in wave ((iv)) ended at 27833. Final leg wave ((v)) ended at 31035 which completed wave 1.
Pullback in wave 2 ended at 24756 with internal subdivision as a double three Elliott Wave structure. Down from wave 1, wave (a) ended at 26981, wave (b) ended at 29851, and wave (c) ended at 25800. This completed wave ((w)) in higher degree. Wave ((x)) rally ended at 28452 with internal subdivision as a zigzag. Up from wave ((w)), wave (a) ended at 27666, pullback in wave (b) ended at 25878, and wave (c) ended at 28452. This completed wave ((x)) in higher degree. The crypto currency extends lower in wave ((y)) with internal subdivision as a double three. Down from wave ((x)), wave (w) ended at 25350, wave (x) ended at 27388, and wave (y) ended at 24756. Near term, as far as pivot at 19553 low stays intact, expect Bitcoin to extend higher.
BTCUSD 2 Hour Elliott Wave Chart
BTCUSD Elliott Wave Video
https://www.youtube.com/watch?v=gVrzg3c6zLA
EURAUD Wave Analysis
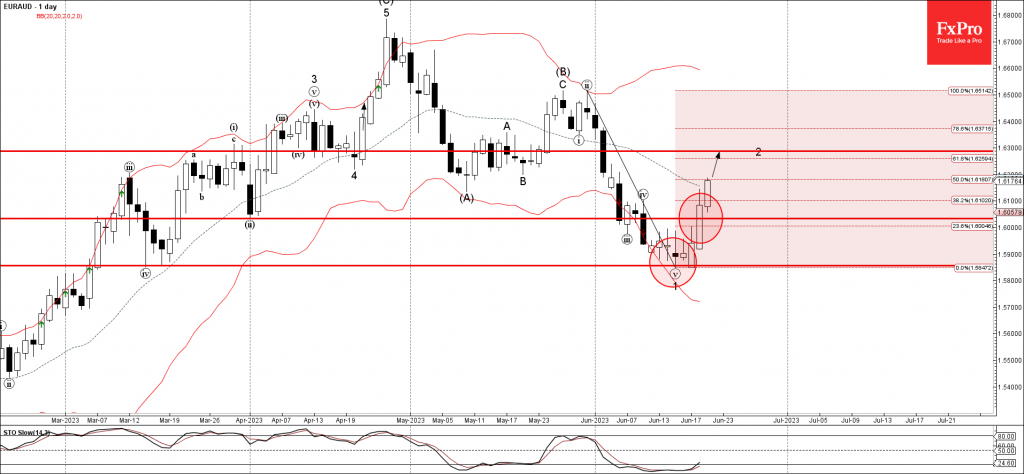
- EURAUD broke round resistance level 1.6000
- Likely to rise to resistance level 1.6300
EURAUD currency pair recently broke the round resistance level 1.6000, former strong support from April of last year.
The breakout of the resistance level 1.6000 accelerated the active short-term correction 2 .
Given the strongly bearish AUD sentiment seen across the FX markets today , EURAUD can be expected to rise further to the next resistance level 1.6300 (target price for the completion of the active correction 2).
How Can BoE Monetary Policy Statement affect the GBP?
In May, against expectations of a slowdown, inflation stubbornly held at 8.7%, creating additional pressure on the Bank of England. This comes just a day before the anticipated 13th consecutive interest rate hike to curb price growth. The headline figure places British inflation at the top among major advanced economies. These numbers aren't exactly comfortable for Prime Minister Rishi Sunak, who aimed to cut inflation by half this year before the 2024 election. Moreover, they could lead to increased mortgage costs for homeowners. Economists suggest that the Monetary Policy Committee may need to substantially raise the Bank Rate in the coming months to address the situation. As a result of the release of these figures, the sterling briefly rose against the U.S. dollar and the euro, while two-year government bond yields reached their highest levels since July 2008. Market expectations have shifted, with a 40% chance that the Bank of England will increase rates by half a percentage point to 5% instead of the previously anticipated quarter-point move. By December, there is a 60% chance of rates reaching 6%. The current figures strengthen the case for the government to stay on its chosen path. However, the opposition party Labour has emphasized its focus on the cost of living if it were to come into power. Core inflation, which excludes volatile items, rose unexpectedly to 7.1%, the highest since March 1992, while services price inflation reached its peak since 1992 at 7.4%. Some relief may come from a slowdown in producer price inflation, although expectations of the BoE raising rates six more times to 6% may be excessive.
GBPUSD - 4 Hours Timeframe
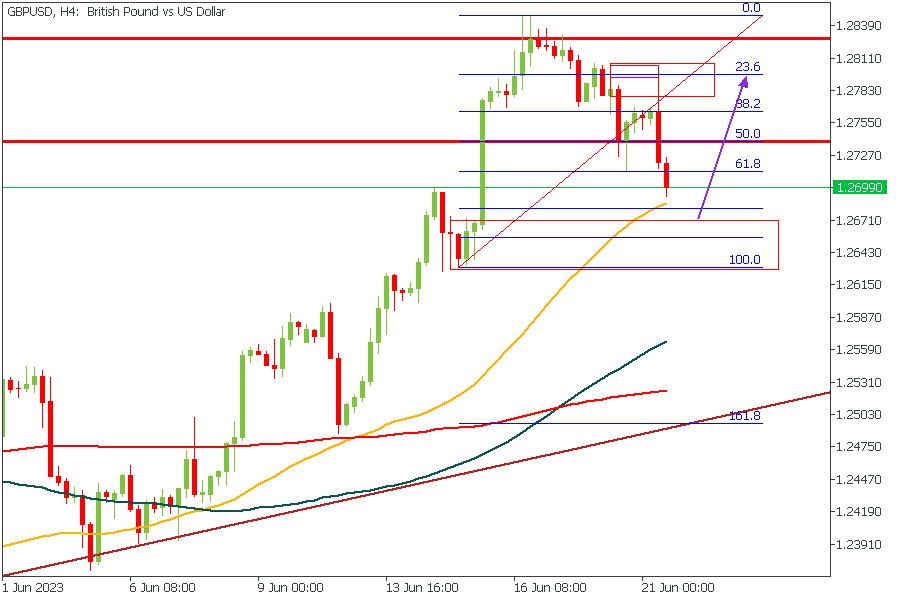
GBPUSD was rejected earlier from the weekly pivot, but the price action needs to be more convincing. This may be due to the drop-base-rally demand zone, as the chart above highlights. Also, the moving averages are still clearly aligned in increasing order, often indicating that a bullish trend is in motion. Considering the demand zone, the Fibonacci retracement level, and the 50-period moving average, I will wait for a clear entry based on my convictions (as I’d advise you to do too).
Analyst’s Expectations:
- Direction: Bullish
- Target: 1.27204
- Invalidation: 1.26307
GBPAUD - Daily Timeframe
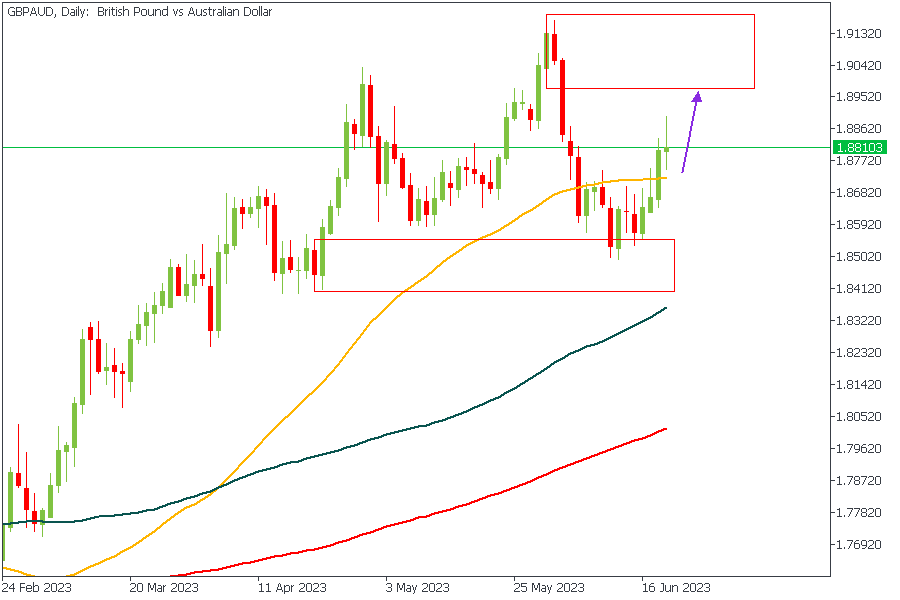
GBPAUD is heading even higher toward the marked supply zone. The bullish price action may have lost momentum, but we will see the continuation of the bullish pressure in a short while. At this time, my sentiment on GBPAUD is bullish, mainly based on the following sentiments;
- Strong bullish previous day candle
- Microstructure is already broken in a bullish direction
- Bullish moving average array
Analyst’s Expectations:
- Direction: Bullish
- Target: 1.89740
- Invalidation: 1.87380
GBPJPY - 4 Hours Timeframe
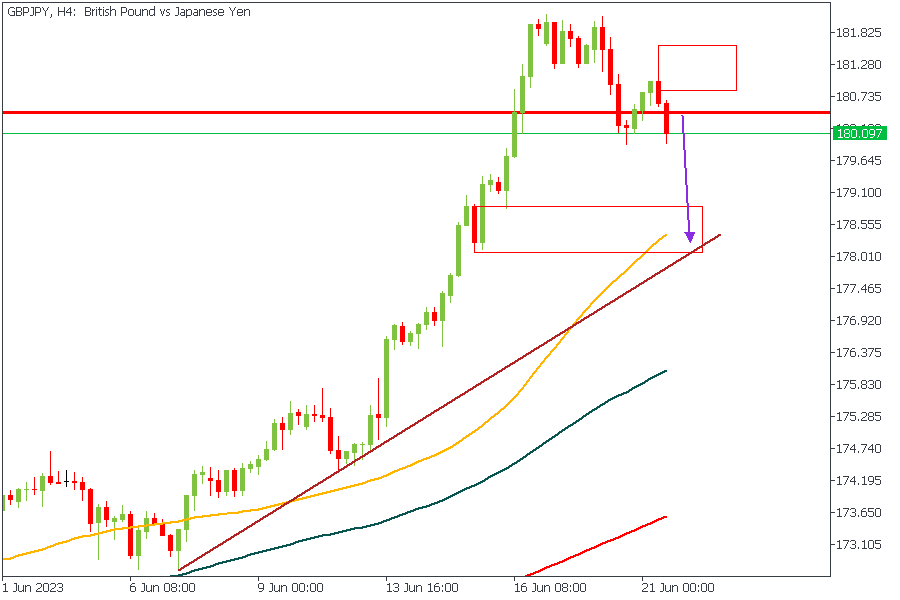
GBPJPY has just been pushed back out of the weekly pivot zone by immense selling pressure in the market. This seems to suggest that we should see a fresh wave of sellers entering into the market to push GBPJPY even further down toward the 50-period moving average at the very least.
Analyst’s Expectations:
- Direction: Bearish
- Target: 179.307
- Invalidation: 181.621
GBPCAD - Daily Timeframe
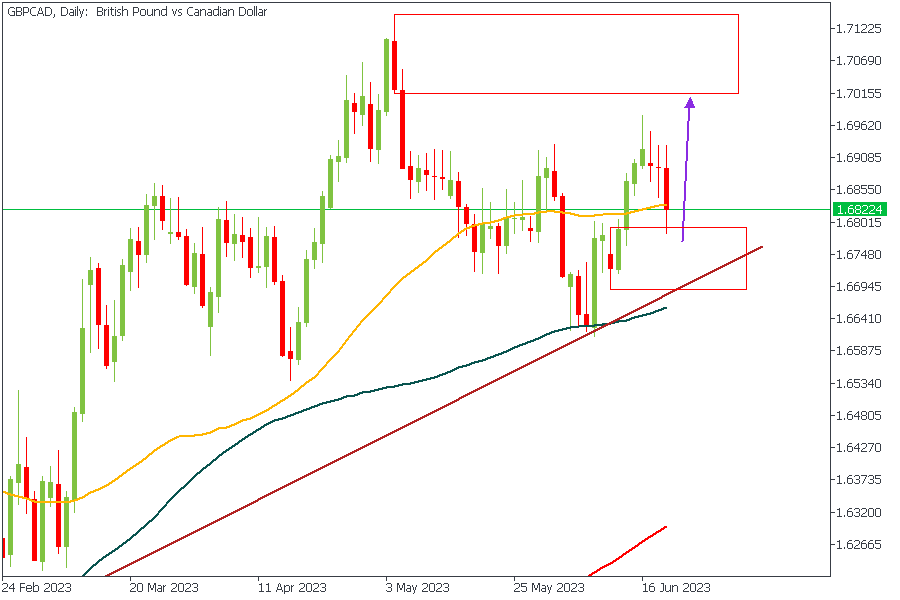
The current position of GBPCAD, as revealed by the chart above, shows that the price action is currently resting on a rally-base-rally demand zone, with a confluence from the 50-Day moving average. Based on the bullish array of the moving averages, demand zone, and trendline support, we may expect to see even higher prices on the GBPCAD currency chart over the next few days.
Analyst’s Expectations:
- Direction: Bullish
- Target: 1.70078
- Invalidation: 1.66851
CONCLUSION
The trading of CFDs comes at a risk. Thus, to succeed, you have to manage risks properly. To avoid costly mistakes while you look to trade these opportunities, be sure to do your due diligence and manage your risk appropriately.
Swiss Franc Drifting Ahead of SNB Rate Decision
- Swiss National Bank expected to raise interest rates on Thursday
- Fed Chair Powell testifies before Congress Wednesday and Thursday
The Swiss franc is showing little movement on Wednesday, trading at 0.8984 in the North American session.
Will Swiss National Bank deliver a hawkish surprise?
The Swiss National Bank will announce its rate decision on Thursday, and the meeting is live, as the markets have priced a 0.50% hike at 60% and a 0.25% at 40%. The current benchmark rate is 1.50%.
SNB Chair Jordan hasn’t missed an opportunity to send out warnings that inflation remains too high. Earlier this month, Jordan stated that inflation “is more persistent than we initially thought” and that with rates at a low 1.5%, it wasn’t a good idea to keep rates low and face higher inflation later. Jordan’s rhetoric has remained hawkish even though inflation is low in Switzerland and fell to 2.2% in May.
Other central bankers would be happy to switch roles with Jordan, with inflation around 2%, but the SNB is not happy with the inflation picture. Inflation remains above the Bank’s 0%-2% target and Jordan appears willing and able to continue hiking in order to curb inflation. The SNB, once known for its negative rates, has been aggressive, raising rates by 225 points in the current tightening cycle. It should be remembered that since the SNB meets only four times a year, the SNB may opt for a 0.50% hike at Thursday’s meeting in order to get “a bigger bang for the buck”.
Powell testifies before Congress
Fed Chair Powell testifies before Congress on Wednesday and Thursday and lawmakers will likely press him on the Fed’s rate policy. The Fed paused at this month’s meeting but is expected to raise rates at the July meeting. Powell has expressed confidence that he can guide the economy to a soft landing and avoid a recession and large layoffs, even with further rate hikes. Many lawmakers, however, don’t share Powell’s optimism and are deeply concerned that the Fed’s aggressive tightening could cause significant damage to the US economy.
USD/CHF Technical
- USD/CHF is testing resistance at 0.8984. Above there is resistance at 0.9065
- 0.8902 and 0.8777 are providing support
GBPCAD Reacting Perfectly From Equal Legs Area
In this technical blog, we will look at the past performance of the 4-hour Elliott Wave Charts of GBPCAD. In which, the decline from 03 May 2023 high ended 5 waves in a leading diagonal sequence and made a bounce higher. Therefore, we knew that the structure of GBPCAD is incomplete to the downside & the bounce should get fail in 3, 7, or 11 swings looking for another extension lower to complete the sequence. So, we advised members to sell the bounces in 3, 7, or 11 swings at the equal legs areas. We will explain the structure & forecast below:
GBPCAD 4-Hour Elliott Wave Chart From 6.15.2023
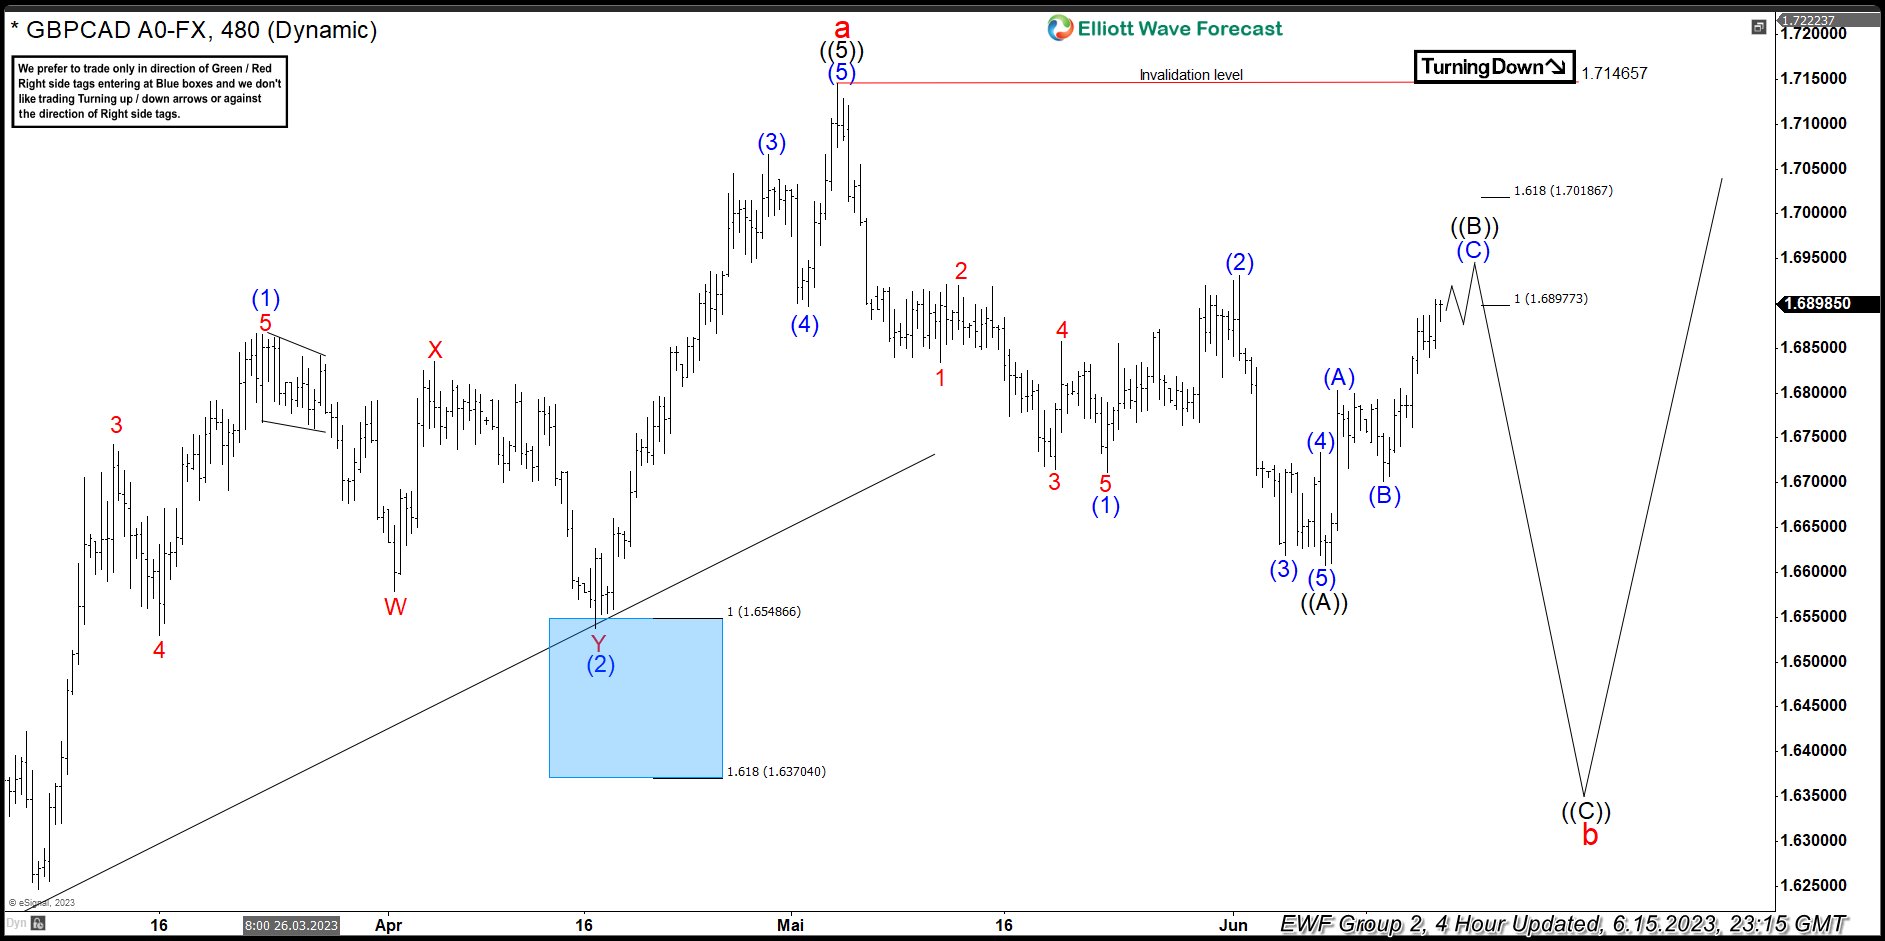
Here’s 4hr Elliott wave Chart from the 6/15/2023 update. In which, the decline to 1.6607 low ended a diagonal from the 3 May 2023 high in wave ((A)) & made a bounce in wave ((B)). The internals of that bounce unfolded as an Elliott wave zigzag correction where wave (A) ended at 1.6802 high. Then a pullback to 1.6701 ended wave (B) and started the (C) leg higher towards 1.6897- 1.7018 equal legs area from where sellers were expected to appear looking for more downside or for a 3 wave reaction lower at least.
GBPCAD Latest Elliott Wave Chart From 6.21.2023
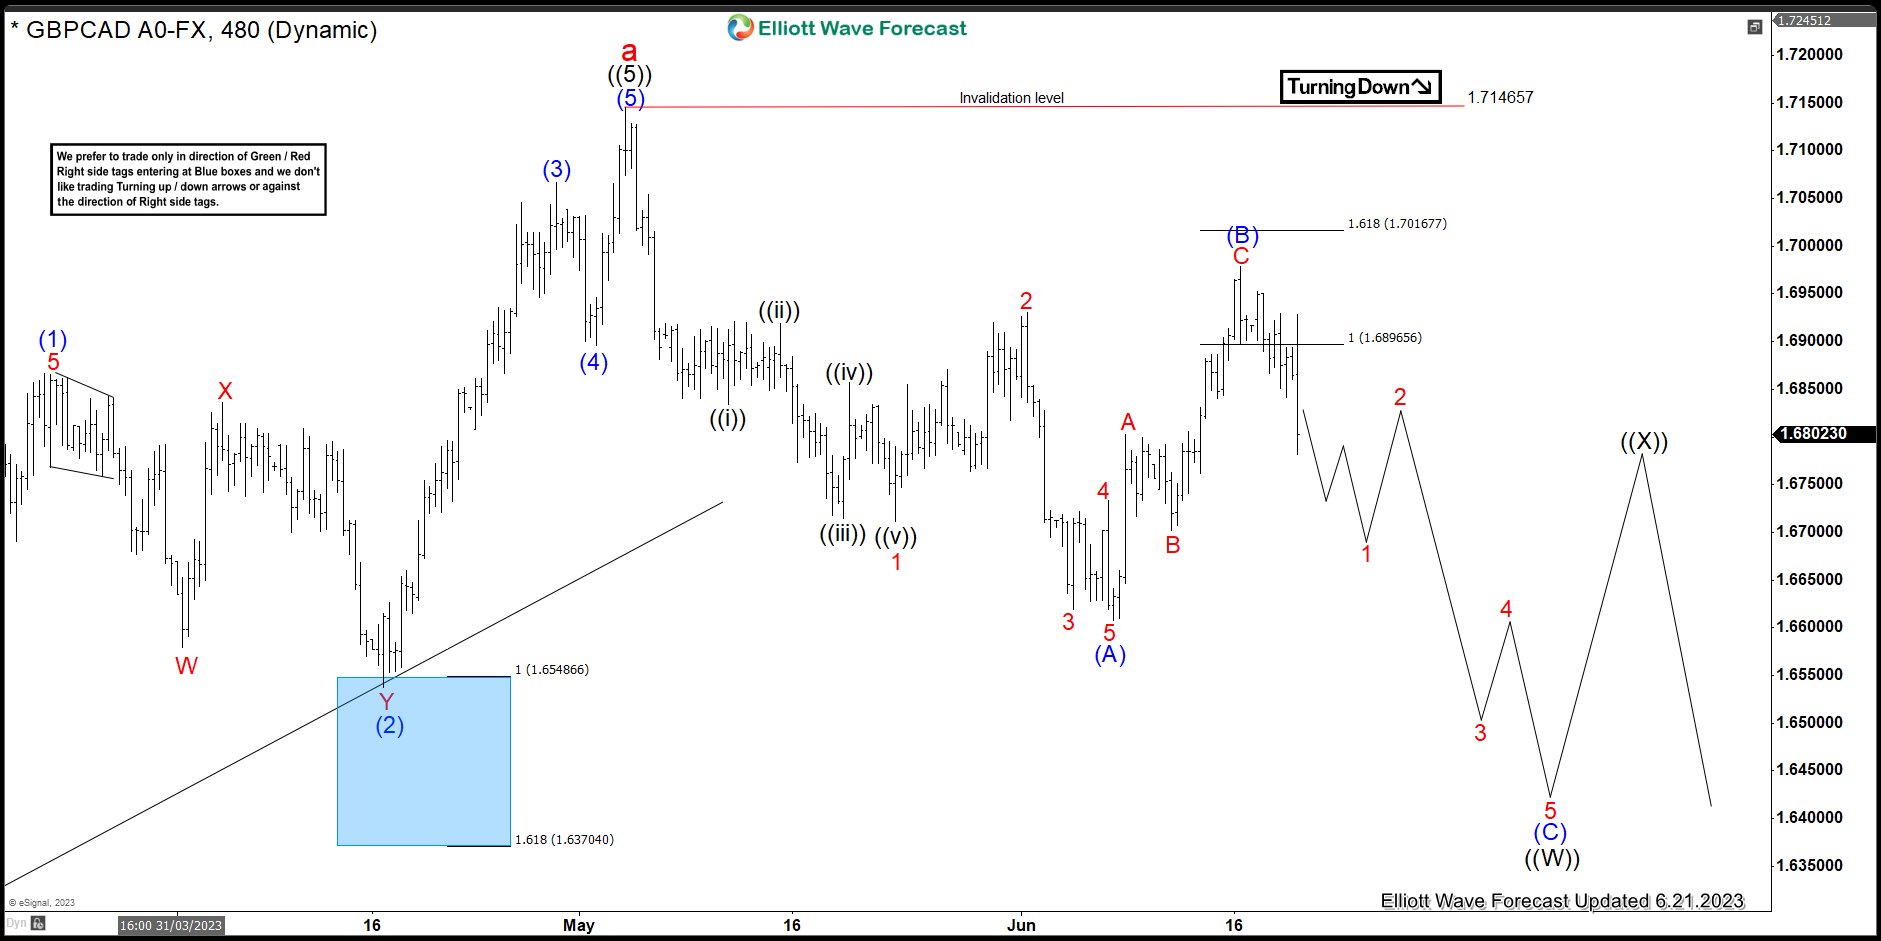
This is the Latest 4hr view from the 6/21/2023 update. In which the GBPCAD is showing a strong reaction lower taking place from the equal legs area allowing shorts to get into a risk-free position shortly after taking the position. However, the pair still needs to see a break below 1.6607 low to confirm the next extension lower towards 1.6440- 1.6314 area lower next.
NZDUSD Retreats after Hitting Wall at Descending Trendline
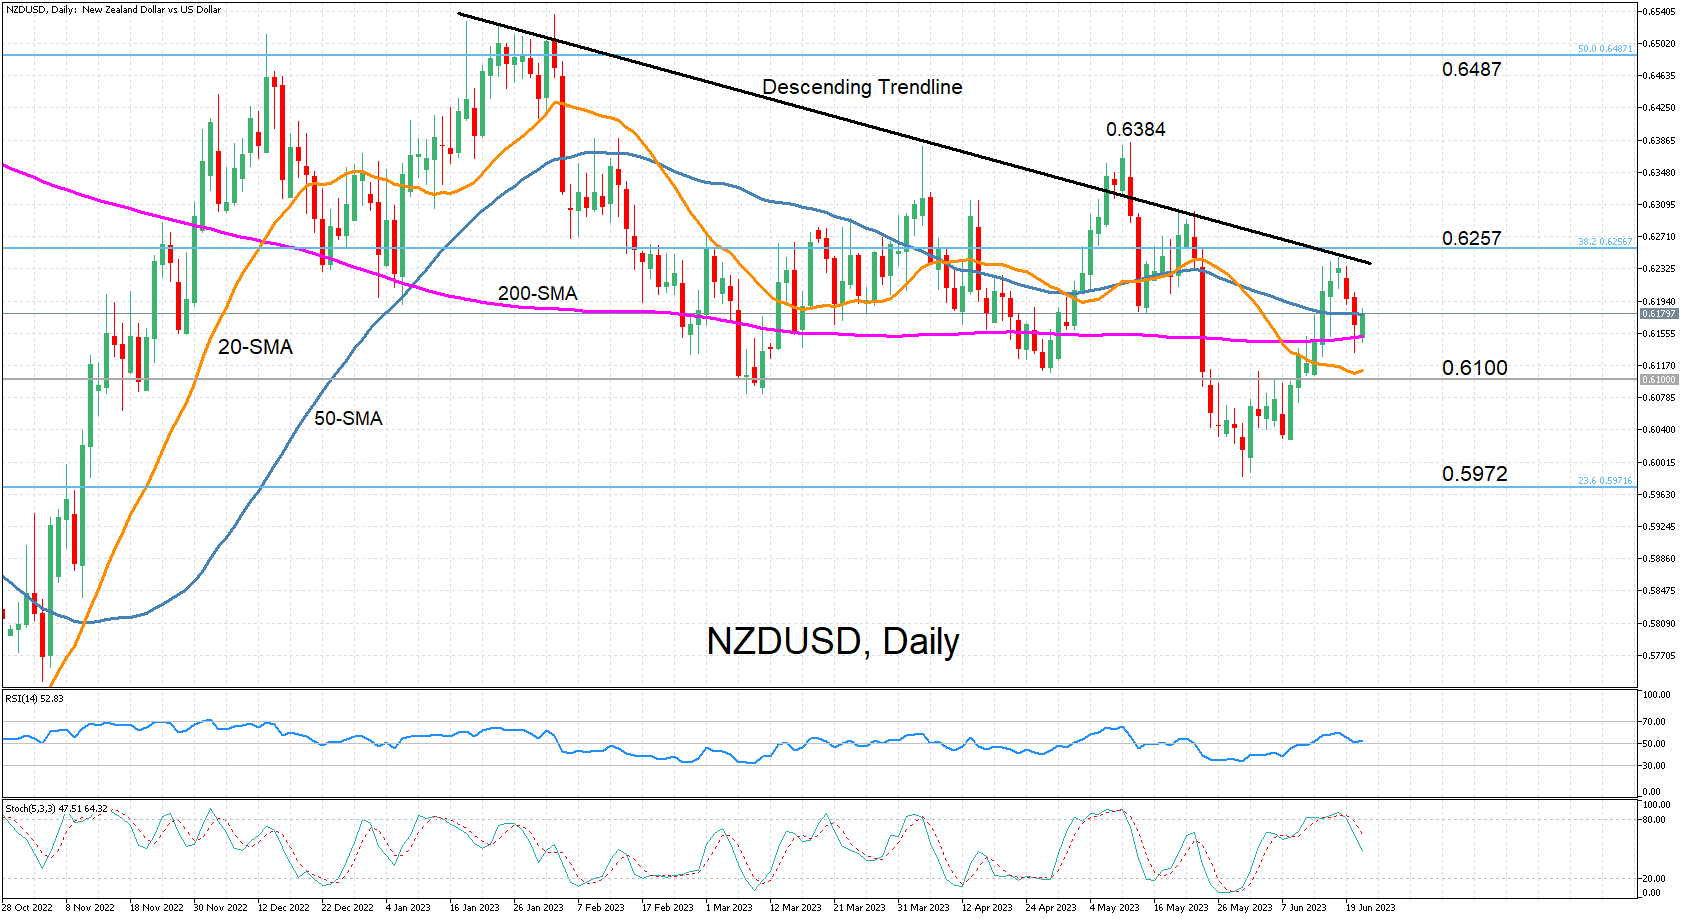
NZDUSD appears to have found its feet around the 200-day simple moving average (SMA) following the pullback from the June top of 0.6246. But the fact that the latest upleg was unable to breach the medium-term descending trendline casts into doubt the prospect for a bullish break in the near term.
The momentum indicators are sending mixed signals about the short-term picture. The stochastic oscillator continues to point down but the RSI suggests the selling pressure is easing as it has settled just above the 50-neutral level.
If the bulls manage to regain the upper hand and push above the 50-day SMA, the descending trendline will again turn into a battleground, especially with the 38.2% Fibonacci retracement of the 2021-2022 downtrend lying slightly higher at 0.6257. Higher up, the May high of 0.6384 will be the next major test ahead of the February top of 0.6537.
However, should the bounce off the 200-day SMA quickly run out of steam and NZDUSD resumes its downfall, the 20-day SMA is expected to do its bit in supporting the bulls as it’s hovering just above the key 0.6100 handle. But if broken, the pair could slide all the way until the 23.6% Fibonacci of 0.5972, creating another lower low.
In the bigger picture, the pair remains within a bearish channel despite several failed attempts at a rebound. For the bulls to have any winning chance of switching the outlook to positive, they not only have to lift the price above the descending trendline, but also above the May peak.
Bitcoin Breaks Downward Sloping Resistance Line
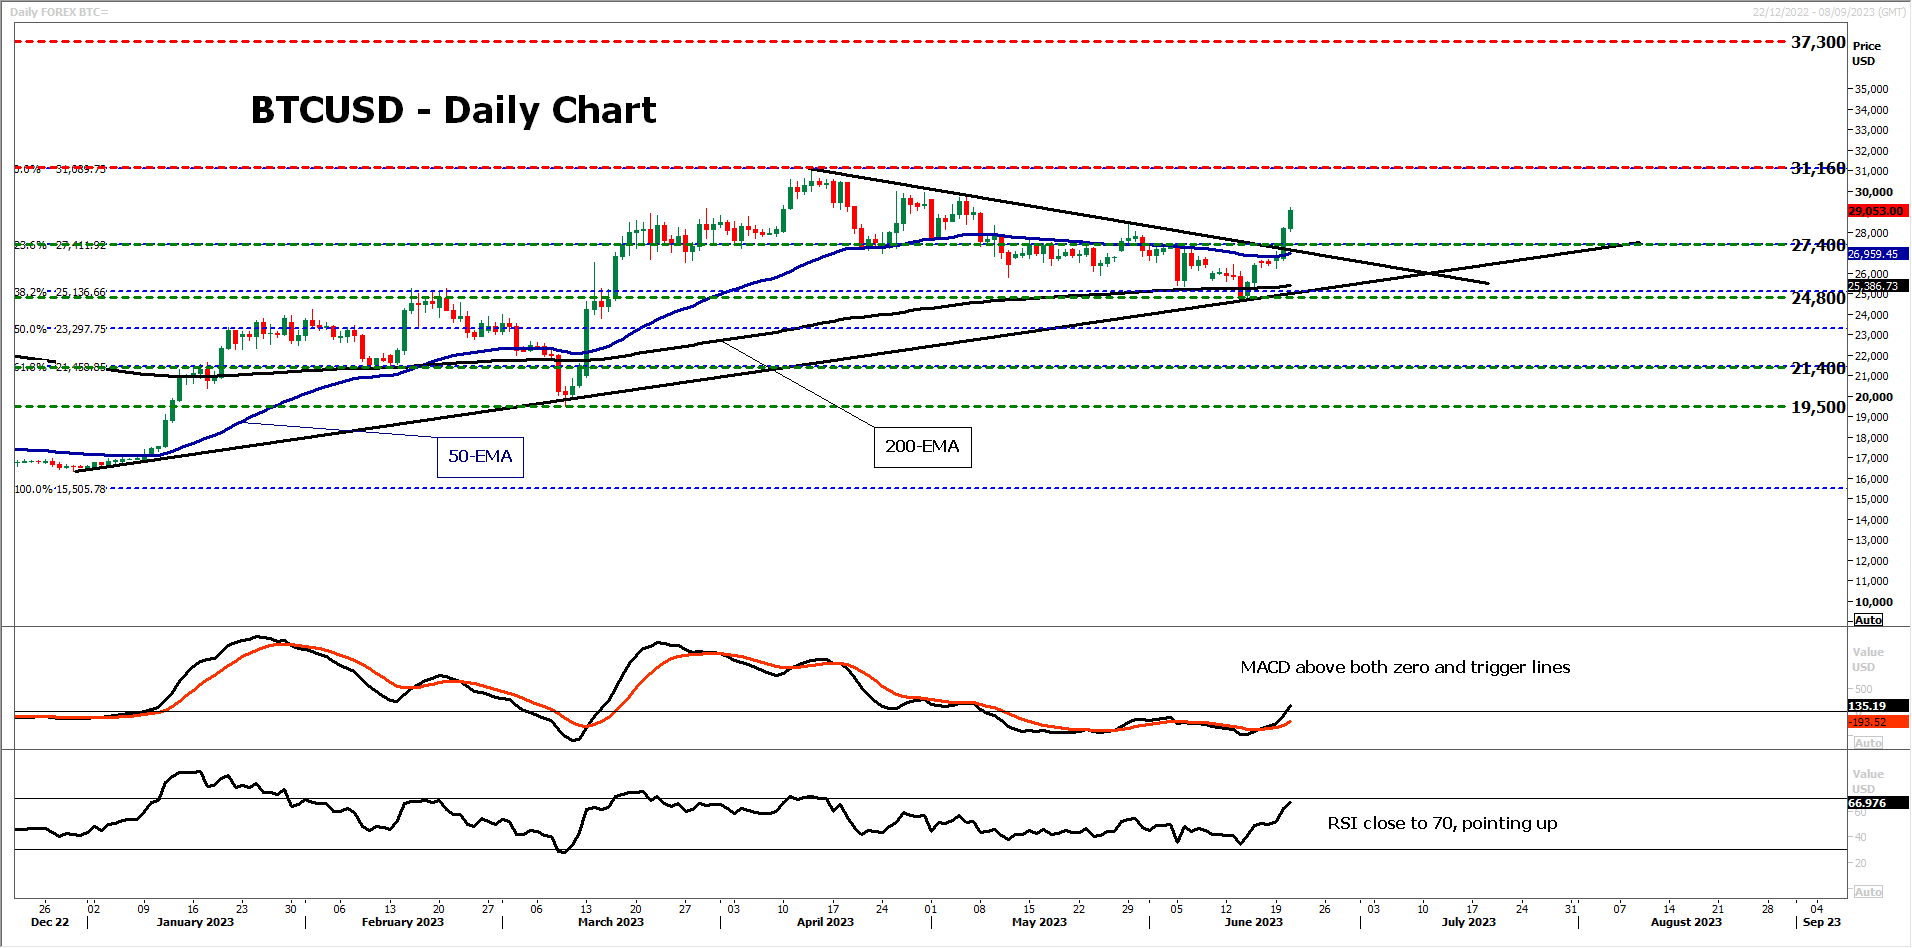
BTCUSD (Bitcoin) entered a rally mode on Tuesday, breaking above the resistance (now turned into support) barrier of $27,400, which coincides with the 23.6% Fibonacci retracement level of the September 2022 – April 2023 up leg. The rally also took the crypto above the downward sloping resistance line drawn from the peak of April 14, a move likely signaling the continuation of the prevailing uptrend, marked by the upside support line taken from the low of December 30.
The RSI and the MACD support the notion that Bitcoin may be poised to continue trading north for a while longer. The former is pointing up, approaching its 70 line, while the latter is lying above both its zero and trigger lines, pointing up as well.
If the bulls are willing to stay in the driver’s seat, they could extend their march and perhaps challenge the April 14 high of $31,160, the break of which could carry larger bullish implications, perhaps paving the way towards the $37,300 zone, marked by the inside swing low of May 1, 2022.
On the downside, the move signaling that the bears have stolen all the bulls’ weapons may be a dip below the $24,800 zone, which is slightly below the 38.2% Fibo level. Such a move will also confirm the break below the 200-day exponential moving average (EMA) and the break below the uptrend line drawn from the low of December 30. Any declines are likely to meet support at $21,400, but if that zone is not able to withstand the pressure either, the bears could then aim for the low of March 10 at $19,500.
To recap, Bitcoin emerged above the downward sloping resistance line drawn from the high of April 14, a break that probably signals the continuation of the prevailing uptrend, marked by the trendline taken from the low of December 30.
Bundesbank Nagel: It’s a first order error to give up inflation fight too early
Bundesbank President Joachim Nagel described inflation as a "greedy beast" that's "stubborn. And it's a "first order error" to give up the fight early.
During his remarks, Nagel noted "there's still a way to go," to bring inflation down to the 2% target, and "we have to slow economic activity to bring inflation down."
Nagel used vivid language to underline the ongoing challenge: "Inflation to me is like a greedy beast and we do have to fight against this very greedy beast."
"As inflation fighters we have to be very stubborn because inflation is so stubborn," added.
Nagel cautioned against conceding the fight too early. "It would be a first order error to give up too early," he warned.