Sample Category Title
AUDUSD Retraces Back into Rectangle After Failed Breakout
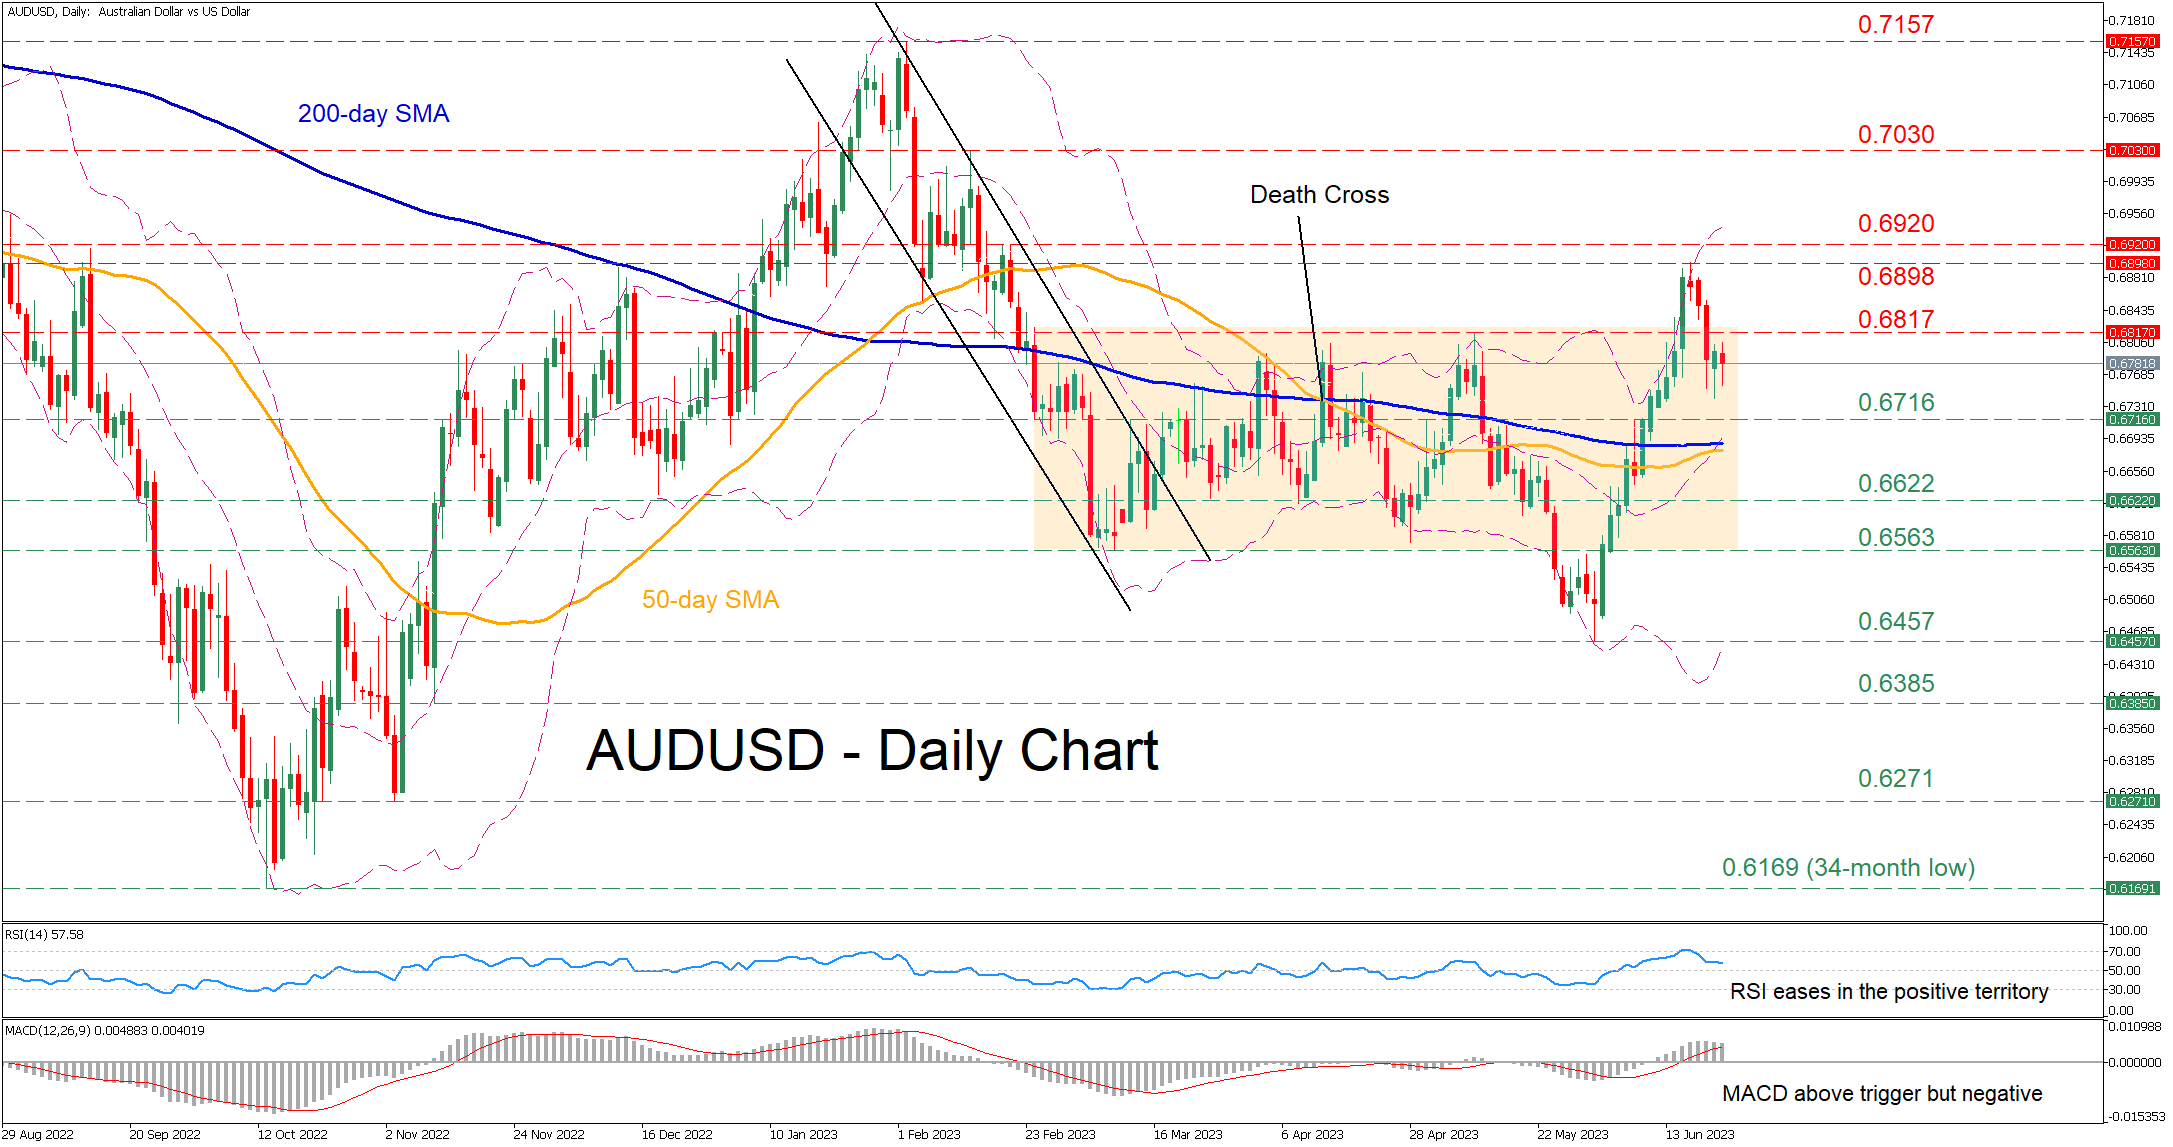
AUDUSD managed to cross above its rectangle pattern and post a fresh four-month peak of 0.6898 in the past week. However, this advance proved to be short-lived and the pair quickly fell back within its recent range, trading flat in the last couple of daily sessions.
The momentum indicators are reflecting a loss of positive momentum. The RSI is ticking down slightly above its 50-neutral mark, while the MACD is softening but remains positive and above its red signal line.
Should the price extend its recent correction, the 0.6716 hurdle could act as the first line of defense. Failing to halt there, the pair could descend towards 0.6622 before the spotlight turns to the floor of the range at 0.6563. A violation of the latter might open the door for the 2023 bottom of 0.6457.
On the flipside, if the bulls manage to regain the upper hand, they could propel the price towards 0.6817, which is the upper end of the rectangle pattern. Conquering this barricade, buyers could aim at the four-month high of 0.6898. Clearing that zone, the pair may then challenge the 0.6920 barrier.
Overall, AUDUSD corrected to the downside after its recent advance ran out of steam. Nevertheless, for the pullback to extend, the price needs to drop below the converging 50- and 200-day simple moving averages (SMAs).
WTI Oil Futures Stay Directionless Inside Bearish Channel
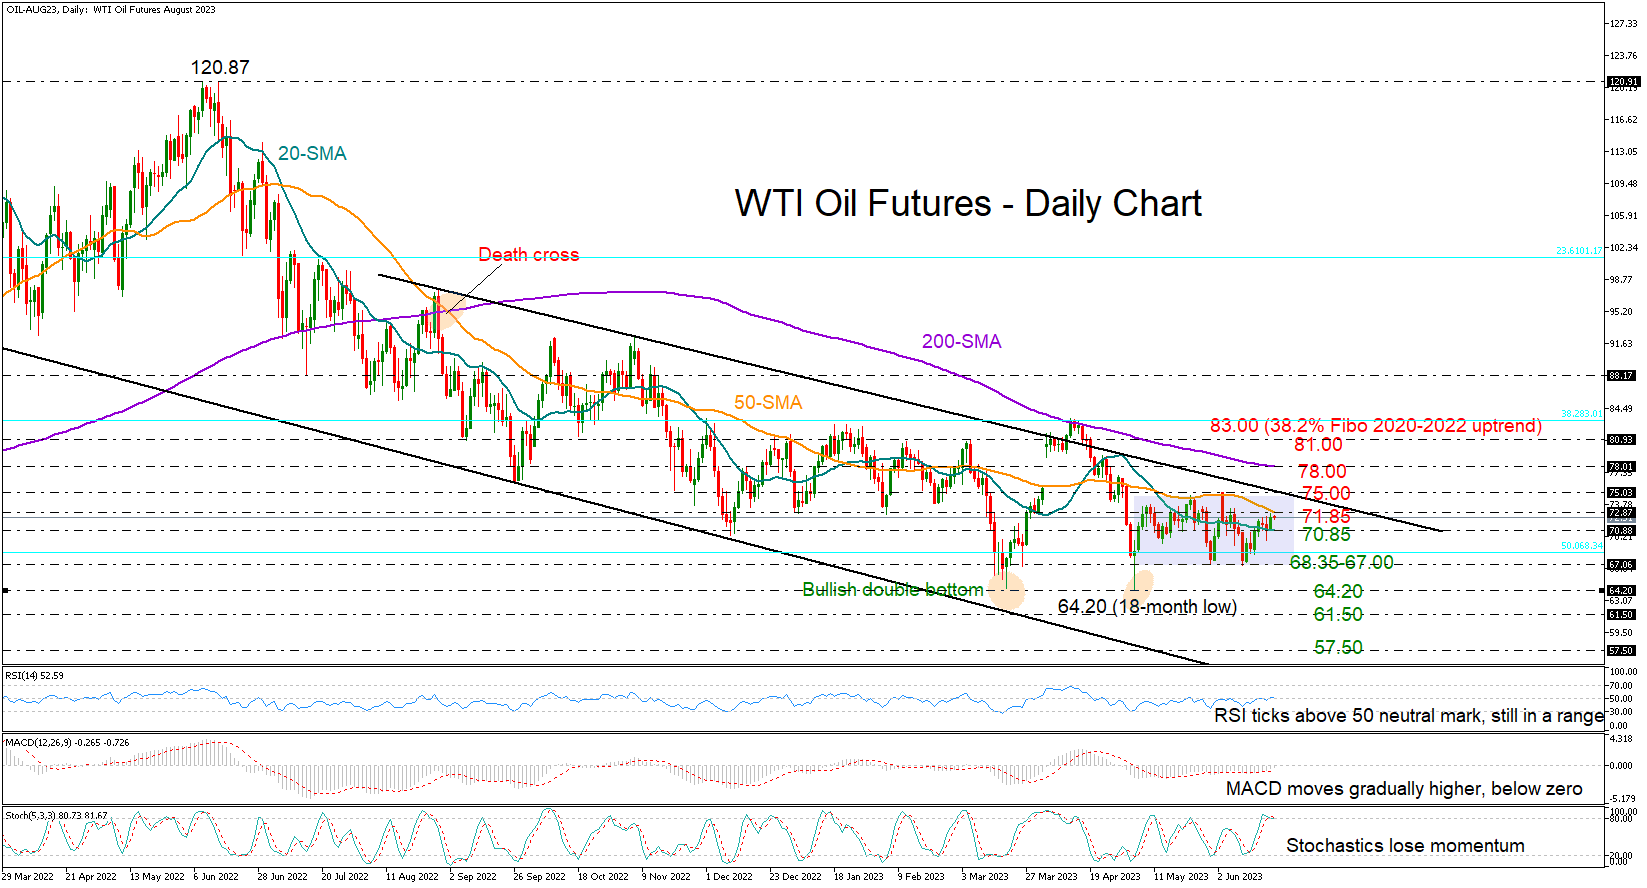
WTI oil futures extended their horizontal trajectory within a broad bearish channel for another week, moving back and forth between their 20- and 50-day simple moving averages at 70.89 and 72.86 respectively.
The RSI and the MACD are trying to enter the bullish area, though given their previous failed attempts and taking into account the strengthening overbought signals coming from the stochastic oscillator, traders could stay on the sidelines.
The 50-day SMA will be closely watched on the upside, though slightly higher, the channel’s upper trendline at 75.00 could be a tougher obstacle. Then, the 200-day SMA at 78.00 could be another headache for the bulls. If the price climbs that wall, the recovery could pick up steam towards the 81.00-83.00 zone, which encapsulates the 38.2% Fibonacci retracement of the 6.62-130.50 uptrend.
In the bearish scenario, where the price tumbles below the 20-day SMA, the spotlight will fall again on the 68.35-67.00 base, which includes the 50% Fibonacci area. A continuation lower could examine the double bottom territory around 64.00, a break of which is expected to squeeze the price towards the 2021 floor of 62.00-61.50. If this collapses as well, the next stop could be near the 57.50 constraining zone, taken from the first quarter of 2021.
All in all, WTI oil futures remain directionless within a downward-sloping channel. The current neutral status may not change unless the price speeds above the channel and the 200-day SMA at 78.00 or sinks below 67.00.
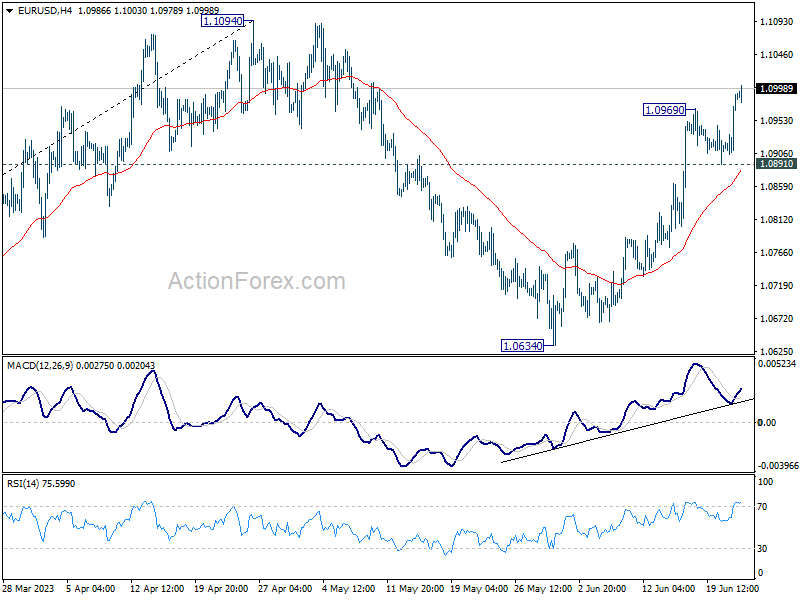
EUR/USD Resumes the Recovery, Support on Dips is at 1.09
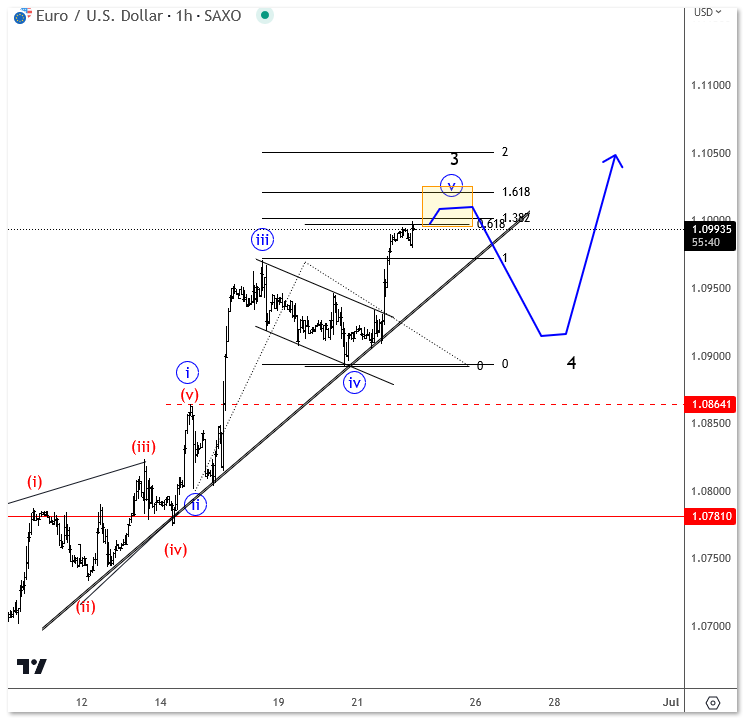
EURUSD is higher as expected, now seen in fifth wave of an extended wave 3 that is testing the projection Fib area at around 11 level as we talked in past updates. So, the pair is bullish, no doubt, but again, if you are more like an intraday trader, you want to buy the dips, so the next wave 4 retracement can be a new opportunity to join the uptrend. Support can then be at former wave four, possibly at 1.09 which can come in play once the trendline support is broken.
Why Price of Bitcoin Rose to USD 30k
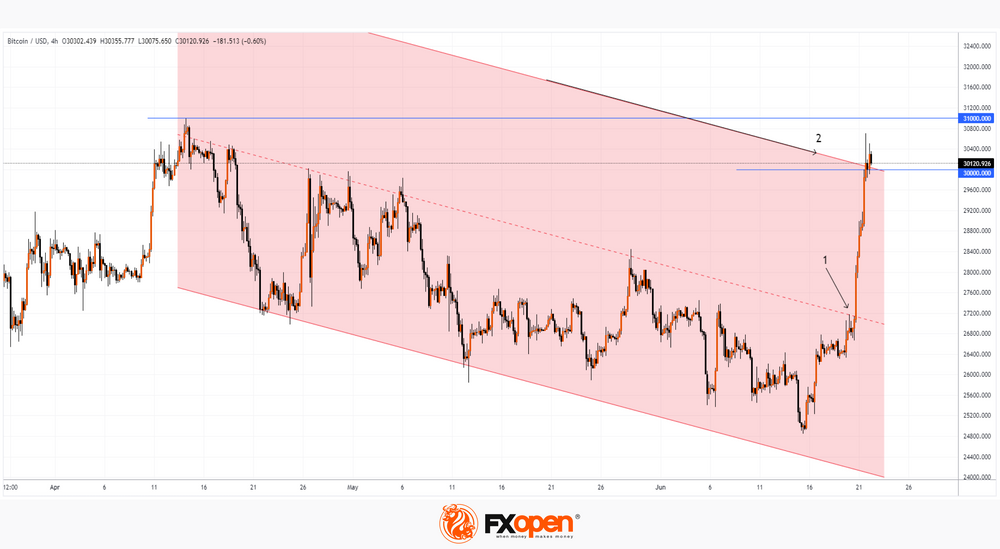
Yesterday, the BTC price topped USD 30k for the first time since April. There may be several reasons, among them:
→ Powell's speech to lawmakers on Capitol Hill yesterday. The Fed chief said further rate hikes are a pretty good guess as to where the Fed is heading. The dollar index reacted to his hawkish statement with a fall. At the same time, it pushed up the bitcoin rate against the dollar. In addition, Powell paid tribute to cryptocurrencies, saying that they are stable and adding that the Fed views stablecoins as a form of money;
→ after the negative news background related to the Fed lawsuits, positive events followed, indicating the interest of institutional firms in the US in the crypto market. For example, the BlackRock fund (more than USD 8 trillion under management) filed an application last week to launch an ETF based on bitcoin. And a new cryptocurrency exchange, EDX Markets, backed by Citadel Securities, Fidelity and Schwab, has gone live;
→ change in the balance of supply and demand in the market after the price of bitcoin breaks through the psychological level of USD 25k.
The BTC/USD chart shows that the rise in the price of bitcoin this week met resistance (1) from the upper line of the descending channel, shown in red. But after yesterday's violent rally, the price reached a resistance block, which is formed by:
- the psychological level of USD 30k for bitcoin;
- line (2) parallel channel.
It is possible that in the wake of the hype, the bulls will attack the high of the year, but at the same time, their success increases the likelihood of a correction.
EUR/USD Daily Outlook
Daily Pivots: (S1) 1.0932; (P) 1.0961; (R1) 1.1017; More...
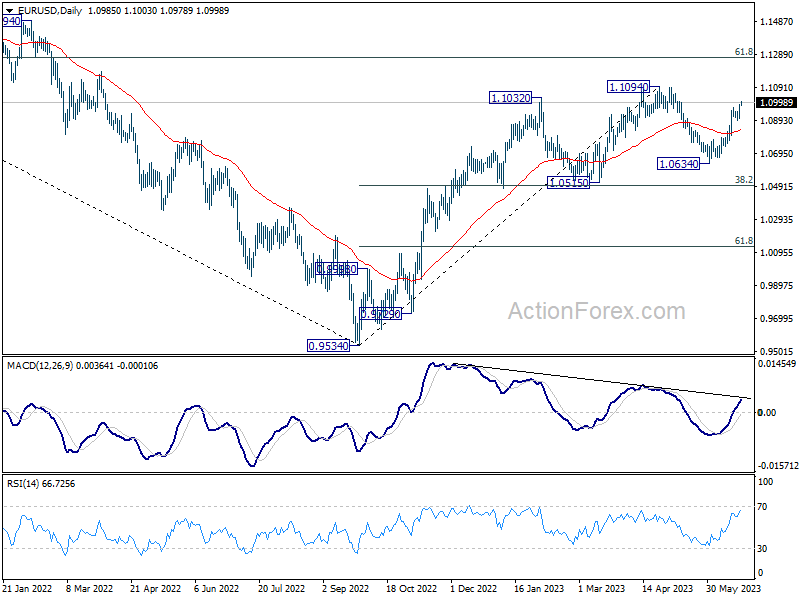
EUR/USD's rally from 1.0634 resumed after brief consolidations. Intraday bias is back on the upside for retesting 1.1094 high first. Decisive break there will confirm resumption of whole up trend from 0.9534. However, firm break of 1.0891 will extend the corrective pattern from 1.1094 with another falling leg, targeting 1.0634 and below.
In the bigger picture, as long as 1.0515 support holds, rise from 0.9534 (2022 low) would still extend higher. Sustained break of 61.8% retracement of 1.2348 (2021 high) to 0.9534 at 1.1273 will solidify the case of bullish trend reversal and target 1.2348 resistance next (2021 high).
GBP/USD Daily Outlook
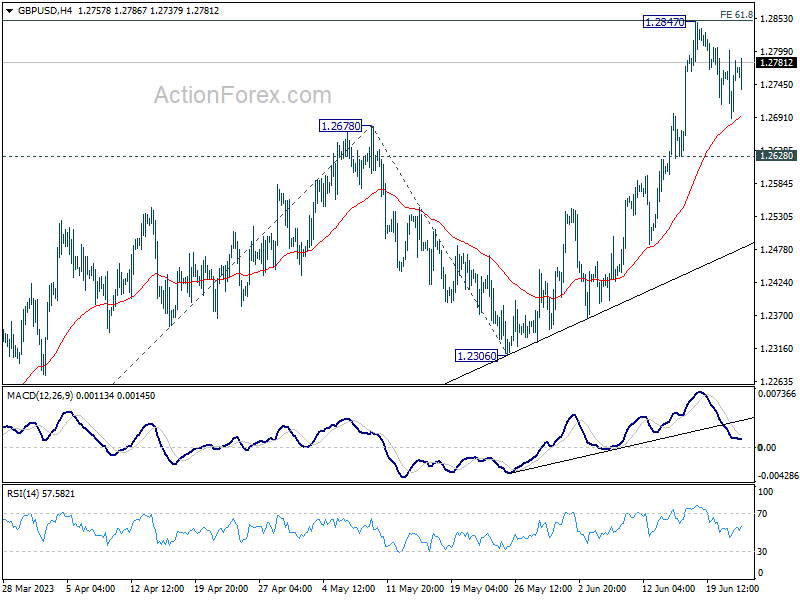
Daily Pivots: (S1) 1.2705; (P) 1.2754; (R1) 1.2815; More...
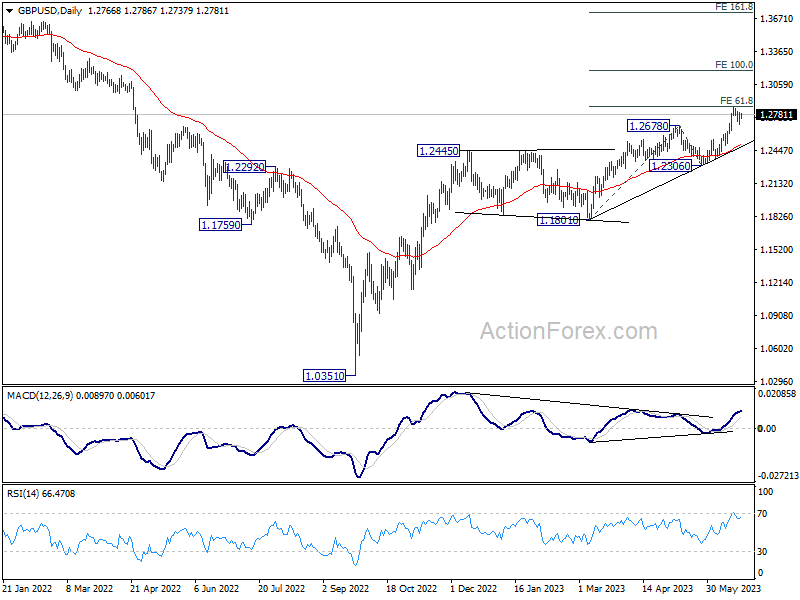
GBP/USD is staying in consolidation below 1.2847 and intraday bias remains neutral. Further rally is expected with 1.2628 support intact. On the upside, firm break of 1.2847 will resume larger up trend and target 100% projection of 1.1801 to 1.2678 from 1.2306 at 1.3183 next. However, firm break of 1.2628 will turn bias to the downside, for deeper fall to 1.2306 support instead.
In the bigger picture, the strong support from 55 W EMA (now at 1.2345) is a medium term bullish sign. Outlook will stay bullish as long as 1.2306 support holds. Rise from 1.0351 medium term bottom (2022 low) is expected to extend further to retest 1.4248 key resistance (2021 high).
USD/CHF Daily Outlook
Daily Pivots: (S1) 0.8901; (P) 0.8950; (R1) 0.8979; More...
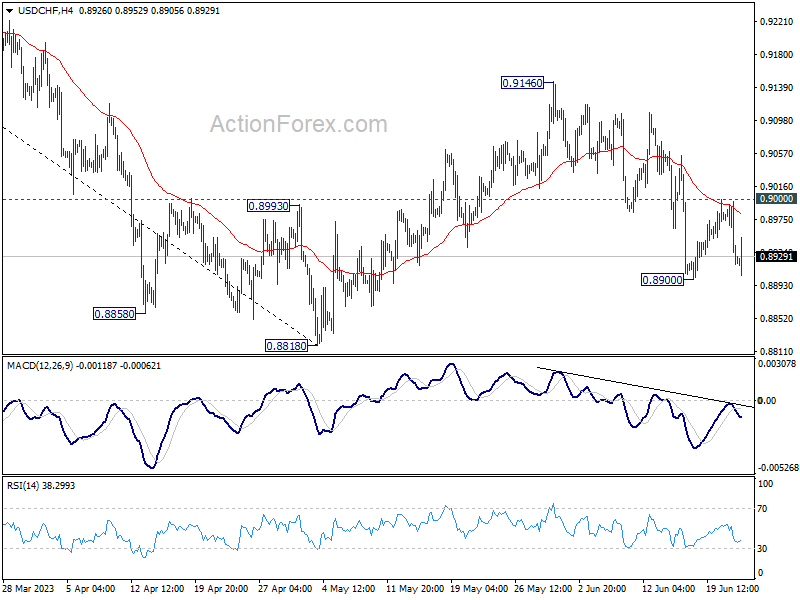
USD/CHF is still bounded in range above 0.8900 temporary low and intraday bias stays neutral. Further decline is expected as long as 0.9000 resistance holds. Break of 0.8900 will target 0.8818 and possibly below. But strong support is still expected from 0.8756 to bring reversal. Meanwhile, above 0.9000 will turn bias back to the upside for 0.9146 resistance instead.
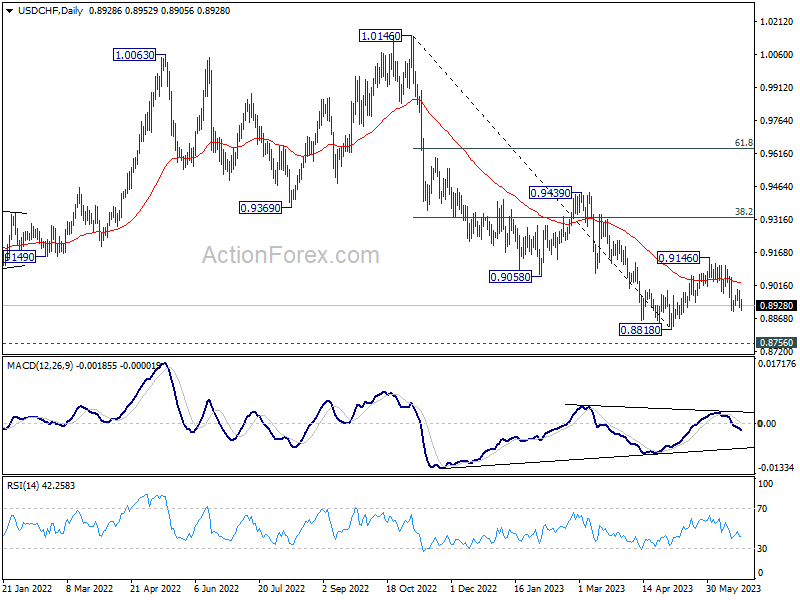
In the bigger picture, fall from 1.1046 (2022 high) is seen as a leg in the long term range pattern from 1.0342 (2016 high), which might have completed at 0.8818 already, just ahead of 0.8756 long term support. Sustained trading above 0.9058 support turned resistance should confirm medium term bottoming.
USD/JPY Daily Outlook
Daily Pivots: (S1) 141.34; (P) 141.85; (R1) 142.41; More...
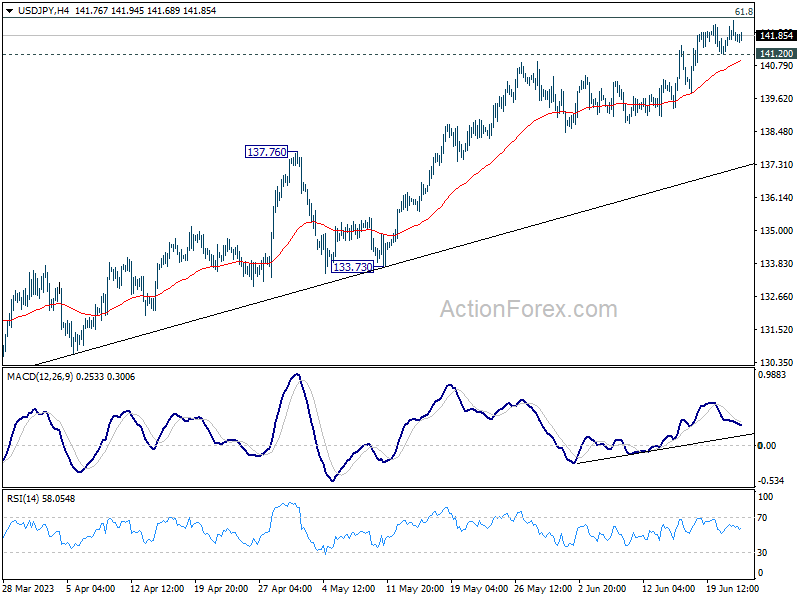
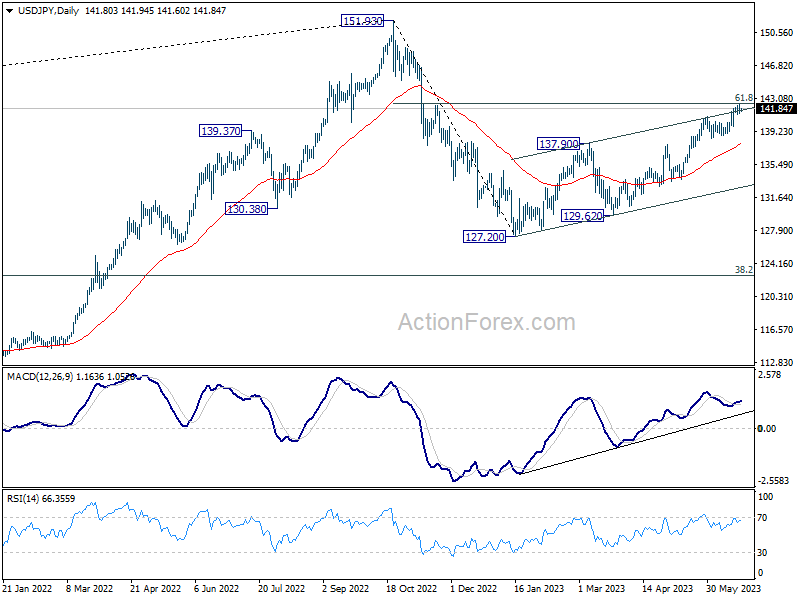
Further rise in favor in USD/JPY as long as 141.20 minor support holds. Sustained trading above 61.8% retracement of 151.93 to 127.20 at 142.48 would extend the rise from 127.20 towards 151.93 high. However, break of 141.20 minor support will be the first sign of rejection by 142.48, and turn bias back to the downside for 55 D EMA (now at 137.77).
In the bigger picture, rise from 151.93 are seen as a corrective pattern to up trend from 102.58. The first leg has completed at 127.20. Rebound from there is seen as the second leg, and should be limited below 151.93. Sustained trading below 55 D EMA (now at 137.47) will argue that the third leg has started back to 127.20 and possibly below.
AUD/USD Daily Report
Daily Pivots: (S1) 0.6757; (P) 0.6781; (R1) 0.6821; More...
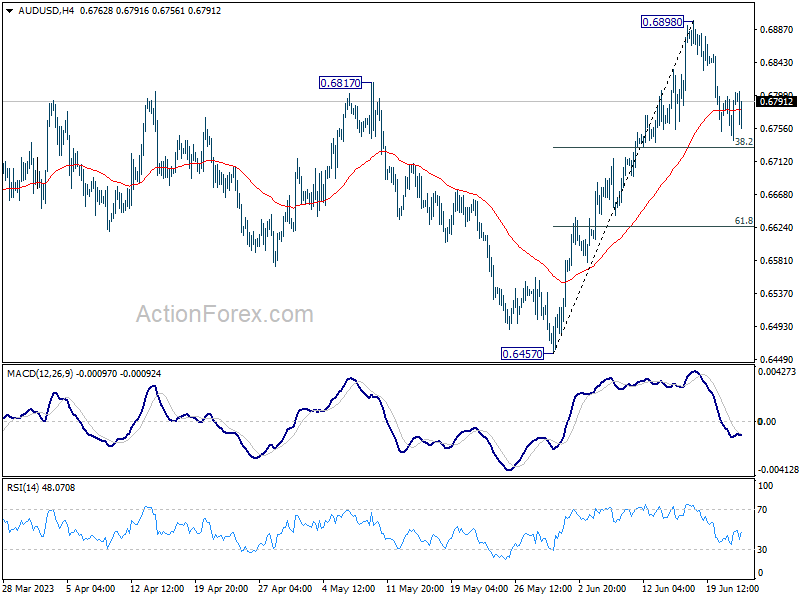
AUD/USD is staying in consolidation form 0.6898 and intraday bias remains neutral. Downside of retreat should be contained by 38.2% retracement of 0.6457 to 0.6898 at 0.6730 to bring another rally. As noted before, whole corrective decline from 0.7156 could have completed with three waves down to 0.6457 already. Above 0.6898 will resume the rise from 0.6457 to retest 0.7156 high next.
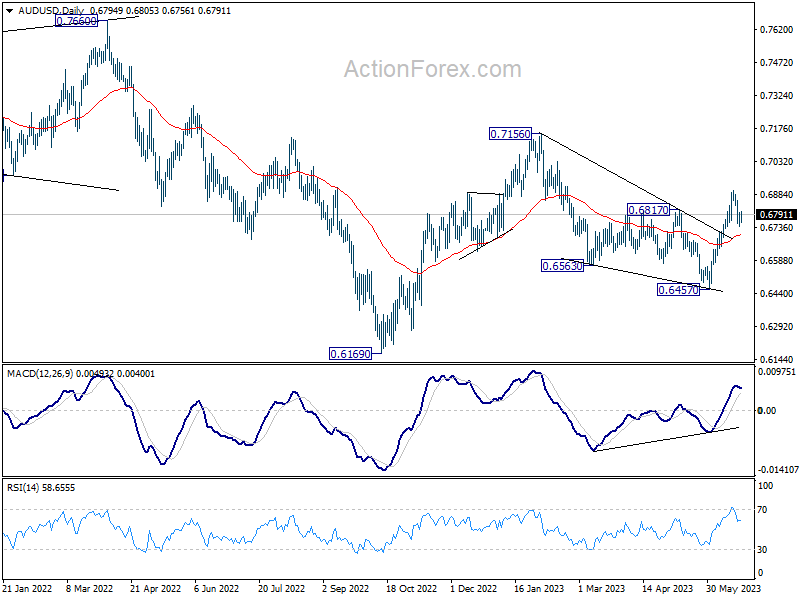
In the bigger picture, fall from 0.7156 could have completed in a three wave corrective structure at 0.6457. The development argues that rise from 0.6169 (2022 low) is still in progress. Firm break of 0.7156 will also add to the case that whole down trend from 0.8006 (2021 high) has finished and turn medium term outlook bullish. For now this will be the favored case as long as 55 D EMA (now at 0.6694) holds, even in case of deep pull back.
USD/CAD Daily Outlook
Daily Pivots: (S1) 1.3132; (P) 1.3189; (R1) 1.3221; More....
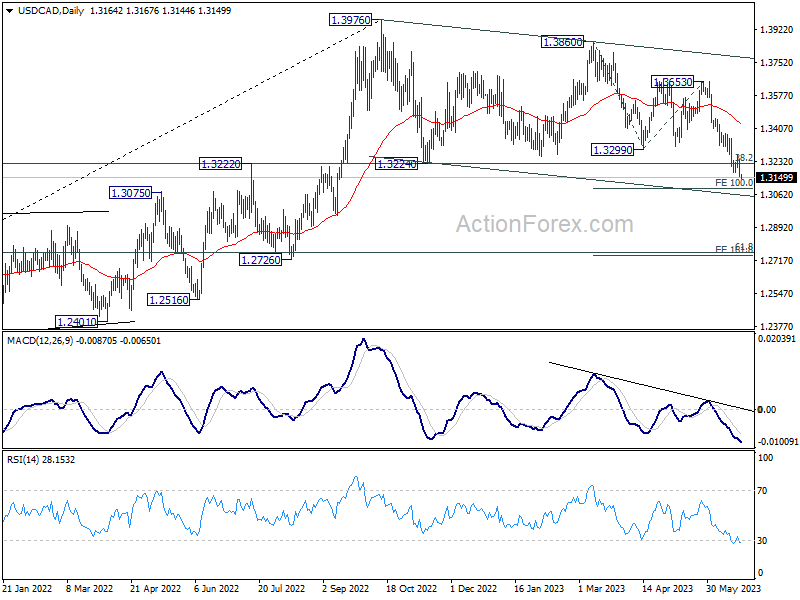
USD/CAD's decline resumed after brief recovery and intraday bias is back on the downside. Current fall from 1.3976 should target 100% projection of 1.3860 to 1.3299 from 1.3653 at 1.3092. Decisive break there will target 161.8% projection at 1.2745. On the upside, however, break of 1.3268 resistance should now indicate short term bottoming, and turn bias back to the upside for rebound.
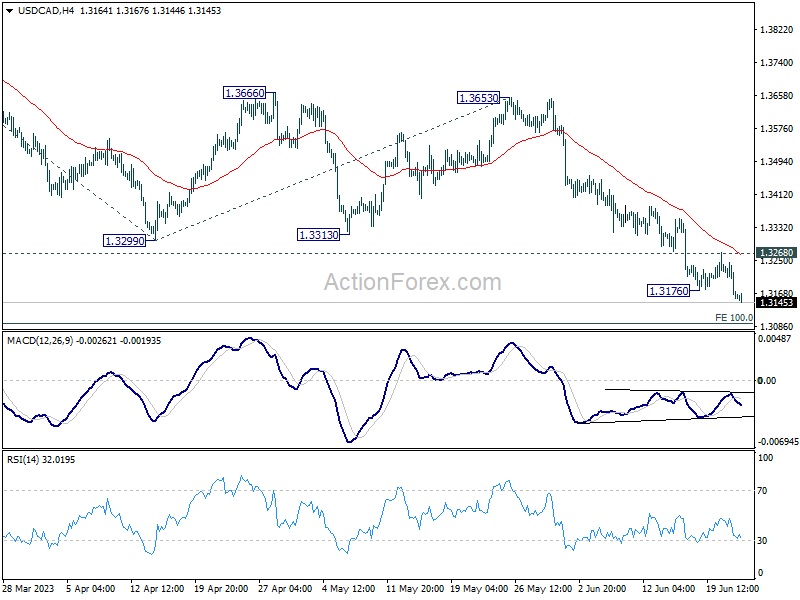
In the bigger picture, price actions from 1.3976 are still viewed as a correction to up trend from 1.2005 (2021 low), but chance of trend reversal is increasing with current decline. But in either case, sustained trading below 38.2% retracement of 1.2005 to 1.3976 at 1.3233 will pave the way to 61.8% retracement at 1.2758. Risk will stay on the downside as long as 1.3653 resistance holds, even in case of strong rebound.