

Sample Category Title
Japan PMI manufacturing fell to 49.8, services down to 54.2
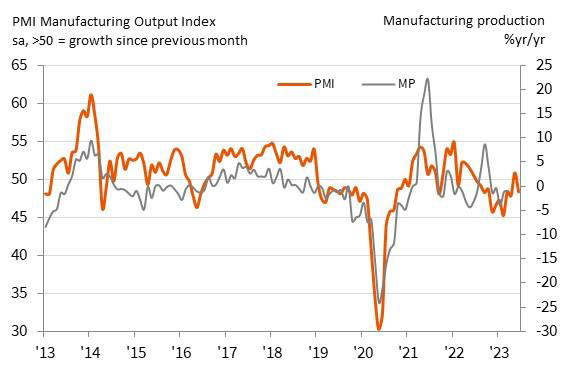
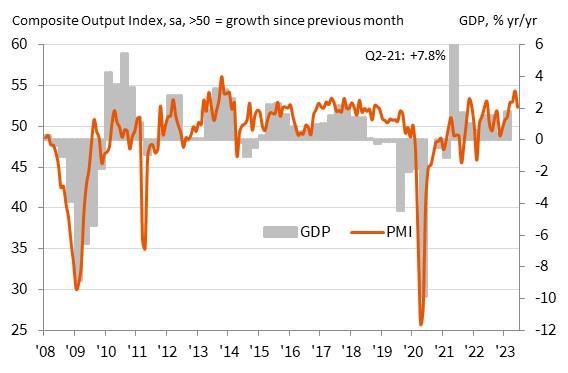
Japan PMI Manufacturing declined from 50.6 to 49.8 in June, below expectation of 50.2. PMI Manufacturing Output fell from 50.9 to 48.3. PMI Services dropped from 55.9 to 54.2. PMI Composite decreased from 54.3 to 52.3.
Annabel Fiddes, Economics Associate Director at S&P Global Market Intelligence, said:
"A fresh fall in manufacturing output coincided with a softer rise in services activity, leading to the weakest expansion of overall output for four months....
"The softening of growth momentum fed through to reduced optimism around the outlook, with business confidence slipping to a five-month low...
"However, there was some better news in terms of inflationary pressures, which showed further signs of easing. Notably, input price inflation softened to a 22-month low in June, while output charges increased at the softest pace since January."
Australia PMI composite fell to 50.5, RBA has time on their side
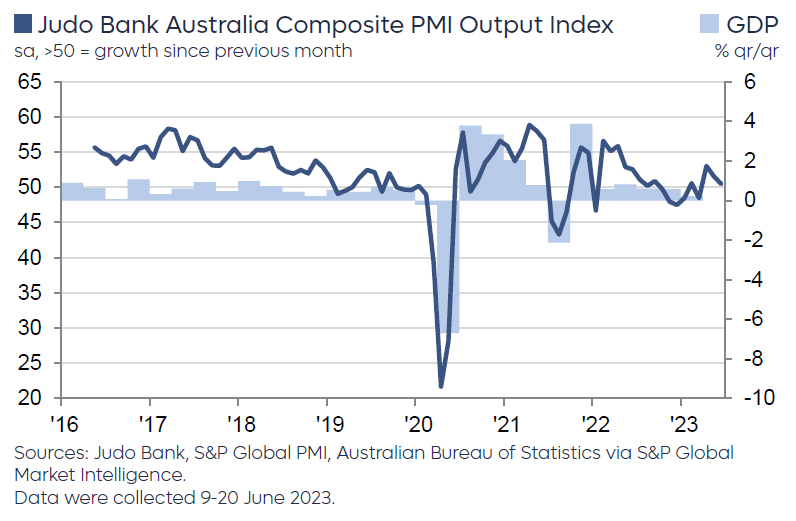
Australia PMI Manufacturing ticked up from 48.4 to 48.6 in June. PMI Services fell from 52.1 to 50.7. PMI Composite declined from 51.6 to 50.5.
Warren Hogan, Chief Economic Advisor at Judo Bank said:
"The loss of momentum in recent months will probably give the RBA some comfort that economic activity is slowing down across the economy in 2023, following their consecutive rate hikes in May and June...
"The survey suggests that the RBA has time on their side and does not necessarily need to hike rates again in July. The slowdown taking place across the economy provides further evidence that the point at which the RBA can undertake a genuine pause in their tightening cycle is getting closer.
"We cannot rule out a further hike in the next few months, but we are close to a level of interest rates whereby the RBA can sit back for 4-6 months and observe the effects of past interest rate increases."
Cliff Notes: Enduring Pressures Risk Longer Cycles
Key insights from the week that was.
In Australia, the June RBA meeting minutes confirmed that, when it comes to achieving the inflation target, the Board views the risks as having shifted to the upside. The arguments made in favour of the two policy options of a pause or 25bp rate increase were largely familiar: the slowing in activity and uncertain duration of policy lags versus the current strength of domestic inflation indicators, particularly the stickiness of services inflation. However, the Board also expressed specific concern over the risk of a wage-price spiral and a de-anchoring of inflation expectations, noting the possibility of “implicit indexation of wages to past high inflation” and firms “indexing their prices, either implicitly or directly, to past inflation.”
As discussed by Chief Economist Bill Evans in a video update mid-week, the minutes are consistent with our view that, despite policy’s goal to retain the labour market’s recent gains, the inflation challenge is the RBA’s focus. Hence, we continue to expect the Board to raise the cash rate in both July and August to a peak of 4.60%. This will certainly have an impact on households, with consumption expected to stall and GDP growth slowing to a negligible pace this year and early next. For more information on our broader views, see our latest Market Outlook In Conversation Podcast.
As detailed by Chief Economist Bill Evans today, it is not only the RBA that is facing these challenges. The developed world over the legacies of the pandemic and capacity constraints means central banks have more work to do before they can rest confident inflation is sustainably trending back to target. Note though, this only means the impact of policy tightening has been delayed not neutralised. In 2024, a more aggressive easing than the market has priced will prove necessary.
The UK and Bank of England are a case in point. The BoE surprised markets in June, raising the bank rate by 50 basis points to 5%. The minutes noted that the outsized hike came because of stronger than expected inflation and wage data. Seven members voted in favour of a 50bp hike; however, two members voted to keep rates steady at 4.5%. The May CPI ticked up to 8.7%yr, exceeding the bank’s forecast for an 8.2%yr lift in the second quarter. Services inflation, of particular importance to the BoE, also accelerated for the fourth month in a row to 7.3%yr. Price pressures remain broad with 89% of the CPI basket running hotter than the BoE’s 2% inflation target. The Bank no longer expects services inflation to abate this year; but, albeit more slowly, headline inflation is still expected to temper by the end of the year.
According to the Bank, a higher proportion of fixed rate mortgages have kept mortgage repayments lower than they otherwise would have been. This has prolonged the monetary policy lag with the committee noting “the full impact of the increase in Bank Rate to date will not be felt for some time”.
Looking ahead, the BoE will be taking a data-dependent approach. Further tightening has not been ruled out, noting “If there were to be evidence of more persistent pressures, then further tightening in monetary policy would be required”. It remains to be seen if the Bank will feel it is necessary to hike by another 50bps or can (again) slow the pace of tightening.
In the United States, members of the FOMC were active this week, with Chair Jerome Powell speaking before the House and Senate and notable comments made by Austan Goolsbee and Raphael Bostic.
Chair Powell highlighted while before Congress that this meeting’s pause was part of a necessary deceleration to a “careful pace” as they approach their destination – a metaphor also used by ECB’s Lagarde. Powell’s comments also highlighted that the FOMC’s concern over inflation risks will dissipate as inflation returns to target and be balanced with activity risks as labour market slack increases. Implicit is that rate cuts will occur when perceived activity risks are greater than those for inflation – this is unlikely until early-2024.
Consistent with this timeline and nascent shift in risks, Atlanta Fed President Bostic assessed that policy had only been restrictive ‘for less than a year’ and called for the pause to remain for the rest of the year, to account for the lag in monetary policy transmission. Chicago Fed President Goolsbee described the pause as a ‘reconnaissance mission’; but on a less dovish note, called the decision a ‘close call’. Taken together, these comments suggest the path ahead for policy will depend on how data prints.
Also for the US this week, housing indicators surprised to the upside. Building permits were up 5.2%mth in May and housing starts a staggering 21.7%. Optimism over a floor in activity for the sector is also picking up amongst builders, as captured by the NAHB Index which rose 5 points to an expansionary 55. Supply remains the chief concern for existing sales (0.2%;-20%yr), highlighting the opportunity for new construction.
Assessing the composition of the pipeline, while single and multi-family dwellings have both been supportive of late, over the year, multi-family has shown considerable strength, the number of units under construction at more than 50-year highs. This feature of the sector highlights the impact of affordability and the interest of institutional investors in expanding rental capacity in regions experiencing an imbalance between demand and supply. Eventually, this should help stop the extreme rent inflation experienced over recent years. Though it must be recognised that commercial-scale investors require competitive returns, so robust rent increases will be sought and contribute meaningfully to total consumer inflation into the medium term.
USD/JPY Extends Rally As The Bulls Aim 144.00
Key Highlights
- USD/JPY started a fresh increase above the 142.00 resistance.
- A key bullish trend line is forming with support near 142.25 on the 4-hour chart.
- EUR/USD struggled to gain bullish momentum above 1.1000.
- The US Manufacturing PMI could remain below 50 at 48.5 in June 2023 (Preliminary).
USD/JPY Technical Analysis
The US Dollar remained well-bid above the 141.20 support against the Japanese Yen. USD/JPY formed a base and started a fresh increase above the 142.00 resistance.
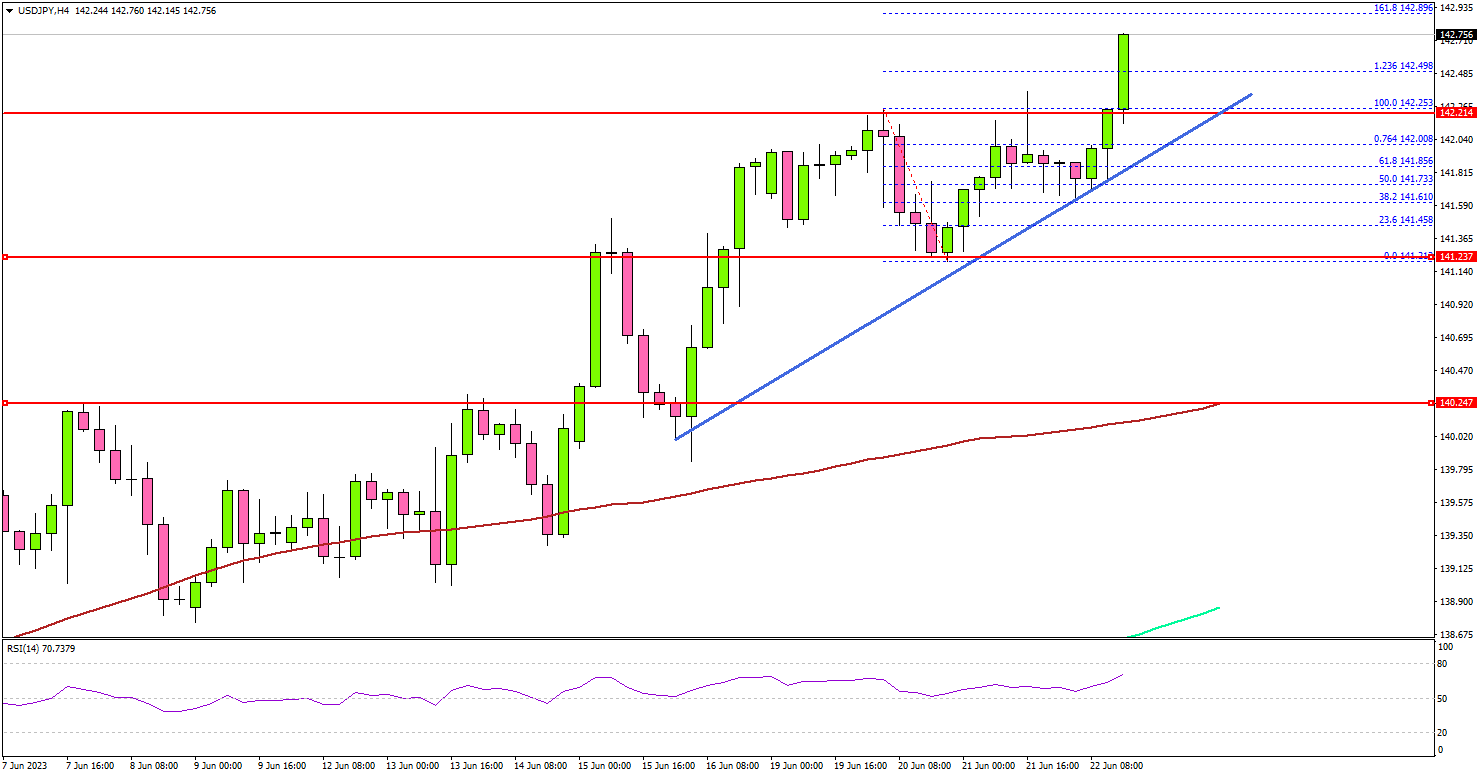
Looking at the 4-hour chart, the pair settled above the 142.20 level, the 100 simple moving average (red, 4 hours), and the 200 simple moving average (green, 4 hours). There was a clear move above the 1.236 Fib expansion level of the downward move from the 142.25 swing high to the 141.21 low.
The first major resistance is near the 142.90 level or the 1.618 Fib expansion level of the downward move from the 142.25 swing high to the 141.21 low.
If there is a move above the 142.90 resistance, the pair could rise toward 143.50. Any more gains might send USD/JPY toward the 144.00 level.
Immediate support is near the 142.25 level. There is also a key bullish trend line forming with support near 142.25 on the same chart.
The next major support is near the 141.85 level. If there is a downside break below the 141.85 support, the pair could decline toward the 141.20 support. The main support sits at 140.25 and the 100 simple moving average (red, 4 hours).
Looking at EUR/USD, the pair jumped above the 1.0950 resistance but it seems to be struggling above the 1.1000 resistance zone.
Economic Releases
- Germany’s Manufacturing PMI for June 2023 (Preliminary) - Forecast 43.5, versus 43.2 previous.
- Germany’s Services PMI for June 2023 (Preliminary) - Forecast 56.2, versus 57.2 previous.
- Euro Zone Manufacturing PMI June 2023 (Preliminary) – Forecast 44.8, versus 44.8 previous.
- Euro Zone Services PMI for June 2023 (Preliminary) – Forecast 54.5, versus 55.1 previous.
- UK Manufacturing PMI for June 2023 (Preliminary) – Forecast 46.8, versus 47.1 previous.
- UK Services PMI for June 2023 (Preliminary) – Forecast 54.8, versus 55.5 previous.
- US Manufacturing PMI for June 2023 (Preliminary) – Forecast 48.5, versus 48.4 previous.
- US Services PMI for June 2023 (Preliminary) – Forecast 54.0, versus 54.9 previous.
Ethereum (ETHUSD) Bullish Rally Looking Like Impulse Structure
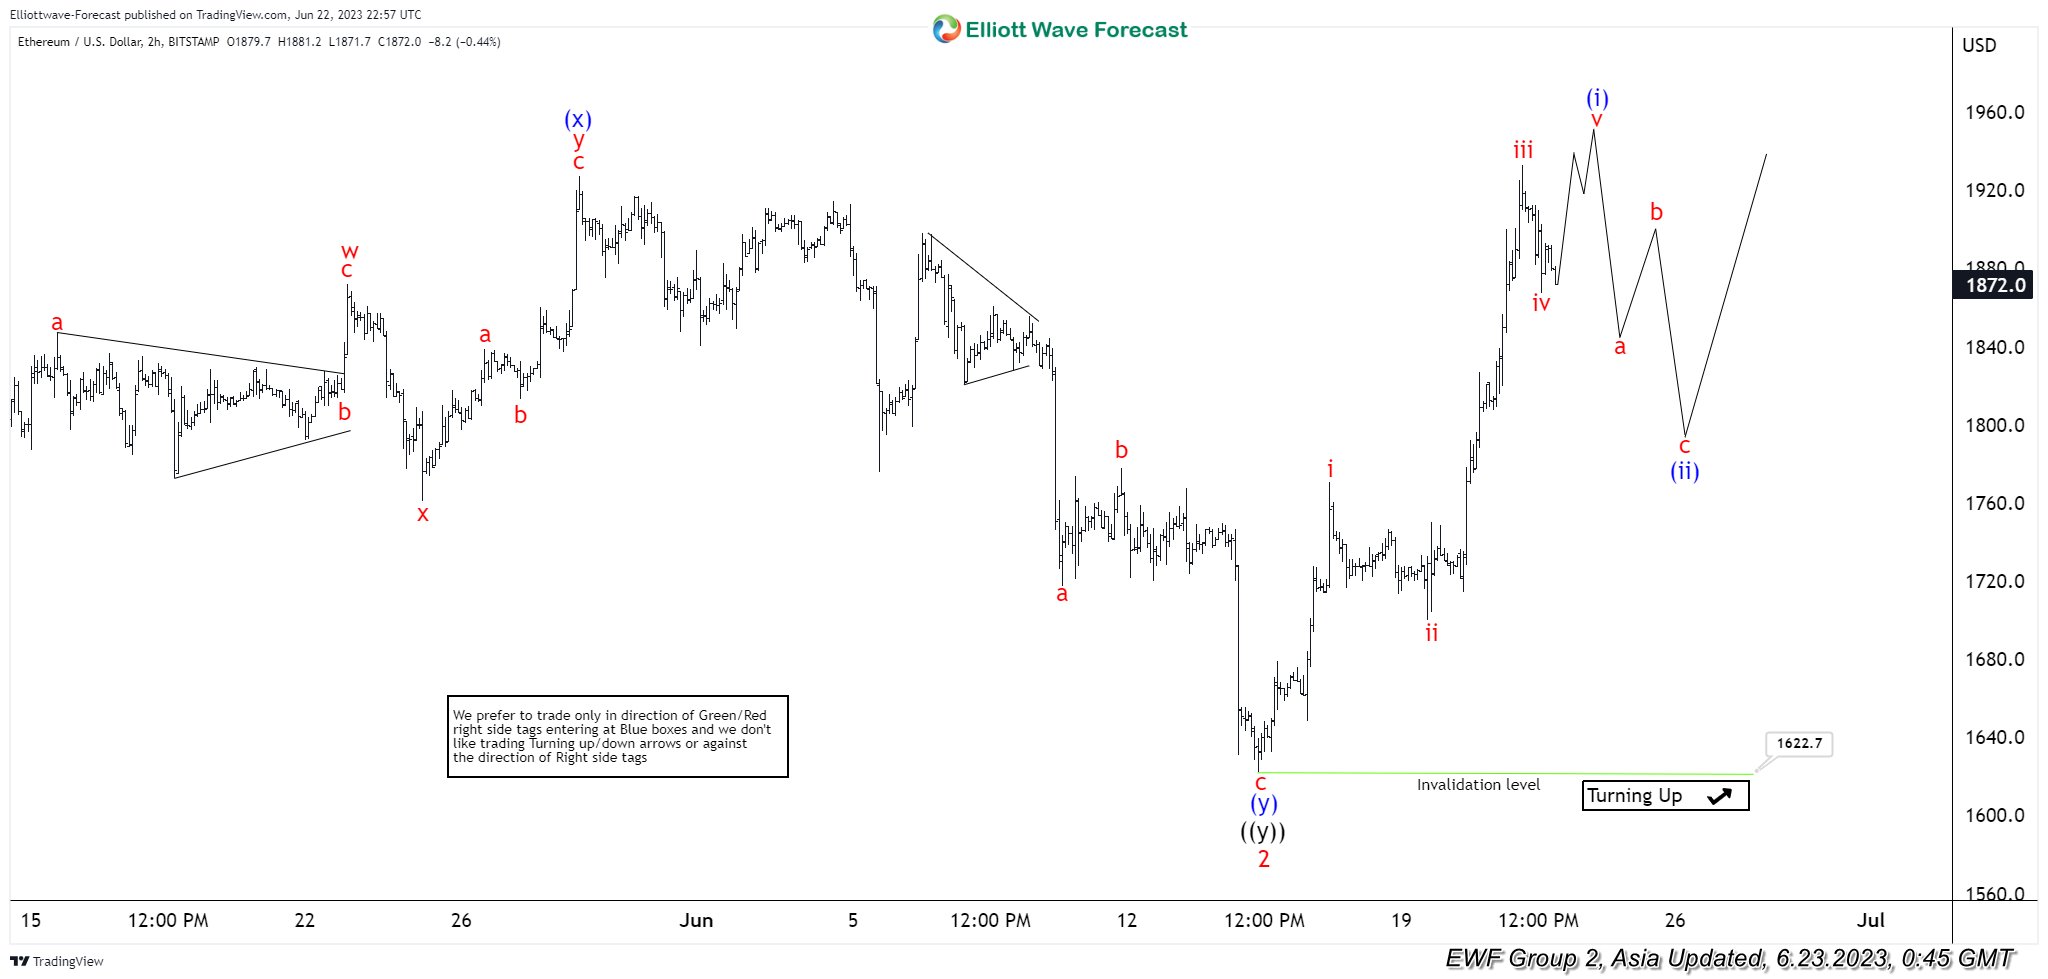
Short term view in Ethereum (ETHUSD) from 3.10.2021 low is in progress as a 5 waves impulse Elliott Wave structure. Up from 3.10.2021 low, wave 1 ended at 2140.8 and dips in wave 2 ended at 1622.7 as the 2 hour chart below shows. Internal subdivision of wave 2 unfolded as a double three Elliott Wave structure. Down from wave 1 at 4.16.2021 high, wave ((w)) ended at 1787 and wave ((x)) ended at 2020.6. Wave ((y)) subdivides into another double three in lesser degree. Down from wave ((x)), wave (w) ended at 1737.4, wave (x) ended at 1927.5 and wave (y) lower ended at 1622.7. This completed wave ((y)) of 2 in higher degree.
The crypto-currency has turned higher in wave 3. Up from wave 2, wave i ended at 1770.9 and pullback in wave ii ended at 1699.8. Ethereum then resumes higher in wave iii towards 1933.1. Expect wave iv dips to end soon, then the crypto-currency should extend higher in wave v. This would complete wave (i) in higher degree. Afterwards, it should pullback in wave (ii) to correct cycle from 6.15.2023 low before the rally resumes. Near term, as far as pivot at 1622.7 low stays intact, expect pullback to find support in 3, 7, or 11 swing for further upside.
ETHUSD 2 Hour Elliott Wave Chart
Ethereum Elliott Wave Chart
ETHUSD Elliott Wave Video
https://www.youtube.com/watch?v=vKZ4jZzMgfQ
Gold Demand Drops As The US Dollar Recovers
Here's the scoop on China's gold demand. According to Bloomberg, the country's economic slowdown is beginning to affect the sector, resulting in a cooling off of gold sales. While jewelry sales experienced rapid growth earlier this year, they only expanded by 24% in May, indicating a slowdown. China, alongside India, is a leading consumer of physical gold, including bars, jewelry, and coins. The surge in sales in March and April was driven by pent-up demand after pandemic restrictions were lifted. However, China's economic growth has been losing steam since the first quarter, with May witnessing a sharp deceleration in industrial output, retail, and investment and record-high youth unemployment. Beijing has introduced direct stimulus measures to combat this slowdown, and the central bank has implemented interest rate cuts to encourage spending. Despite the cooling demand, gold is expected to maintain its elevated level due to geopolitical tensions and recessionary fears, acting as a safe-haven asset.
Foreign central banks have also been stockpiling gold to reduce their dependence on the dollar. China's central bank has accumulated 160 tons of gold in the past seven months, bringing its total holdings to 2,092 tons. Keep an eye on these developments as they unfold in the gold market.
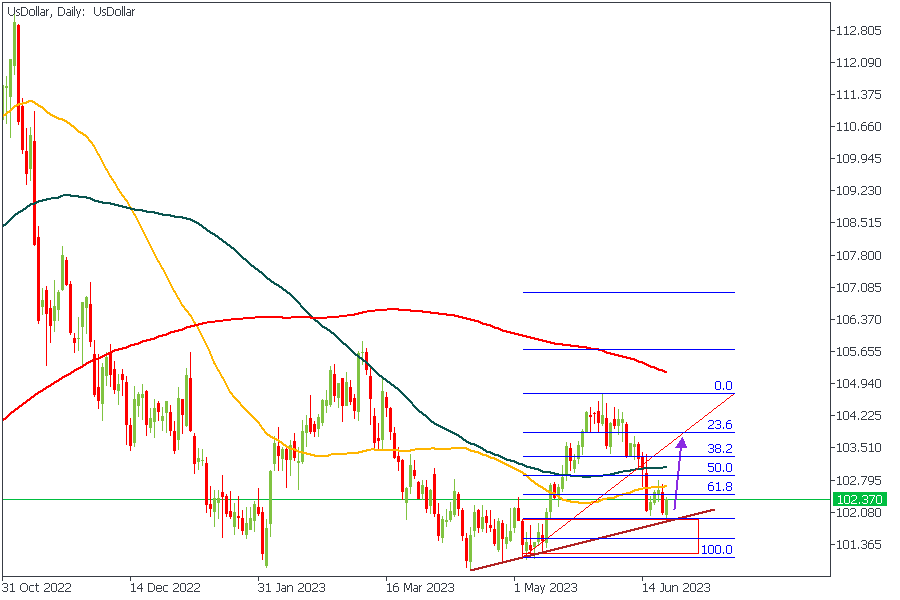
US DOLLAR - Daily Timeframe
The price action on the US Dollar chart is typical of a bearish reversal. The rejection from the drop-base-rally demand zone coincided with 76% of the Fibonacci retracement. As a result, I expect to see the price reach 38% of the Fibonacci retracement at the very least.
Analyst’s Expectations:
- Direction: Bullish
- Target: 103.230
- Invalidation: 101.856
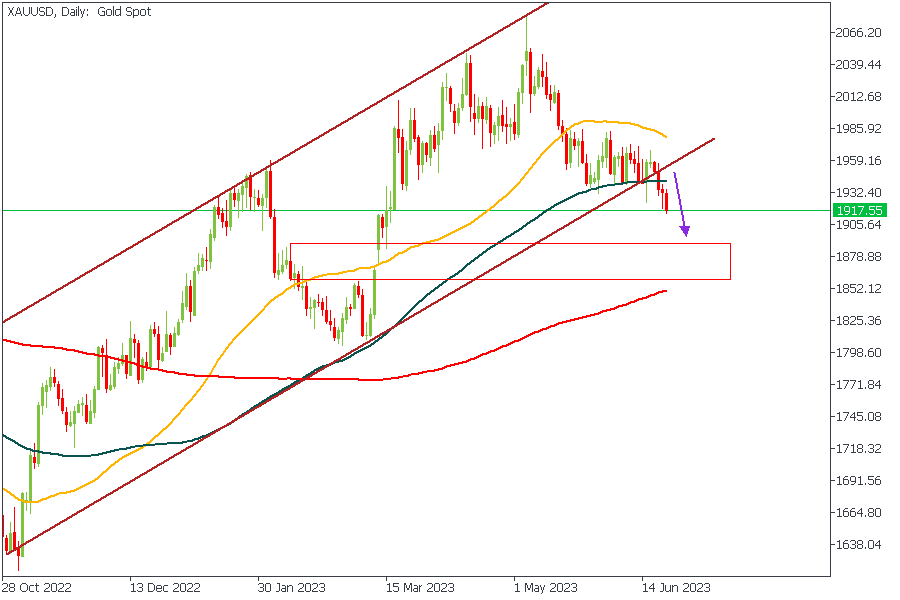
XAUUSD - Daily Timeframe
Proper price action correlation of the US Dollar and XAUUSD is usually inverse since the Dollar is often used as a security token to hedge against inflation and other economic declines. Since we have seen the technical analysis of the US Dollar indicating a bullish bias, we can expect a further decline in the price of Gold. As discussed earlier, the decline in demand for Gold from China could also contribute to this bearish pressure.
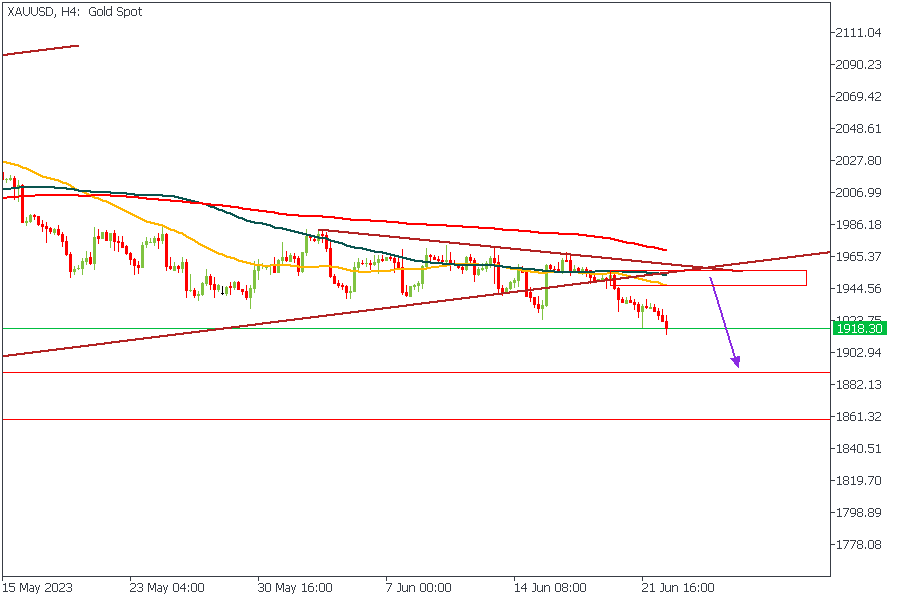
XAUUSD - 4 Hour Timeframe
The price action on the 4-Hour timeframe of XAUUSD reveals that a significant resistance trendline has been broken. In line with this, we can also see that the moving averages are arrayed in a bearish manner, which serves as a confluence. The minor resistance trendline overlaps with the drop-base-drop supply zone and a potential entry area for the bearish market run after the retest of the broken trendline. Despite all these, however, I would still prefer to see a clearer price action from Gold, as opposed to the current shabby movement on the commodity.
Analyst’s Expectations:
- Direction: Bearish
- Target: 1.26657
- Invalidation: 1.28523
CONCLUSION
The trading of CFDs comes at a risk. Thus, to succeed, you have to manage risks properly. To avoid costly mistakes while you look to trade these opportunities, be sure to do your due diligence and manage your risk appropriately.
CADJPY Wave Analysis
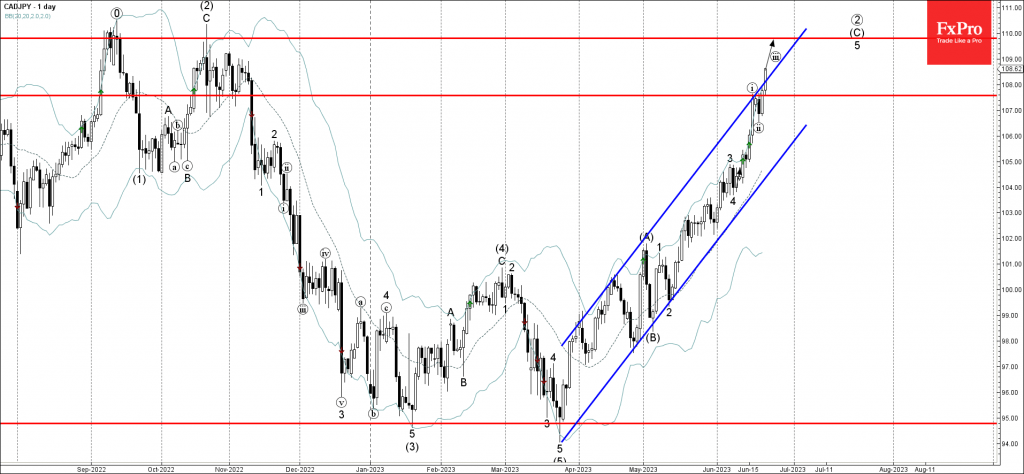
- CADJPY broke resistance level 107.60
- Likely to rise to resistance level 110.
CADJPY under the bullish pressure after the earlier breakout of the resistance level 107.60, which stopped the previous minor impulse wave (i) earlier this month.
The breakout of the resistance level 107.60 accelerated the active short-term impulse wave 5 pf the intermediate impulse sequence (C) from the start of May.
Given the prevailing daily uptrend , CADJPY can be expected to rise further to the next resistance level 110.00 (target for the completion of the active impulse sequence (C).
Fed Bowman: Additional policy rate increases necessary
In a speech today, Fed Michelle Bowman underscored that more action would be necessary to bring inflation under control.
She noted, "I believe that additional policy rate increases will be necessary to bring inflation down to our target over time."
While acknowledging the influence of the current tighter monetary policy on both economic activity and inflation, she pointed out that "core inflation essentially plateau since the fall of 2022."
She suggested Fed would need to raise interest rate to a "sufficiently restrictive stance of monetary policy to meaningfully and durably bring inflation down."
As Yen Collapses, How Likely is FX Intervention?
With the yen breaking down lately, Japanese authorities have stepped up their warnings about FX intervention. However, the conditions for intervention are not fully present yet, as the moves in USDJPY in particular have not been sharp enough. For the yen to stage a lasting recovery, it might require some policy tightening from the BoJ or an episode of panic in global markets instead.
Yen meltdown
It’s been a dreadful year for the Japanese yen, which has been ravaged by the Bank of Japan’s refusal to tighten monetary policy. With most other major central banks raising interest rates in a hurry, the rate gap has widened, making the yen less attractive to hold compared to other currencies.
Naturally, the yen’s losses have been more devastating against currencies that are backed up by central banks who are expected to continue raising rates. So far this year, the yen has lost almost 14% of its value against the British pound and more than 10% against the euro, plunging to multi-year lows against both.
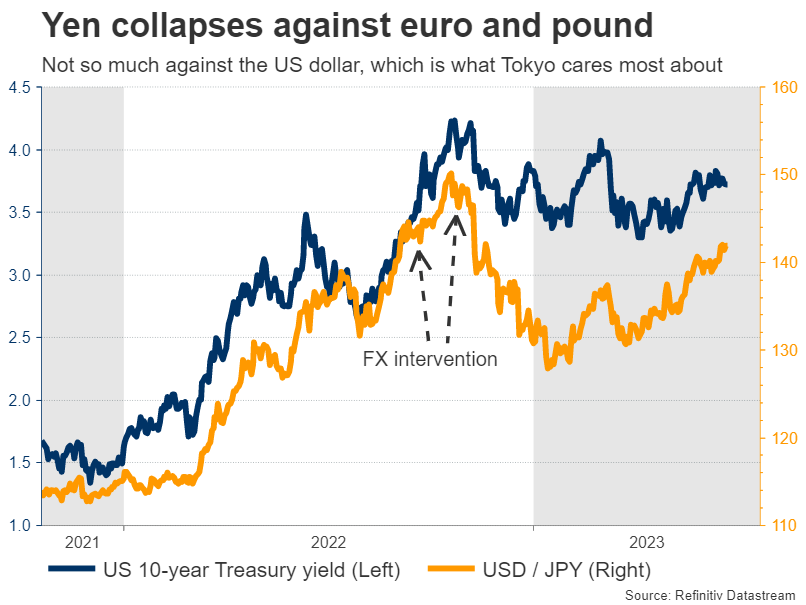
With the currency in freefall, Japanese officials have returned to their old playbook of threatening to intervene in the FX market. They did it twice last year to stop the yen’s downfall, so their warnings are more credible this time, since investors know they are not afraid to pull the trigger.
Intervention or mere rhetoric?
For now, the risk of FX intervention seems fairly low. Tokyo cares most about how the yen moves against the US dollar, and since that pair has not gone out of control, there isn’t much urgency to step in.
Supporting this notion is the language that Japanese authorities have used until now. The finance minister has refrained from using phrases that would suggest intervention is imminent, such as describing the FX moves as “disorderly” or “excessive”. Instead, he has been more measured with his comments.
The strategy might be to simply threaten intervention in order to discourage speculators from jumping on the bandwagon and amplifying the downside momentum in the yen. In essence, it’s a psychological tactic against speculation.
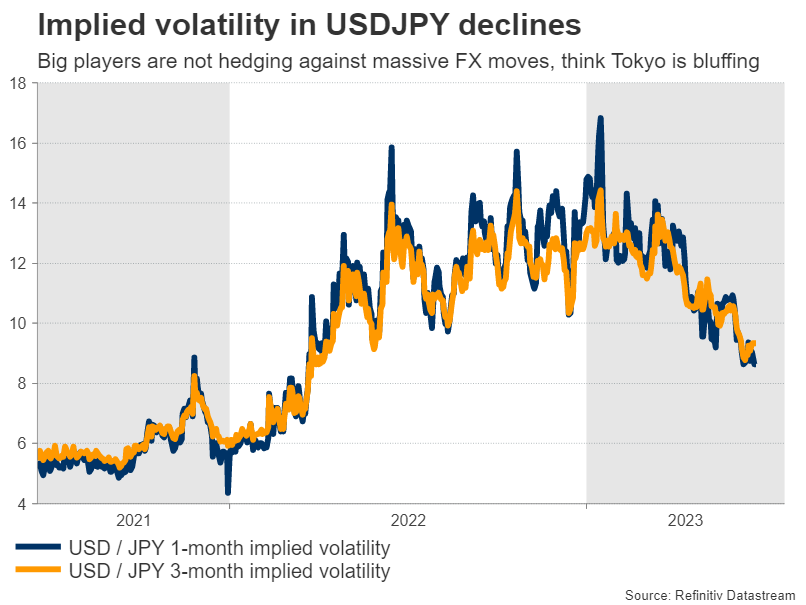
Reflecting the low risk of intervention is the implied volatility in USDJPY, which has fallen dramatically in recent weeks. This suggests that bank dealers and large asset managers are not really hedging against any massive moves in USDJPY, viewing this risk as relatively low.
Some strategists suggest that if USDJPY climbs to 145.00, it would be the ‘line in the sand’ that triggers intervention. But speed matters in this calculation - such a move could prompt intervention if it happens in a week, not over several months. Hence, it’s difficult to say exactly where the intervention ‘line’ is, mainly because it’s a moving target.
Ingredients for recovery
With the likelihood of intervention appearing low for the time being, any sustainable recovery in the yen would need to rely on other factors, such as a policy shift from the Bank of Japan.
So far, the BoJ has been reluctant to raise the ceiling it has imposed on Japanese yields, even though core inflation is at its hottest level in three decades. Most officials believe this spell won’t last, as the central bank’s forecasts expect inflation to cool later this year.
Haunted by decades of deflation, the BoJ wants to make sure it won’t tighten until inflation is sustainably above its 2% target. That means their forecasts for the next 2-3 years need to show inflation remaining above 2% before they feel comfortable raising the yield ceiling that has ruined the yen.
The plot twist is that this shift could happen as early as next month. If the BoJ upgrades its inflation forecasts for 2025 at the July meeting, which seems likely considering the resilience of the economy, then inflation would be projected to remain above 2% through the entire forecast horizon. This would be a signal that tighter policy is coming, helping to stop the yen’s bleeding.
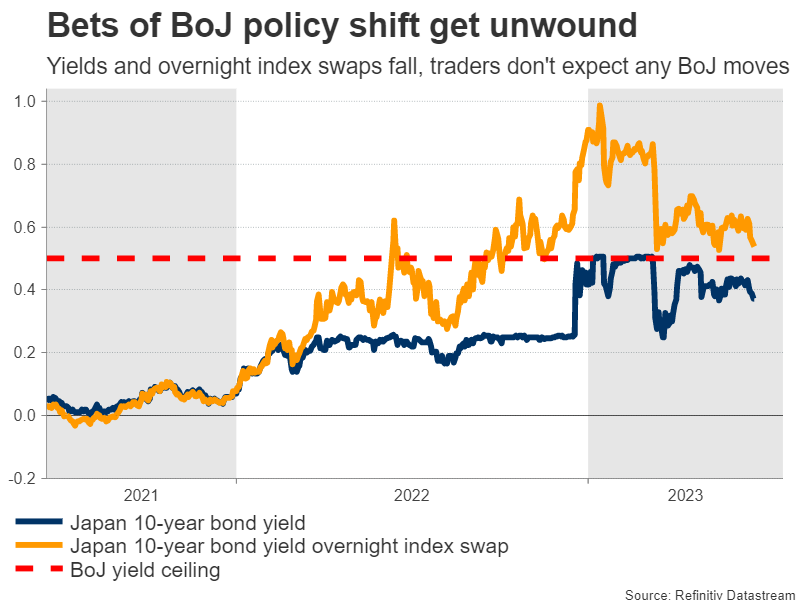
It’s important to note, however, that market participants are skeptical such a move will occur. Bets that the BoJ will adjust its policy settings have been lowered lately, something visible both in 10-year Japanese yields and in overnight index swaps tracking this instrument. Therefore, any move by the BoJ this year could come as a surprise for investors.
Another variable that will be crucial in enabling a sustainable recovery in the yen will be global risk sentiment. After all, the yen is a defensive currency that tends to shine during periods of panic in global markets. As such, if the euphoria in riskier assets calms down and there’s a correction later this year, that could also help revive the yen through safe-haven flows.
All told, currency intervention seems unlikely at this stage. Instead, the yen’s best chance for a lasting recovery is through the BoJ joining the global tightening race. Traders are saying such a shift is unlikely, yet the economic conditions seem to be falling into place. So while the yen’s crash is not over, it might be entering its final phase.