

Sample Category Title
GBP/JPY Daily Outlook
Daily Pivots: (S1) 181.26; (P) 181.91; (R1) 183.08; More...
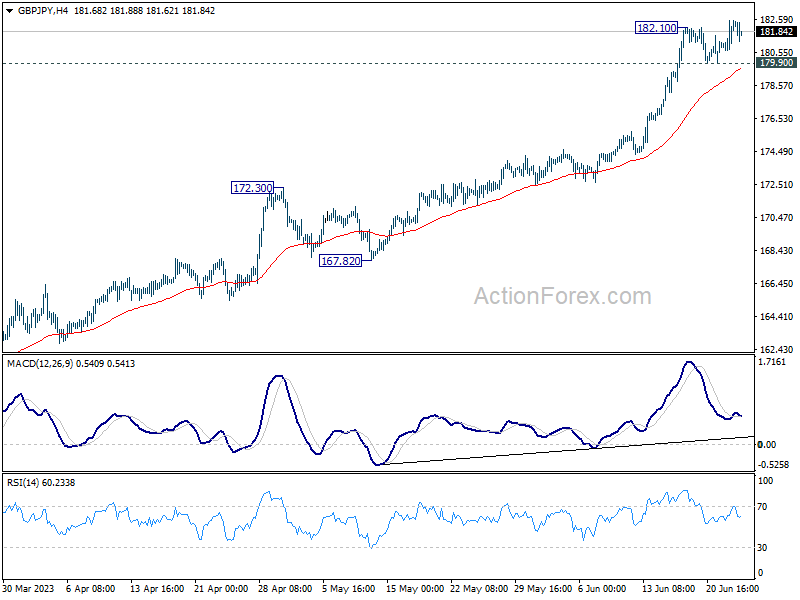
Intraday bias in GBP/JPY is mildly on the upside with break of 182.10 temporary top. Current up trend should be seen to 138.2% projection of 148.93 to 172.11 from 155.33 at 187.36. On the downside, however, break of 179.90 support will confirm short term topping, and turn bias back to the downside for deeper pull back.
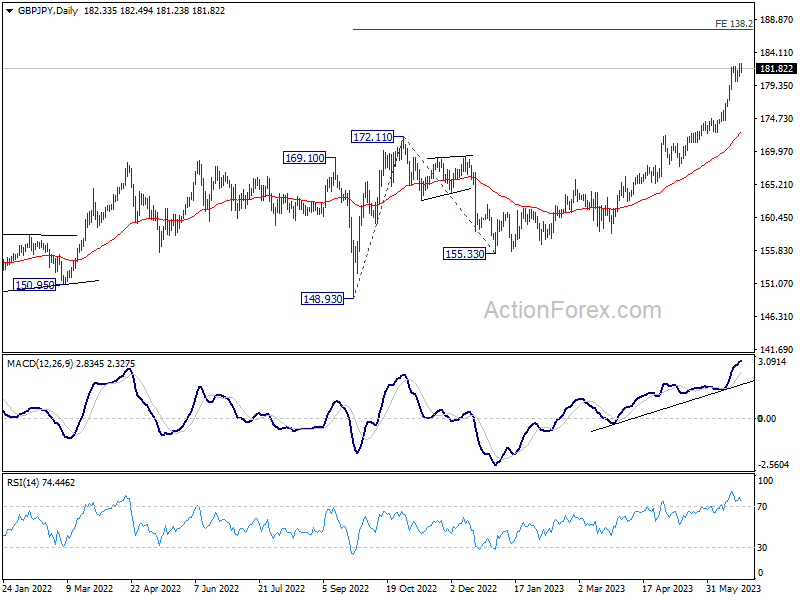
In the bigger picture, up trend from 123.94 (2020 low) is extending. Next target is 195.86 (2015 high). For now, medium term outlook will remain bullish as long as 172.11 resistance turned support holds, even in case of deep pull back.
EUR/CHF Daily Outlook
Daily Pivots: (S1) 0.9783; (P) 0.9812; (R1) 0.9834; More...
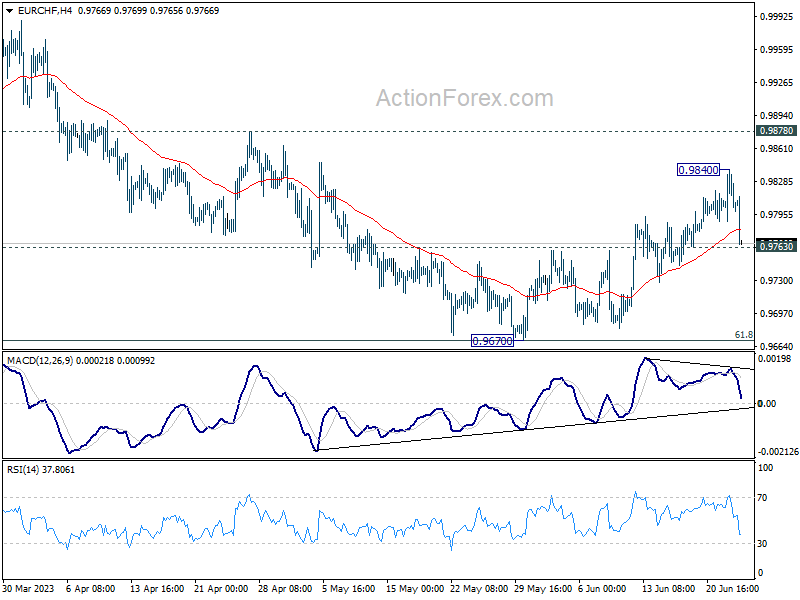
Intraday bias in EUR/CHF is turned neutral with current retreat. On the upside, break of 0.9840 will resume the rebound from 0.9670 resistance. Firm break there should confirm that whole correction from 1.0995 has completed at 0.9670. On the downside, break of 0.9763 minor support will turn bias back to the downside for retesting 0.9670 low instead.
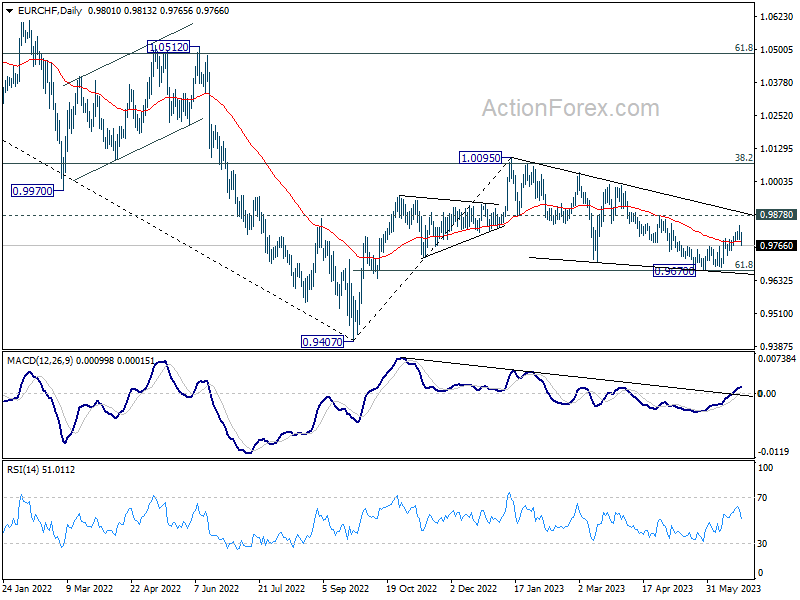
In the bigger picture, prior rejection by 38.2% retracement of 1.1149 to 0.9407 at 1.0072 suggests that medium term outlook is staying bearish. The pair is also capped below 55 W EMA (now at 0.9924). Down trend from 1.2004 (2018 high) is not complete yet and is in favor to resume through 0.9407 at a later stage. However, decisive break of 1.0095 resistance will raise the chance of bullish trend reversal. Rise from 0.9407 should then target 1.0505 cluster resistance (2020 low at 1.0505, 61.8% retracement of 1.1149 to 0.9407 at 1.1484).
USD/CAD Daily Outlook
Daily Pivots: (S1) 1.3133; (P) 1.3156; (R1) 1.3173; More....
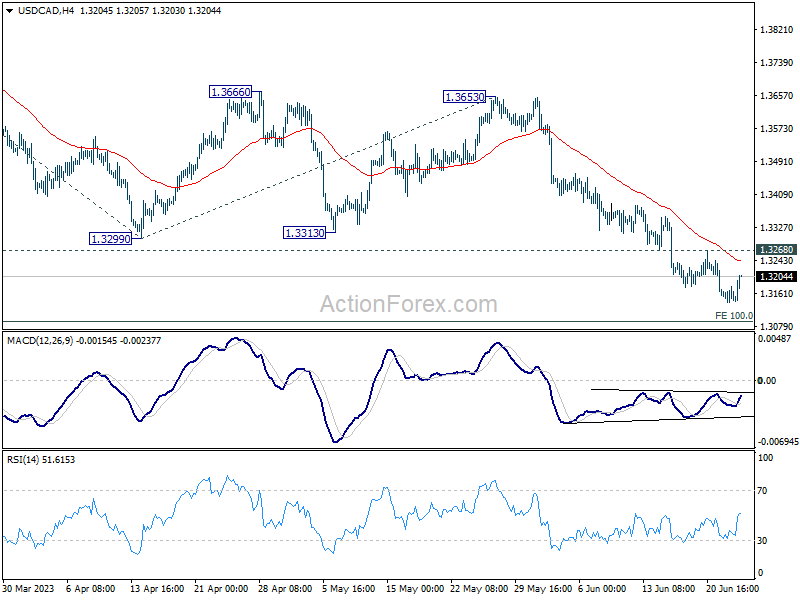
USD/CAD continues to lose downside momentum, as seen in 4H MACD. But further decline is still expected as long as 1.3268 resistance holds. Current fall from 1.3976 should target 100% projection of 1.3860 to 1.3299 from 1.3653 at 1.3092. Decisive break there will target 161.8% projection at 1.2745. On the upside, however, break of 1.3268 resistance should now indicate short term bottoming, and turn bias back to the upside for rebound.
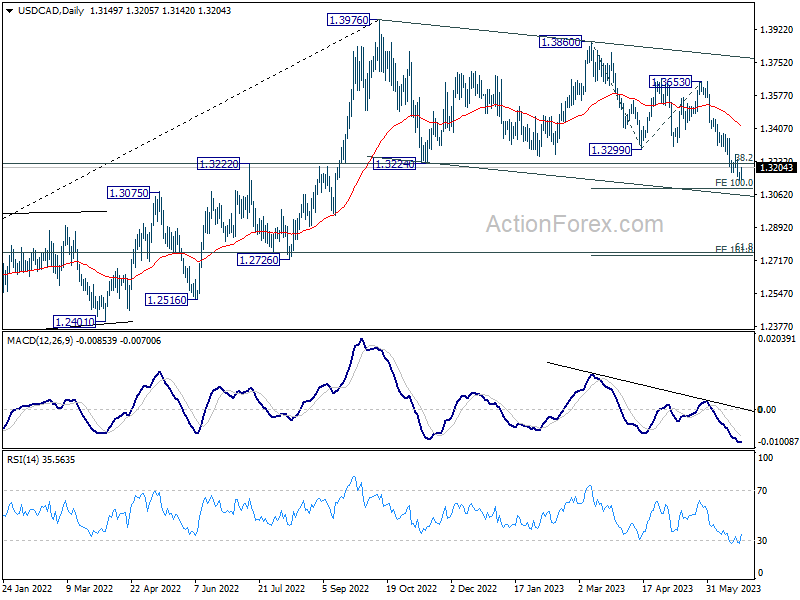
In the bigger picture, price actions from 1.3976 are still viewed as a correction to up trend from 1.2005 (2021 low), but chance of trend reversal is increasing with current decline. But in either case, sustained trading below 38.2% retracement of 1.2005 to 1.3976 at 1.3233 will pave the way to 61.8% retracement at 1.2758. Risk will stay on the downside as long as 1.3653 resistance holds, even in case of strong rebound.
AUD/USD Daily Report
Daily Pivots: (S1) 0.6732; (P) 0.6769; (R1) 0.6793; More...
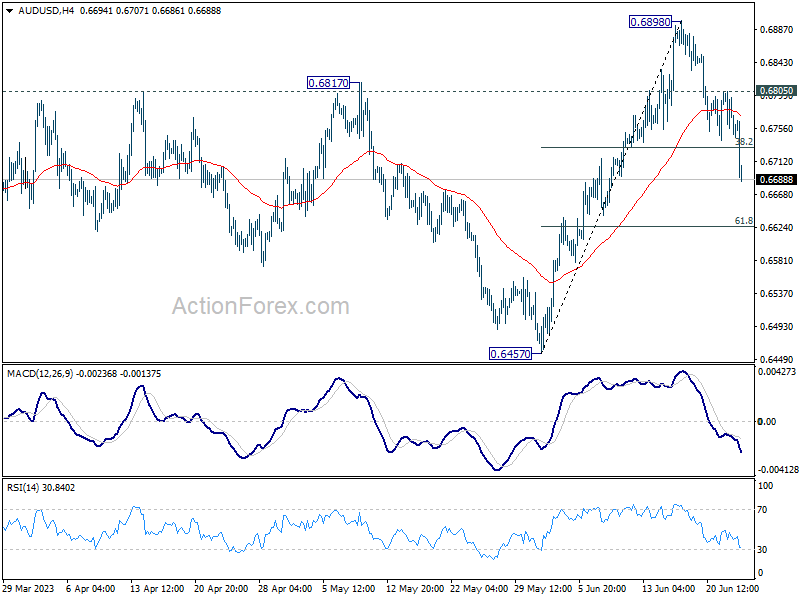
AUD/USD's fall from 0.6898 accelerates through 38.2% retracement of 0.6457 to 0.6898 at 0.6730. Intraday bias is now on the downside for deeper decline to 61.8% retracement at 0.6625. On the upside, break of 0.6805 resistance is needed to indicate completion of the fall. Otherwise, risk will stay on the downside in case of recovery.
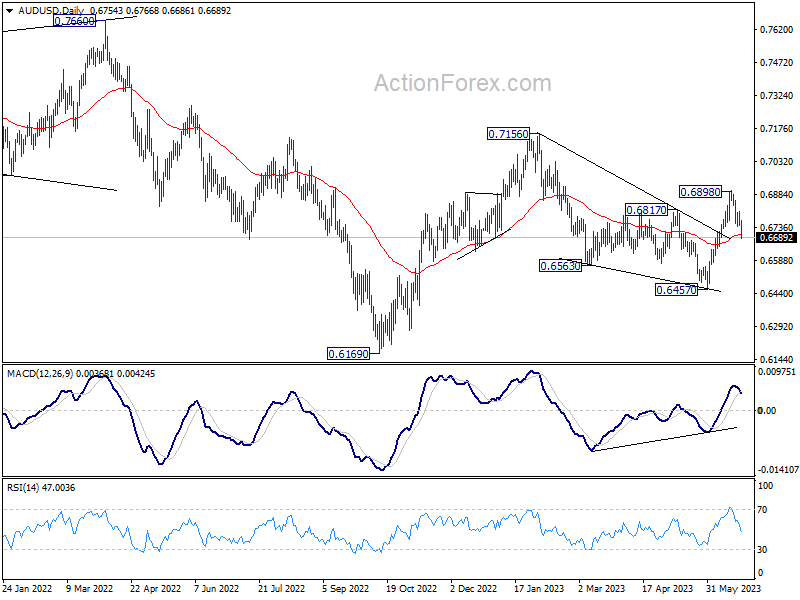
In the bigger picture, fall from 0.7156 could have completed in a three wave corrective structure at 0.6457. The development argues that rise from 0.6169 (2022 low) is still in progress. Firm break of 0.7156 will also add to the case that whole down trend from 0.8006 (2021 high) has finished and turn medium term outlook bullish. For now this will be the favored case as long as 55 D EMA (now at 0.6694) holds, even in case of deep pull back.
USD/JPY Daily Outlook
Daily Pivots: (S1) 142.07; (P) 142.65; (R1) 143.69; More...
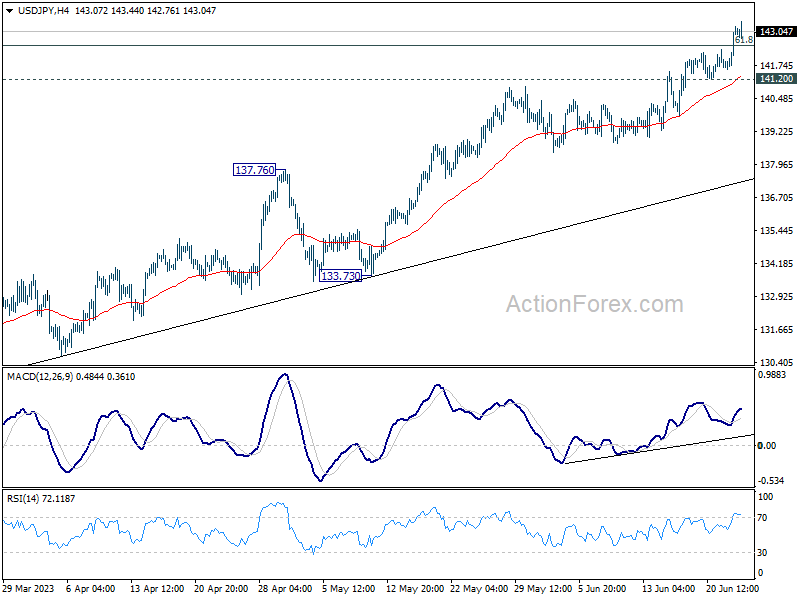
USD/JPY's rally continues today and breaks through 61.8% retracement of 151.93 to 127.20 at 142.48. Intraday bias stays on the upside at this point. Sustained trading above 142.28 will pave the way to retest 151.93 high. On the downside, break of 141.20 minor support will turn intraday bias neutral first.
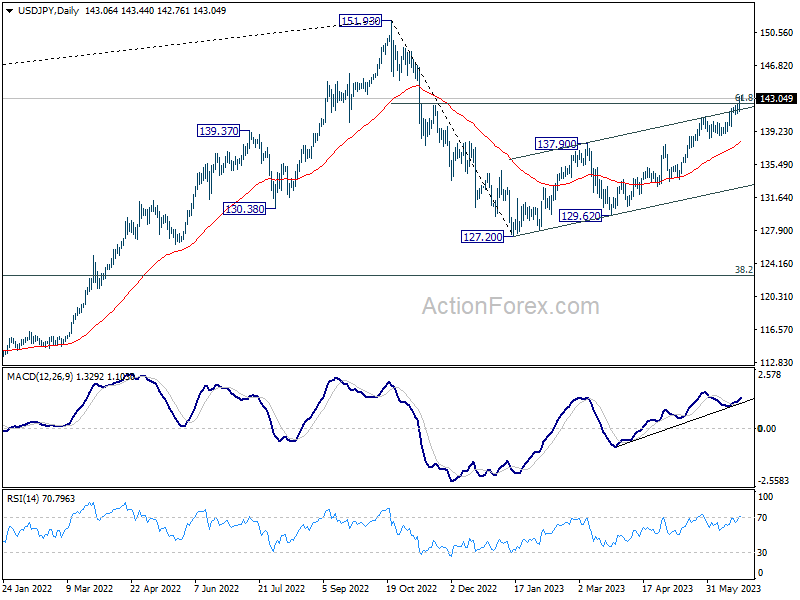
In the bigger picture, rise from 151.93 are seen as a corrective pattern to up trend from 102.58. The first leg has completed at 127.20. Rebound from there is seen as the second leg, and should be limited below 151.93. Sustained trading below 55 D EMA (now at 137.47) will argue that the third leg has started back to 127.20 and possibly below.
USD/CHF Daily Outlook
Daily Pivots: (S1) 0.8914; (P) 0.8943; (R1) 0.8979; More...
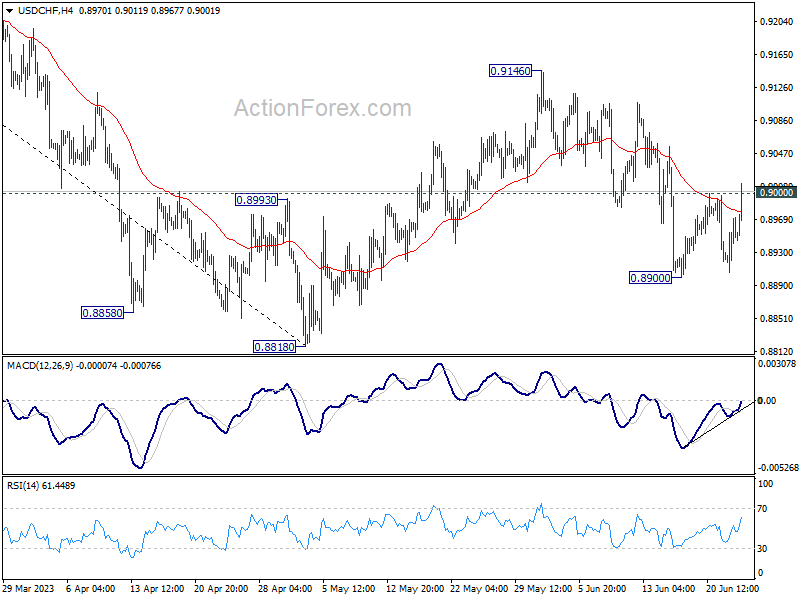
Break of 0.9000 resistance suggests that choppy fall from 0.9146 might have completed at 0.8900 already. Intraday bias is back on the upside for stronger rise to 0.9146 resistance. on the downside, though, break of 0.8900 will 0.8818 and possibly below.
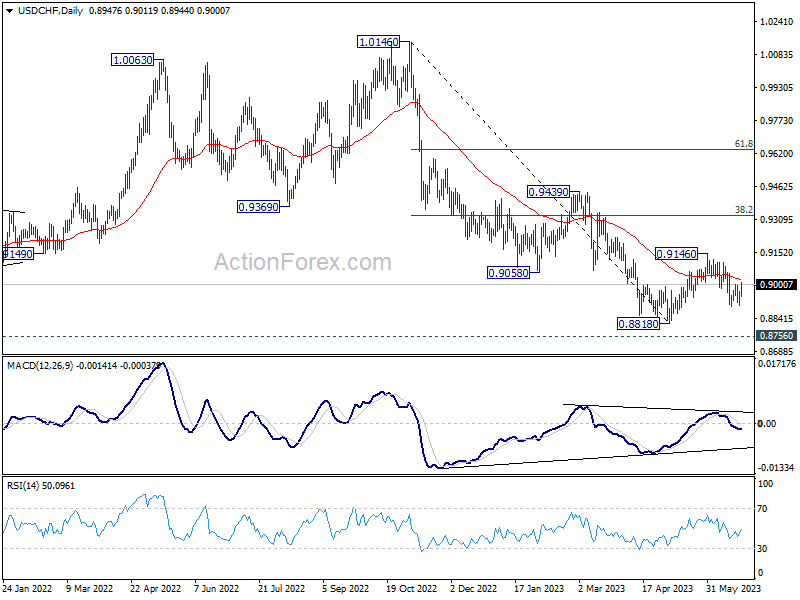
In the bigger picture, fall from 1.1046 (2022 high) is seen as a leg in the long term range pattern from 1.0342 (2016 high), which might have completed at 0.8818 already, just ahead of 0.8756 long term support. Sustained trading above 0.9058 support turned resistance should confirm medium term bottoming.
GBP/USD Daily Outlook
Daily Pivots: (S1) 1.2707; (P) 1.2767; (R1) 1.2809; More...
Intraday bias in GBP/USD remains neutral for the moment. On the upside, firm break of 1.2847 will resume larger up trend and target 100% projection of 1.1801 to 1.2678 from 1.2306 at 1.3183 next. However, firm break of 1.2628 will turn bias to the downside, for deeper fall to 1.2306 support instead.
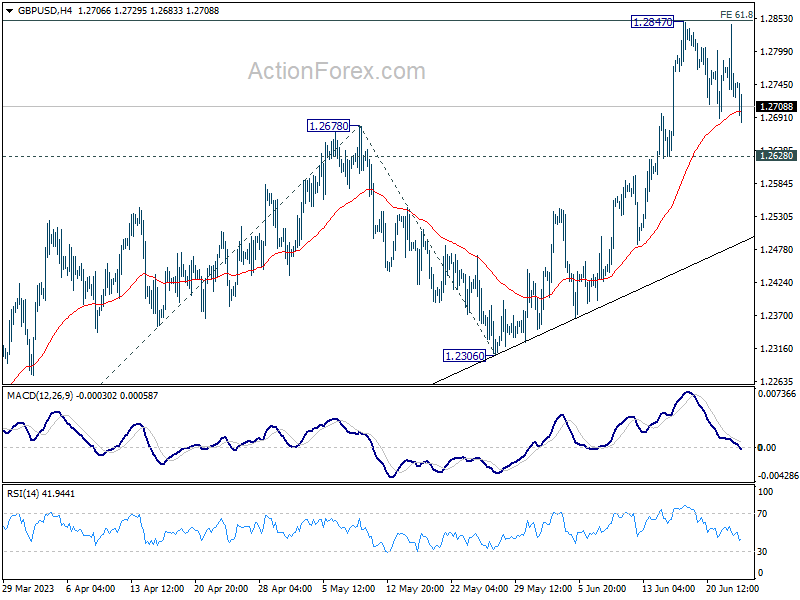
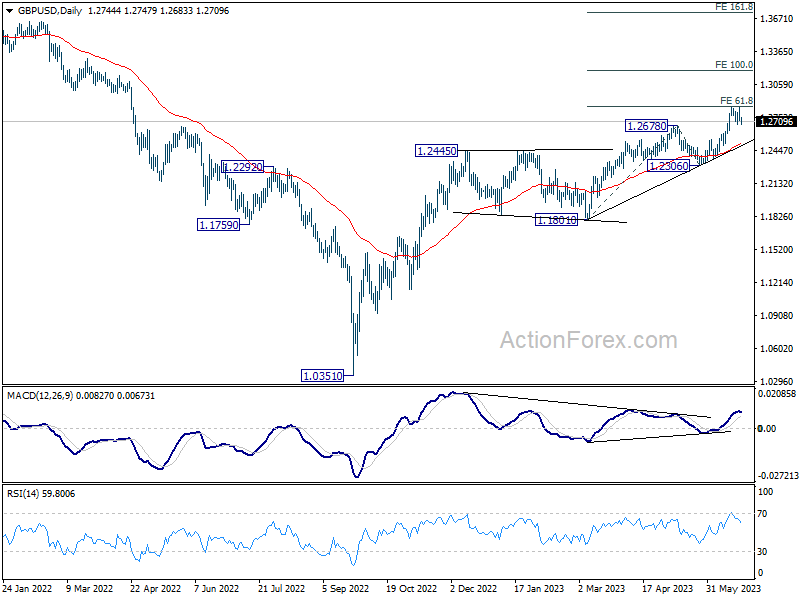
In the bigger picture, the strong support from 55 W EMA (now at 1.2345) is a medium term bullish sign. Outlook will stay bullish as long as 1.2306 support holds. Rise from 1.0351 medium term bottom (2022 low) is expected to extend further to retest 1.4248 key resistance (2021 high).
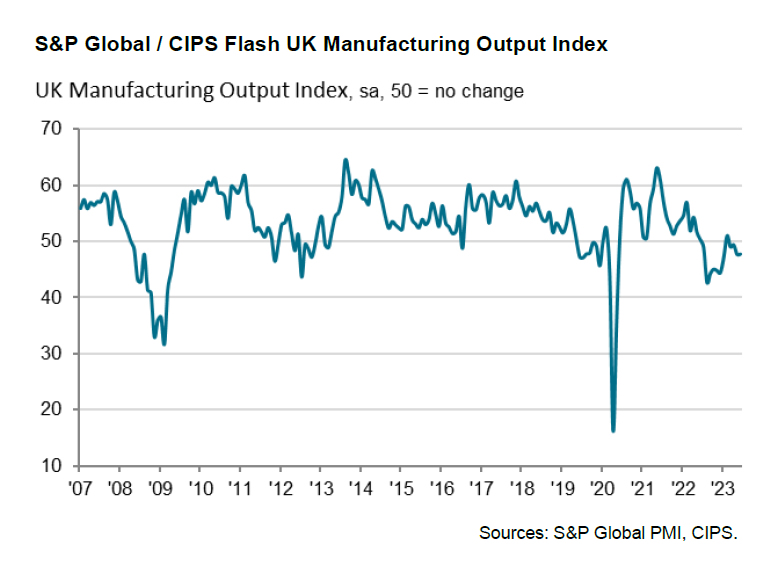
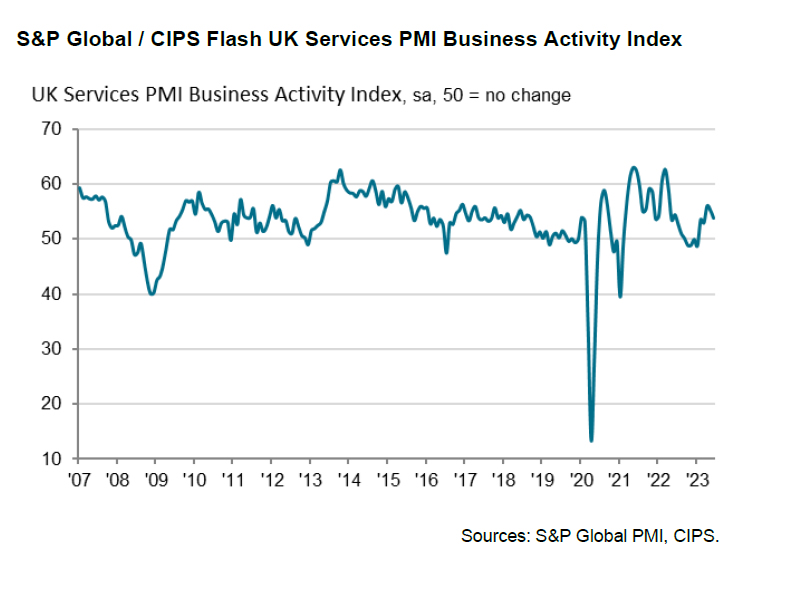
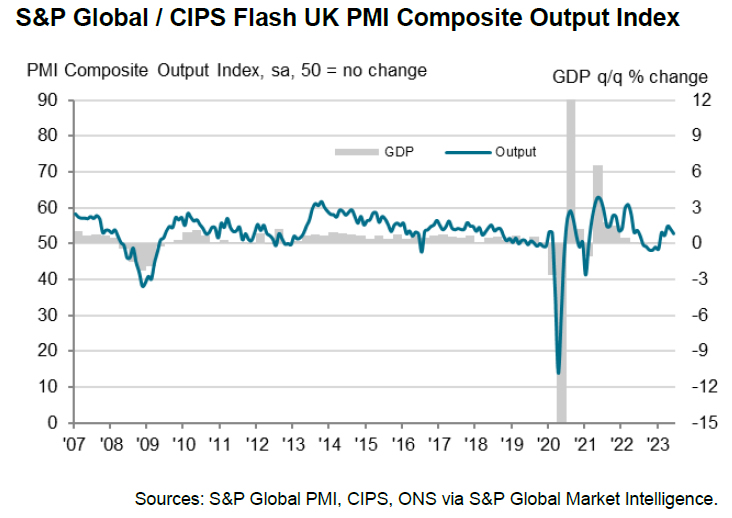
UK PMI manufacturing down to 46.2, Services down to 53.7
UK PMI Manufacturing fell from 47.1 to 46.2 in June, a 6-month low. PMI Services dropped from 55.2 to 53.7, a 3-month low. PMI Composite lowered from 54.0 to 52.8, a 3-month low.
Chris Williamson, Chief Business Economist at S&P Global Market Intelligence said:
"June's flash PMI survey indicates that the UK economy has lost momentum again after a brief growth spurt in the spring, and looks set to weaken further in the months ahead.
"Most notably, consumer spending on services, which was a core growth driver in the spring, is now showing signs of faltering... The manufacturing sector meanwhile continues to report recessionary conditions.
"One notable area of resilience in the economy is the labour market...While falling backlogs of work suggest this hiring trend could also fade in the coming months as the economy weakens.
"The survey's price gauges point to consumer price inflation remaining well above the Bank of England's target into 2024, which will add to the case for further interest rate hikes...
"Stubbornly elevated price growth in the service sector suggests the Bank of England will consider its fight against inflation as still a work in progress.
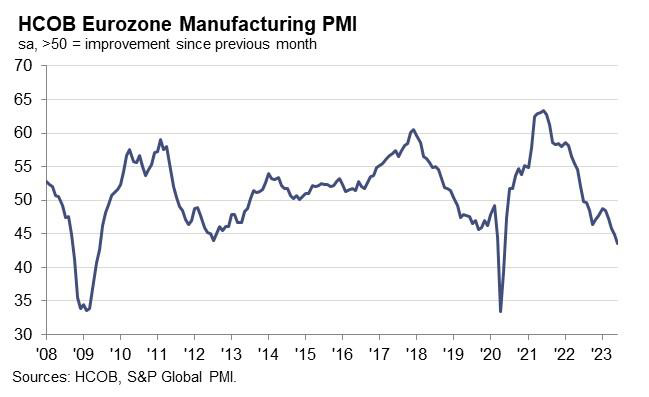
Eurozone PMI manufacturing down to 43.6, services down to 52.4
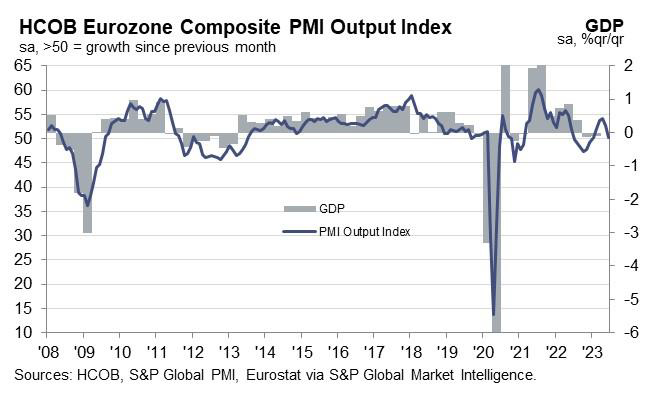
Eurozone PMI Manufacturing fell from 44.8 to 43.6 in June, a 37-month low. PMI Services dropped from 52.4 to 55.1, a 5-month low. PMI Composite tumbled from 52.8 to 50.3, a 5-month low.
HCBO Bank noted in the release that there are diverging trends in the manufacturing and service sectors. Despite falling prices in manufacturing that would typically herald rate cuts, persistent price hikes in the larger service sector continue to slow down core inflation's decline.
Adding to the complexity are regional differences: France's service sector contracted in June while Germany's continues to expand. With Eurozone GDP potentially falling for a third consecutive quarter, the Composite PMI predicts a challenging second half of the year for businesses.
In France, PMI Manufacturing ticked down from 45.7 to 45.5 in June, a 37-month low. PMI Services dropped sharply from 52.5 to 48.0, a 28-month low. PMI Composite fell from 51.2 to 47.3, a 28-month low.
In Germany, PMI Manufacturing fell from 43.2 to 41.0, a 27-month low. PMI Services dropped from 57.2 to 54.1, a 3-month low. PMI Composite declined from 53.9 to 50.8, a 4-month low.
Gold Price and Crude Oil Price Turn Red
Gold price is moving lower below the $1,928 support. Crude oil price is also declining and remains at a risk of more losses below $69.00.
Important Takeaways for Gold and Oil Prices Analysis Today
- Gold price failed to clear the $1,965 resistance and start a fresh decline against the US Dollar.
- It is now following a key bearish trend line with resistance near $1,915 on the hourly chart of gold at FXOpen.
- Crude oil prices are also moving lower below $71.20 and $70.20 levels.
- There was a break below a major bullish trend line with support near $70.85 on the hourly chart of XTI/USD at FXOpen.
Gold Price Technical Analysis
On the hourly chart of Gold at FXOpen, the price struggled to start a fresh increase above the $1,965 resistance. The price started a fresh decline below the $1,938 support.
There was a close below the 50-hour simple moving average and $1,928. It tested the $1,910 support zone. A low is formed at $1,910.40 and the price is now consolidating losses. It is following a key bearish trend line with resistance near $1,915.
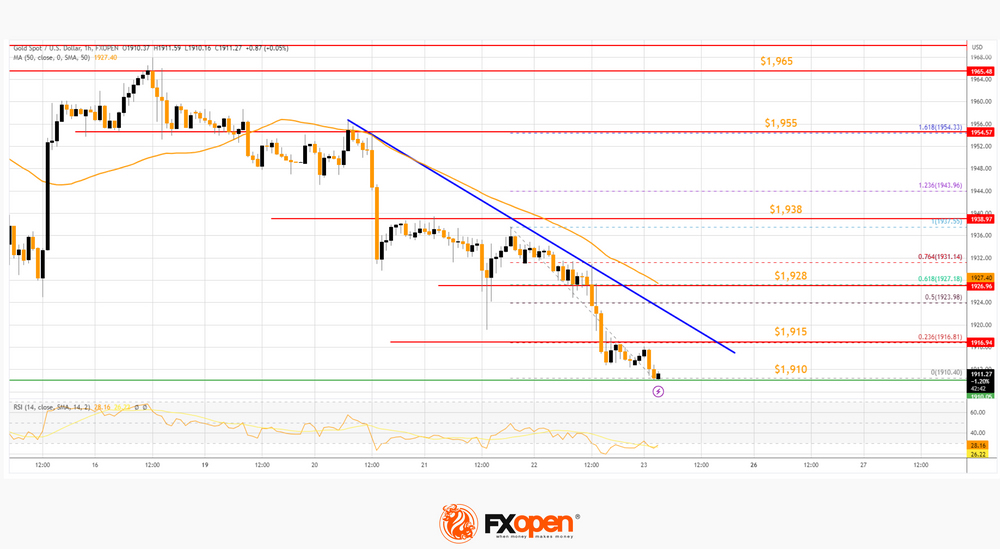
The trend line is close to the 23.6% Fib retracement level of the downward move from the $1,955 swing high to the $1,910 low. The next major resistance is near the 50-hour simple moving average at $1,928.
The 61.8% Fib retracement level of the downward move from the $1,955 swing high to the $1,910 low is also near $1,928. An upside break above the $1,928 resistance could send Gold price toward $1,938. Any more gains may perhaps set the pace for an increase toward the $1,955 level.
Initial support on the downside is near the $1,910 level. The first major support is near the $1,900 level. The main support sits near the $1,885 level. If there is a downside break below the $1,885 support, the price might decline further. In the stated case, the price might drop toward the $1,865 support.
Oil Price Technical Analysis
On the hourly chart of WTI Crude Oil at FXOpen, the price struggled to rise above the $72.60 resistance against the US Dollar. A high was formed near $72.68 and there was a downward move.
There was a break below a major bullish trend line with support near $70.85. The price declined below the 50-hour simple moving average and RSI dropped below 30. It is now consolidating near the 1.236 Fib extension level of the upward move from the $69.74 swing low to the $72.68 high.
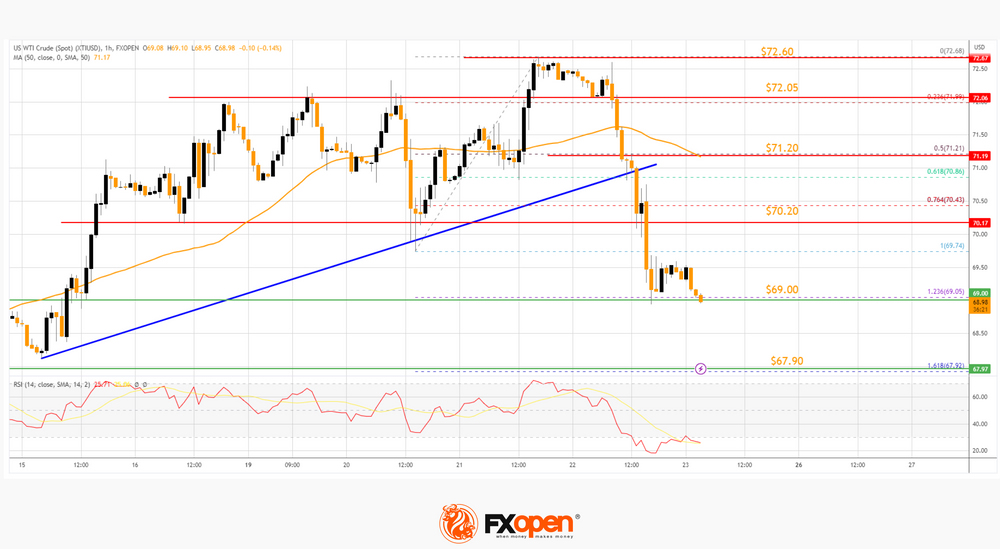
The next major support on the WTI crude oil chart is near $67.90. It coincides with the 1.618 Fib extension level of the upward move from the $69.74 swing low to the $72.68 high.
If there is a downside break, the price might decline toward $67.00. Any more losses may perhaps open the doors for a move toward the $65.50 support zone. If there is a recovery wave, the price might face resistance near $70.20.
The first major resistance is near the 50-hour simple moving average at $71.20. Any more gains might send the price toward the $72.60 level in the coming days.