Sample Category Title
USDCAD Retreats to 9-Month Low, Confirming Bearish Breakout
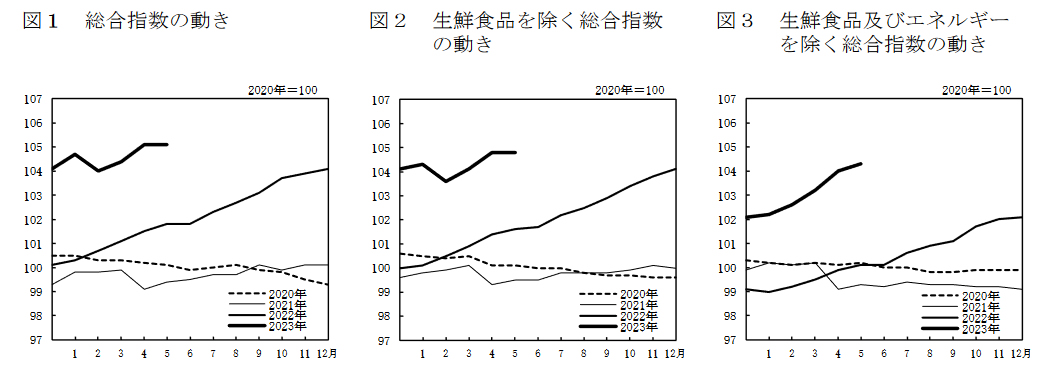
USDCAD has been in a steady downtrend since late May, generating a clear structure of lower highs and lower lows. Moreover, the technical picture deteriorated even further when the price broke below the base of the symmetrical triangle pattern, which triggered a massive decline towards a fresh 9-month low of 1.3137.
The momentum indicators currently suggest that near-term risks are tilted to the downside. Specifically, the RSI bounced off the oversold zone but remains deep in the negative territory, while the MACD is holding below both zero and its red signal line.
Should the bears try to push the price lower, initial support could be met at the recent 9-month low of 1.3137. Piercing that wall, the pair could dive towards 1.3074 or lower to challenge the September 2022 bottom of 1.2960. Further declines could then come to a halt at the August 2022 low of 1.2727.
On the flipside, if the price reverses to the upside, a bunch of previous support levels could serve as resistance in the future. More precisely, the pair could advance towards the November 2022 support of 1.3225 before the February low of 1.3262 gets tested. Even higher, the May support of 1.3319 may curb any upside attempts.
In brief, USDCAD has been on a steep decline after breaking below the base of its recent triangle pattern. Moving forward, traders could shift their attention towards the 1.3000 psychological mark.
GBPJPY Rally Continues Unabated for Now
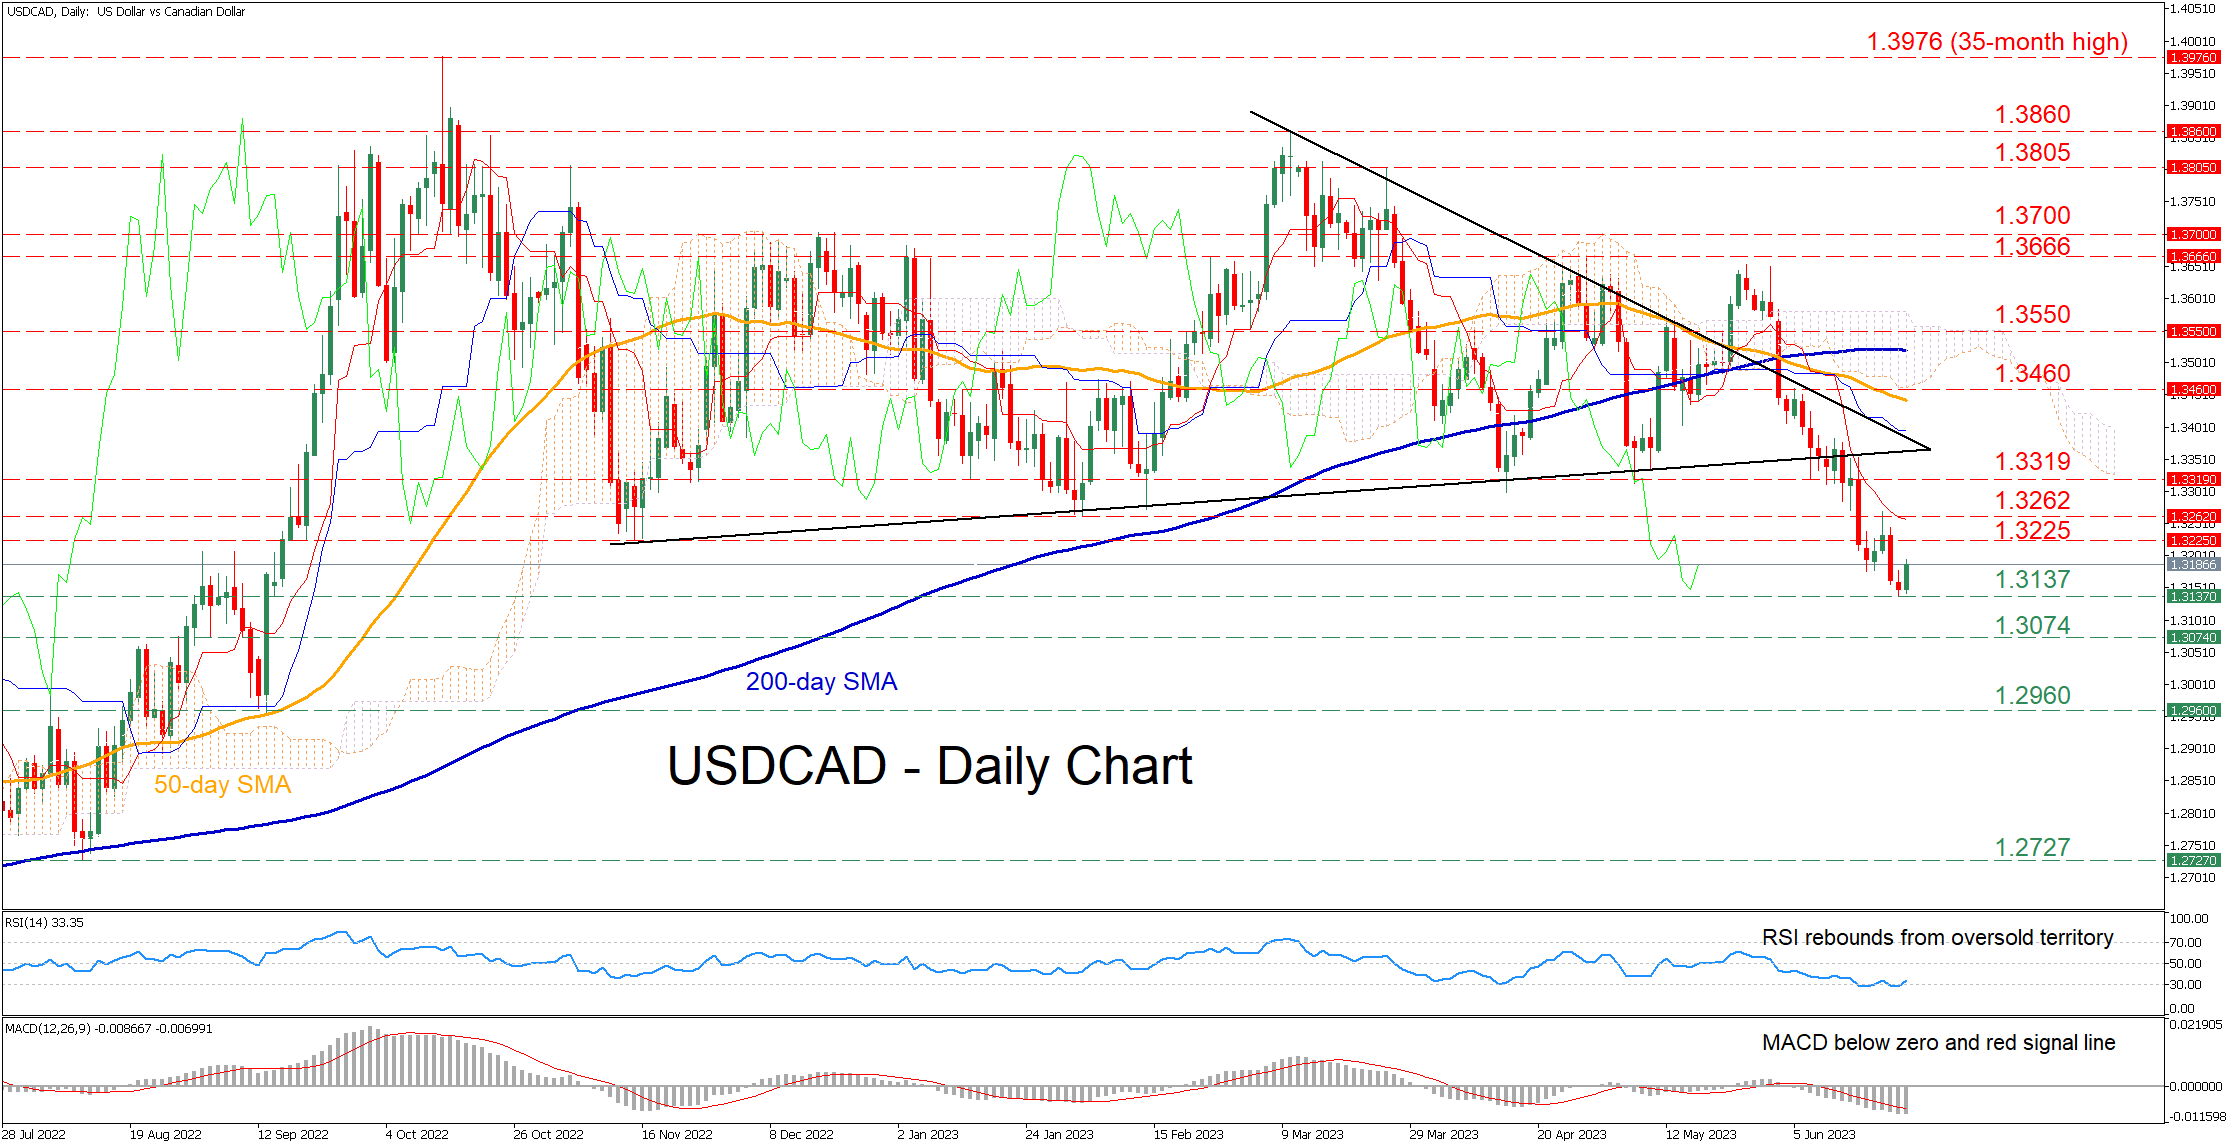
GBPJPY bulls continue to pursue higher highs as they are currently trying to stage a move above the recent 182.54 high. This is the strongest print for 7.5 years and stands 16% higher than the start of the current upleg on March 23, 2023. This move has been exponential, revealing the bulls’ determination but also making this rally susceptible to corrections. We have not seen a correction yet, but it will probably be a sizeable one when it finally occurs.
Understandably the bulls must be over the moon at this stage as on face value the momentum indicators are openly supportive of the rally. However, there are some early exhaustion signs. More specifically, the Average Directional Movement Index (ADX) is hovering at its highest level since the March-April 2022 upleg. However, a potential failure to make a higher high would be a sign of a gradual trend reversal. Similarly, the stochastic oscillator continues to spend its time at the top of its overbought territory. While it can stay there for a considerable amount of time, a glide lower would potentially open the door to bearish pressure.
Should the bulls decide that the recent rally is not enough, they would first try to clear the 182.54 level. They then have the chance to record another 2023 high and push GBPJPY towards the 190 area, which is key from a long-term perspective.
On the other hand, the bears are desperate for some form of a pullback. If they manage to break the April 9, 2001 high at 181.42, they could set their eyes on the 174.50-174.84 range that is populated by the January 2, 2014 high and the 23.6% Fibonacci retracement of the July 20, 2021 – June 22, 2023 uptrend respectively. Breaking this area could be extremely important from a short-term sentiment perspective.
To sum up, GBPJPY bulls remain clearly in control of the market and in pursuit of higher highs. However, they should also prepare for a corrective move especially if the momentum indicators start exhibiting stronger rally-exhaustion signals.
USD/JPY Surged to a 7-month High But Fundamentals Diverge
- USD/JPY rallied by 100 pips and broke above 142.50 resistance in yesterday’s NY session.
- Japan’s headline inflation for May softened but the core-core rate (excluding fresh food & energy) accelerated to 4.3% y/y, a 42-year high.
- High direct correlation between USD/JPY & Nikkei 225 has dissipated.
- Watch the next key resistance zone of 145.50/146.10 for USD/JPY.
In a stunning move, the USD/JPY has rallied by 100 pips from the start of yesterday, the 22 June US session to print an intraday high of 143.23, a level that was last seen in November 2022.
This current bout of JPY weakness has been reinforced by the breakout of a key 142.50 medium-term resistance on the USD/JPY but was not supported by any fresh economic data or event catalyst yesterday. The tonality of the delivery, as well as the questions and answers session for Fed Chair Powell’s second round of congressional semi-annual testimony yesterday on the current state of the US economy and Fed’s monetary policy stance, was the same rhetoric as the first round of testimony delivered earlier on Wednesday, 21 June.
Strong USD/JPY could be due to month-end and quarter-end flows
Thus, yesterday’s strong push-up in the USD/JPY could be related to month-end and quarter-end flows where next week will be the last for June and Q2 2023 as well as some form of anticipation of the outcome of key economic data on Japan that was due this morning, Asian session; inflation for May and flash Manufacturing and Services Purchasing Managers’ Indexes (PMI).
Elevated sticky inflation data while manufacturing activities contracted again
Japan’s headline inflation rose at a slower pace in May, 3.2% year-on-year from April’s three-month high of 3.5%, which also came in below expectations of 4.1%. The core inflation rate (excluding fresh food) also inched lower to 3.2% year-on-year in May from 3.4% in April but managed to beat expectations of 3.1% and remained above Bank of Japan (BoJ)’s 2% target for the 14th consecutive month.
Most importantly, the core-core inflation rate (excluding fresh food & energy), a key barometer of underlying domestic demand-driven price trends continued to accelerate in May and hit a 42-year high of 4.3% year-on-year over April’s print of 4.1%.
These latest inflationary trends out from Japan suggest that sticky inflation that excludes fresh food and energy has continued to grow and remains at an elevated level that runs counter to the latest BoJ’s guidance (from last Friday’s monetary policy decision) that insisted that inflation growth in Japan was at risk of falling in the second half of the current fiscal year.
Thus, the next BoJ’s monetary policy decision in July will be closely watched as it also released its latest quarterly outlook which includes growth and inflation forecasts to see whether BoJ will start to sway away from its ultra-easy monetary policy stance.
Next Friday, 30 June, we will have the Tokyo area inflationary data for June which tends to be a leading indicator for the nationwide inflation trend.
A few economic growth concerns over here as the flash Manufacturing PMI for June hit a contraction mode again of 49.8 after it expanded to 50.6 in May, its highest reading in seven months. In addition, the services sector grew at a slower pace in June where the flash Services PMI came in at 54.2 from 55.9 in May, and below expectations of 56.2.
A weaker JPY does not translate to risk-on behaviour in Nikkei 225 for now
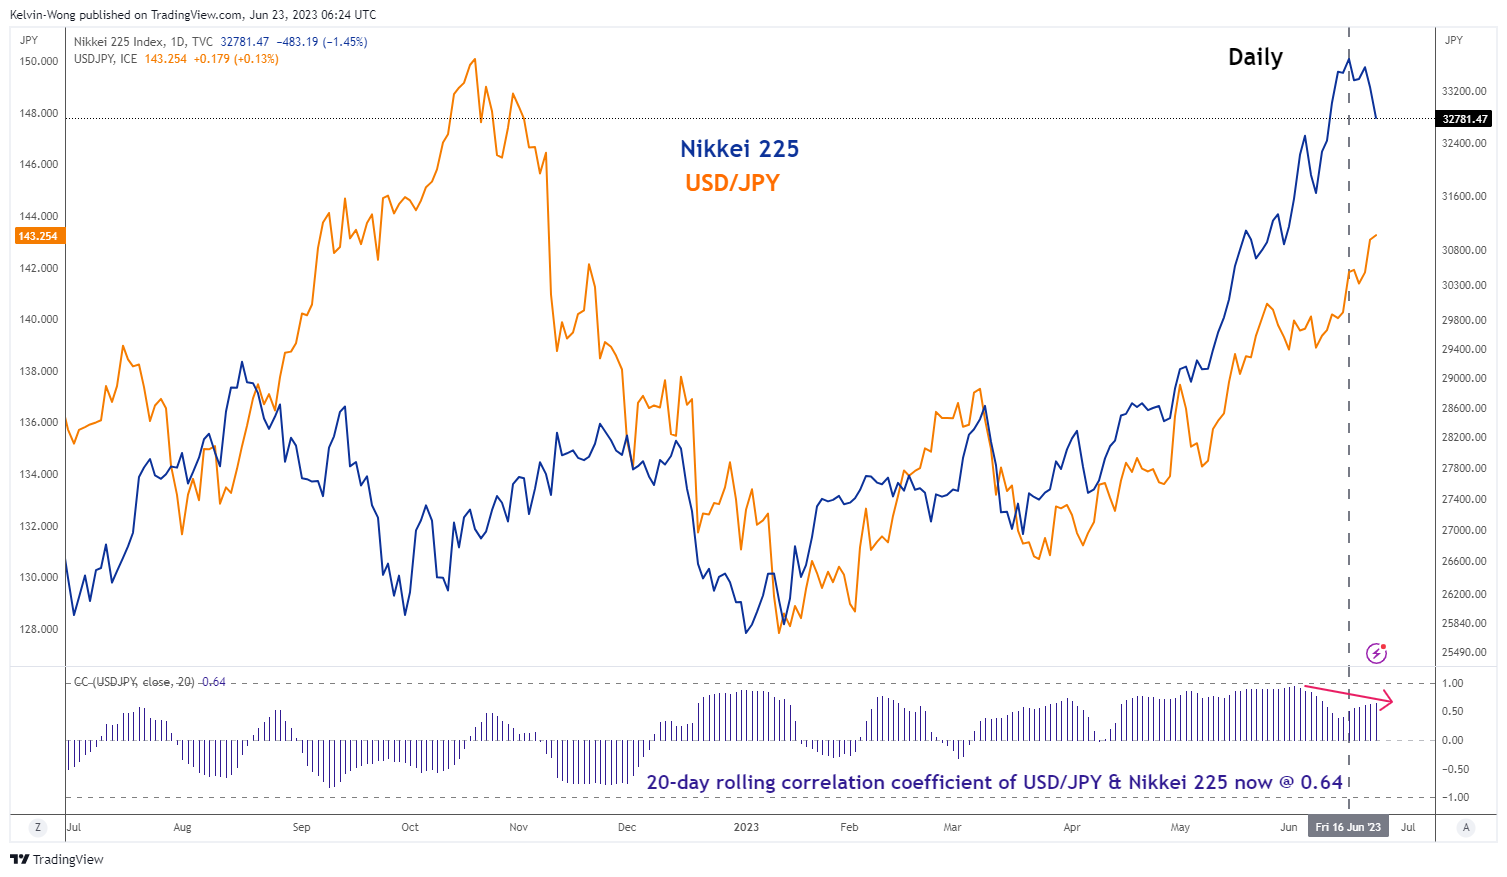
Fig 1: 20-day rolling correlation coefficient trend of USD/JPY & Nikkei 225 as of 23 Jun 2023 (Source: TradingView, click to enlarge chart)
Based on past historical trends, the movement of the Nikkei 225 and the USD/JPY tends to have a high direct correlation level as a weaker JPY (USD/JPY strengthening) tends to fuel risk-on behavior via the carry trade factor as JPY is mostly used as a global funding currency due to its negative interest rate.
Interestingly, this initial high direct correlation between the USD/JPY and Nikkei 225 has started to dissipate in the past two weeks since the Nikkei 225’s steep bull run from March 2023 low hit a 33-year high of 33,772 earlier this month, June.
The 20-day rolling correlation coefficient has fallen to 0.63 from a high of 0.94 printed on 2 June 2023 and the level of around 0.90 was the average for the last three months.
Hence, it seems that the current weakness seen in the Nikkei 225 for the past five days (-3.22% from the 19 June high) has ignored the ongoing rally in USD/JPY (carry trade factor) but rather moved in synch with the current soft footing seen in global equities.
Based on this current week-to-date time frame, major stock indices have declined due to a higher for longer period of interest rates mantra from the Fed and other G-20 central banks (ECB, BoE, BoC); S&P 500 (-0.63%), Nasdaq 100 (-0.28%), STOXX Europe 600 (-2.6%), Hang Seng Index (-6%), and Hang Seng China Enterprises Index (-6.8%) at this time of the writing.
Momentum remains bullish for USD/JPY but watch out for risk aversion & BoJ intervention
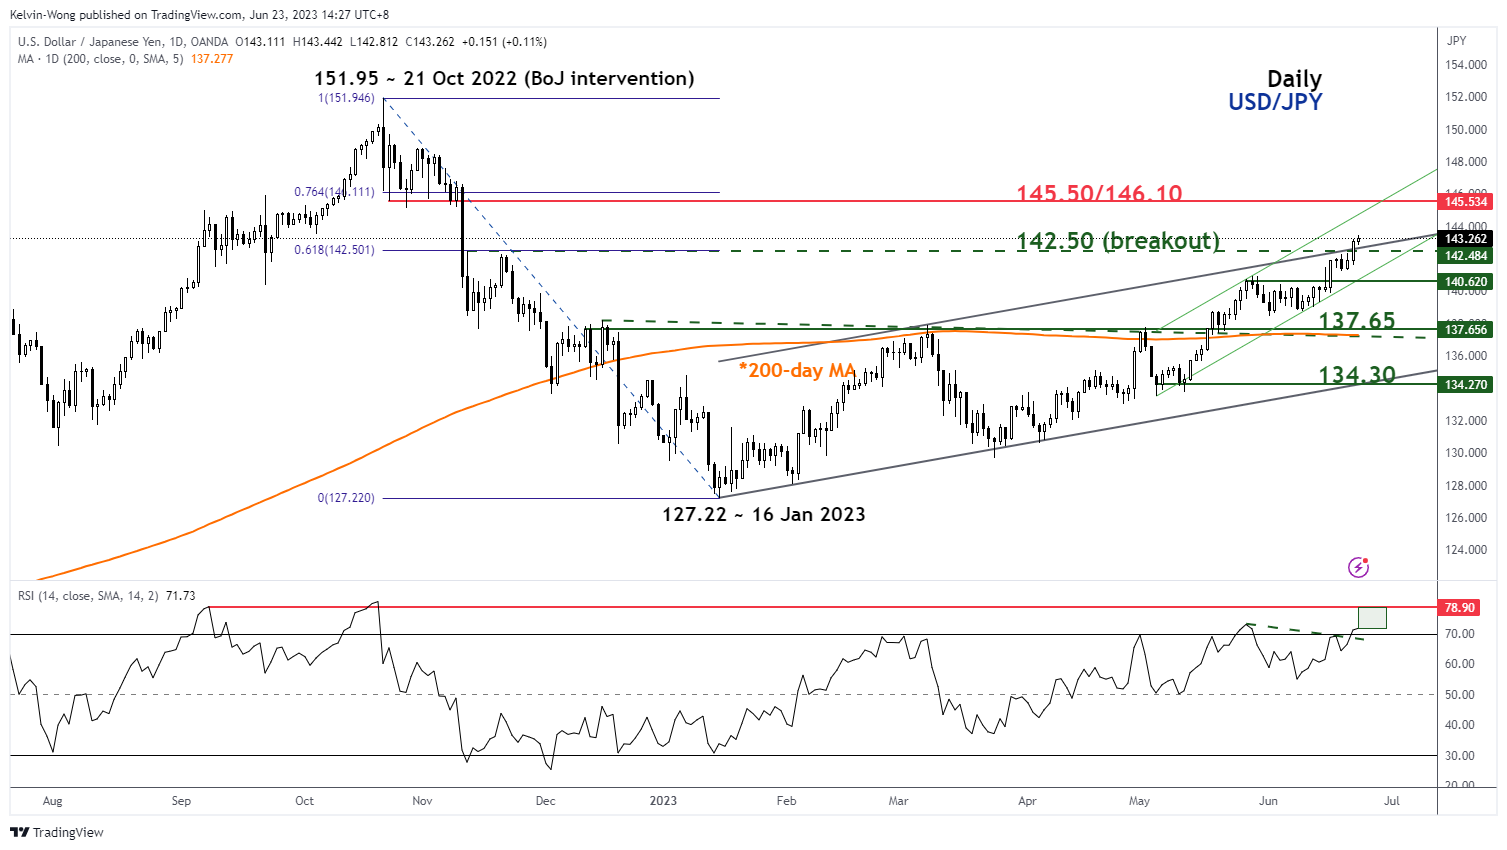
Fig 2: USD/JPY medium-term trend as of 23 Jun 2023 (Source: TradingView, click to enlarge chart)
Technical analysis is suggesting the medium-term uptrend phase of the USD/JPY remains intact since the 16 January 2023 low of 127.22 with the next key resistance zone coming in at 145.50/146.10.
The daily RSI is overbought but has no bearish divergence and has yet to hit an extreme overbought level of 78.90 which has led to a prior significant decline in USD/JPY after its 21 October 2022 swing high. These observations suggest upside momentum remains intact at this juncture.
Two key scenarios may derail this bullish run in USD/JPY. Firstly, global equities especially, the outperforming US mega-cap technology group fuelled by the Artificial Intelligence (AI) growth narrative continue to see further declines which may trigger a bout of risk-averse behavior that tends to see a revival of JPY strength which has occurred in the past.
Secondly, Japan’s Ministry of Finance officials and politicians may start to get “uncomfortable” with the swift up move of USD/JPY and put pressure on BoJ to intervene. Last week, Chief Cabinet Secretary Hirokazu Matsuno commented that excessive movements in the foreign exchange market were not desirable which echoed similar statements made by Vice Finance Minister, Masato Kanda, a top currency official on 30 May.
EUR/USD Daily Outlook
Daily Pivots: (S1) 1.0933; (P) 1.0972; (R1) 1.0995; More...
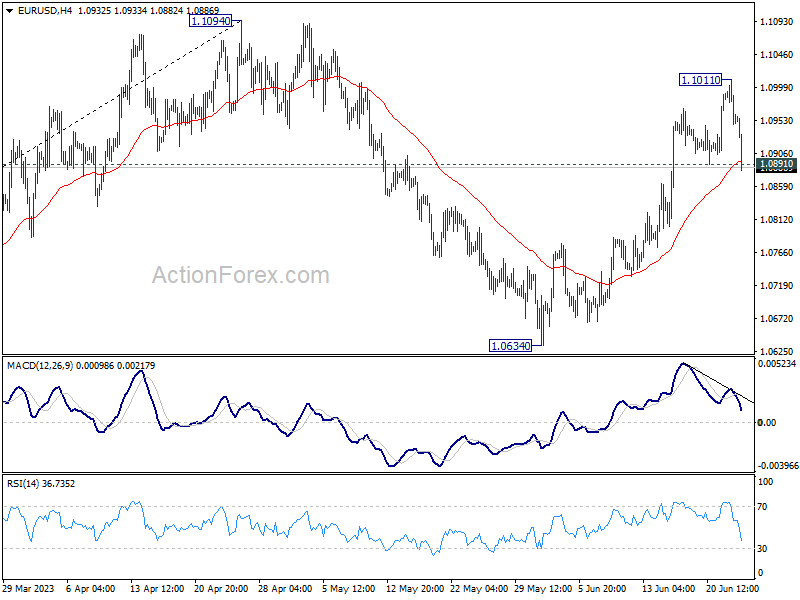
EUR/USD's break of 1.0891 support suggests short term topping at 1.1011, on bearish divergence condition in 4H MACD. Fall from 1.1011 is seen as the third leg of the corrective pattern from 1.1094. Intraday bias is back on the downside for 55 D EMA (now at 1.0838). Firm break there will target 1.0634 support and below. Nevertheless, rebound from current level, followed by break of 1.1011 will target a test on 1.1094 high instead.
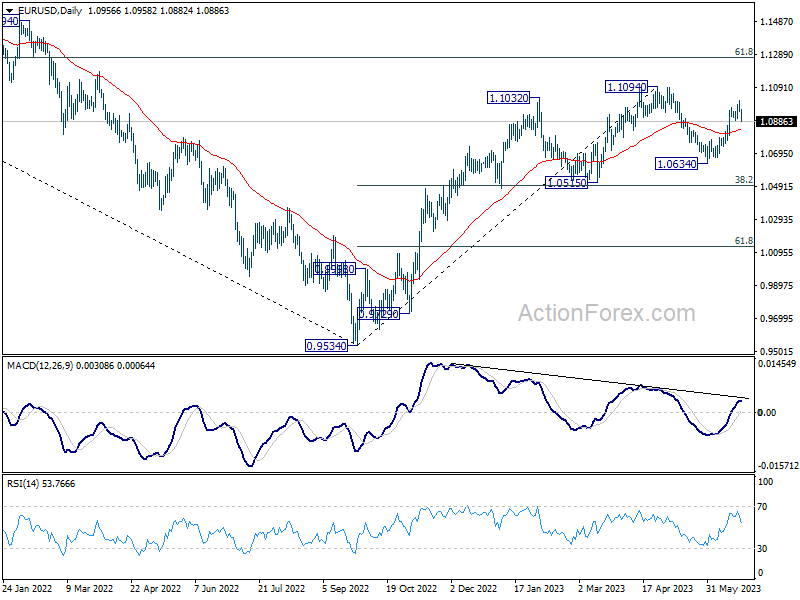
In the bigger picture, as long as 1.0515 support holds, rise from 0.9534 (2022 low) would still extend higher. Sustained break of 61.8% retracement of 1.2348 (2021 high) to 0.9534 at 1.1273 will solidify the case of bullish trend reversal and target 1.2348 resistance next (2021 high).
Dollar Rebounds on Short Covering, Yen Extending Decline
Dollar saw a significant rebound overnight, a rally that carried on into the Asian trading session today. This surge is mainly attributable to short covering, particularly as central bank rate hikes this week failed to drive an extended selloff in the greenback. In fact, Dollar is currently the second strongest performer for the week, closely trailing Canadian. However, the possibility of a shift in this ranking by the week's end remains on the table.
Japanese Yen, on the other hand, is experiencing a momentum pick-up in its decline. Yet, the selloff seems mostly concentrated against Dollar. The Japanese currency currently ranks as the third worst performer, following the Australian and New Zealand Dollars.
Australian Dollar is being dampened by risk aversion within Asia, reflected in its joint weakening with the Hong Kong's HSI. This shared downturn is being interpreted as a lack of confidence vote in the Chinese economy. As for European majors, they are currently mixed, with Sterling showing a slight lower hand. Both Euro and Pound will be looking to today's PMI data for further inspiration.
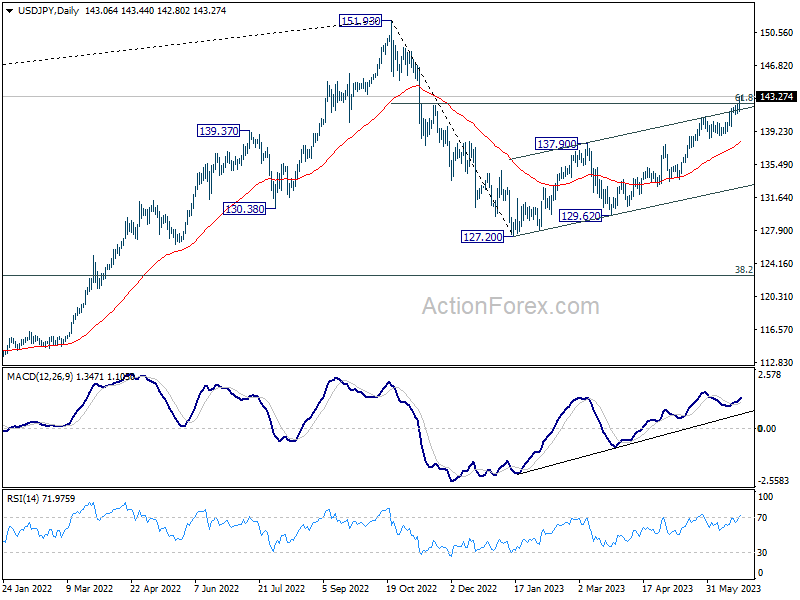
Meanwhile, USD/JPY's rally is worth a note. Purely from a technical standpoint, break of the medium term channel resistance suggests upside acceleration. Clearing of 61.8% retracement of 151.93 to 127.20 at 142.48 could also set the stage for further rise back to retest 151.93 high. Nevertheless, it's unsure at what level Japan will intervene.
In Asia, Nikkei closed down -1.45%. Hong Kong HSI is down -1.64%. Singapore Strait Times is down -0.70%. Japan 10-year JGB yield is down -0.0044 at 0.374. Overnight, DOW rose 0.37%. S&P 500 rose 0.95%. NASDAQ rose 0.95%. 10-year yield rose 0.076 to 3.799.
Japan CPI core eased to 3.2% in May, but core-core surged to 42-yr high
Japan CPI core eased from 3.5% yoy to 4.2% yoy in in May. CPI core (ex-fresh food) fell from 3.4% yoy to 3.2% yoy. CPI core has now stayed above BoJ's 2% target for the 14th consecutive month. Meanwhile, CPI core-core (ex-fresh food and energy), jumped from 4.1% yoy to 4.3% yoy, the highest level in 42 years since 1981.
Energy costs fell -8.2% yoy, thanks to government subsidies. Food prices accelerated from 9.0% yoy to 9.2% yoy, highest since 1975. Durable goods prices rose 9.0% yoy. Goods prices were up 4.7% yoy while services prices rose 1.7% yoy.
Japan PMI manufacturing fell to 49.8, services down to 54.2
Japan PMI Manufacturing declined from 50.6 to 49.8 in June, below expectation of 50.2. PMI Manufacturing Output fell from 50.9 to 48.3. PMI Services dropped from 55.9 to 5.4.2. PMI Composite decreased from 54.3 to 52.3.
Annabel Fiddes, Economics Associate Director at S&P Global Market Intelligence, said:
"A fresh fall in manufacturing output coincided with a softer rise in services activity, leading to the weakest expansion of overall output for four months....
"The softening of growth momentum fed through to reduced optimism around the outlook, with business confidence slipping to a five-month low...
"However, there was some better news in terms of inflationary pressures, which showed further signs of easing. Notably, input price inflation softened to a 22-month low in June, while output charges increased at the softest pace since January."
Australia PMI composite fell to 50.5, RBA has time on their side
Australia PMI Manufacturing ticked up from 48.4 to 48.6 in June. PMI Services fell from 52.1 to 50.7. PMI Composite declined from 51.6 to 50.5.
Warren Hogan, Chief Economic Advisor at Judo Bank said:
"The loss of momentum in recent months will probably give the RBA some comfort that economic activity is slowing down across the economy in 2023, following their consecutive rate hikes in May and June...
"The survey suggests that the RBA has time on their side and does not necessarily need to hike rates again in July. The slowdown taking place across the economy provides further evidence that the point at which the RBA can undertake a genuine pause in their tightening cycle is getting closer.
"We cannot rule out a further hike in the next few months, but we are close to a level of interest rates whereby the RBA can sit back for 4-6 months and observe the effects of past interest rate increases."
EUR/USD Daily Outlook
Daily Pivots: (S1) 1.0933; (P) 1.0972; (R1) 1.0995; More...
EUR/USD's break of 1.0891 support suggests short term topping at 1.1011, on bearish divergence condition in 4H MACD. Fall from 1.1011 is seen as the third leg of the corrective pattern from 1.1094. Intraday bias is back on the downside for 55 D EMA (now at 1.0838). Firm break there will target 1.0634 support and below. Nevertheless, rebound from current level, followed by break of 1.1011 will target a test on 1.1094 high instead.
In the bigger picture, as long as 1.0515 support holds, rise from 0.9534 (2022 low) would still extend higher. Sustained break of 61.8% retracement of 1.2348 (2021 high) to 0.9534 at 1.1273 will solidify the case of bullish trend reversal and target 1.2348 resistance next (2021 high).
Economic Indicators Update
| GMT | Ccy | Events | Actual | Forecast | Previous | Revised |
|---|---|---|---|---|---|---|
| 23:00 | AUD | Manufacturing PMI Jun P | 48.6 | 48.4 | ||
| 23:00 | AUD | Services PMI Jun P | 50.7 | 52.1 | ||
| 23:01 | GBP | GfK Consumer Confidence Jun | -24 | -26 | -27 | |
| 23:30 | JPY | National CPI Y/Y May | 3.20% | 3.50% | ||
| 23:30 | JPY | National CPI Core Y/Y May | 3.20% | 3.10% | 3.40% | |
| 23:30 | JPY | National CPI Core-Core Y/Y May | 4.30% | 4.10% | ||
| 00:30 | JPY | Manufacturing PMI Jun P | 49.8 | 50.2 | 50.6 | |
| 06:00 | GBP | Retail Sales M/M May | 0.30% | -0.20% | 0.50% | |
| 07:15 | EUR | France Manufacturing PMI Jun P | 45.2 | 45.7 | ||
| 07:15 | EUR | France Services PMI Jun P | 52.1 | 52.5 | ||
| 07:30 | EUR | Germany Manufacturing PMI Jun P | 43.6 | 43.2 | ||
| 07:30 | EUR | Germany Services PMI Jun P | 56.3 | 57.2 | ||
| 08:00 | EUR | Eurozone Manufacturing PMI Jun P | 44.9 | 44.8 | ||
| 08:00 | EUR | Eurozone Services PMI Jun P | 54.5 | 55.1 | ||
| 08:30 | GBP | Manufacturing PMI Jun P | 46.8 | 47.1 | ||
| 08:30 | GBP | Services PMI Jun P | 54.9 | 55.2 | ||
| 13:45 | USD | Manufacturing PMI Jun P | 48.5 | 48.4 | ||
| 13:45 | USD | Services PMI Jun P | 54 | 54.9 |
CHF Gives up Gains
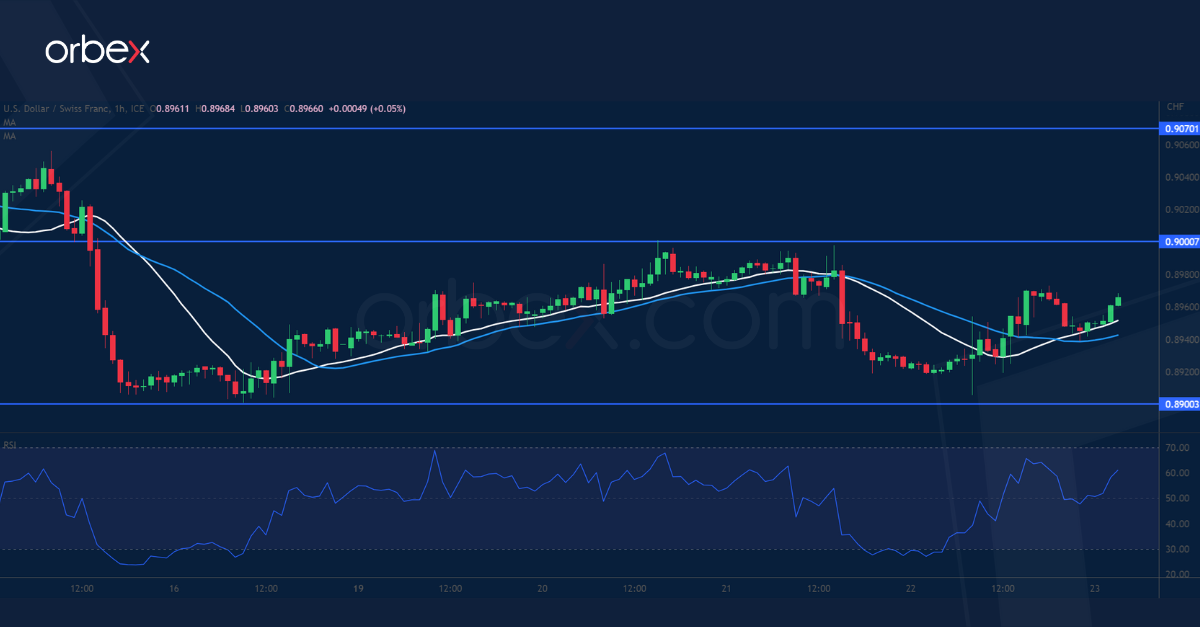
USD/CHF bounces back
The Swiss franc softened as the SNB disappointed with a mere 25 basis point rate hike. A previous rebound came under pressure in the supply zone of 0.9000, which was a sign of a lingering downbeat mood as sellers were eager to fade the rally. The bulls will need to clear this psychological hurdle then 0.9070 before a recovery could materialise. 0.8900 is a fresh support and its breach would invalidate the rebound and send the pair to the May lows around 0.8830, confirming a bearish MA cross on the daily chart in the process.
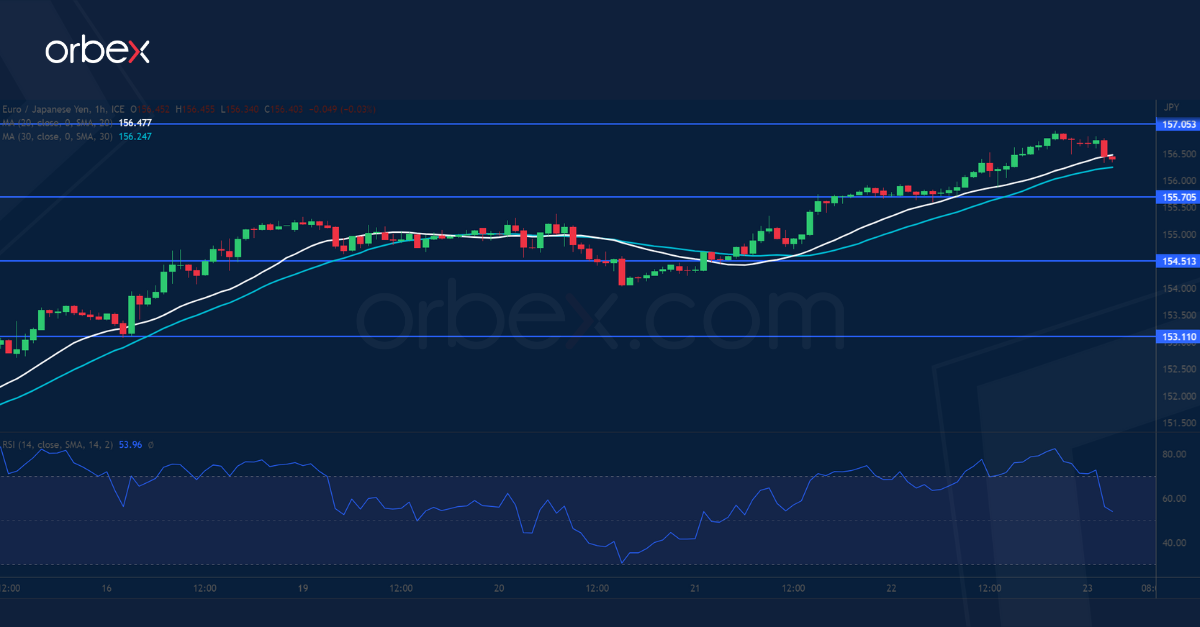
EUR/JPY seeks support
The Japanese yen recouped some losses after May’s CPI beat expectations. The bulls have doubled down after pushing above the previous peak of 155.30, resuming the uptrend with 157.00 as the next milestone ahead. The RSI’s new top in the overbought zone may lead to a temporary pullback, which is likely to meet interest from trend followers. 155.70 is the first support level should the bulls start to take some chips off the table, and 155.00 at the base of the current leg of rally would be a key level to maintain the momentum.
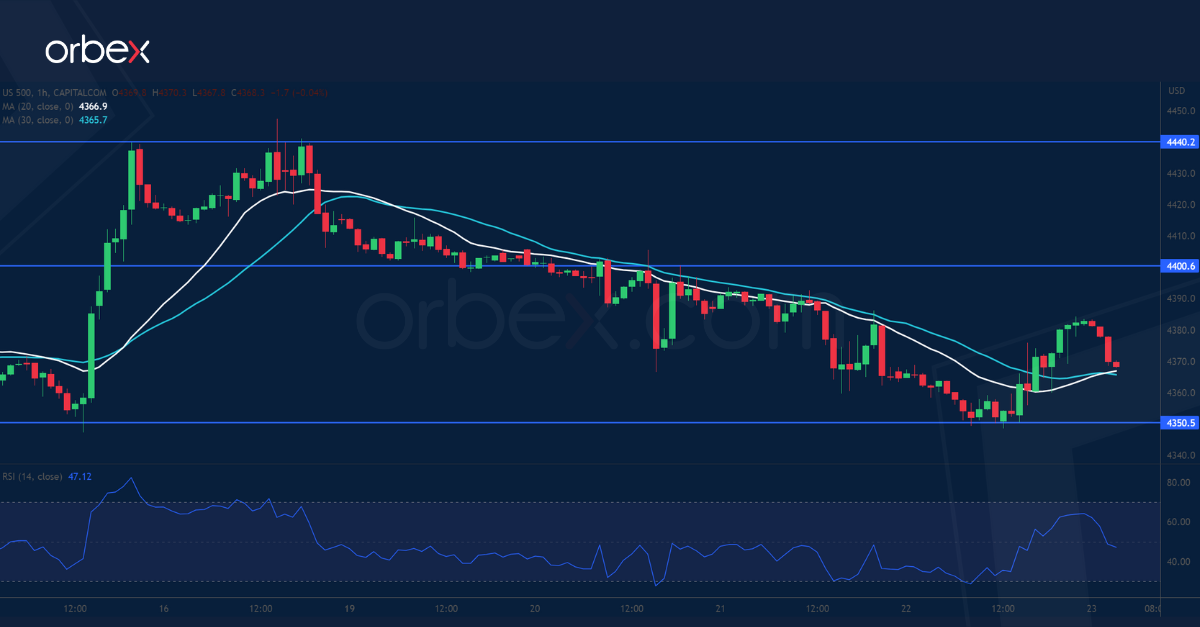
US 500 grinds support
The S&P 500 struggles as Fed Chair Powell defends his hawkish stance on the second day of his testimony. The index is pulling back from its 14-month peak of 4440 and is testing 4350 with the daily RSI dropping back into the neutral area. A bearish breakout would force leveraged long positions to liquidate and cause a correction to 4300 which coincides with the 30-day SMA. Medium-term sentiment remains upbeat and the bulls would be looking for a stable entry point. A close back above 4400 could put the index back on track.
Dollar Shows First Signs of a Bottoming
Markets
Focus turned to the Bank of England (+50 bps to 5%), the Norges Bank (+50 bps to 3.75%), the Swiss national bank (+25 bps to 1.75%) and the Central bank of Turkey (CBRT +650 bps to 15%) yesterday. One way or another, they all had to cope with stickier than expected inflation, at least partially due to a resilient labour market keeping demand at a higher level than what is needed to bring inflation sustainably back to target. It might be coincidence, but none of the four countries’ currencies really gained, even not NOK or GBP which received larger than expected interest support. It suggests that markets think further catching up action is needed to bring policy back ‘ahead of the curve’. This feeling also dominated core global markets. Without high profile news, US yields were captured in an intraday uptrend. Rather soft jobless claims release (264k) didn’t change the course of events. Fed Powell before the Senate openly admitted that two additional rate hikes might be appropriate. US yields added between 8.5 bps (5-y) and 6.2 bps (30-y). The German yield curve inverted further with yields rising between 8.8 bps (2-y) and 2.7 bps (30-y). Even with US real yields (10-y 1.56%) trending higher again, the damage for equities remained negligible/non-existent. (Eurostoxx -0.42%, Nasdaq + 0.95%). On FX markets, the dollar shows first signs of a bottoming after the June setback. DXY closed at 102.38. The test of EUR/USD 1.10 earlier this week seems rejected (close 1.0956). As indicated, EUR/GBP closed only marginally softer at 0.8595 despite the 50 bps BoE rate hike.
Asian markets shifted further into risk-off modus this morning, with the Nikkei losing 1.8%. Mainland China markets are closed. The dollar is gaining further traction (EUR/USD 1.093, DXY 102.64). Monthly PMI releases take center stage. The US composite PMI is expected to ease from 54.3 to 53.5 with momentum in the services sector cooling at lofty levels. A similar pattern is penciled in for EMU (composite expected at 54.5 from 55.1). Question is whether the slowdown in demand is big enough for markets to see tightness in the labour market easing and filtering through into less demand-driven inflation. We’re not convinced that this will already be the case. So the downside in core yields might remain well protected. USD is ripe for a technical rebound, especially if the equity correction accelerates. EUR/USD dropping below 1.09 would call off the ST upside pattern in the cross rate. UK May retail sales this morning printed slightly stronger than expected (0.3% M/M, -2.1% Y/Y). Sterling hardly reacts (EUR/GBP 0.8600).
News and views
Japanese inflation eased from 3.5% to an expected 3.2% in May. Energy again played a huge role, with utilities bills dropping a sharp 3.9% m/m. The core gauge excluding fresh food slowed as well, be it a bit less than anticipated, from 3.4% to 3.2% (vs 3.1% consensus). Excluding both food and energy, prices accelerated to a new 42-year high of 4.3%. The Bank of Japan last week kept policy parameters unchanged and didn’t hint at a short-term change either as it considers the current price uptick mainly as supply/cost-driven. With each release, however, inflation raises pressure on the BoJ. Market attention has shifted to the July meeting, when new forecasts are due, for a potential policy tweak. By then, the BoJ will also have received the June inflation print. Meanwhile, monetary policy divergence with core countries has pressured the yen to the lowest level since November last year against the dollar (USD/JPY around 143). EUR/JPY even trades at its strongest in 15 years (EUR/JPY comfortably above 156). The Japanese currency’s gains today are negligible.
UK GfK consumer confidence continued to recover in May. The indicator rose from -27 to -24 vs -26 expected and is now at the highest level since January last year. Confident consumers appear at odds with gloomy reports of searing mortgage rates as a result of the Bank of England’s tightening campaign (+50 bps yesterday). But with the majority of mortgages at a fixed interest rate, it is taking a long time to filter through in household finances. At the same time the UK labour market is still very tight, helping consumers to withstand the current high inflation pretty well. According to Joe Staton, director of client strategy for GfK, the “most telling finding” is the subindex measuring the outlook for personal finances (12 months ahead). That indicator rose 7 points (to -1) and is almost in positive territory for the first time since December 2021. Savings intentions rose to equal the highest post-GFC level (25).
Keeping Up with the Central Banks
There were three major surprises from three central banks yesterday.
BoE hikes 50bp, peak rate seen unchanged past 6%
The Bank of England’s (BoE) decision to step up the pace of rate hikes at the 13th meeting since the start of the tightening policy has been broadly unwelcomed from households, to bond and stock investors, and to FX traders.
The 2-year gilt yield stabilized above the 5% mark, yet didn’t take a lift on doubt that the BoE could hike by another full percentage point without wreaking havoc across the British economy, especially in the property market. The 10-year yield fell on the morose economic outlook. At this point, it would be a miracle for Britain to avoid recession, and even a property crisis.
The FTSE 100 slumped below its 200-DMA, and tipped a toe below the 7500 mark. Trend and momentum indicators are negative, and the index is now approaching oversold conditions. It is worth noting that falling energy and commodity prices due to a softish Chinese reopening didn’t play in favour of the British big caps this year. The rising rates step up the bearish pressure. The outlook remains neutral to negative until we see a rebound in global energy prices - which is not happening for now.
The pound fell as a reaction to the 50bp hike. You would’ve normally expected the opposite reaction, but the bears remained in charge of the market, pricing the fact that the dark clouds that are gathering over Britain will destroy more value than the higher rates could create.
In summary, it was a disastrous week for Britain. But at least one person didn’t get discouraged by the data and the BoE hike, and it was Rishi Sunak who said that the British economy is ’going to be ok’ and that he is ‘100% on it’.
He is not scared of being ridiculous
Moving forward, the Gilt market will likely remain under pressure, the longer end of the yield curve will do better than the shorter end. The British property market will be put at a tougher test, and could crack under the pressure at any time, in which case the economic implications would go far beyond the most pessimistic forecast. And any government help package to help people go through higher mortgage costs would further fuel inflation and require more rate hikes. The outlook for pound weakens and the FTSE100’s performance is much dependent on China, which is struggling with low inflation and sluggish growth on the flip side of the world. Long story short, there is not much optimism on the UK front.
Elsewhere, the Swiss National Bank (SNB) raised by 25bp as expected, Norges Bank surprised with a 50bp hike, said that there will be another rate hike in August, while Turkey hiked from 8.5% to 15% vs 20% expected, raising worries that Turkey’s new central bank team could not shrug off the low-rate-obsessed goventment influence. The dollar-try spiked above the 25 level, the highest on record, but not the highest on horizon.
Consume less
The US existing home sales came in better than expected, adding to the optimism that the US real estate market could be doing better after months of negative pressure. The surprising and unexpected progress in US home data is welcomed for the sake of the economic health, but a strong housing market, along with an unbeatable jobs market hint that the Federal Reserve (Fed) will keep hiking rates. Powell confirmed that there could be two more rate hikes in the US before a pause at his semiannual testimony before the Congress, while Janet Yellen said she sees lower recession risks, but that consumer spending should slow.
The US dollar rebounded on hawkish Fed expectations.
Technical Outlook and Review
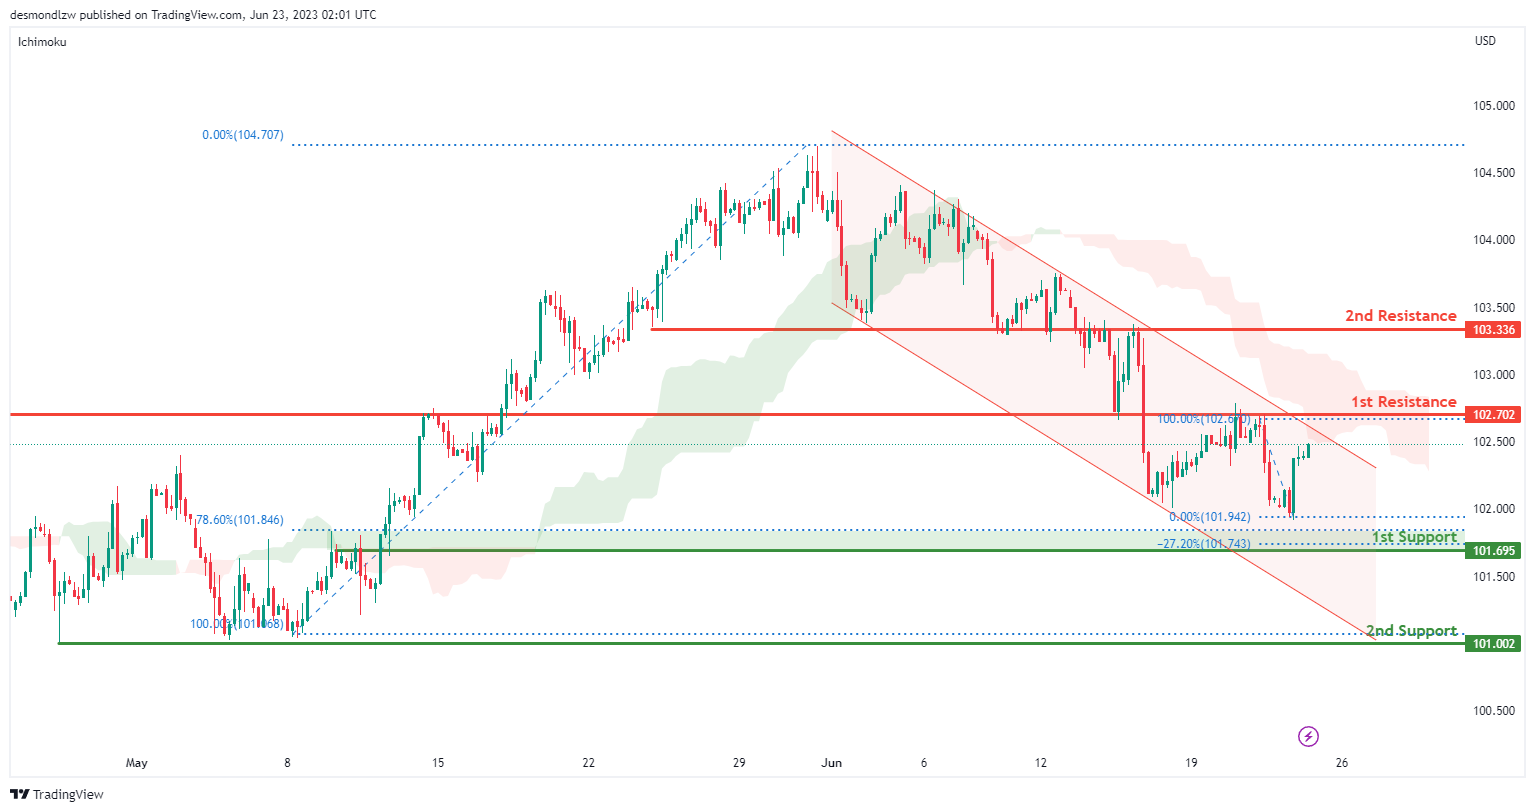
DXY:
The DXY (US Dollar Index) chart exhibits a bearish momentum as indicated by two factors. Firstly, the price is currently positioned below the bearish Ichimoku cloud, reflecting a prevailing bearish sentiment in the market. Secondly, the price movement is confined within a bearish channel, suggesting a continued downward trajectory driven by the existing bearish momentum.
In terms of potential price action, there is a likelihood of a bearish reaction off the first resistance level at 102.70, which is characterized as an overlap resistance. This resistance level has the potential to trigger a bearish response in the market. Subsequently, the price could experience a decline towards the first support level at 101.69.
The first support level at 101.69 holds significance as it is identified as an overlap support, reinforced by the presence of the -27% Fibonacci Expansion and the 78.60% Fibonacci Retracement. This confluence of factors enhances the reliability of this support level. Additionally, the second support level at 101.00 acts as a multi-swing low support, further fortifying the support zone.
Conversely, the first resistance level at 102.70 represents an overlap resistance that could potentially impede upward movement and trigger a bearish response in the market. Similarly, the second resistance level at 103.33 serves as another overlap resistance, reinforcing its importance in hindering further upward price advancement.
EUR/USD:
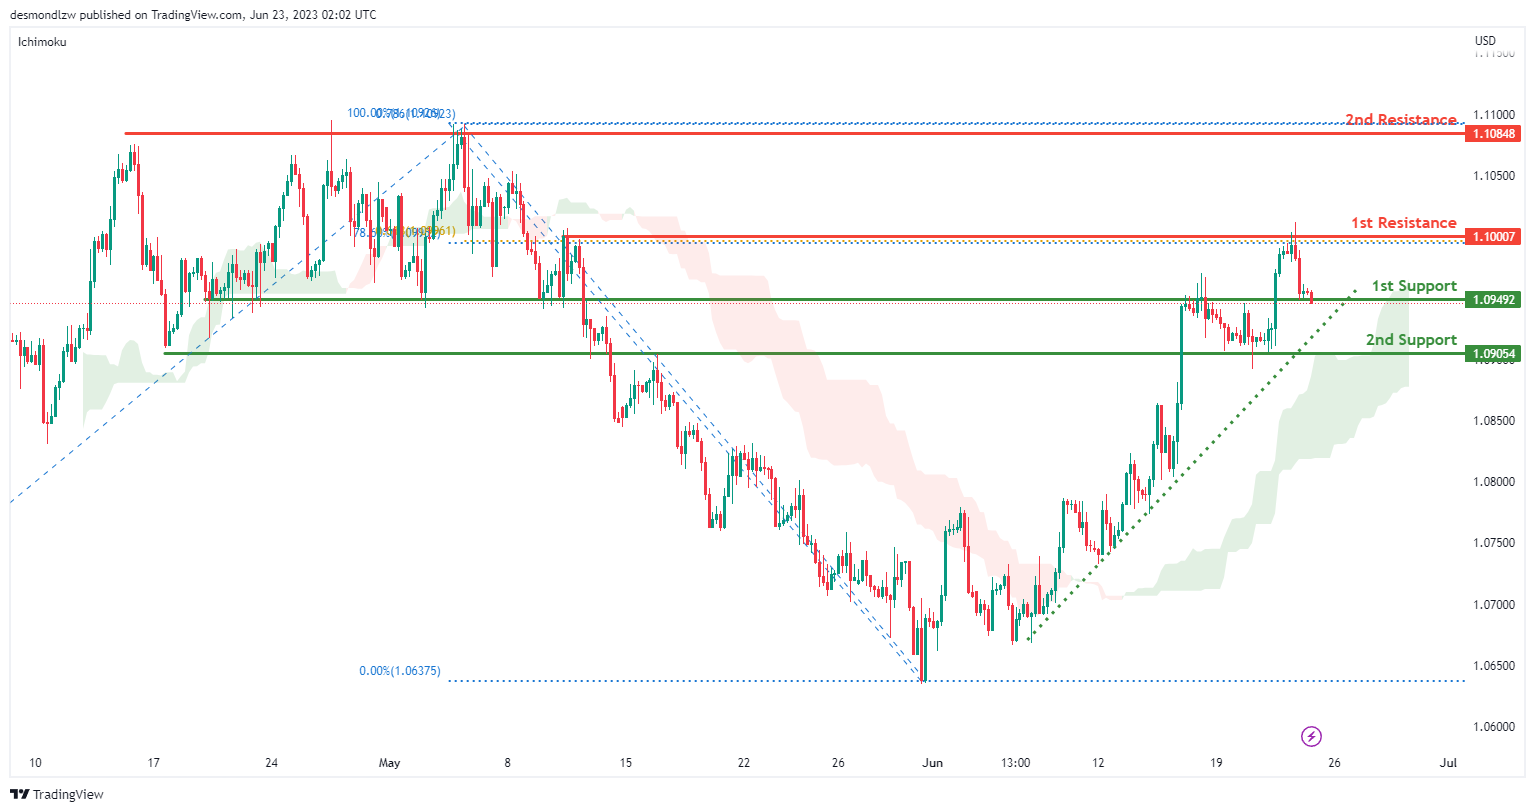
The EUR/USD chart demonstrates a bullish momentum as the price remains above the bullish Ichimoku cloud and a major ascending trend line, indicating further potential for upward movement. There is a possibility of a break off the 1st support at 1.0949 followed by a bounce off the 2nd support at 1.0905 to continue the bullish momentum. The 1st resistance at 1.1000, characterised by a multi-swing high resistance and Fibonacci confluence with the 78.60% Fibonacci Retracement and 61.80% Fibonacci Projection, and the 2nd resistance at 1.1084, acting as another multi-swing high resistance, further reinforce the potential bullish scenario.
GBP/USD:
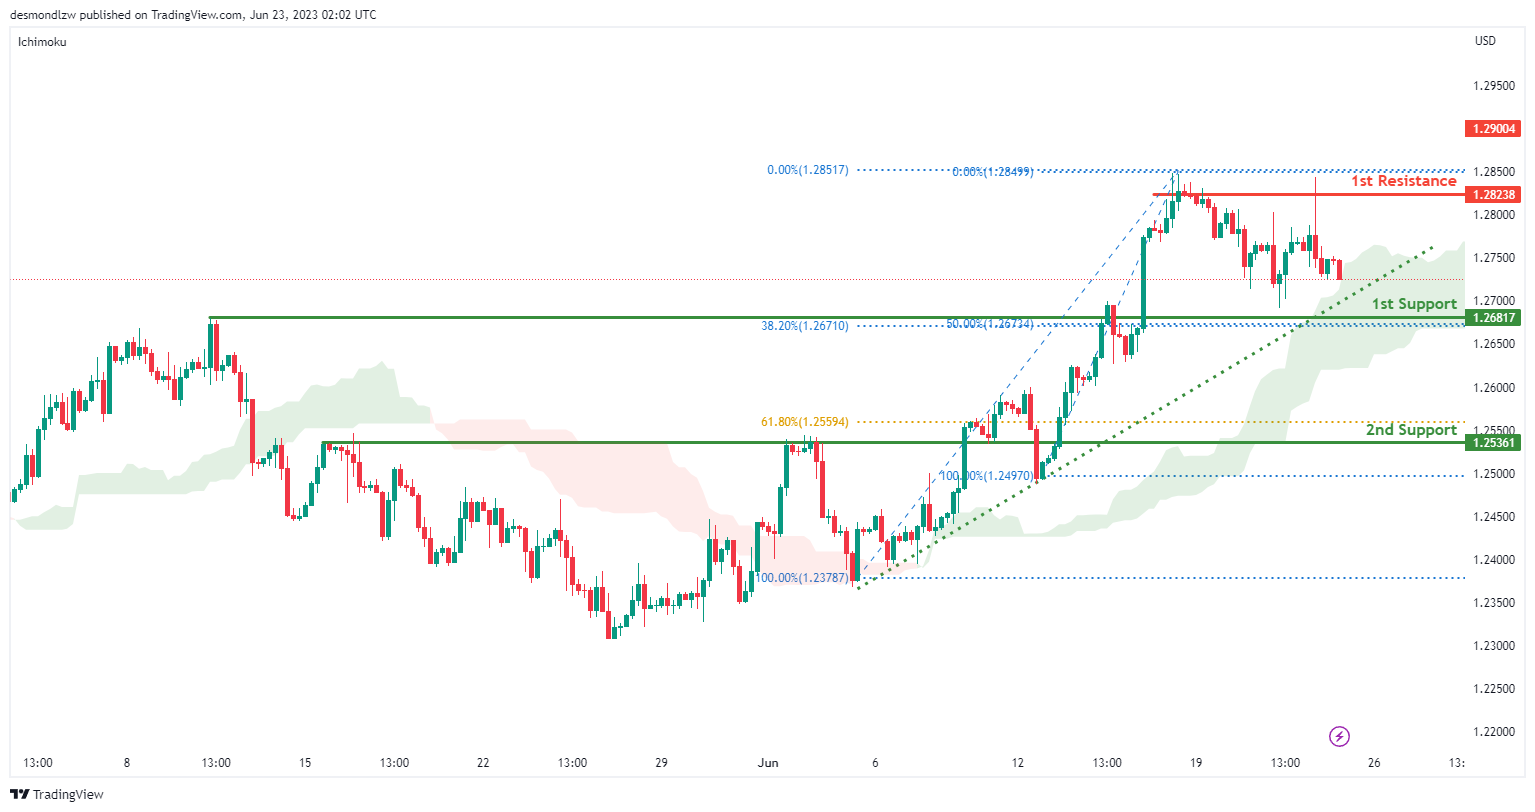
The GBP/USD chart demonstrates a bullish momentum as the price remains above the bullish Ichimoku cloud and a major ascending trend line, indicating further potential for upward movement. There is a possibility of a bullish bounce off the 1st support at 1.2681, accompanied by the presence of an overlap support, a 38.20% Fibonacci Retracement, and a 50% Fibonacci Retracement, indicating Fibonacci confluence. This combination of factors suggests a potential bullish scenario, with the price potentially heading towards the 1st resistance at 1.2823, which is characterised by its significance as a multi-swing high resistance.
USD/CHF:
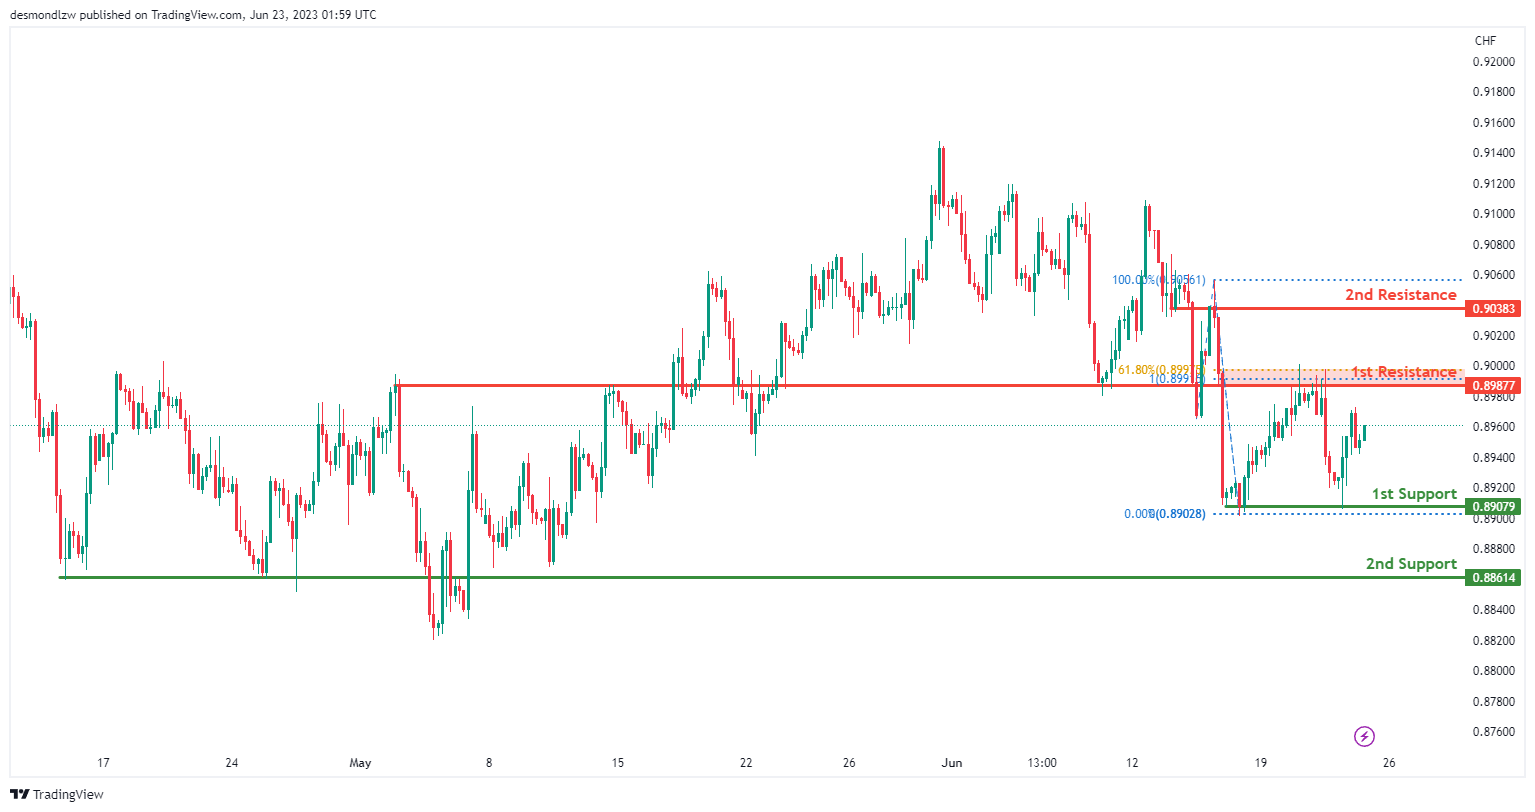
The USD/CHF chart exhibits a neutral momentum, suggesting a lack of clear direction in the market. As a result, the price could potentially fluctuate between the 1st resistance at 0.8987, which is characterised by its significance as an overlap resistance and Fibonacci confluence with the 61.80% Fibonacci Retracement and 100% Fibonacci Projection, and the 1st support at 0.8907, which acts as a multi-swing low support.
Additionally, the 2nd support at 0.8861 provides further strength as a pullback support, while the 2nd resistance at 0.9038 acts as a pullback resistance.
USD/JPY:
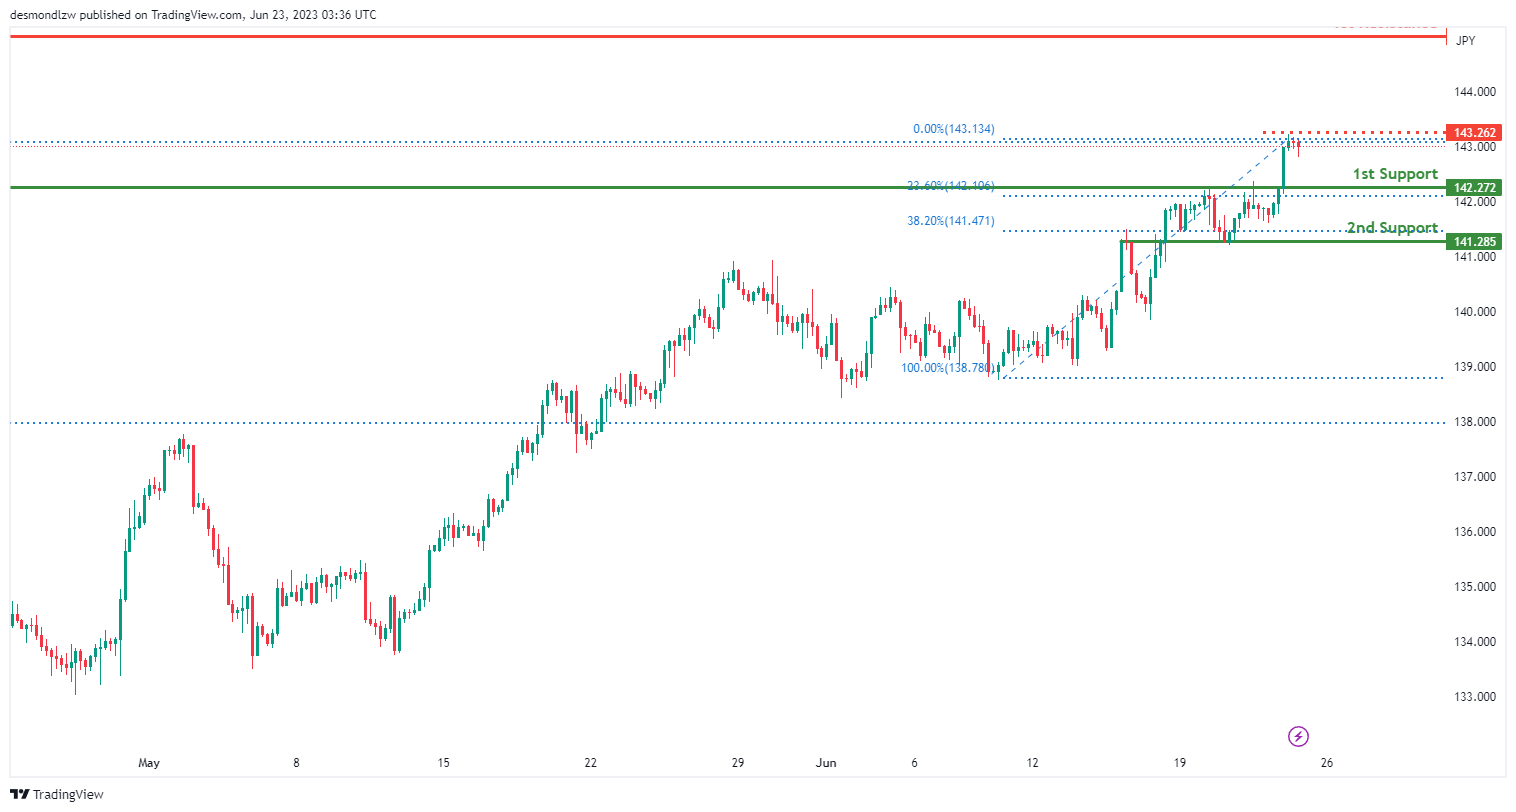
The USD/JPY chart displays a bullish momentum, suggesting the price could potentially drop further to the 1st support level in the short term before bouncing from there and rising towards the 1st resistance. The 1st support at 142.27 is considered good as it acts as pullback support and coincides with a 23.60% Fibonacci Retracement. The 2nd support at 141.28 is also favourable as it represents swing low support and aligns with a 38.20% Fibonacci Retracement, resulting in Fibonacci confluence.
On the resistance side, the 1st resistance level at 145.06 is significant as it represents an overlap resistance. Additionally, there is an intermediate resistance at 143.26, which is notable for its association with a 161.80% Fibonacci Extension on the Daily timeframe.
USD/CAD:
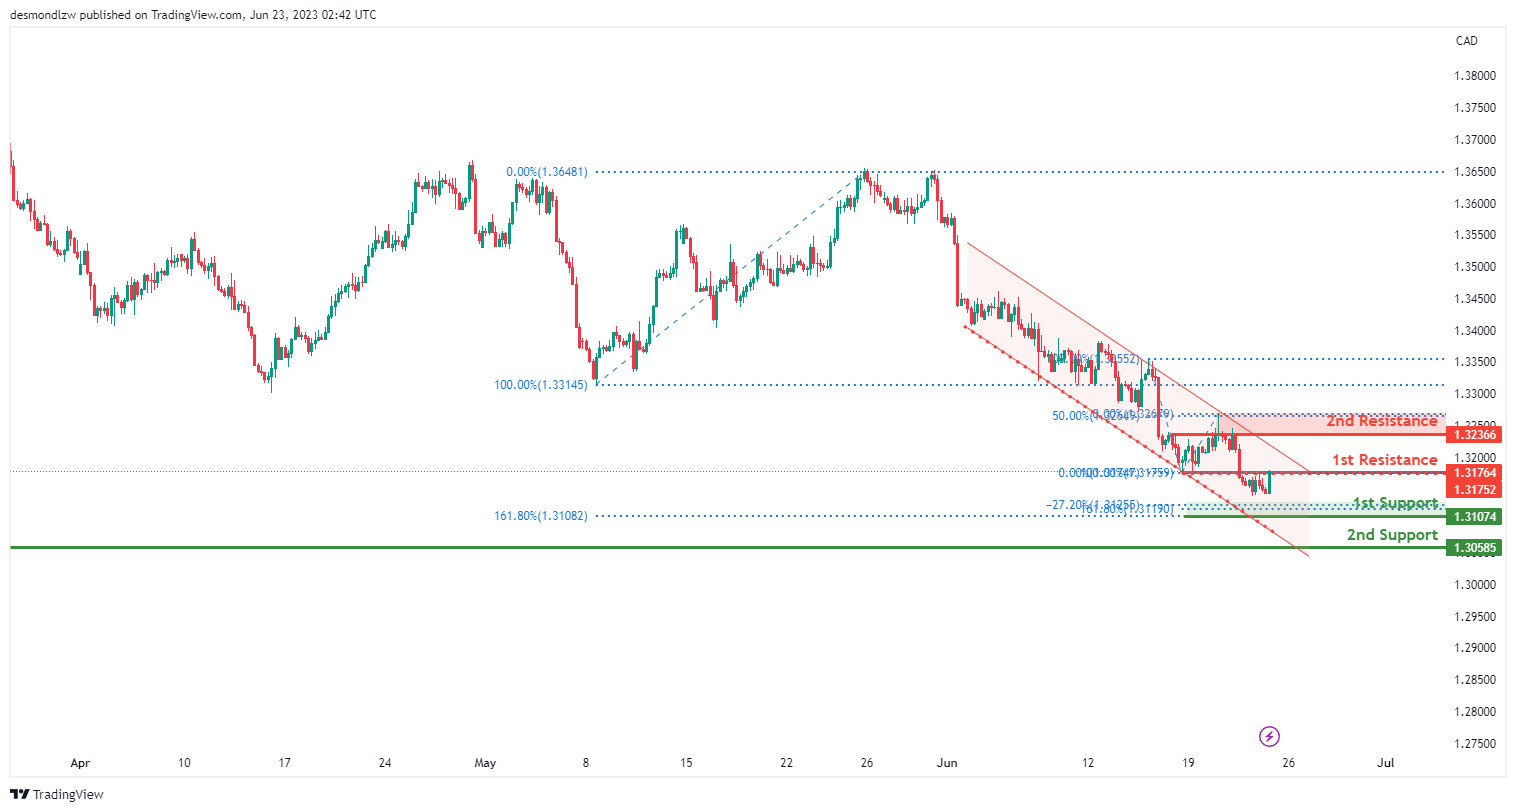
The USD/CAD chart indicates a bearish momentum as the price remains below the bearish Ichimoku cloud and within a bearish channel, suggesting a potential continuation of the downward movement. There is a possibility of a bearish reaction off the 1st resistance at 1.3176, followed by a drop towards the 1st support at 1.3107. The 1st support level is significant as it aligns with the -27% Fibonacci Expansion and the 161.80% Fibonacci Extension, providing additional strength to the support zone.
The 2nd support at 1.3058 acts as a pullback support. On the upside, the 1st resistance at 1.3176 represents an overlap resistance, while the 2nd resistance at 1.3236 is characterised as a swing high resistance and coincides with the 50% Fibonacci Retracement. These factors contribute to the overall bearish scenario of the chart.
AUD/USD:
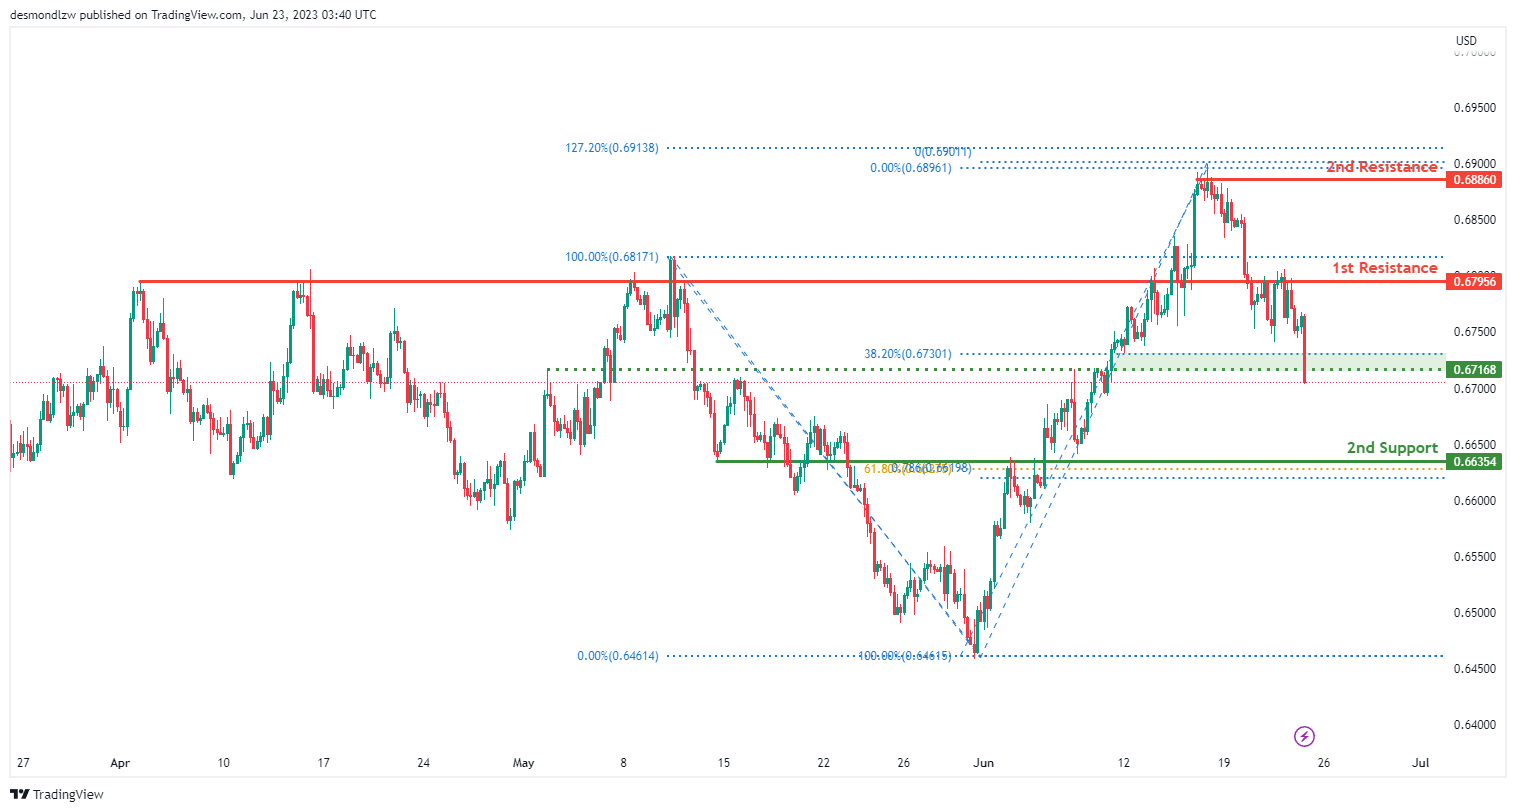
The AUD/USD chart exhibits a bearish momentum, suggesting a potential bearish continuation towards the first support level at 0.6635. This support level is favorable due to its characteristics as an overlap support and the presence of a 61.80% Fibonacci Retracement and a 78.60% Fibonacci Projection, which is known as Fibonacci confluence.
Conversely, the first resistance level at 0.6795 is notable for being an overlap resistance. Furthermore, the second resistance level at 0.6886 is significant as it acts as a swing high resistance and coincides with a 127.20% Fibonacci Extension.
NZD/USD
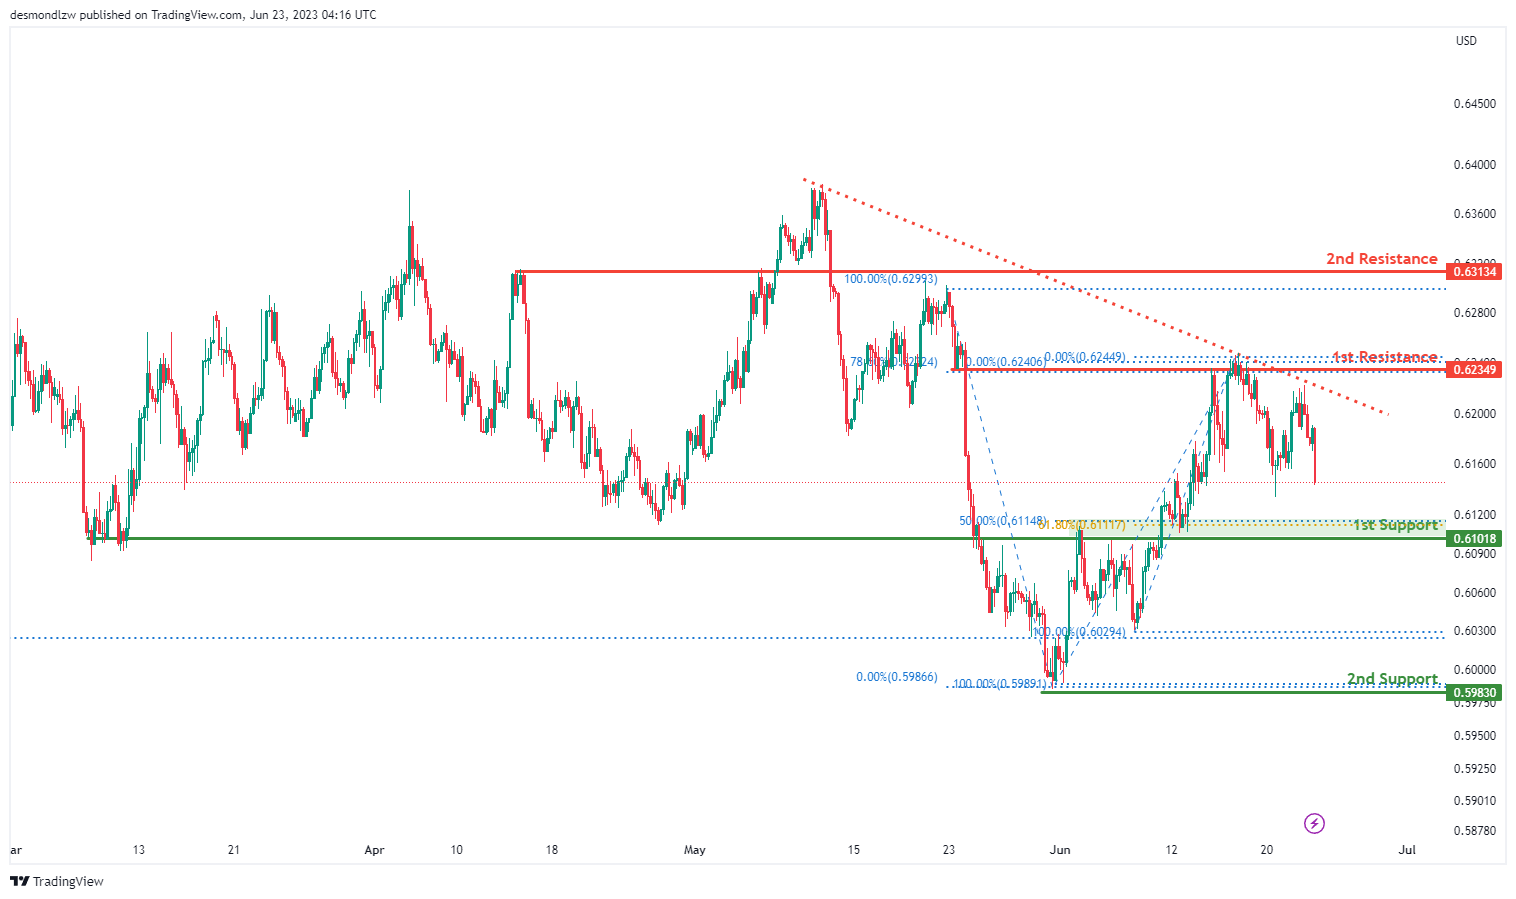
The NZU/USD chart demonstrates a bearish momentum, indicating a potential bearish continuation towards the first support level at 0.6101. This support level is considered favourable due to its characteristics as an overlap support and the presence of a 61.80% Fibonacci Retracement and a 50% Fibonacci Retracement, resulting in Fibonacci confluence. Additionally, the second support level at 0.5983 is noteworthy as it represents a swing low support.
On the resistance side, the first resistance level at 0.6234 is significant as it acts as an overlap resistance and is accompanied by a 78.60% Fibonacci Retracement. Furthermore, it is testing a descending trend line that serves as resistance. As for the second resistance level at 0.6313, it is characterised as an overlap resistance.
DJ30:
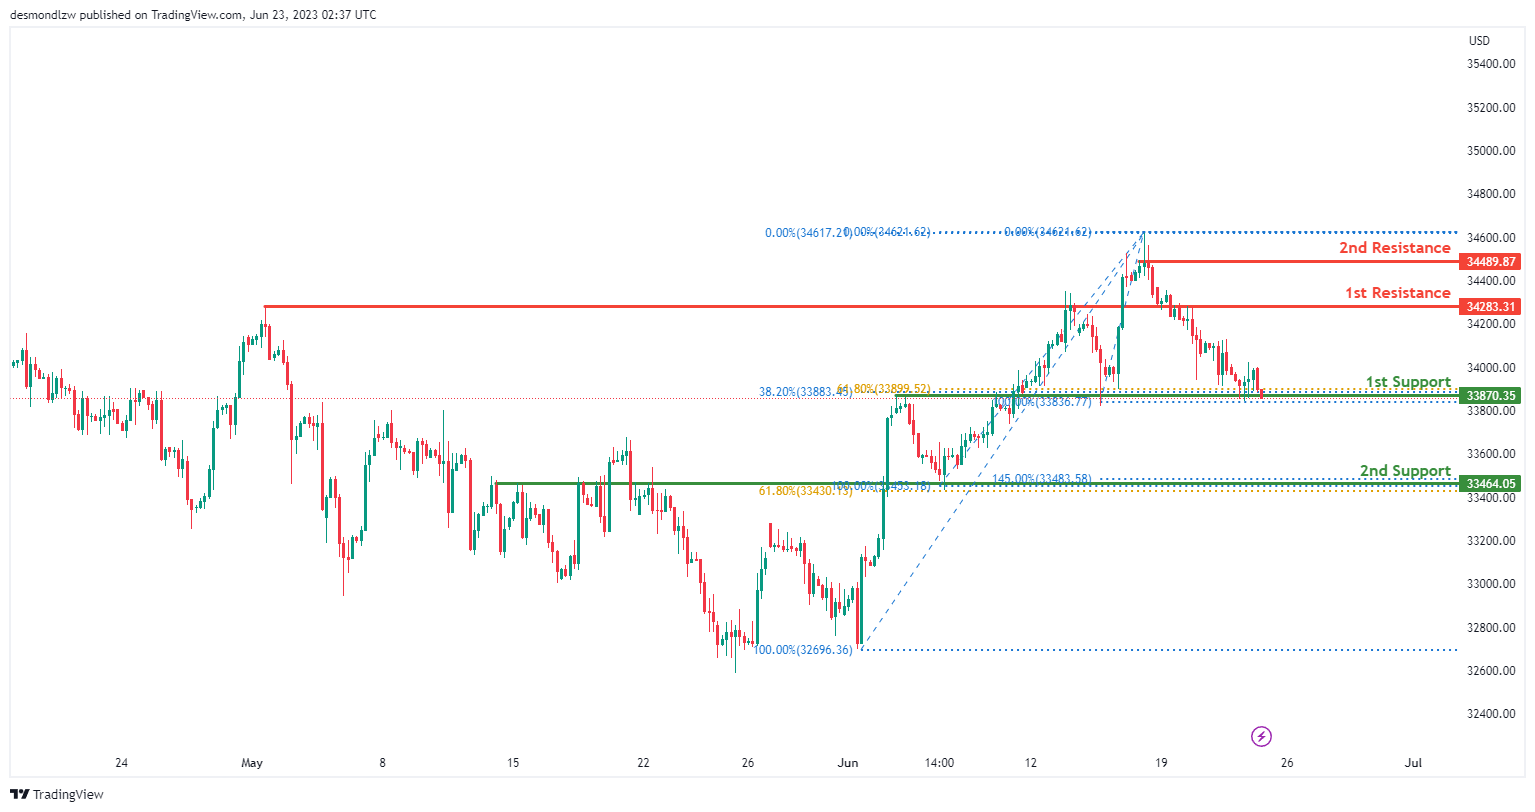
The DJ30 chart exhibits a weak bullish momentum with low confidence. There is a possibility of a bullish bounce off the 1st support level at 33870.35, followed by a potential move towards the 1st resistance at 34283.31. The 1st support level is significant as it represents an overlap support, reinforced by the 38.20% and 61.80% Fibonacci Retracement levels. The 2nd support at 33464.05 acts as a pullback support and is reinforced by the 61.80% Fibonacci Retracement and 145.00% Fibonacci Extension. On the upside, the 1st resistance at 34283.31 is characterized as an overlap resistance, while the 2nd resistance at 34489.87 represents a swing high resistance. These levels contribute to the overall analysis of the weak bullish momentum in the DJ30 chart.
GER30:
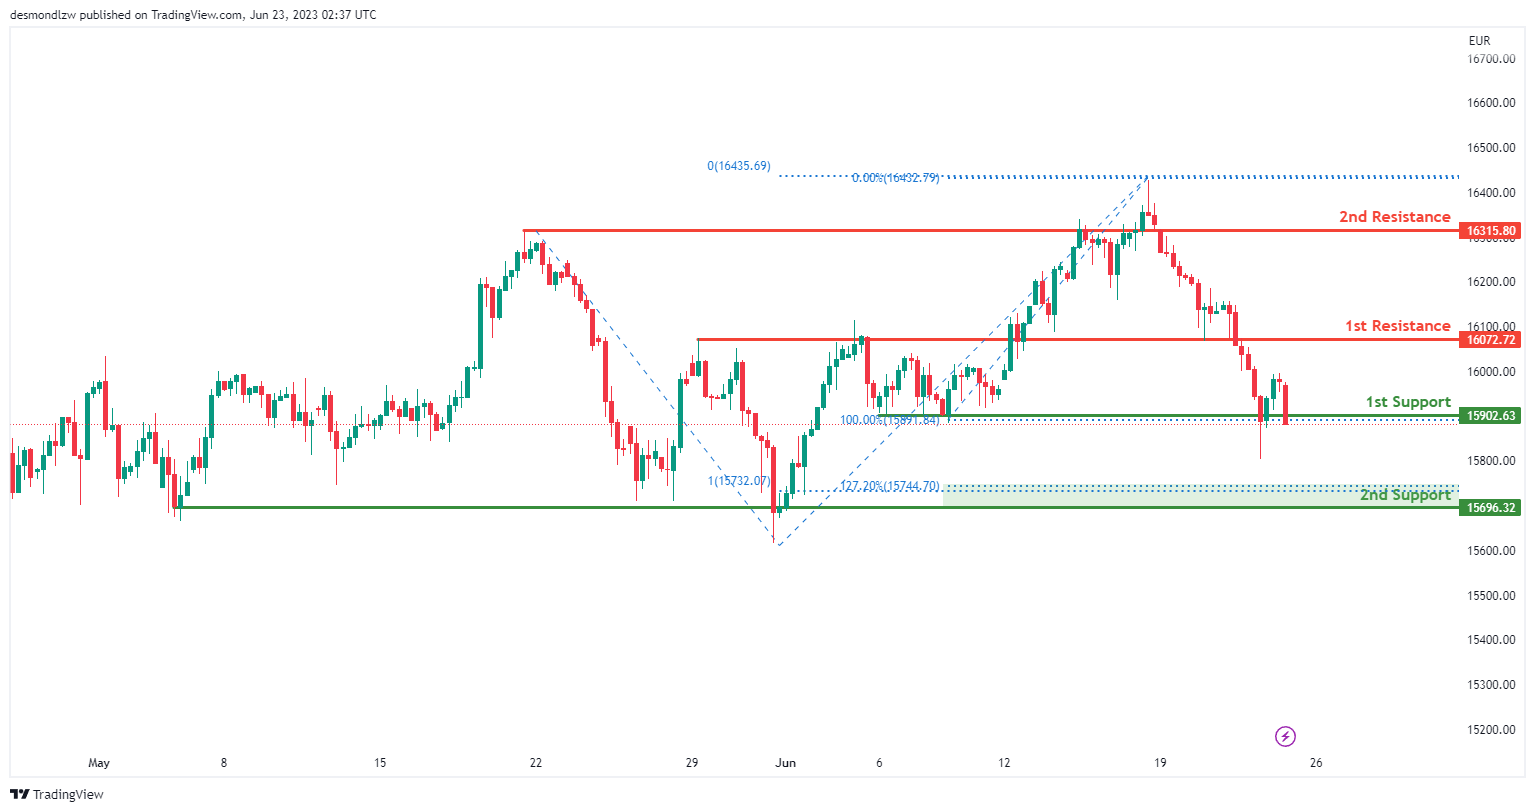
The GER30 chart shows a bearish momentum, and there is a potential for a bearish break off the 1st support level at 15902.63, leading to a drop towards the 2nd support level at 15696.32. The 1st support level is significant as it represents a multi-swing low support. The 2nd support level is also a multi-swing low support and is reinforced by the 127.20% Fibonacci Extension. On the upside, the 1st resistance at 16072.72 acts as a pullback resistance, while the 2nd resistance at 16315.80 also functions as a pullback resistance. These levels contribute to the overall bearish analysis of the GER30 chart.
US500
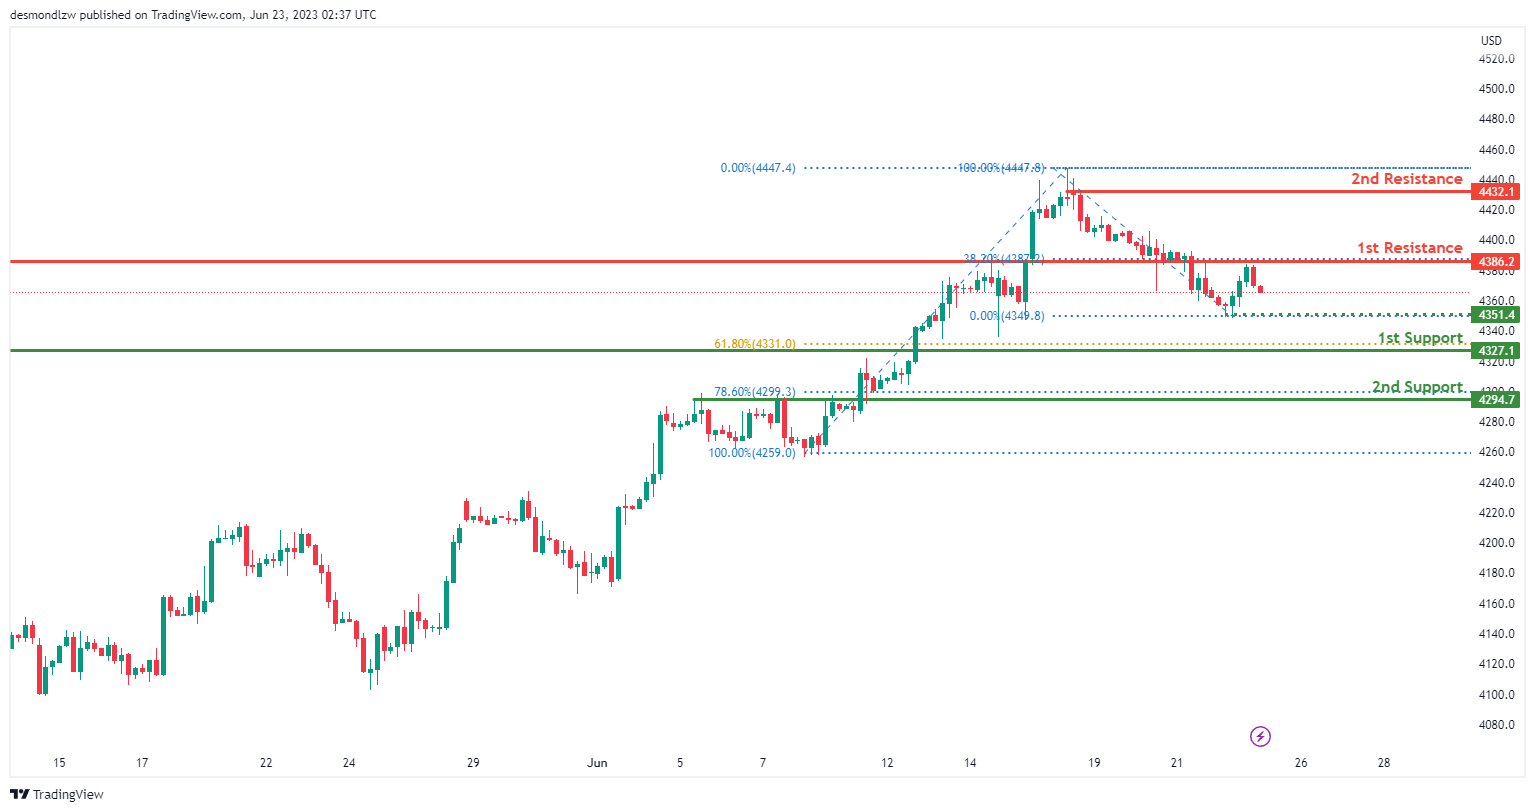
The US500 chart currently exhibits a bearish momentum, and there is a potential for a bearish continuation towards the 1st support level at 4327.1. This support level is significant as it represents a pullback support and aligns with the 61.80% Fibonacci Retracement. The 2nd support level at 4294.7 acts as an overlap support and is reinforced by the 78.60% Fibonacci Retracement. On the upside, the 1st resistance at 4386.2 serves as an overlap resistance, while the 2nd resistance at 4432.1 acts as a swing high resistance.
Additionally, an intermediate support level at 4351.4 may provide temporary stability. These levels contribute to the overall bearish analysis of the US500 chart.
BTC/USD:
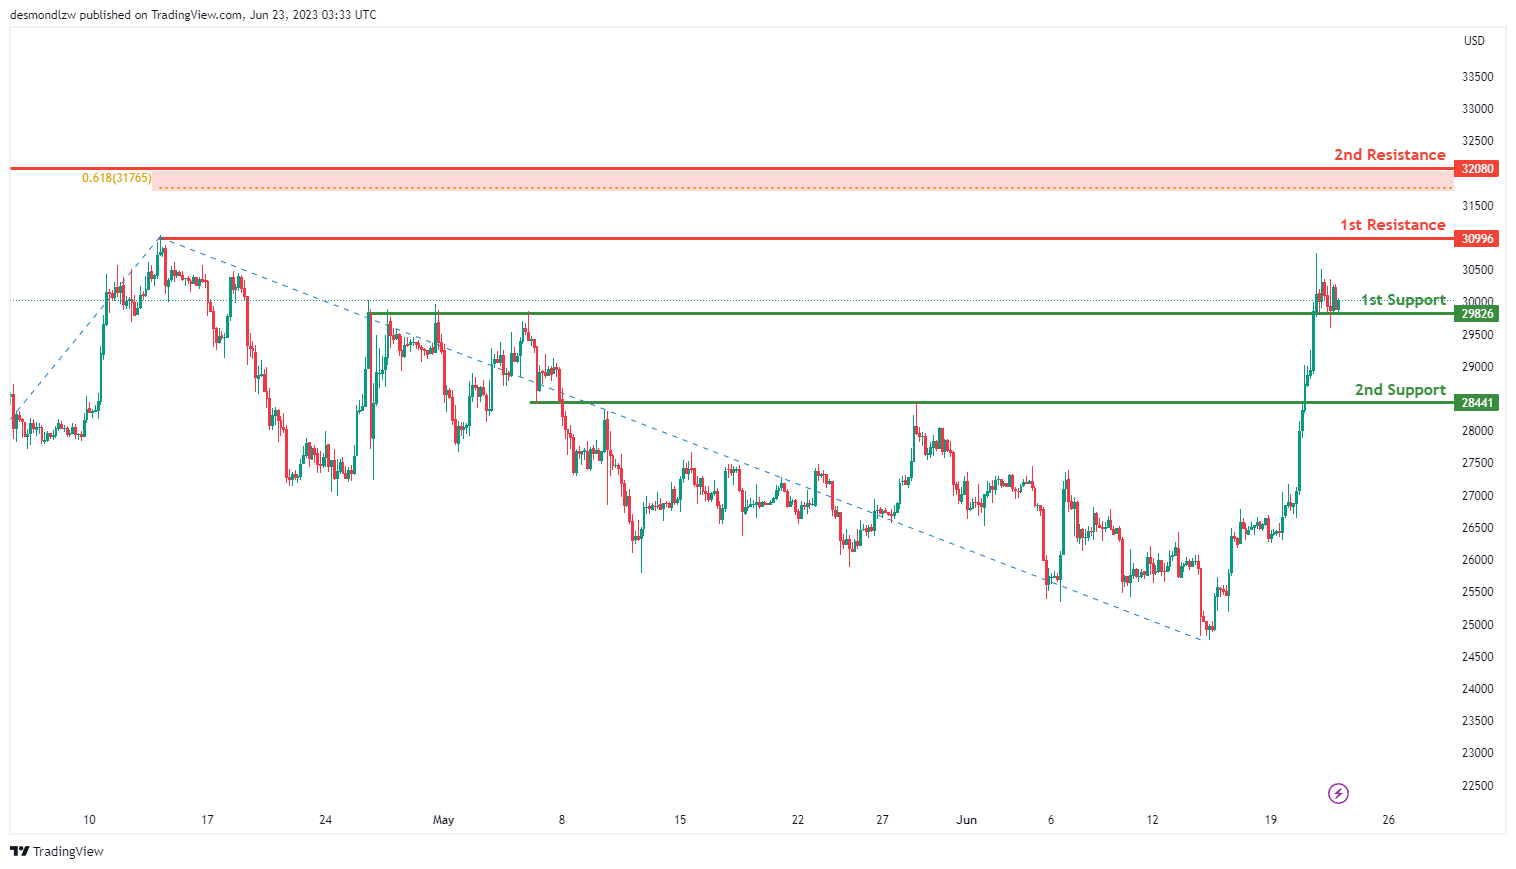
The BTC/USD chart demonstrates a bullish momentum, indicating that the price could potentially experience a bullish bounce off the 1st support level and move towards the 1st resistance. The 1st support level at 29826 is considered favorable as it acts as pullback support. Similarly, the 2nd support level at 28441 is also considered good as it represents pullback support.
On the resistance side, the 1st resistance at 30996 is significant as it represents a swing high resistance. Additionally, the 2nd resistance at 32080 is noteworthy as it acts as a swing high resistance and coincides with a 61.80% Fibonacci Projection.
ETH/USD:
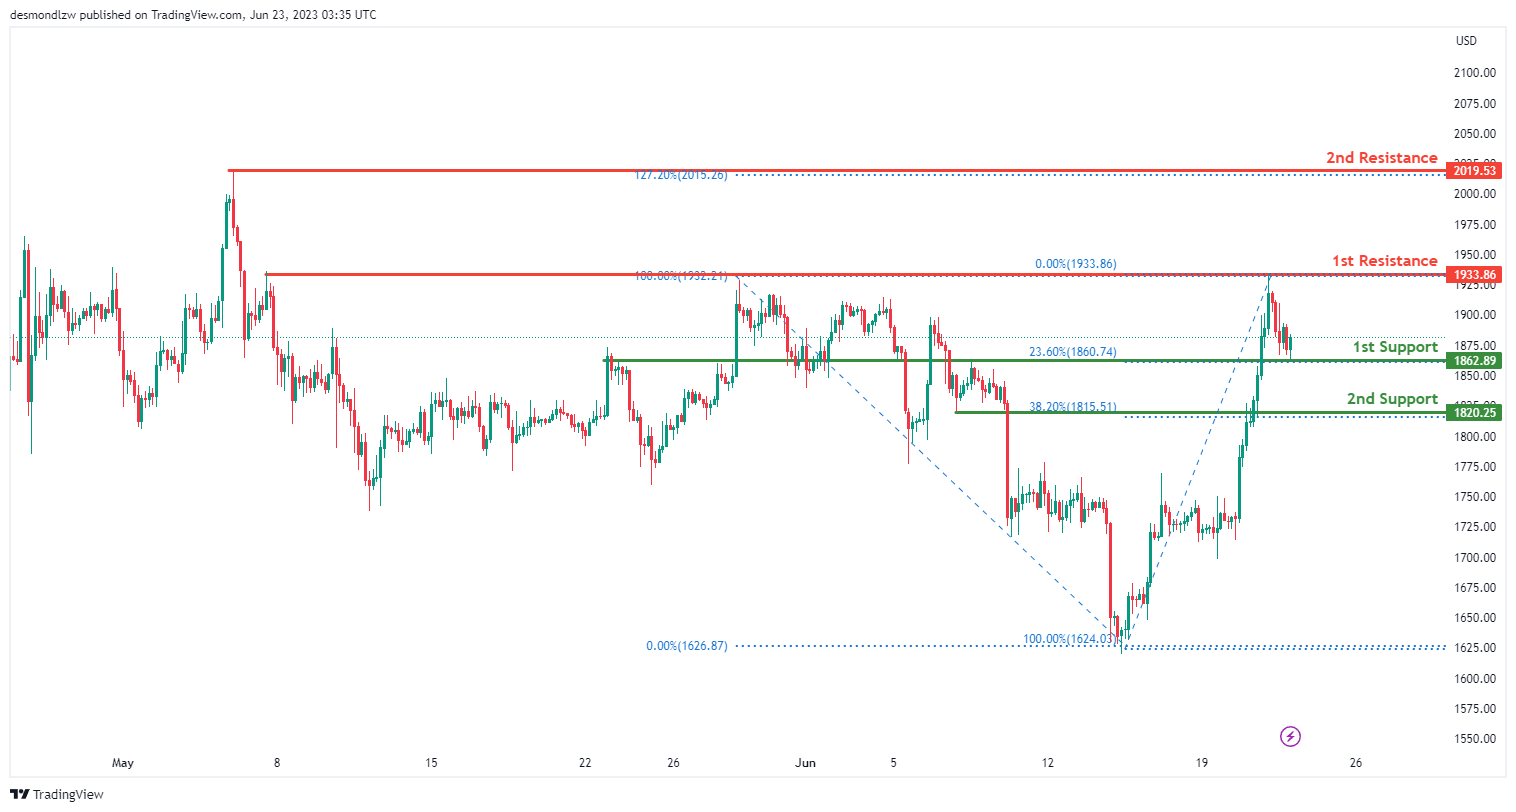
The ETH/USD chart exhibits a bullish momentum, suggesting that the price could potentially experience a bullish bounce off the 1st support level and move towards the 1st resistance. The 1st support level at 1862.89 is considered good as it acts as pullback support and coincides with a 23.60% Fibonacci Retracement. Similarly, the 2nd support level at 1820.25 is also favorable as it represents pullback support and aligns with a 38.20% Fibonacci Retracement.
On the resistance side, the 1st resistance at 1933.86 is significant as it represents multi-swing high resistance. Additionally, the 2nd resistance at 2019.53 is notable as it acts as a swing high resistance and coincides with a 127.20% Fibonacci Extension.
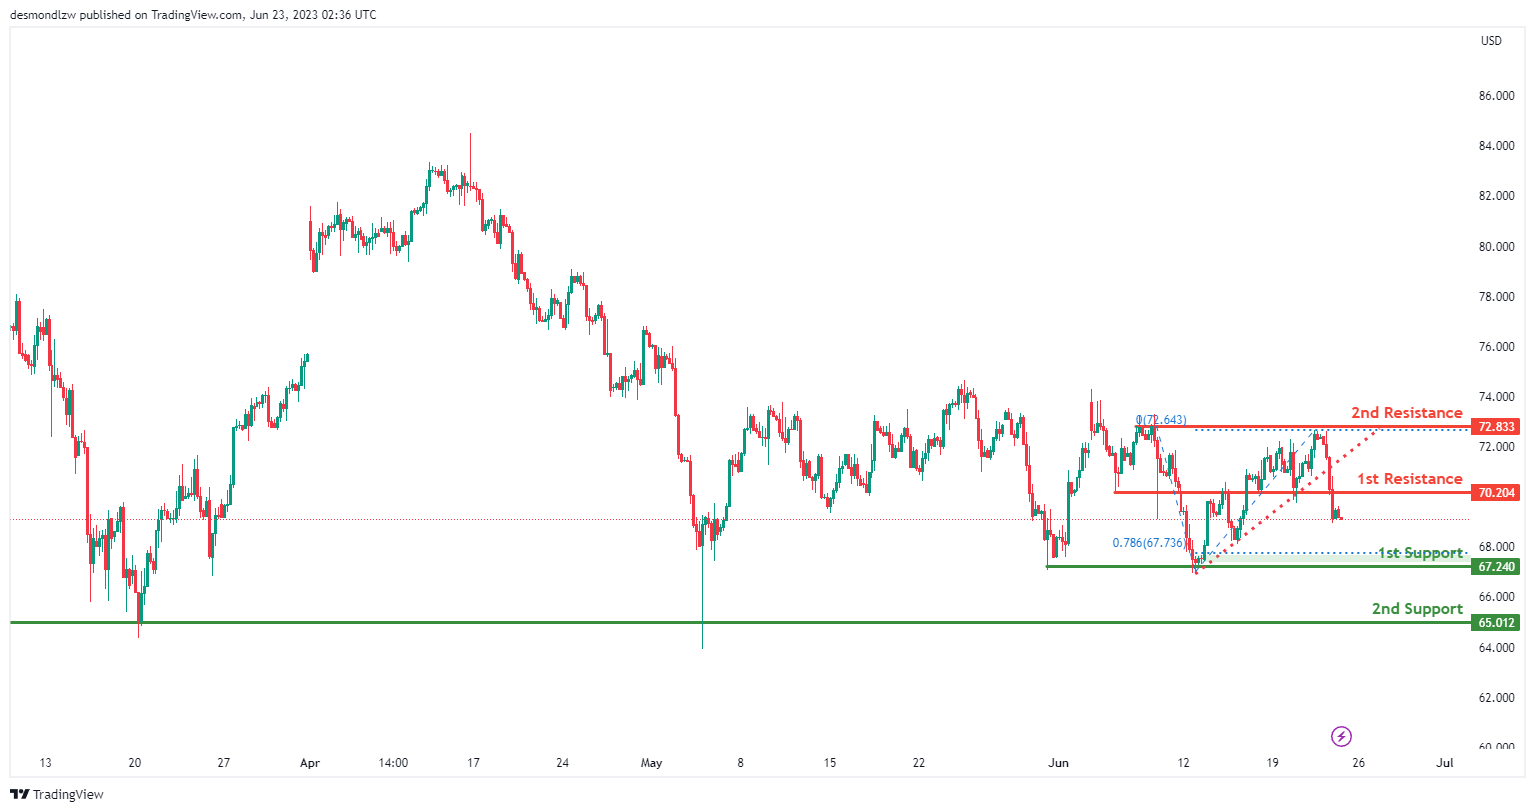
WTI/USD:
The WTI chart demonstrates a bearish momentum, supported by the fact that the price is below a major descending trend line, indicating the potential for further downward movement.
In terms of potential price action, there is a possibility of a bearish continuation towards 1st support level at 67.24. This support level is significant as it represents a multi-swing low support and coincides with the 78.60% Fibonacci Projection. Additionally, 2nd support level at 65.01 acts as another multi-swing low support, providing additional reinforcement to the support zone.
On the upside, 1stt resistance level at 70.20 serves as a pullback resistance, potentially impeding upward price movement. Similarly, 2nd resistance level at 72.83 is identified as a multi-swing high resistance, further adding to its significance in hindering further advancement.
These support and resistance levels, along with the bearish momentum, suggest a potential bearish continuation towards 1st support level.
XAU/USD (GOLD):
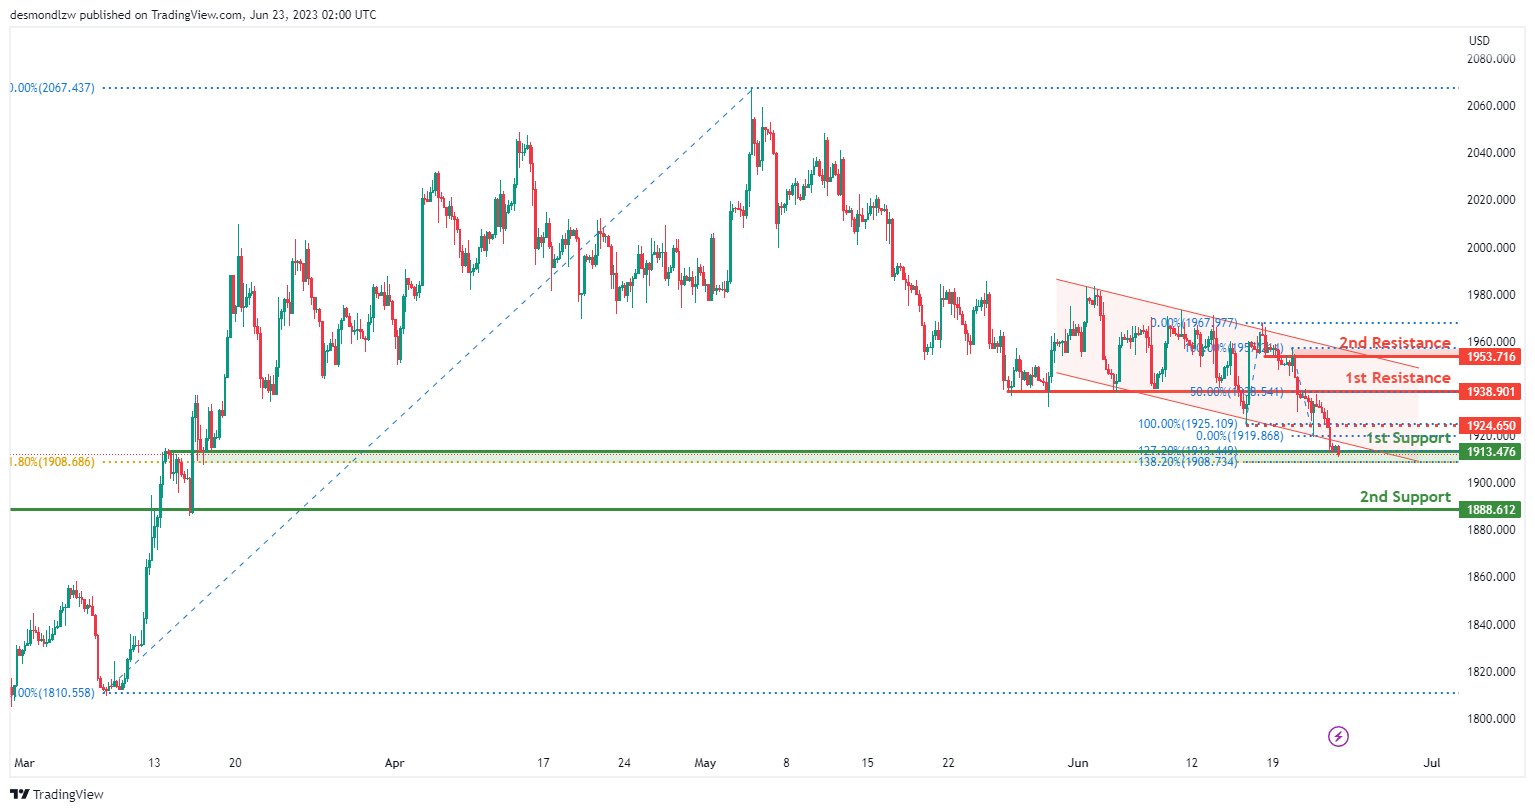
The XAU/USD chart demonstrates a bearish momentum as the price breaks from the lower channel line, indicating a continuation of the prior bearish trend. In the short term, there is a potential for the price to rise towards the 1st resistance at 1938.90 before reversing off it and dropping towards the 1st support at 1913.47. This support level is considered significant as it represents an overlap support and coincides with the 61.80% Fibonacci Retracement. Additionally, the 2nd support at 1888.61 acts as another overlap support. On the upside, the 1st resistance at 1938.90 is an overlap resistance, reinforced by the 50% Fibonacci Retracement. The 2nd resistance at 1953.71 also acts as an overlap resistance. Furthermore, an intermediate resistance at 1924.65 may also influence price movements.
Japan CPI core eased to 3.2% in May, but core-core surged to 42-yr high
Japan CPI core eased from 3.5% yoy to 4.2% yoy in in May. CPI core (ex-fresh food) fell from 3.4% yoy to 3.2% yoy. CPI core has now stayed above BoJ's 2% target for the 14th consecutive month. Meanwhile, CPI core-core (ex-fresh food and energy), jumped from 4.1% yoy to 4.3% yoy, the highest level in 42 years since 1981.
Energy costs fell -8.2% yoy, thanks to government subsidies. Food prices accelerated from 9.0% yoy to 9.2% yoy, highest since 1975. Durable goods prices rose 9.0% yoy. Goods prices were up 4.7% yoy while services prices rose 1.7% yoy.