Sample Category Title
BoE Decides after Another Bad Inflation Report
Federal Reserve (Fed) Chair Powell didn’t say anything we didn’t know, or we wouldn’t expect in the first day of his semiannual testimony before the American lawmakers yesterday. He said that the Fed will continue hiking rates, but because they are getting closer to the destination, it’s normal to slow down the pace. He repeated that two more hikes are a good guess, and that the economy will suffer a period of tight credit conditions, below-average growth, and higher unemployment to return to lower inflation.
The US 2-year yield pushed higher. The 10-year yield was flat given that higher short term yields point at higher recession odds for the long term. The gap between the 2 and the 10-year yield is again at 100bp.
In equities, the S&P500 gave back some field, but not all sectors suffered. Tech stocks pulled the index lower, financials and real estate were down, but energy stocks led gains as US crude jumped past $72pb on news that the US inventories dipped by around 1.2 mio barrel last week. Industrial, materials and utilities were up, as well, as a sign that a rotation toward the laggards could be happening rather than a broad-based moody selloff.
In currencies, the US dollar fell and is now testing the April-to-date ascending base - not because the Fed’s Powell sounded more dovish, but because what’s happening beyond the US borders makes the Fed look more dovish than what it really is.
BoE decides after another bad inflation report
The Bank of England (BoE) meets after another shocker inflation report, and is broadly expected to hike the rates by another 25bp points.
The BoE is the first major central bank that started hiking the rates to fight inflation. It proved to be the least efficient bank doing this job; British inflation is the worst among developed economies at nearly 9%. Consequently, the BoE will certainly be the last to finish hiking. The bank is expected to hike six more times, by 25bp, to reach a peak rate above the 6% by the end of this year, or the beginning of the next.
And I don’t see how the UK will avoid recession in this morose macroeconomic setting.
The British pound didn’t find an army of buyers after the UK inflation report yesterday. After an initial attack on the 1.28 resistance, Cable came back to pre-data levels and even traded at five-session lows. The EURGBP made a sharp U-turn from a nearly oversold market and jumped above 0.86. There is room for a hawkish surprise from the BoE (a 50bp hike?), and if not today, in one of the next meetings. The latter should keep Cable on path for more gains, in the actual environment of softening US dollar.
Let’s see what’s the new team is worth
The new leadership team of the Central Bank of Turkey (CBT) will give the first policy verdict of its new mandate today. The bank is expected to hike the rates from 8.5% to 20%. It looks like a big hike – and it is a big hike – but the Turkish Central Bank will have to
1. regain its credibility that has been shattered.
2. repeat a similar operation in the next few meetings to bring the Turkish rates to where they should be in accordance with the economic fundamentals, and not where the government wants them to be.
3. if all goes well, get rid of the expensive and ineffective side measures – like FX interventions and FX protected savings – that served to keep the lira afloat while the monetary policy was no longer.
The USDTRY is again put to sleep near the 1.23 level after a tentative relaxation of FX interventions at the start of this month. Hiking interest rates, regaining credibility, then relaxing FX interventions sounds like a plan, but it will take ZERO verbal intervention from the government to conduct a healthy policy normalization.
Note that, in no case, do I expect the selloff in lira to stabilize or the reverse – without external intervention – below the 30/35 range – if left free.
Swiss will hike as well
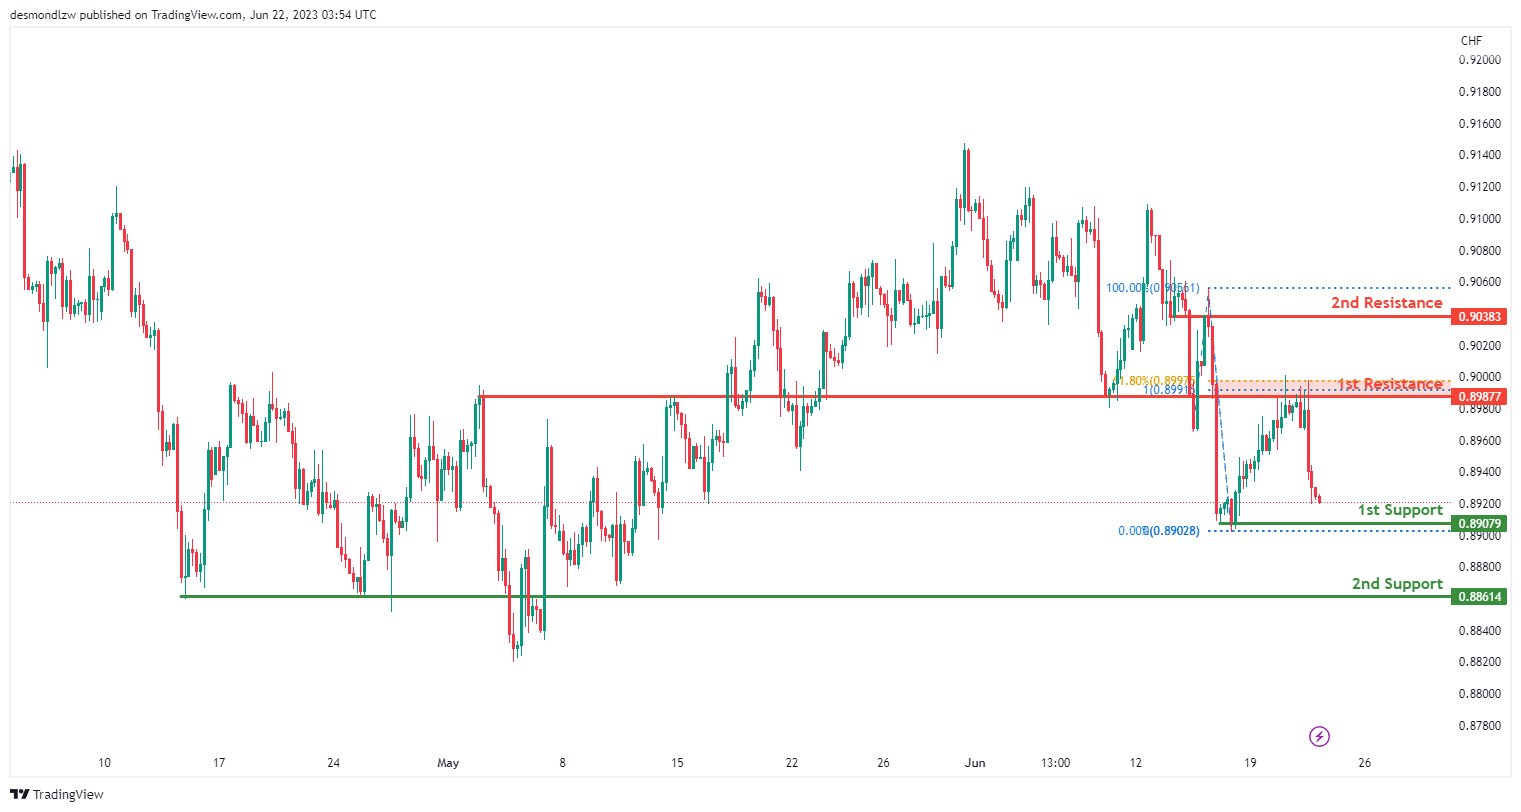
The Swiss National Bank (SNB) is about to announce a 25bp hike at today’s meeting taking the Swiss policy rate to 1.75%. The dollar-franc sees resistance into the 0.90 psychological level, but most of the price action is driven by USD appetite. Given the sharp fall in Swiss inflation toward the 2% target, the SNB will unlikely let the franc run too strong from here. 0.88 seems to be a floor to franc appreciation.
Big Central Bank Day
Market movers today
A big central bank day today is kicked off at 9.30 CET with SNB, were we look for a rate hike to 1.75% from 1.5%, in line with consensus.
Norges Bank follows shortly after at 10.00 CET. Here we also look for a 25bp hike to 3.5% and a signal of a further 25bp in August.
At 13.00 CET it is Bank of England's turn to lift rates by expected an 25bp to 4.75% from 4.5% and in the minutes it will be interesting to see BoE members' views on the recent rise in inflation.
Another central bank will attract attention today as Turkey's central bank will set rates at 13.00 CET. The appointments of new finance minister and central bank governor after the Turkish election points to some changes in economic policies, but it remains to be seen how it will play out.
Finally we have to Fed members, Bowman and Mester, speaking on top of Powell's second-day testimony in Congress. The latter is unlikely to differ from today's testimony, though.
On the data front we get Norwegian credit indicator, French business confidence, US initial jobless claims and US existing home sales.
The 60 second overview
Markets: Equity markets continued this week's cautious sentiment. European markets generally ended in negative territory after stronger-than-expected UK inflation and ongoing global growth concerns put a lid on risk appetite. UK inflation surprised to the upside for the fourth consecutive month, largely due to stronger services inflation. In the US, equity markets also drifted lower, especially major tech stocks, which lately have had an extraordinary run backed by AI optimism, pulled back. Powell's testimony, although not particularly hawkish, sent US yields marginally higher in the front-end, resulting in full percentage point inversion of the 10-2 year US Treasury yield spread for the first time since March. The USD broadly weakened, while the SEK regained some territory after reaching an all-time low against the EUR. This morning, Asian equity markets are mixed and futures point to a negative open in Europe and a flat open in the US.
Powell's testimony: There were no new signals for monetary policy. Powell described the outlook for potential new hikes in a very similar fashion as he did last week, saying it may make sense to hike further at a more moderate pace (but not pre-committing to anything). For the economic outlook, he reiterated that the Fed is seeing progress in inflation and balancing labour markets, but that there is still ways to go before reaching price stability. Fed pricing was little affected throughout the testimony.
UK inflation: Headline came in at 8.7% y/y and core at 7.1% y/y, both 0.3 p.p above consensus expectations and 0.4p.p above BoE's headline forecast (8.3%). Services, which remains a key focus of the Bank of England increased further to 7.4% (up from previously 6.9%). The data supports notion of further hikes from here.
BoE: We expect the Bank of England (BoE) to hike the Bank Rate by 25bp .While we now expect a peak in the Bank Rate of 5.00%, we see current market pricing of a peak in policy rates of 6.00% as too aggressive. EUR/GBP is set to move higher on the statement as we expect the BoE communication to fail to live up to market expectations.
Norges Bank: We expect Norges Bank to hike the policy rate by 25bp to 3.50 %, but it is really a close call between 25b. and 50bp. Regardless of the outcome, we expect Norges Bank to signal that rates most likely will be raised again in August. In the new monetary policy report, we expect the policy rate path to be lifted by around 50bp in the coming quarters and signal a peak between 4.00-4.25 % in Q3.
US labour market: Yesterday, we published our latest overview of the US labour markets, US Labour Market Monitor - Mixed labour market data masks underlying cooling, 21 June. We highlight that even though headline NFP growth has remained strong, the Fed welcomes early signs of cooling demand and recovering supply, as more balanced labour market will help calm down wage inflation even further.
Sweden will celebrate midsummer tomorrow and the Swedish fixed income markets will close at noon today.
Equities: Equities were somewhat lower for a third day. Hence, we could be on the verge of closing markets lower for the week, which would be the first time in six weeks. There is still no direct macro drivers behind the breather in markets. Therefore, there is little distinction between cyclicals- and defensives. Instead, yesterday saw a rotation out of FANMAG (tech, communication, consumer discretionary) and into value sectors (energy, industrials). Interestingly, banks did not outperform in this environment. Futures are a tad lower, again.
FI: The higher than expected UK inflation data as well as hawkish signals from ECB initially sent bond yields higher yesterday, but later they declined and the curve flattening between 10Y and 30Y continued.
FX: SEK regained some territory during yesterday's session after posing new all-time highs in Tuesday's session. EUR/GBP moved sharply higher following higher than expected inflation data for May, re-establishing the link between widening interest rate differential and a weaker GBP. Today focus turns to the Bank of England monetary policy meeting, where we expect a 25bp hike. Alongside GBP, EUR/USD drifted slightly higher, trading just below the 1.10 mark. EUR/NOK traded broadly sideways as markets are in a wait-and-see mode ahead of Norges Bank meeting later today.
Credit: Credit markets had a slight risk-off tilt on Wednesday along with a somewhat soft market for equities. Itrax main widened 1.1bp to close at 77.2bp and Itrax Xover widened 4.8bp to close at 405.7bp. Primary market activity once again decent, with among others, SEB printing EUR1bn in green 4Y senior preferred notes. The notes printed at MS+80bp, which was around 20bp tighter than IPT's.
Technical Outlook and Review
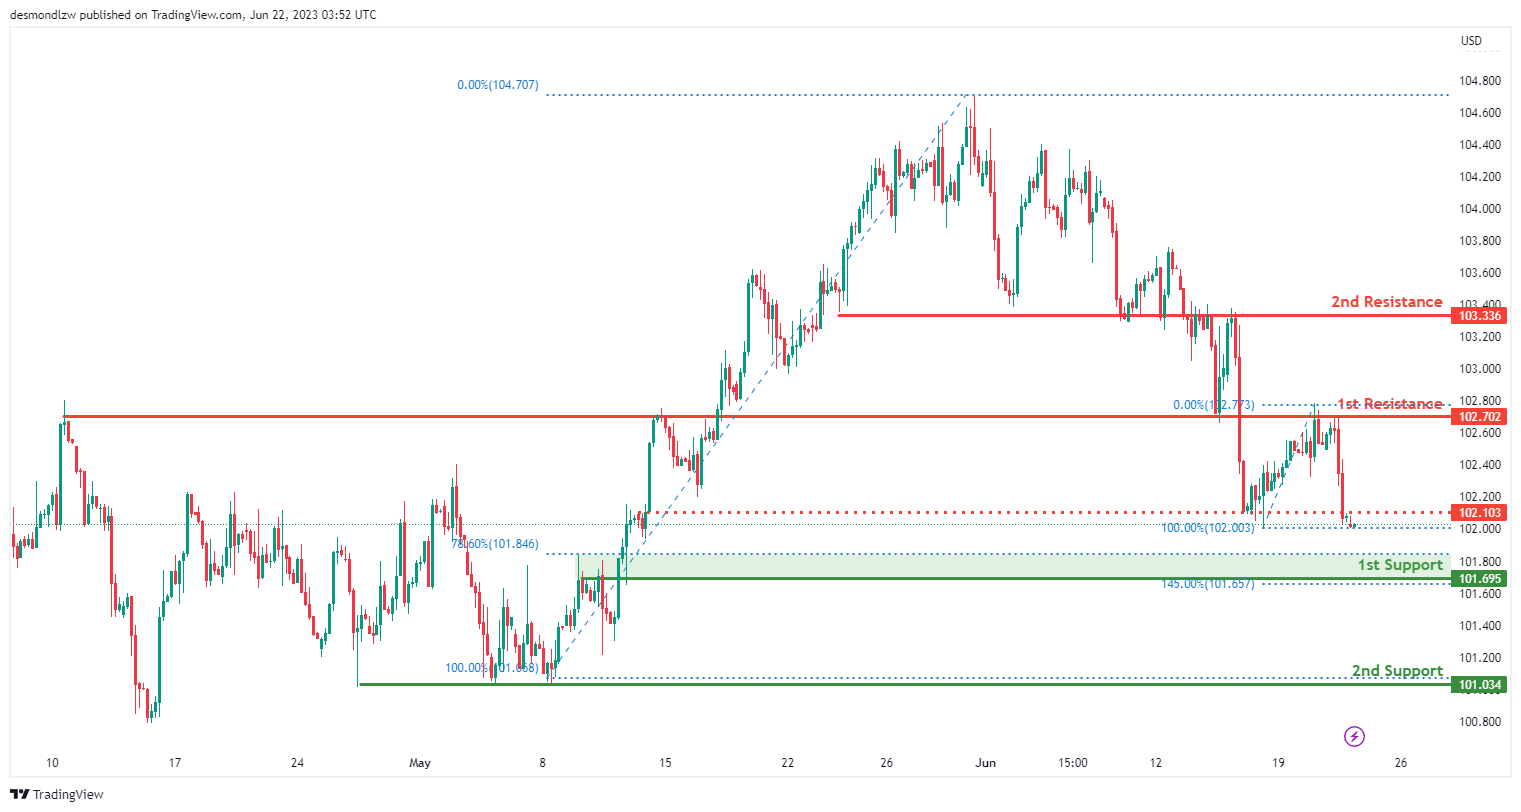
DXY:
The DXY chart exhibits a bearish momentum, indicating a downward trend in the market. There is a possibility of a bearish continuation towards the first support level at 101.69, which is a significant overlap support and aligns with the 145.00% Fibonacci Extension. Additionally, the second support level at 101.03 serves as a multi-swing low support. On the upside, the first resistance at 102.70 represents an overlap resistance, while the second resistance at 103.33 is identified as another overlap resistance. Furthermore, an intermediate resistance at 102.10 is recognized as a pullback resistance.
EUR/USD:
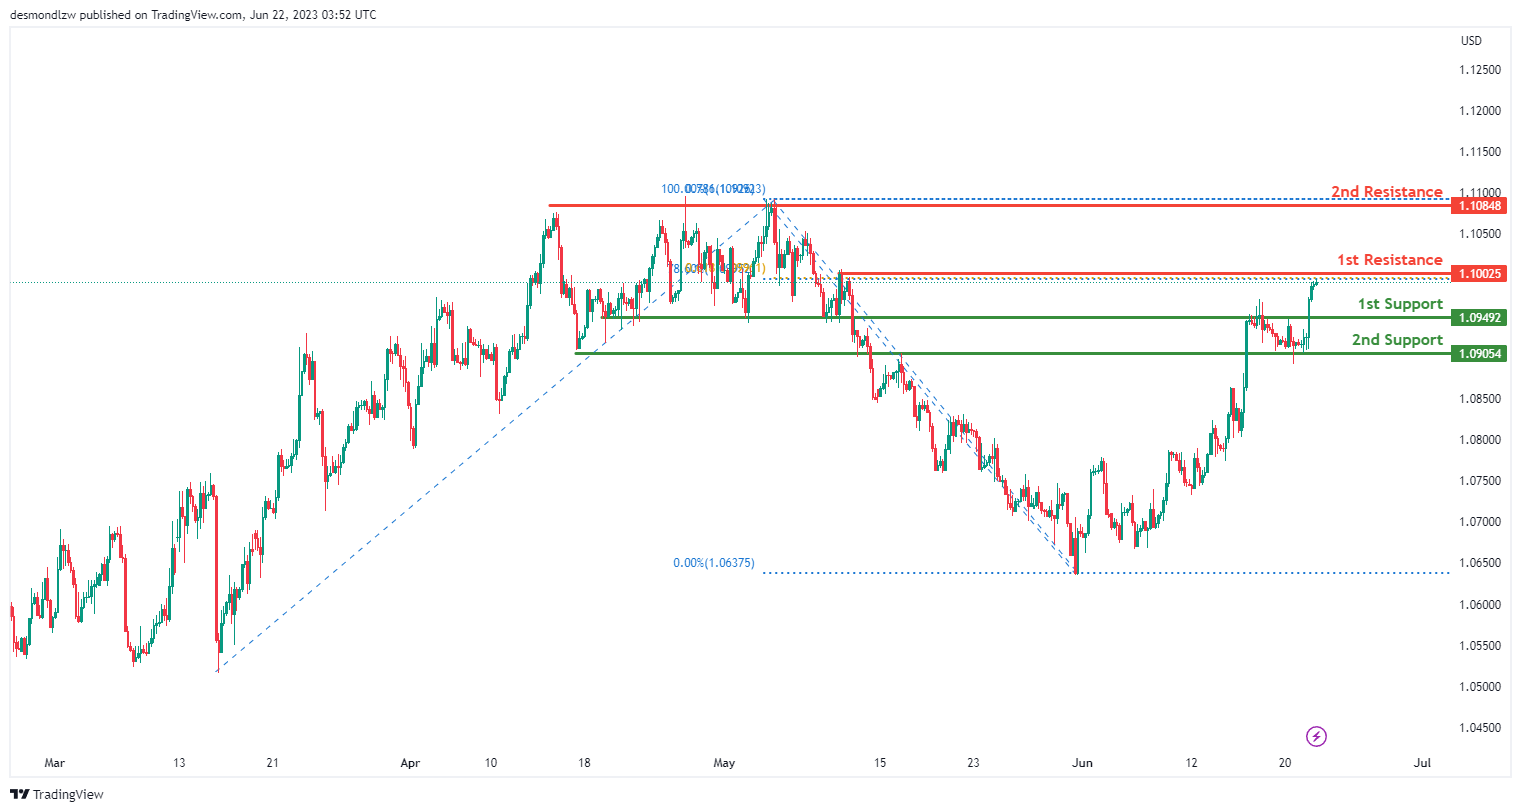
The EUR/USD chart demonstrates a bullish momentum, indicating an upward trend in the market. There is a potential for a short-term drop towards the first support level at 1.0949, which serves as a pullback support. Additionally, the second support level at 1.0905 is identified as an overlap support, coinciding with the 61.80% Fibonacci Projection and the 78.60% Fibonacci Retracement (Fibonacci confluence).
On the upside, the first resistance level at 1.1002 represents a swing high resistance, while the second resistance level at 1.1084 is identified as a multi-swing high resistance.
GBP/USD:
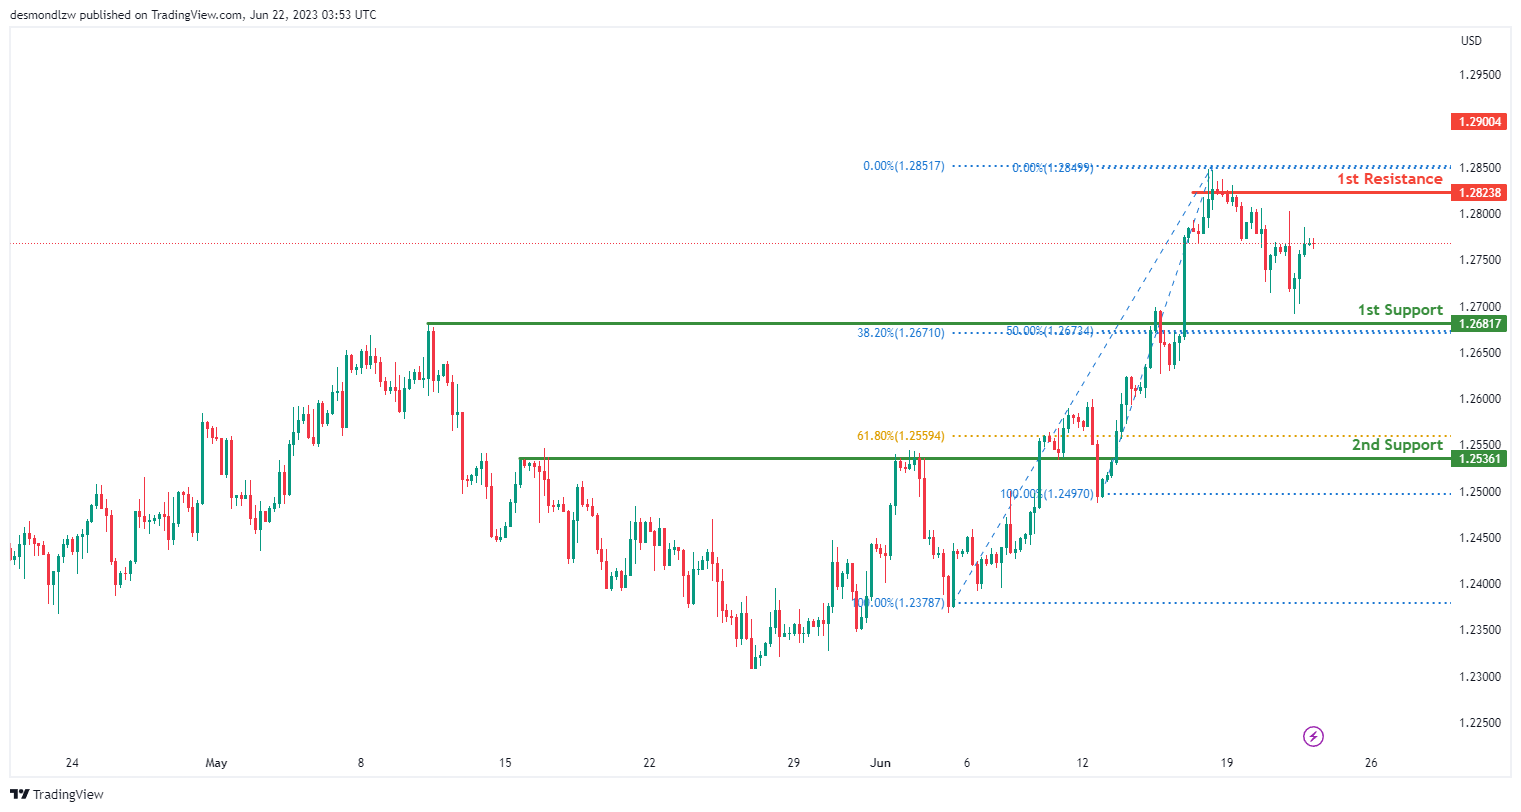
The GBP/USD instrument currently exhibits a bullish overall momentum on the chart. There is a potential for a short-term drop towards the first support level before bouncing from there and rising towards the first resistance level.
The first support level at 1.2681 is significant as it is supported by overlap support, a 38.20% Fibonacci retracement, and a 50% Fibonacci retracement, which adds to its reliability. The second support level at 1.2536 provides strong overlap support.
On the upside, the first resistance level at 1.2823 is characterised by a swing high resistance. It is likely that the price will experience rejection near the first resistance rather than breaking through it.
USD/CHF:
The USD/CHF instrument currently displays a bearish overall momentum on the chart. However, there is a possibility for a bullish bounce off the 1st support that could steer the price towards the 1st resistance.
The 1st support level is at 0.8907, offering a strong swing low support, whereas the 2nd support level, positioned at 0.8861, is characterised by an overlap support.
In terms of resistance, the 1st resistance is at 0.8987, defined by an overlap resistance, and the 2nd resistance, situated at 0.9038, is similarly marked by an overlap resistance, indicating their sturdy levels of resistance.
USD/JPY:
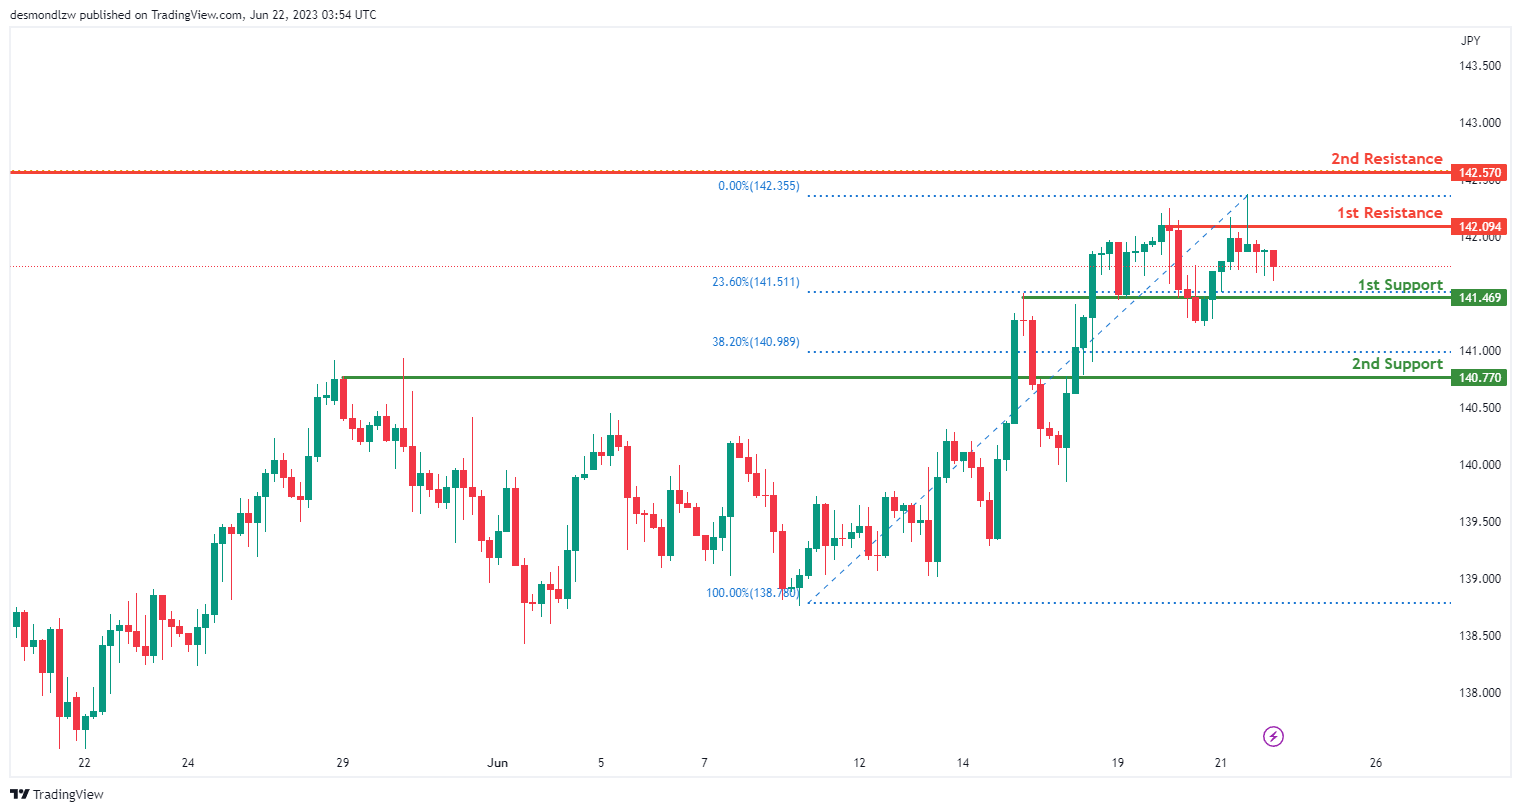
The USD/JPY chart demonstrates a bearish momentum, indicating a downward trend in the market.
There is a possibility of a short-term rise towards the first resistance level at 142.57, followed by a reversal and a drop towards the first support level at 141.46.
The first support at 141.46 is considered significant as it represents an overlap support, while the second support at 140.77 acts as a pullback support.
On the upside, the first resistance level at 142.57 is notable, coinciding with the 61.80% Fibonacci Retracement level. Additionally, the intermediate resistance at 142.20 functions as a swing high resistance.
USD/CAD:
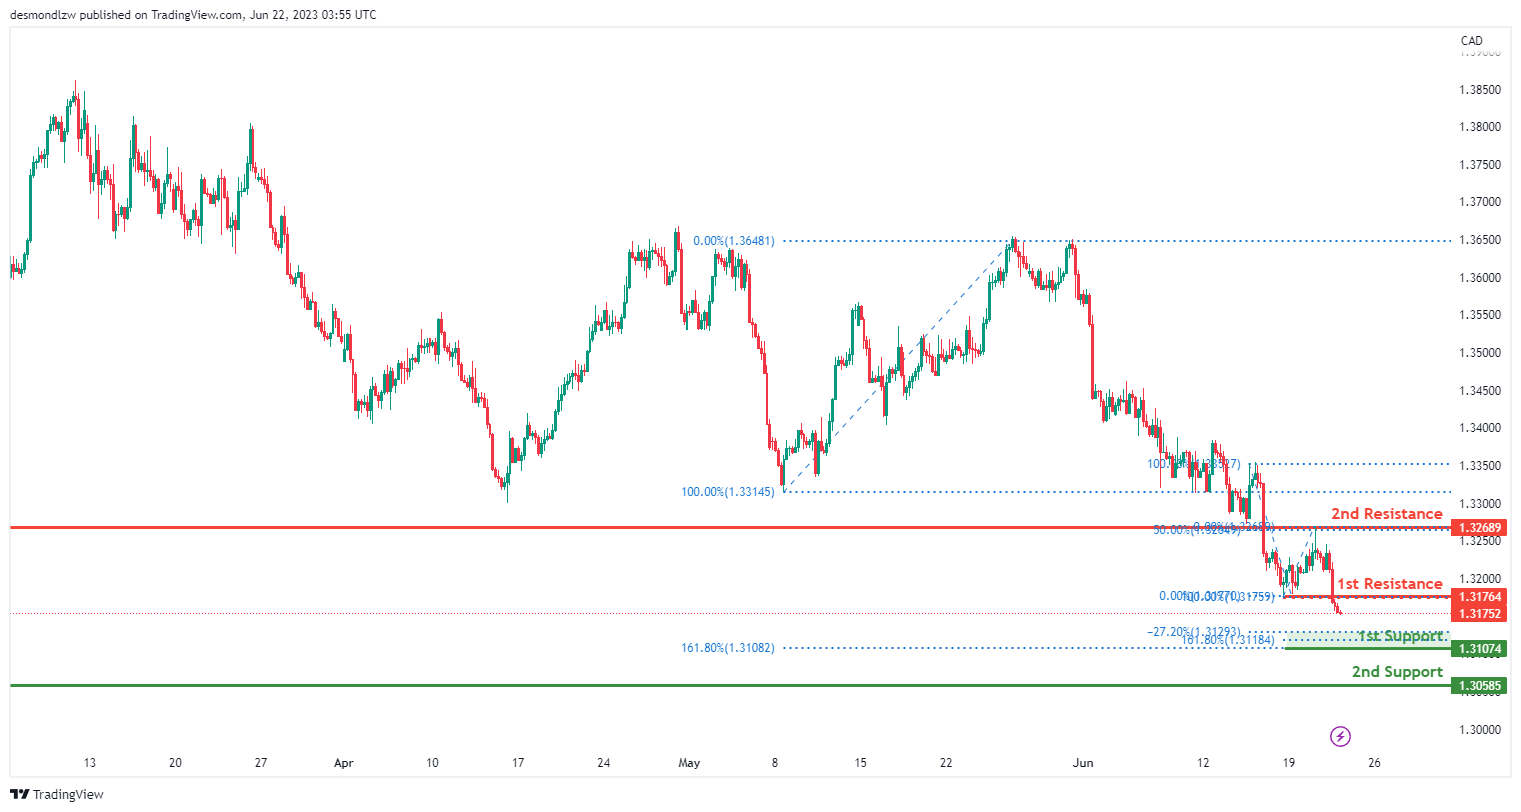
The USD/CAD chart exhibits a bearish momentum, indicating a downward trend in the market. There is a potential for a bearish continuation towards the first support level at 1.3107, which is significant as it aligns with the 161.80% Fibonacci Extension and the -27% Fibonacci Expansion. The second support level at 1.3058 serves as a pullback support.
On the upside, the first resistance level at 1.3176 represents a pullback resistance. Additionally, the second resistance level at 1.3268 is identified as an overlap resistance, coinciding with the 50% Fibonacci Retracement.
AUD/USD:
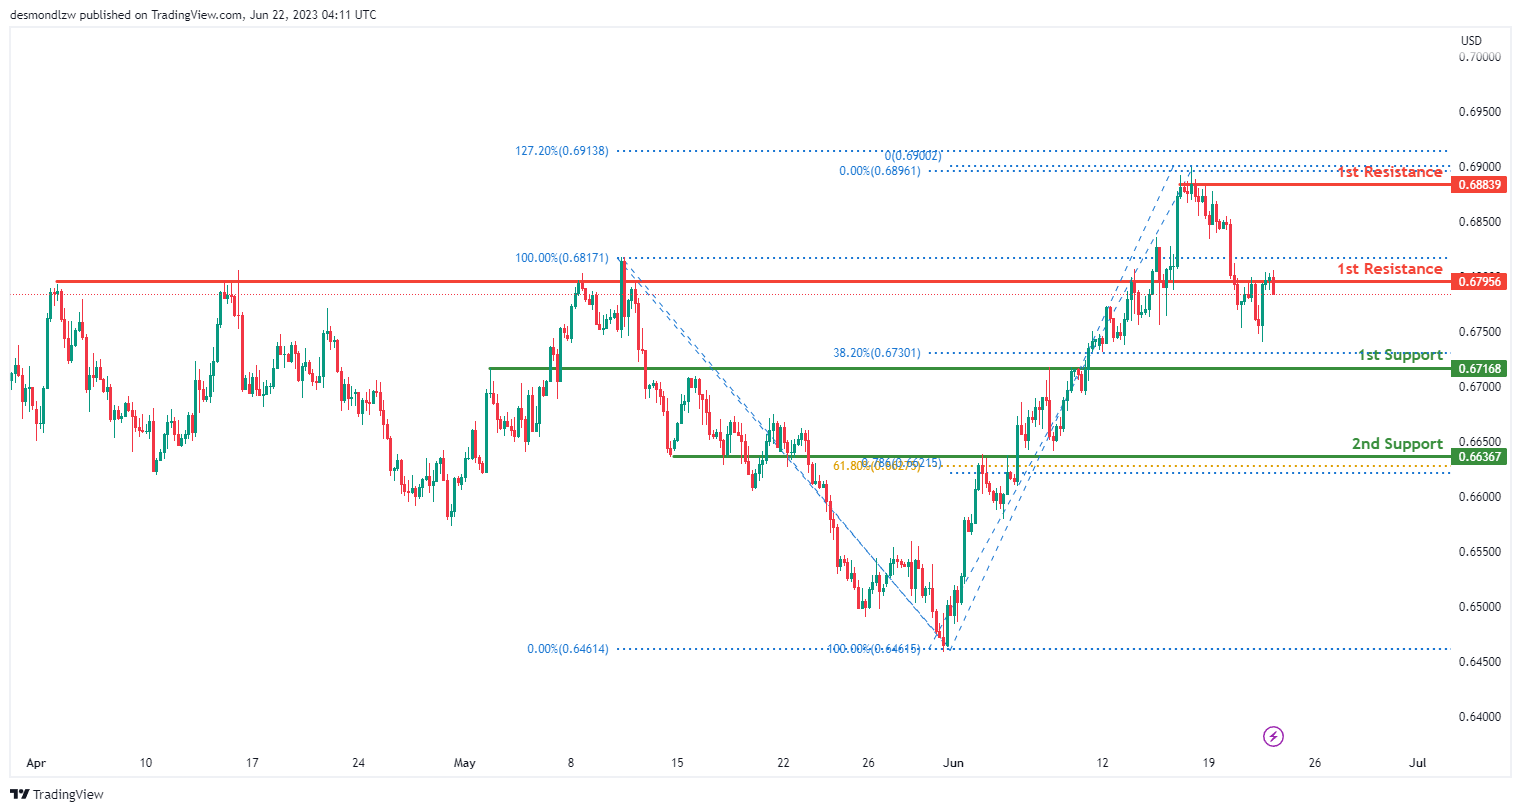
The AUD/USD chart indicates a bearish momentum, suggesting a downward trend in the market. There is a possibility of a bearish break off the first support level at 0.8795, which is identified as a pullback support and coincides with the 23.60% Fibonacci Retracement. The price could potentially drop towards the second support level at 0.6721, which serves as another pullback support and aligns with the 38.20% Fibonacci Retracement.
On the upside, the first resistance level at 0.6883 represents a swing high resistance. Additionally, the second resistance level at 0.6916 is identified as a level of interest, coinciding with the 127.20% Fibonacci Extension.
NZD/USD
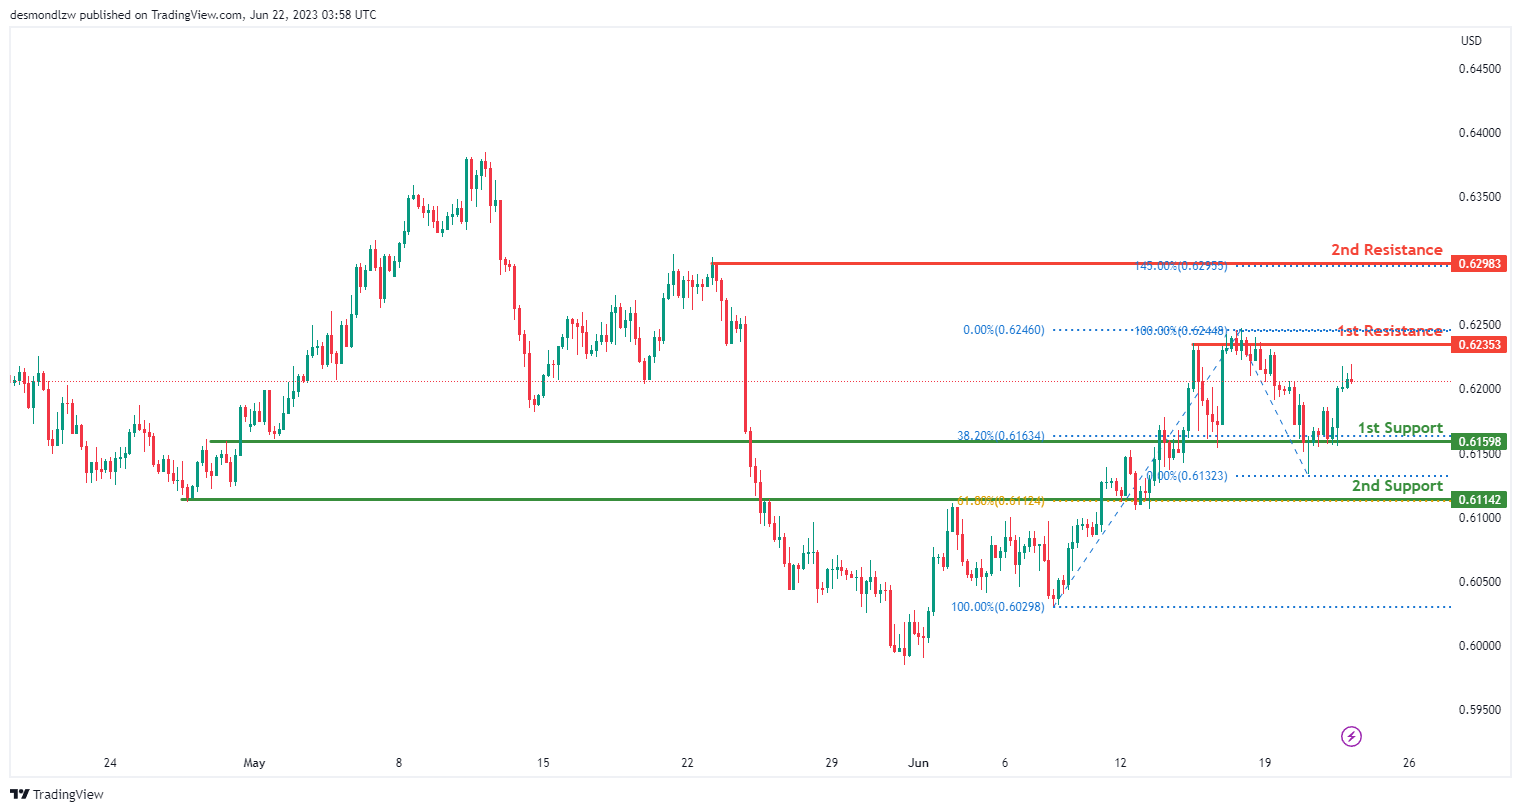
The NZD/USD chart exhibits a bullish momentum, suggesting an upward trend in the market. There is a possibility of a bullish continuation towards the first resistance level at 0.6235, which is identified as a pullback resistance. Additionally, the second resistance level at 0.6298 acts as a swing high resistance.
On the downside, the first support level at 0.6159 represents an overlap support and aligns with the 38.20% Fibonacci Retracement. Furthermore, the second support level at 0.6114 serves as another overlap support and coincides with the 61.80% Fibonacci Retracement.
DJ30:
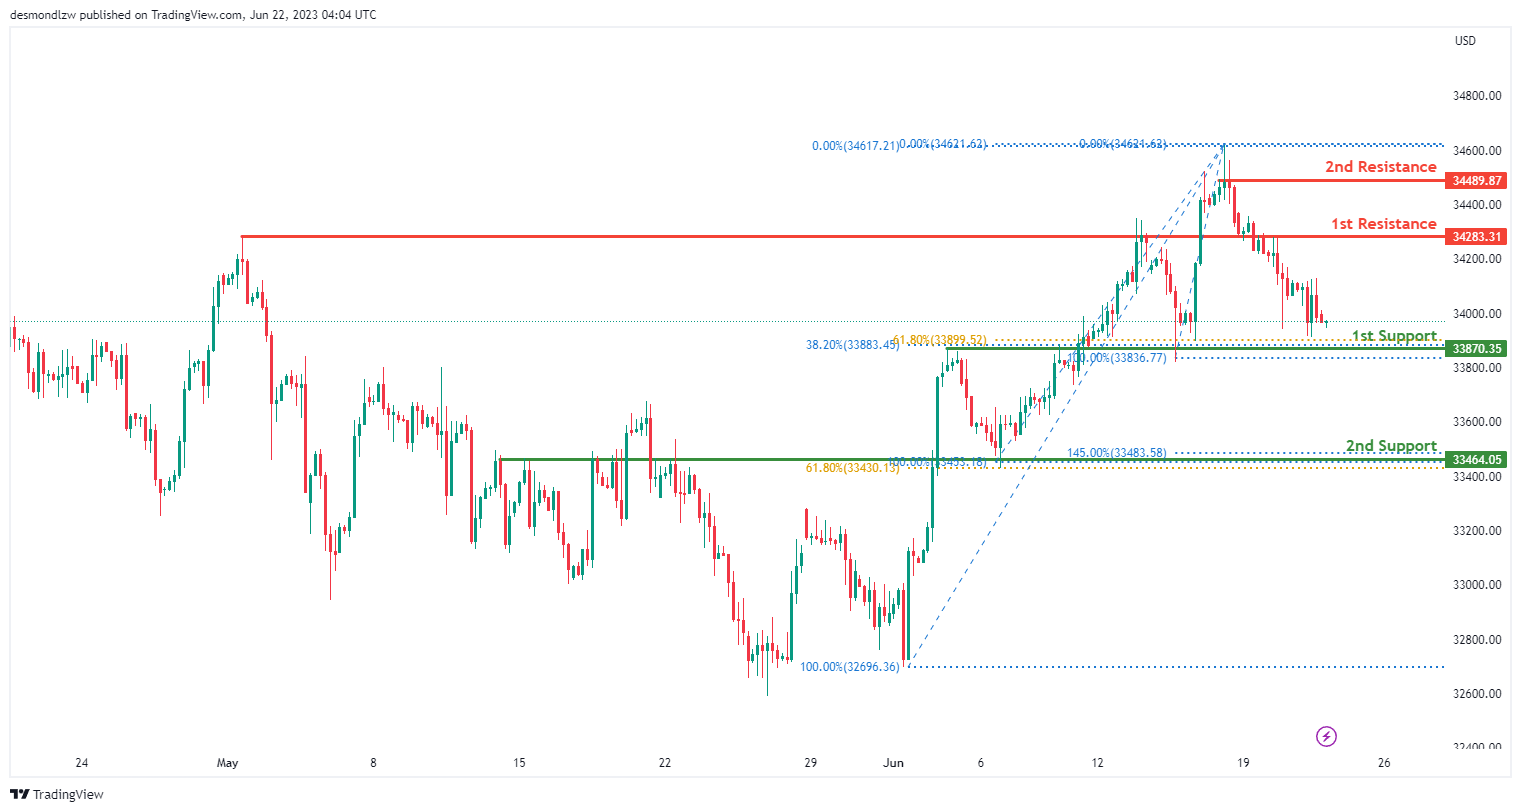
The DJ30 chart demonstrates a bullish momentum, indicating an upward trend in the market. There is a potential for a bullish bounce off the first support level at 33870.35, which is an overlap support and aligns with both the 38.20% and 61.80% Fibonacci Retracement. Additionally, the second support level at 33464.05 serves as another overlap support and coincides with the 61.80% Fibonacci Retracement and 145.00% Fibonacci Extension.
On the upside, the first resistance level at 34283.31 represents an overlap resistance. Furthermore, the second resistance level at 34489.87 is identified as a swing high resistance.
GER30:
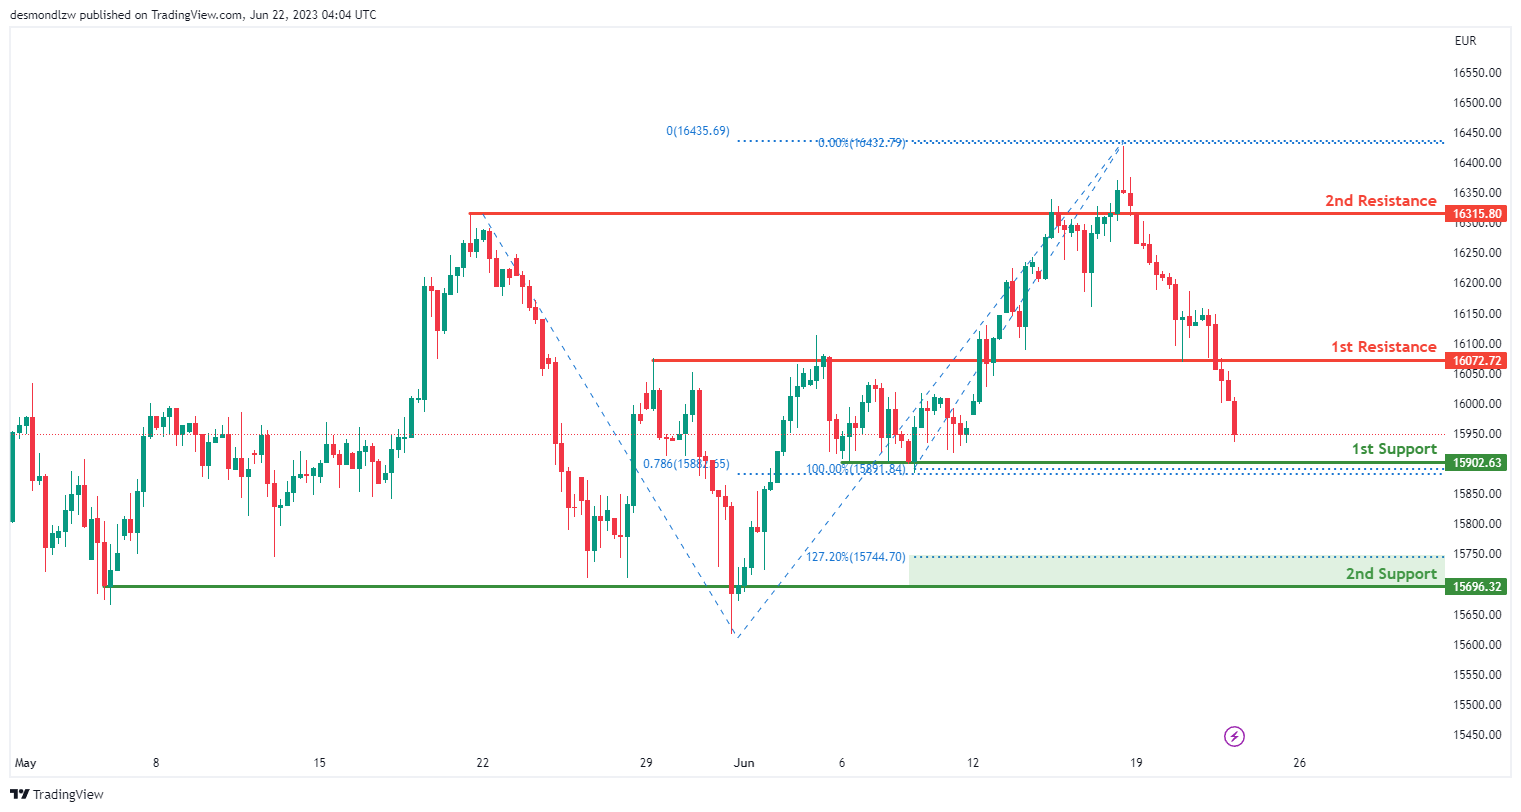
The GER30 chart indicates a bearish momentum, suggesting a downward trend in the market. There is a potential for a bearish continuation towards the first support level at 15902.63, which is a multi-swing low support and aligns with the 78.60% Fibonacci Projection. Additionally, the second support level at 15696.32 serves as another multi-swing low support and coincides with the 127.20% Fibonacci Extension.
On the upside, the first resistance level at 16072.72 represents a pullback resistance. Furthermore, the second resistance level at 16315.80 is identified as a pullback resistance.
US500
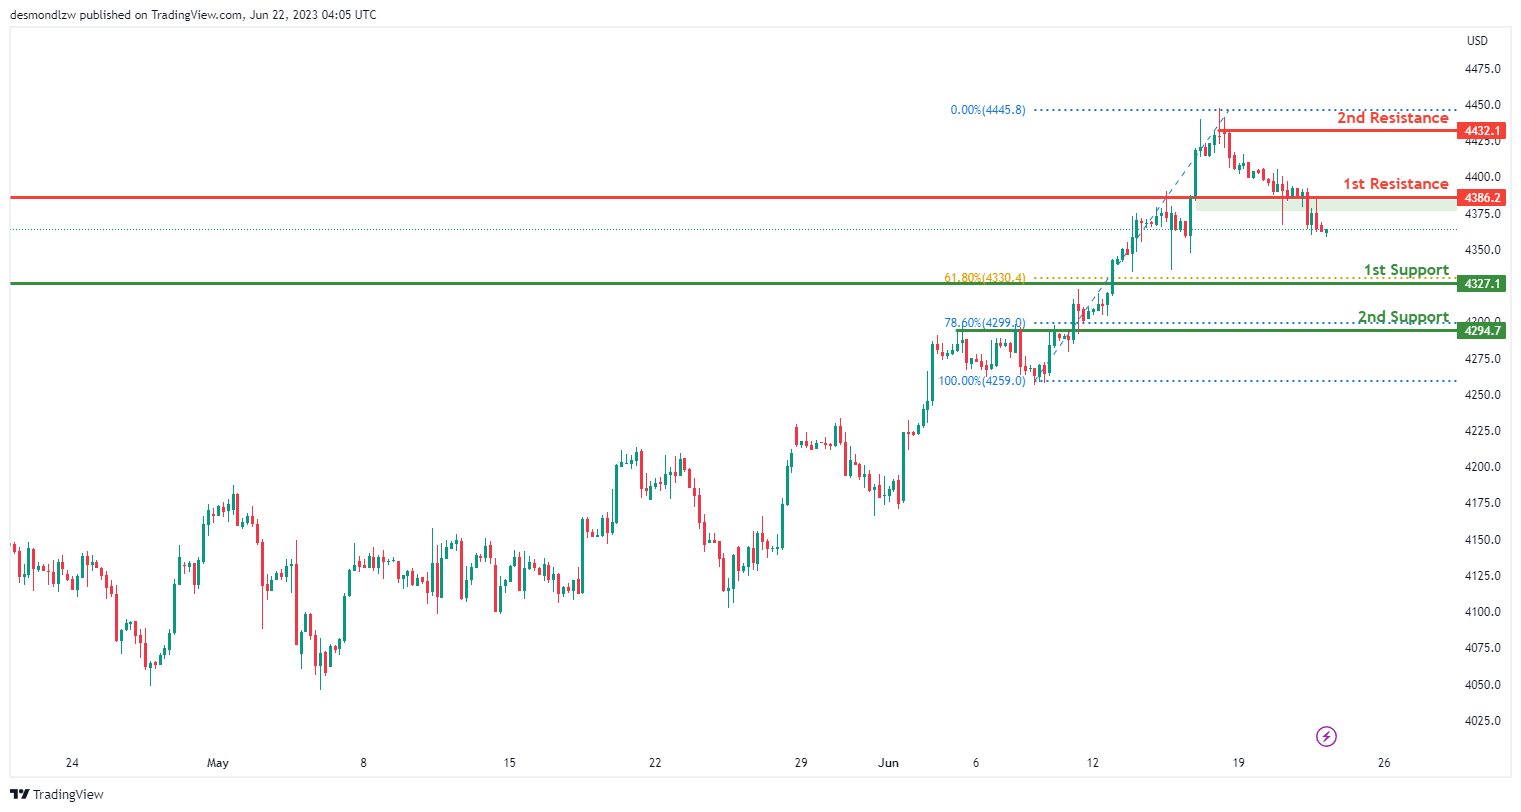
The US500 chart demonstrates a bearish momentum, indicating a downward trend in the market. There is a possibility of a bearish continuation towards the first support level at 4327.1, which serves as a pullback support and aligns with the 61.80% Fibonacci Retracement. Additionally, the second support level at 4294.7 acts as an overlap support and coincides with the 78.60% Fibonacci Retracement.
On the upside, the first resistance level at 4386.2 represents an overlap resistance. Furthermore, the second resistance level at 4432.1 is identified as a swing high resistance.
BTC/USD:
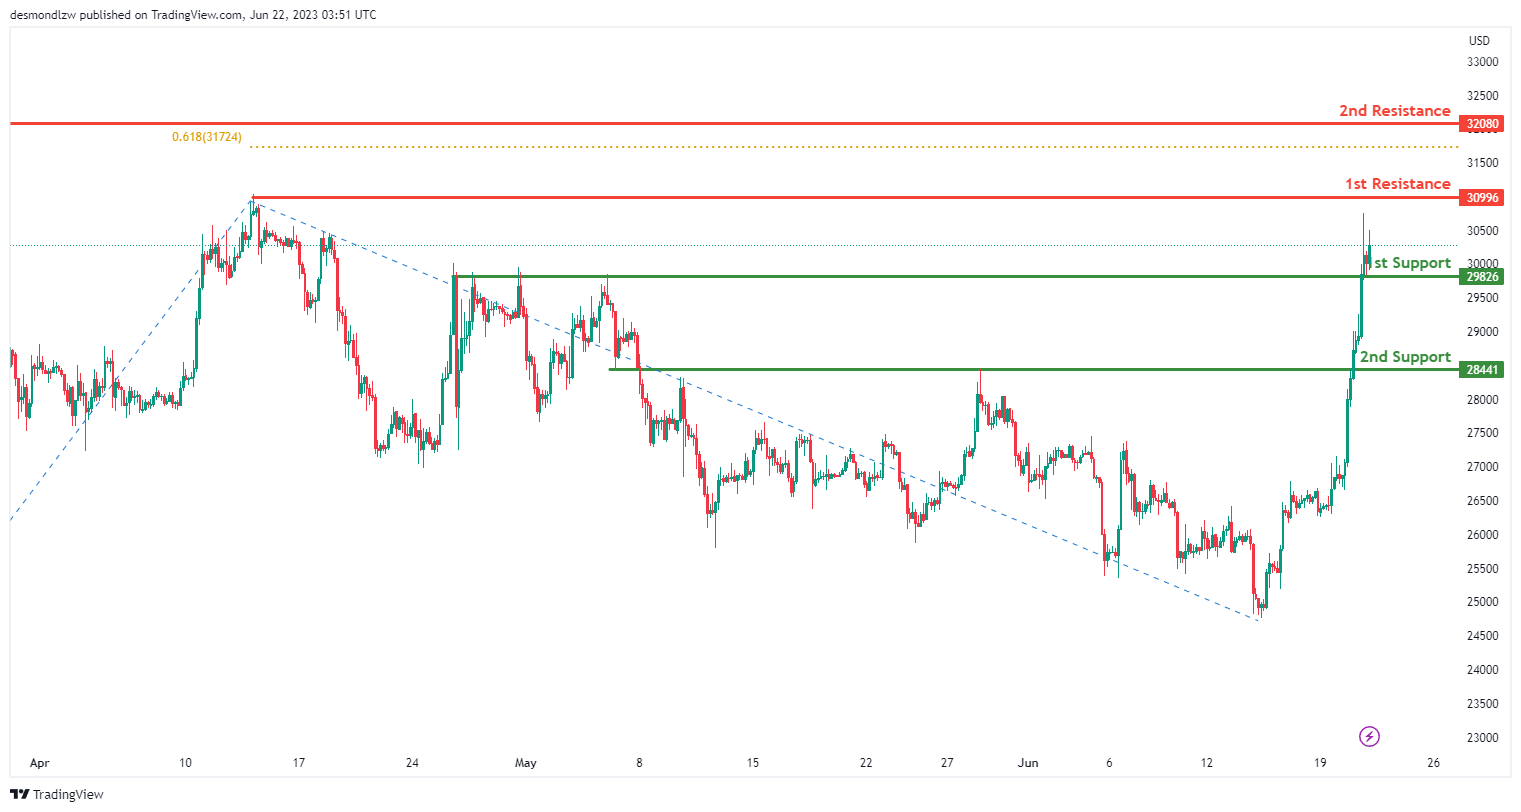
The BTC/USD chart indicates a bullish momentum, suggesting an upward trend in the market. There is a potential for a bullish continuation towards the first resistance level at 30996, which represents a swing high resistance.
On the downside, the first support level at 29826 serves as a pullback support, while the second support level at 28441 acts as an additional pullback support. Furthermore, the second resistance level at 32080 is identified as a swing high resistance, coinciding with the 61.80% Fibonacci Projection.
ETH/USD:
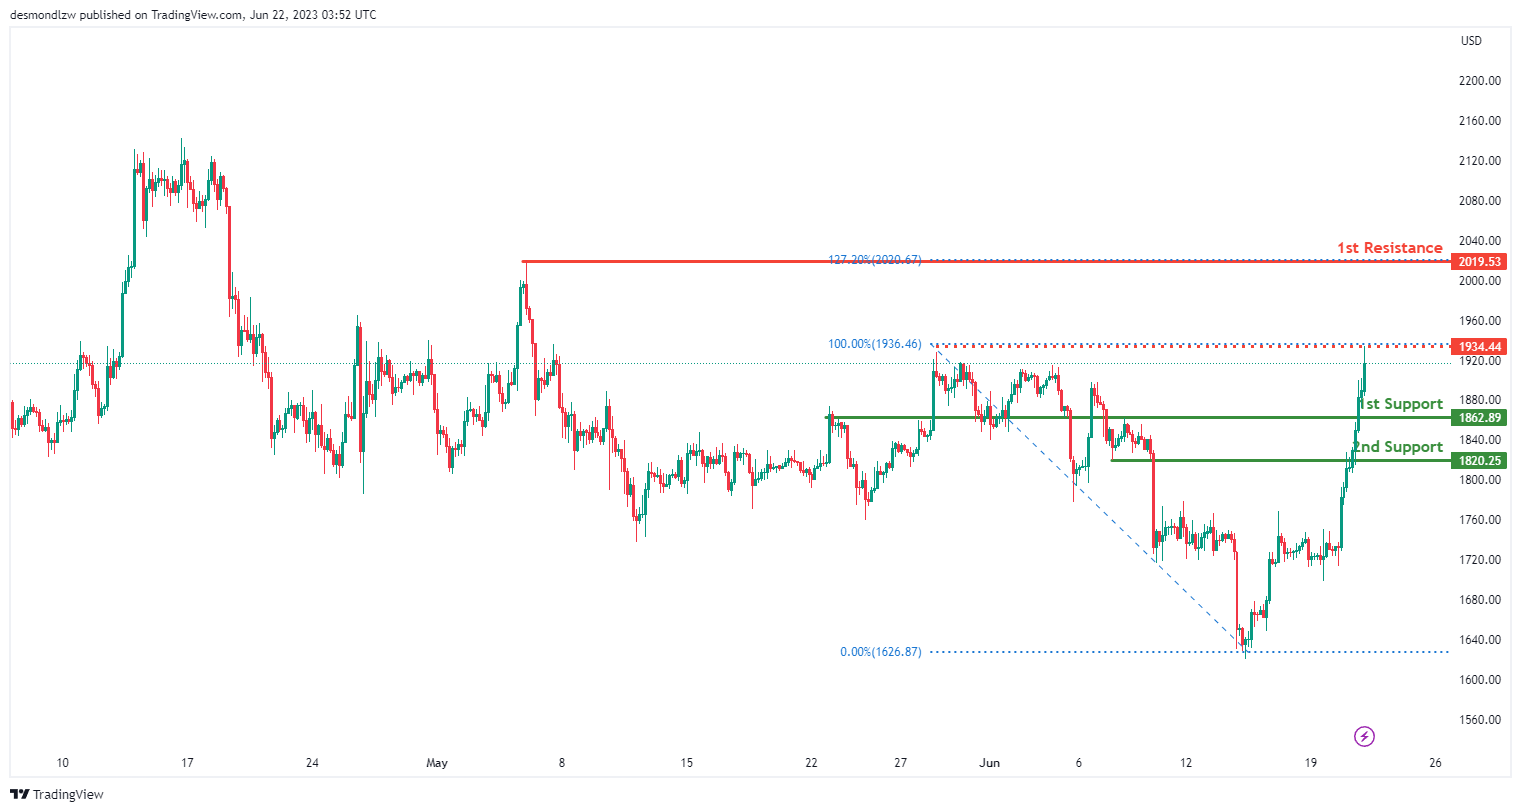
The ETH/USD chart demonstrates a bullish momentum, indicating an upward trend in the market. There is a potential for a bullish continuation towards the first resistance level at 2019.53, which represents a swing high resistance.
On the downside, the first support level at 1862.89 serves as a pullback support. Additionally, the second support level at 1820.25 acts as another pullback support. Furthermore, an intermediate resistance level at 1934.44 is identified as a swing high resistance.
WTI/USD:
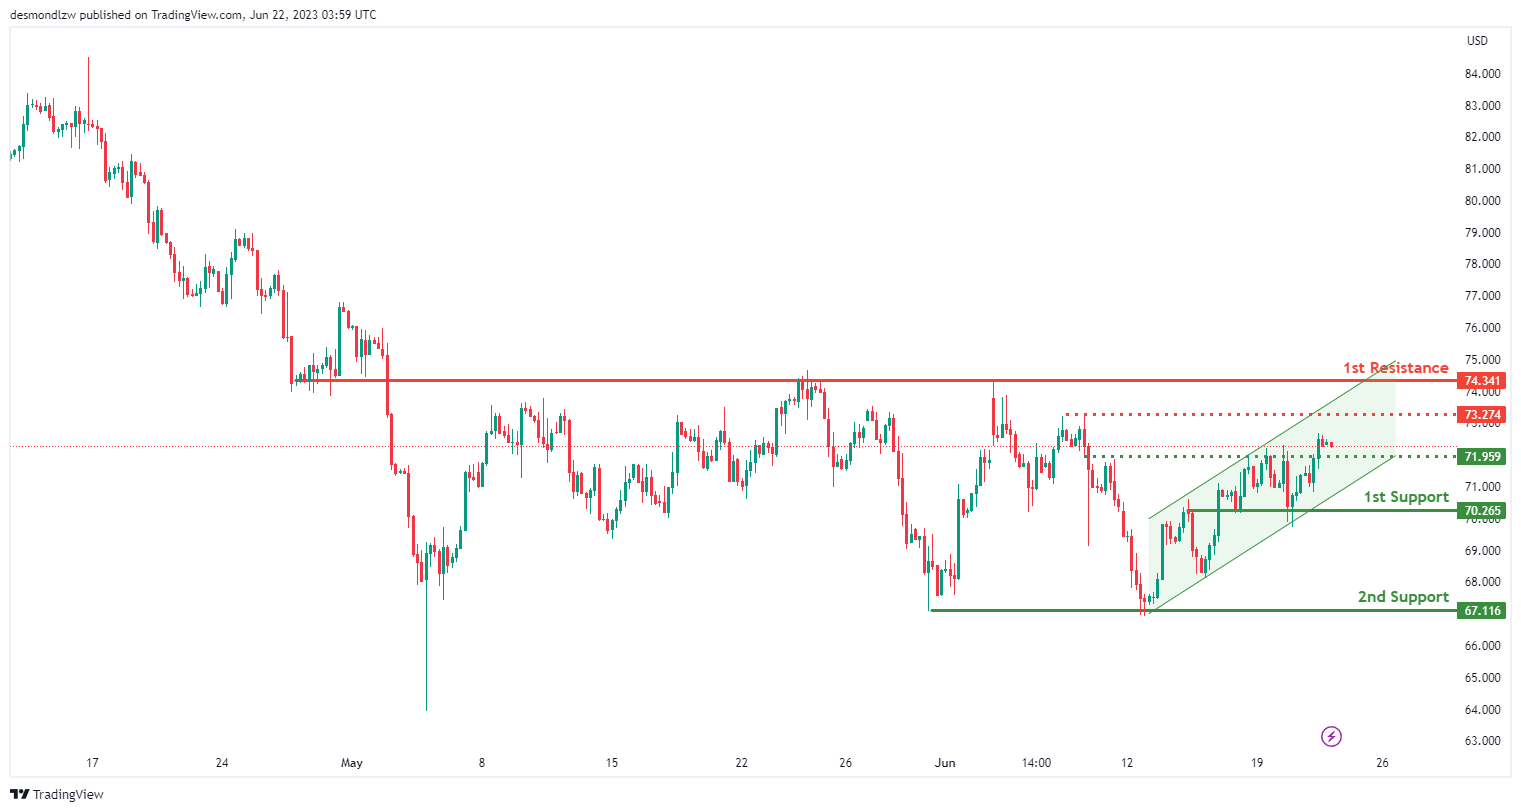
The WTI chart exhibits a bullish momentum, characterized by the price movement within an ascending channel. There is a potential for a bullish continuation towards the first resistance level at 74.34, which is identified as an overlap resistance.
On the downside, the first support level at 70.26 represents an overlap support. Additionally, the second support level at 67.11 serves as a multi-swing low support. Furthermore, an intermediate support level at 71.95 is recognized as a pullback support.
Moreover, an intermediate resistance level at 73.27 acts as a swing high resistance.
XAU/USD (GOLD):
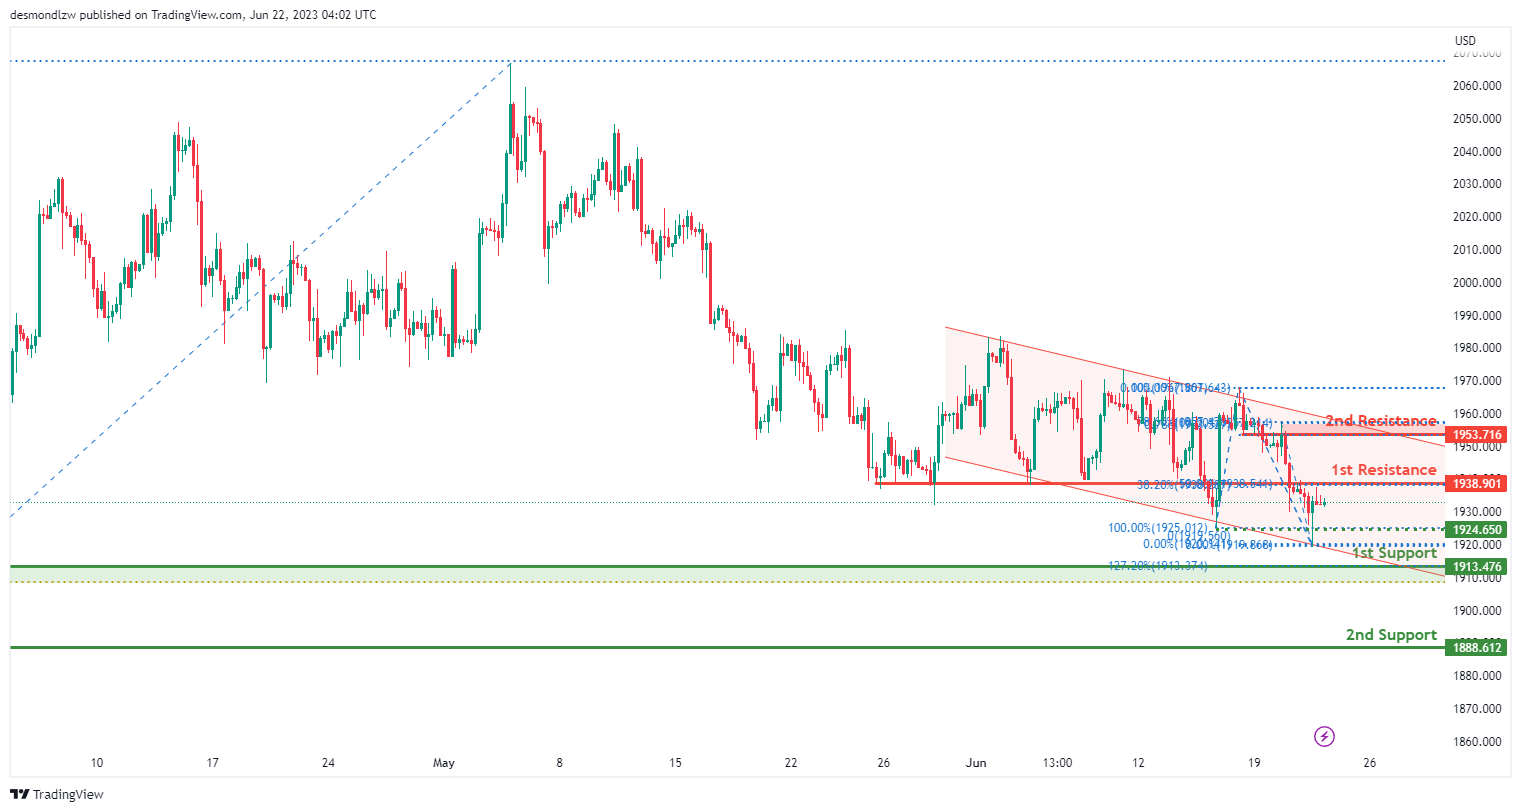
The XAU/USD chart indicates a bearish momentum, characterized by the price movement within a descending channel. There is a potential for a bearish reaction off the first resistance level at 1938.90, which is an overlap resistance and aligns with both the 38.20% and 50% Fibonacci Retracement levels (Fibonacci confluence). Additionally, the second resistance level at 1953.71 serves as another overlap resistance, coinciding with the 78.60% Fibonacci Retracement and 78.60% Fibonacci Projection.
On the downside, the first support level at 1913.47 is identified as an overlap support, encompassing the 127.20% Fibonacci Extension and 61.80% Fibonacci Retracement (Fibonacci confluence). Furthermore, the second support level at 1888.61 represents another overlap support. Additionally, an intermediate support level at 1924.65 is recognized as a pullback support.
EUR/GBP Daily Outlook
Daily Pivots: (S1) 0.8551; (P) 0.8580; (R1) 0.8635; More...
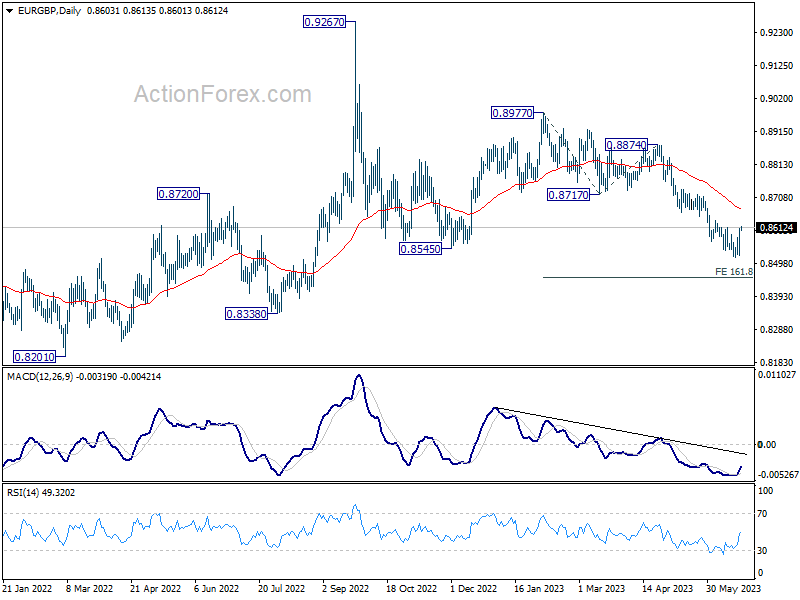
Immediate focus is now on 0.8611 resistance in EUR/GBP. Decisive break there will confirm short term bottoming at 0.8517, stronger rebound would then be seen to 55 D EMA (now at 0.8670) and above. Nevertheless, rejection by 0.8611, will maintain near term bearishness. Further break of 0.8517 will resume the fall from 0.8977 to 161.8% projection of 0.8977 to 0.8717 from 0.8874 at 0.8453.
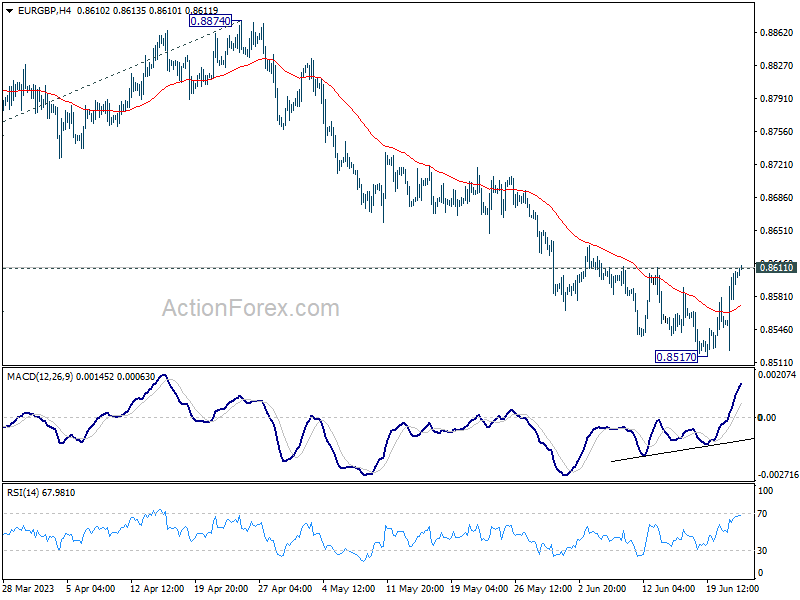
In the bigger picture, the down trend from 0.9267 (2022 high) is still in progress. It's seen as part of the long term range pattern from 0.9499 (2020 high). Deeper fall would be seen towards 0.8201 (2022 low). But strong support should be seen from there to bring reversal. This will now remain the favored case as long as 0.8717 support turned resistance holds.
Sterling Soft ahead of BoE, Swiss Franc Eyes SNB
Sterling is surprisingly soft this week even though markets are raising bets on a more aggressive than expected BoE rate hike, after yesterday's UK CPI data. It's clearly weighed down in selloff against the stronger Euro. Swiss Franc is comparatively steady as SNB rate decision is also awaited. Overall, currency markets appear more attuned to a shift away from risk-on sentiment, evidenced by a notable decline in Australian and New Zealand Dollar. US Dollar and Japanese Yen, however, are displaying a mixed performance.
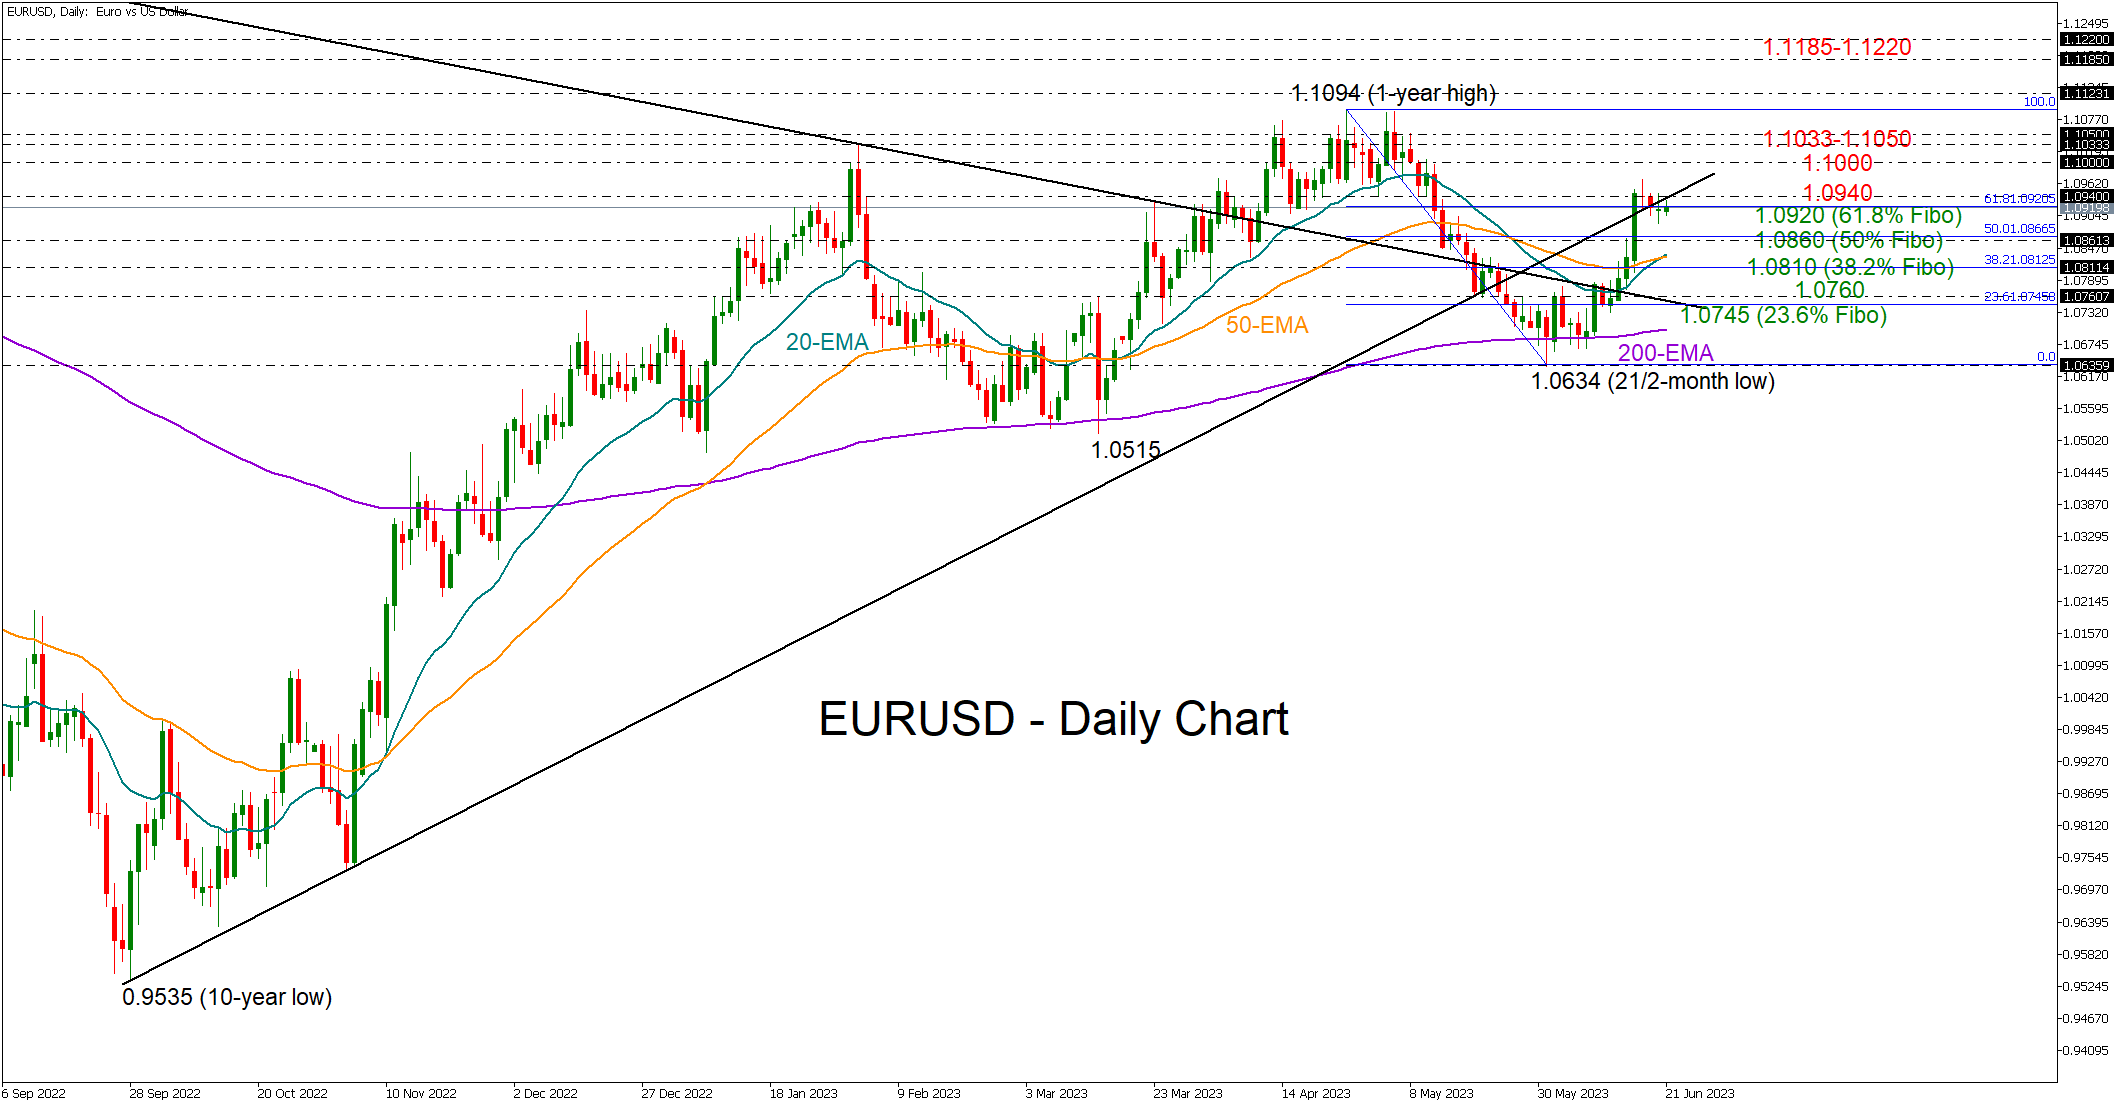
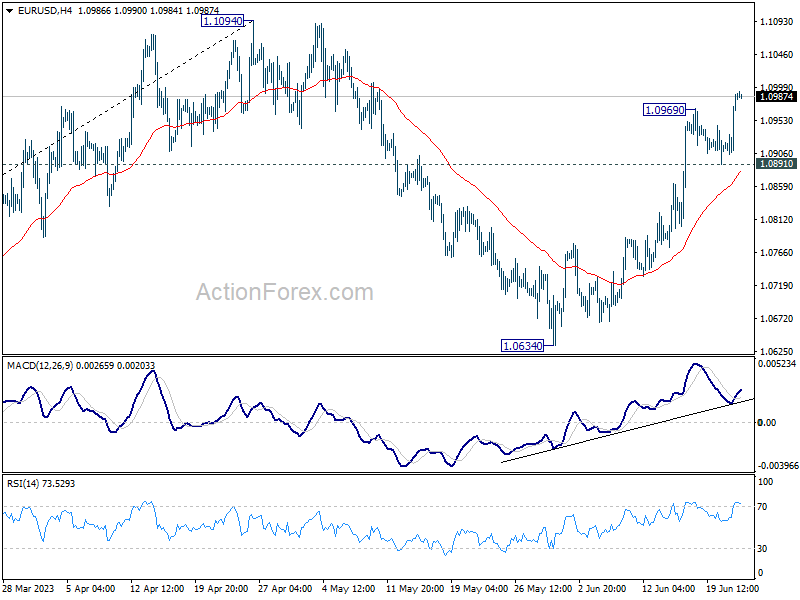
Technically, EUR/USD's rally from 1.0634 resumed after brief consolidations. There are two questions regarding the development. Firstly, current upside momentum as seen in 4H MACD doesn't warrant a firm break through 1.1094 yet. Break of 1.0891 support would indeed extend the corrective pattern from 1.1094 with another falling leg towards 1.0634 before completion.
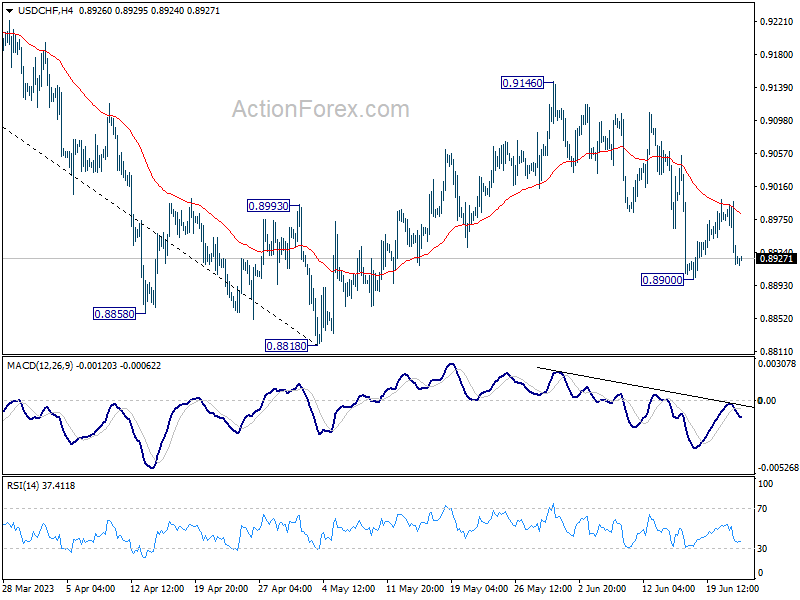
Secondly, USD/CHF was rejected by 55 4H EMA and tumbled notably. But downside is contained above 0.8900 temporary low. Extended rally in EUR/USD could help USD/CHF break through 0.8900 towards 0.8818 low.
In Asia, at the time of writing, Nikkei is down -0.75%. Singapore Strait Times is down -0.20%. Japan 10-year JGB yield is up 0.0015 at 0.375. Overnight, DOW dropped -0.30%. S&P 500 dropped -0.52%. NASDAQ dropped -1.21%. 10-year yield dropped -0.006 to 3.723.
BoE and SNB to hike for sure, but... by how much?
As BoE gears up for its monetary policy decision today, market observers find themselves divided on the scale of the expected rate hike. This indecision comes in the wake of a consumer inflation report released yesterday that muddied the waters. Headline CPI for May remained static at 8.7%, exceeding BoE's own forecasts, while core CPI climbed to 7.1%, reaching its highest level since 1992.
Market participants are currently betting on a 40% probability of a more substantial 50bps increase to 5.00%, and a 60% chance of a modest 25bps hike. The critical shift also lies in elevated projections for the terminal rate, which has shot up to 6.00%, a marked rise from below 5% merely a month ago.
The verdict for today's decision will also pivot significantly on the voting breakdown, which will serve as a bellwether for BoE's future steps. Known doves Silvana Tenreyro and Swati Dhingra are more likely to vote against any changes. The real wildcard, however, is how many of the remaining seven members will advocate for a 50bps hike, even if a 25bps increase is ultimately implemented.
SNB is also expected to announce its own rate hike from the current 1.50%. Chairman Thomas Jordan has signalled that interest rates may need to ascend above 2% threshold - a restrictive level - to reel inflation back below 2% mark. The quotes lies in timing of the attainment of this peak rate. Presently, the likelihood of either a 25bps or a 50bps hike today seems evenly split, making it a nail-biter.
Some previews on BoE and SNB:
- Will the BoE Appear Hawkish Enough to Push the Pound Higher?
- Bank of England Preview – Look to Sell GBP on Aggressive BoE Pricing
- SNB to Raise Rates, But Will It Be Enough to Lift the Franc?
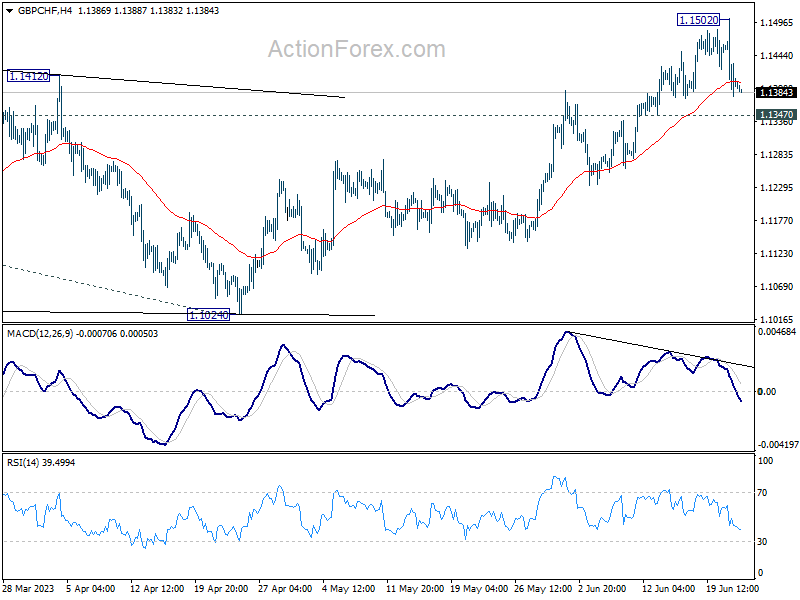
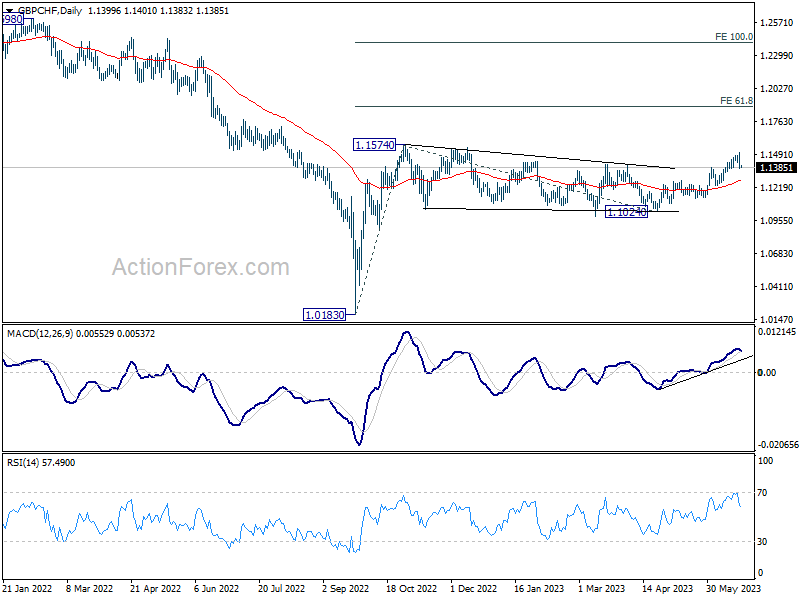
GBP/CHF's rally was choked after hitting 1.1502 earlier in the week, kept below 1.1574 resistance. For now, the favored case is still that triangle consolidation pattern from 1.1574 has completed at 1.1024. Rise from 1.1024 is seen as resuming the whole rally from 1.0183. Decisive break of 1.1574 will confirm this bullish case and target 61.8% projection of 1.0183 to 1.1574 from 1.1024 at 1.1884. However, firm break of 1.1347 support will dampen this view, and extend the pattern from 1.1574 with another fall.
BoJ Noguchi: Important to maintain monetary easing
BoJ board member Asahi Noguchi underlined the necessity of maintaining monetary easing as Japan navigates signs of wage growth.
"What's most important now is for the BOJ to maintain monetary easing and ensure budding signs of wage growth become a sustained, strong trend," he said.
Noguchi predicts that core consumer inflation, which has been running above the bank's 2% target, will likely drop below this level around September or October. He attributed this anticipated decrease to the fading effects of past increases in raw material costs.
However, he noted that the possibility of inflation bouncing back above 2% later on and maintaining that level hinges largely on future wage trends and service prices.
New Zealand goods exports up 2.8% yoy in may, imports rose 4.4% yoy
New Zealand's monthly trade balance in May registered smaller surplus than anticipated, clocking in at NZD 46m against expected NZD 350m. This outcome followed rise in goods exports by NZD 189m (2.8% yoy) to NZD 7.0B, while goods imports saw an increase of NZD 292m (4.4% yoy), totalling NZD 6.9B.
China led the growth in monthly exports, with total exports increasing by NZD 308m (18% yoy). USA also reported a significant rise in exports, up by NZD 68m (9.7% yoy), while Japan experienced a modest increment of NZD 18m (4.2% yoy). On the other hand, total exports to Australia and the European Union fell by NZD -122m (-14% yoy) and NZD -60m (-11% yoy) respectively.
When it comes to imports, USA claimed the top spot with a massive jump of NZD 435m (87% yoy). South Korea followed with an increase of NZD 152m (41% yoy), while Australia and the European Union saw increases of NZD 81m (11% yoy) and NZD 31m (3.2% yoy) respectively. However, China's imports into New Zealand declined by NZD 52m (-3.6% yoy).
Fed Bostic: Rates should stay at current level for the rest of 2023
Atlanta Fed President Raphael Bostic shared his insights on the current monetary policy landscape in an interview on Yahoo Finance. Bostic argued for a pause on tightening , suggesting that federal funds rate should remain stable at the current level of 5.00-5.25% for the rest of the year.
"My baseline is that we should stay at this level for the rest of the year," he stated. He suggested that Fed's tightening work should be allowed to ripple through the economy.
He asserted, "It takes time for monetary policy changes to meaningfully influence economic activity. We have good reasons to expect our policy tightening will be increasingly effective in coming months."
Elsewhere
US will release jobless claims, current account and existing home sales today too.
EUR/GBP Daily Outlook
Daily Pivots: (S1) 0.8551; (P) 0.8580; (R1) 0.8635; More...
Immediate focus is now on 0.8611 resistance in EUR/GBP. Decisive break there will confirm short term bottoming at 0.8517, stronger rebound would then be seen to 55 D EMA (now at 0.8670) and above. Nevertheless, rejection by 0.8611, will maintain near term bearishness. Further break of 0.8517 will resume the fall from 0.8977 to 161.8% projection of 0.8977 to 0.8717 from 0.8874 at 0.8453.
In the bigger picture, the down trend from 0.9267 (2022 high) is still in progress. It's seen as part of the long term range pattern from 0.9499 (2020 high). Deeper fall would be seen towards 0.8201 (2022 low). But strong support should be seen from there to bring reversal. This will now remain the favored case as long as 0.8717 support turned resistance holds.
Economic Indicators Update
| GMT | Ccy | Events | Actual | Forecast | Previous | Revised |
|---|---|---|---|---|---|---|
| 22:45 | NZD | Trade Balance (NZD) May | 46M | 350M | 427M | 236M |
| 07:30 | CHF | SNB Rate Decision | 1.75% | 1.50% | ||
| 08:00 | CHF | SNB Press Conference | ||||
| 11:00 | GBP | BoE Rate Decision | 4.75% | 4.50% | ||
| 11:00 | GBP | MPC Official Bank Rate Votes | 7--0--2 | 7--0--2 | ||
| 12:30 | USD | Initial Jobless Claims (Jun 16) | 256K | 262K | ||
| 12:30 | USD | Current Account (USD) Q1 | -217B | -207B | ||
| 14:00 | USD | Existing Home Sales May | 4.25M | 4.28M | ||
| 14:00 | EUR | Eurozone Consumer Confidence Jun P | -17 | -17.4 | ||
| 14:30 | USD | Natural Gas Storage | 89B | 84B | ||
| 15:00 | USD | Crude Oil Inventories | 0.3M | 7.9M |
BoE and SNB to hike for sure, but… by how much?
As BoE gears up for its monetary policy decision today, market observers find themselves divided on the scale of the expected rate hike. This indecision comes in the wake of a consumer inflation report released yesterday that muddied the waters. Headline CPI for May remained static at 8.7%, exceeding BoE's own forecasts, while core CPI climbed to 7.1%, reaching its highest level since 1992.
Market participants are currently betting on a 40% probability of a more substantial 50bps increase to 5.00%, and a 60% chance of a modest 25bps hike. The critical shift also lies in elevated projections for the terminal rate, which has shot up to 6.00%, a marked rise from below 5% merely a month ago.
The verdict for today's decision will also pivot significantly on the voting breakdown, which will serve as a bellwether for BoE's future steps. Known doves Silvana Tenreyro and Swati Dhingra are more likely to vote against any changes. The real wildcard, however, is how many of the remaining seven members will advocate for a 50bps hike, even if a 25bps increase is ultimately implemented.
SNB is also expected to announce its own rate hike from the current 1.50%. Chairman Thomas Jordan has signalled that interest rates may need to ascend above 2% threshold - a restrictive level - to reel inflation back below 2% mark. The quotes lies in timing of the attainment of this peak rate. Presently, the likelihood of either a 25bps or a 50bps hike today seems evenly split, making it a nail-biter.
Some previews on BoE and SNB:
- Will the BoE Appear Hawkish Enough to Push the Pound Higher?
- Bank of England Preview – Look to Sell GBP on Aggressive BoE Pricing
- SNB to Raise Rates, But Will It Be Enough to Lift the Franc?
GBP/CHF's rally was choked after hitting 1.1502 earlier in the week, kept below 1.1574 resistance. For now, the favored case is still that triangle consolidation pattern from 1.1574 has completed at 1.1024. Rise from 1.1024 is seen as resuming the whole rally from 1.0183. Decisive break of 1.1574 will confirm this bullish case and target 61.8% projection of 1.0183 to 1.1574 from 1.1024 at 1.1884. However, firm break of 1.1347 support will dampen this view, and extend the pattern from 1.1574 with another fall.
New Zealand goods exports up 2.8% yoy in may, imports rose 4.4% yoy
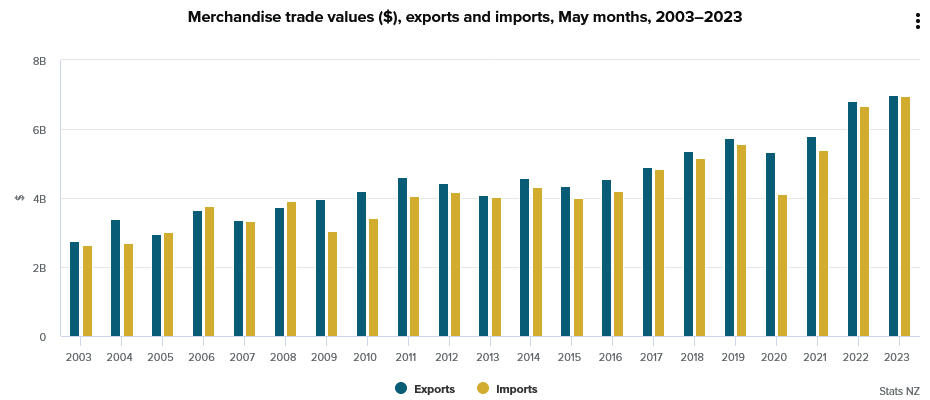
New Zealand's monthly trade balance in May registered smaller surplus than anticipated, clocking in at NZD 46m against expected NZD 350m. This outcome followed rise in goods exports by NZD 189m (2.8% yoy) to NZD 7.0B, while goods imports saw an increase of NZD 292m (4.4% yoy), totalling NZD 6.9B.
China led the growth in monthly exports, with total exports increasing by NZD 308m (18% yoy). USA also reported a significant rise in exports, up by NZD 68m (9.7% yoy), while Japan experienced a modest increment of NZD 18m (4.2% yoy). On the other hand, total exports to Australia and the European Union fell by NZD -122m (-14% yoy) and NZD -60m (-11% yoy) respectively.
When it comes to imports, USA claimed the top spot with a massive jump of NZD 435m (87% yoy). South Korea followed with an increase of NZD 152m (41% yoy), while Australia and the European Union saw increases of NZD 81m (11% yoy) and NZD 31m (3.2% yoy) respectively. However, China's imports into New Zealand declined by NZD 52m (-3.6% yoy).
BoJ Noguchi: Important to maintain monetary easing
BoJ board member Asahi Noguchi underlined the necessity of maintaining monetary easing as Japan navigates signs of wage growth.
"What's most important now is for the BOJ to maintain monetary easing and ensure budding signs of wage growth become a sustained, strong trend," he said.
Noguchi predicts that core consumer inflation, which has been running above the bank's 2% target, will likely drop below this level around September or October. He attributed this anticipated decrease to the fading effects of past increases in raw material costs.
However, he noted that the possibility of inflation bouncing back above 2% later on and maintaining that level hinges largely on future wage trends and service prices.
Fed Bostic: Rates should stay at current level for the rest of 2023
Atlanta Fed President Raphael Bostic shared his insights on the current monetary policy landscape in an interview on Yahoo Finance. Bostic argued for a pause on tightening , suggesting that federal funds rate should remain stable at the current level of 5.00-5.25% for the rest of the year.
"My baseline is that we should stay at this level for the rest of the year," he stated. He suggested that Fed's tightening work should be allowed to ripple through the economy.
He asserted, "It takes time for monetary policy changes to meaningfully influence economic activity. We have good reasons to expect our policy tightening will be increasingly effective in coming months."
Eurozone Flash PMI Figures to Test Recession Fears
The eurozone economy contracted during the past two quarters albeit mildly, entering a technical recession. Traders will look to see whether the negligible downturn has worsened when flash S&P Global PMI figures for the month of June arrive on Friday at 08:00 GMT. Forecasts point to another disappointing report, which the euro might not like. Nevertheless, the currency may suffer only minor damage as traders may wait for more evidence before they see a hard landing on the horizon.
ECB signals more rate hikes to come
EURUSD experienced its second fastest weekly rally in 2023 after ECB policymakers agreed that inflation may not return to the 2.0% target before 2025 and interest rates may need to keep rising beyond September. The central bank also highlighted that wage growth may remain double its historical average over the next two years, with investors immediately putting down their expectations for a July pause and lifting their terminal rate forecast to 4.0%.
In the eurozone, core inflation , which excludes volatile food and energy prices, has barely eased, being more than double the central bank’s 2.0% target. If that stays the case in the coming months, that would be enough evidence to support the aforementioned hawkish claim.
But the central bank’s attempts to slash inflation may not come without consequences. At some point, past rate increases could backfire as consumers gradually adjust to higher borrowing costs and the cost of living continues to bite.
Growth concerns have resurfaced lately, especially after the latest bank frenzy, but moved further into focus when German GDP data faced a downward revision, pushing the eurozone officially into a technical recession in the first quarter. The reaction in markets, though, was instant, with the euro recouping its losses immediately as the contraction was negligible, looking more like stagnation around -0.1% q/q. In addition, the unemployment rate is still near record lows, hardly resembling a shrinking economy.
Eurozone flash PMI estimates
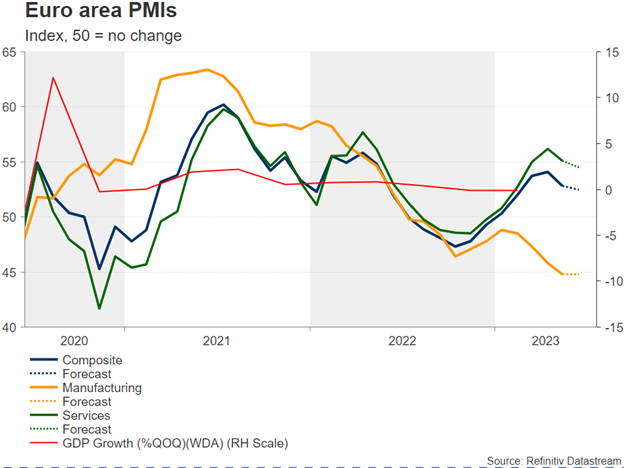
Traders will next look at June’s S&P Global business PMI readings due on Friday to see whether the technical recession has worsened in the second quarter.
Although the contracting manufacturing sector has been the main drag on the economy, the spotlight might fall on the services sector this time. The services sector is the largest component of the EU’s economic growth, and therefore a key determinant of wage and inflation expectations as well. Investors forecast a weaker services PMI index at 54.5 from 55.1 previously. If estimates are correct, that would still be a decent number, pointing to an expansionary sector.
On the other hand, it would also be the second decline in a row, which could consequently feed some speculation that the economy is heading in the wrong direction. Nevertheless, investors would like to see a persisting decline in the data before they start worrying about a sharper economic downturn.
Price and wage PMI content could be important
Moreover, if the survey detects pressure for higher prices and wages, embracing the ECB’s hawkish guidance, the euro could easily find support in the wake of worse-than-expected PMI readings. Technically, if EUR/USD pulls below the current 1.0940-1.0920 resistance territory, it could next take a breather around 1.0860 or slightly lower at 1.0840, where the 20-day simple moving average (SMA) is currently positioned.
Meanwhile, the falling manufacturing PMI index is expected to stabilize at 44.8 for the second consecutive month, with the composite index likely inching down by 0.3 points to 52.5.
In the positive scenario, where the data arrive stronger-than-expected and businesses flag higher consumer prices as wage pressures mount, EUR/USD could spike up to 1.1000 and then attempt to breach the 1.1033-1.1050 key resistance zone with scope to meet April’s one year high of 1.1094.