Sample Category Title
DJIA Technical: Broke Minor Support Ahead and Underperformed
- Dow Jones Industrial Average has underperformed against the S&P 500 and Nasdaq 100 in the past 2 sessions.
- Broke minor support yesterday now turns into key short-term resistance at 34,310.
- Sill sandwiched within a complex sideways range configuration in the medium-term horizon with its range resistance at 34,630.
The Dow Jones Industrial Average (DJIA) has continued to be one of the underperformers among the major US benchmark stock indices ex-post Q2 “Triple Witching” options expiration since last Friday, 16 June.
In the past two sessions, the DJIA has declined by -1.03% versus the S&P 500 (-0.84%), Nasdaq 100 (-0.76%), and small-cap concentrated Russell 2000 (-1.2%).
Sandwiched within a medium-term complex sideways range in the past 6 months
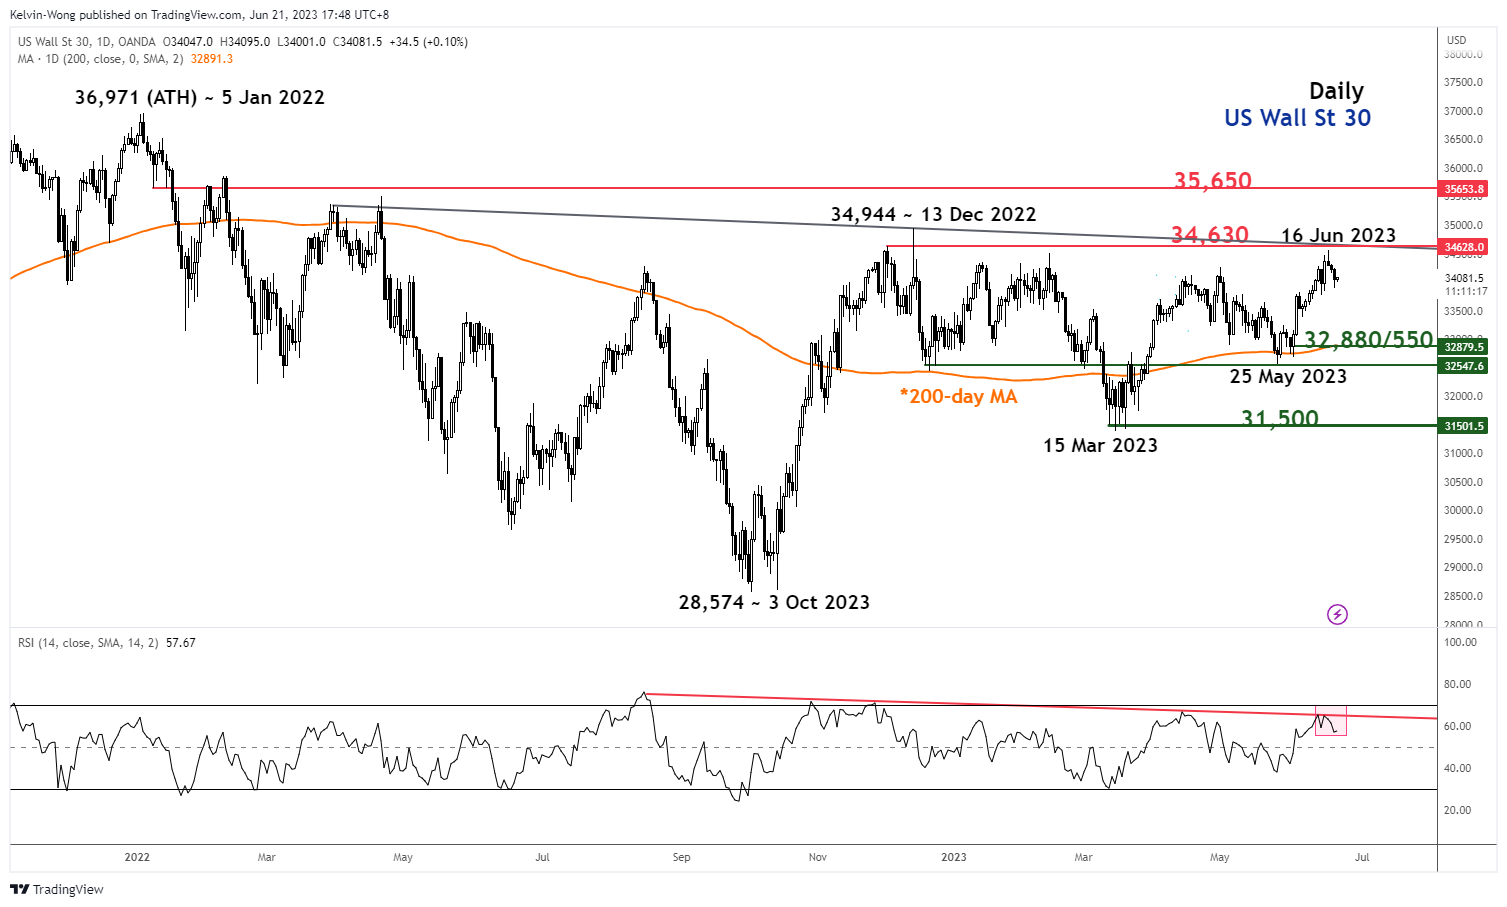
Fig 1: US Wall St 30 medium-term trend as of 21 Jun 2023 (Source: TradingView, click to enlarge chart)
The price actions of the US Wall St 30 Index (proxy of the Dow Jones Industrial Average futures) have continued to churn within a medium-term complex sideways range configuration in place since 13 December 2022. The recent minor up move from the 25 May 2023 low of 32,561 has managed to stage a retreat right below the upper boundary of the range configuration now acting as resistance at 34,630 (see daily chart).
Minor support broke but still above the 200-day moving average
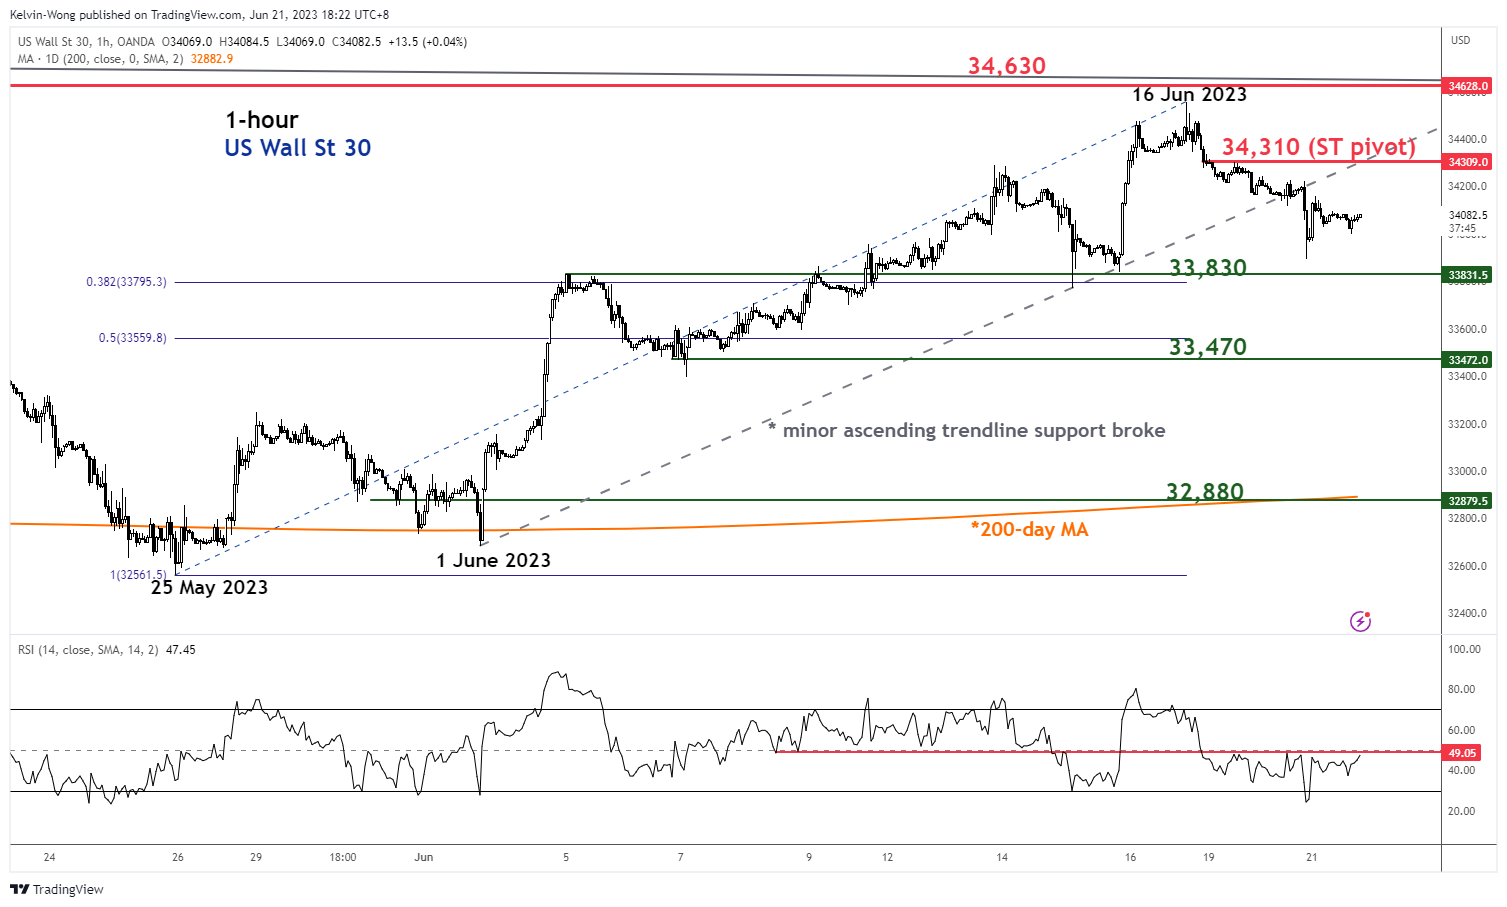
Fig 2: US Wall St 30 minor short-term trend as of 21 Jun 2023 (Source: TradingView, click to enlarge chart)
Yesterday, the Index has broken below its minor ascending trendline support from the 1 June 2023 low now acting as a pull-back resistance at around 34,310 which also confluences with the 61.8% Fibonacci retracement of the current minor decline from the 16 June 2023 high to yesterday, 20 June 2023 low (see 1-hour chart)
Short-term momentum is still showing no clear signs of a bullish reversal as indicated by the 1-hour RSI oscillator that is still below a corresponding resistance at the 49% level.
A break below the 33,830 near-term support exposes the next support at 33,470 (minor swing low area of 7 June 2023 & close to the 50% Fibonacci retracement of the prior up move from 25 May 2023 low to 16 June 2023 high).
On the flip side, a clearance above 34,310 key short-term pivotal resistance negates the bearish tone for the next resistance to come in at 34,630 (medium-term range top as illustrated on the daily chart).
Canadian Dollar Calm Ahead of Canadian Retail Sales
- Canada releases retail sales
- Fed Chair Powell testifies before a House Committee
The Canadian dollar is drifting lower on Wednesday. USD/CAD is trading at 1.3222 in Europe, down 0.10%. The US dollar has endured a rough month of June, and the Canadian dollar has climbed an impressive 2.6% during that time.
Markets eye Canadian retail sales
Canada’s retail sales have hit a bump in the road. In March, retail sales and core retail sales both contracted for a second straight month. Headline retail sales came in at -1.4% and the core rate fell by 0.3%. The markets are expecting better news in the April report, with a consensus of 0.2% for the headline reading and 0.4% for the core rate. With inflation running at 4.4% and the Bank of Canada continuing to raise interest rates, consumers have been hard hit by the cost-of-living crisis and have cut back on spending.
The Bank of Canada needs the economy to cool before it can wrap up the current rate-tightening cycle. The BoC surprised the markets when it raised rates earlier this month, as investors had expected a third-straight pause. The BoC defended its hike by pointing at GDP and inflation, both of which were higher than expected. The labour market remains tight and this has complicated the Bank’s battle with inflation, which could mean a “higher and longer” rate-hike cycle than the BoC had anticipated.
Powell testifies on the Hill
Fed Chair Powell will testify before Congress on Wednesday and Thursday and will face questions about the Fed’s rate path. The Fed paused at this month’s meeting but is expected to raise rates at the July meeting. Powell has said that he can pull off a soft landing that will avoid a recession and large layoffs, but many lawmakers remain concerned that more rate hikes this year will cause significant damage to the US economy.
USD/CAD Technical
- USD/CAD is testing resistance at 1.3253. Above, there is resistance at 1.3329
- 1.3175 and 1.3047 are providing support lines
Ifo: German economy to contract -0.4% this year, inflation down slightly to 5.8%
German economy endured a "sharp setback" in the winter half-year, primarily due to soaring inflation and noticeably weakened demand, as per the latest report from Germany's Ifo Institute.
The country's GDP is predicted to decline by -0.4% this year, before witnessing a rebound with a 1.5% growth next year. The institute also anticipates a gradual decrease the inflation rate, dropping from 6.9% in 2022, to 5.8% in 2023, and then 2.1% in 2024.
In terms of inflation, the Ifo Institute anticipates a further decrease in inflation rates in the coming months, with producers likely to pass on price reductions for intermediate input costs, particularly energy, to their customers.
Nevertheless, wage growth is likely to accelerate throughout the year due to more inflation bonuses being distributed and the effect of noticeable increases in collectively agreed wages.
Bitcoin’s Breakthrough
Market picture
The market capitalisation of cryptocurrencies rose 5.7% in the last 24 hours to 1,134 trillion. Bitcoin was the growth engine, but buyers quickly expanded to some altcoins. Bitcoin is up 7.6%, Ethereum is up 4.7%, and the top altcoins are up from a modest 1.9% (XRP) to 9.4% (Litecoin).
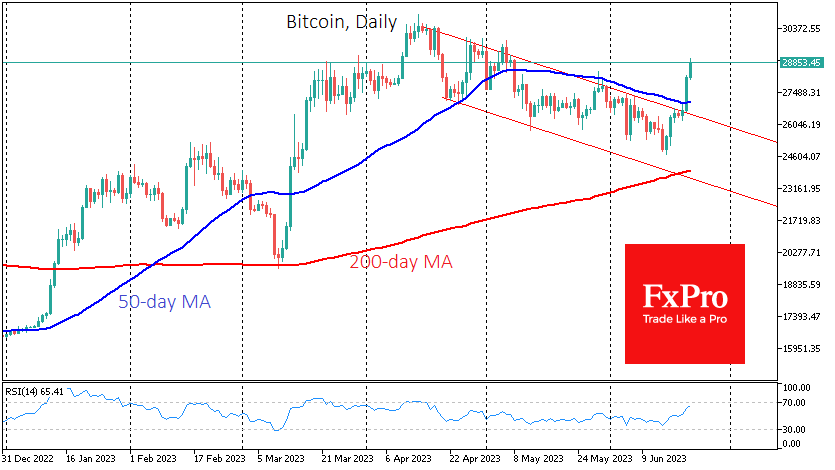
Bitcoin briefly topped $29K at the start of trading on Wednesday. In terms of technical analysis, this is an important bullish signal as the price closed above its 50-day moving average and above previous local highs in a sharp move on Tuesday. This move confirms the breakdown of the downtrend in place for the past two months. The next target for the bulls is the area between the April and May highs at $29.4-$30.4K.
News background
BlackRock’s intention to launch a spot ETF for Bitcoin has boosted institutional investor interest in the cryptocurrency, according to OrBit Markets. BlackRock filed to launch the crypto fund on 15 June. The SEC has rejected such applications more than 30 times, citing market problems and a lack of investor protection.
In anticipation of the halving, hoarders continue accumulating coins, Glassnode noted. Based on the duration of previous such periods, a return to an all-time high could occur within 8-18 months.
According to Coinbase, it is still difficult to predict the impact of a bitcoin halving in 2024. The halving could positively impact BTC’s value, but predicting the impact is speculative.
According to Santiment, Bitcoin outflows from exchanges intensified in June. By mid-June, the amount of BTC on exchanges had fallen to its lowest level since February 2018. The trend to store cryptocurrency autonomously has been dominant since late 2022.
Between 10 and 17 June, the number of new Litecoin addresses increased by 55% in the run-up to the halving, scheduled for 4 August 2023. The total number of addresses reached 200 million, surpassing the Ethereum blockchain, where around 180 million wallets.
EURGBP at the Bottom of a Falling Tube
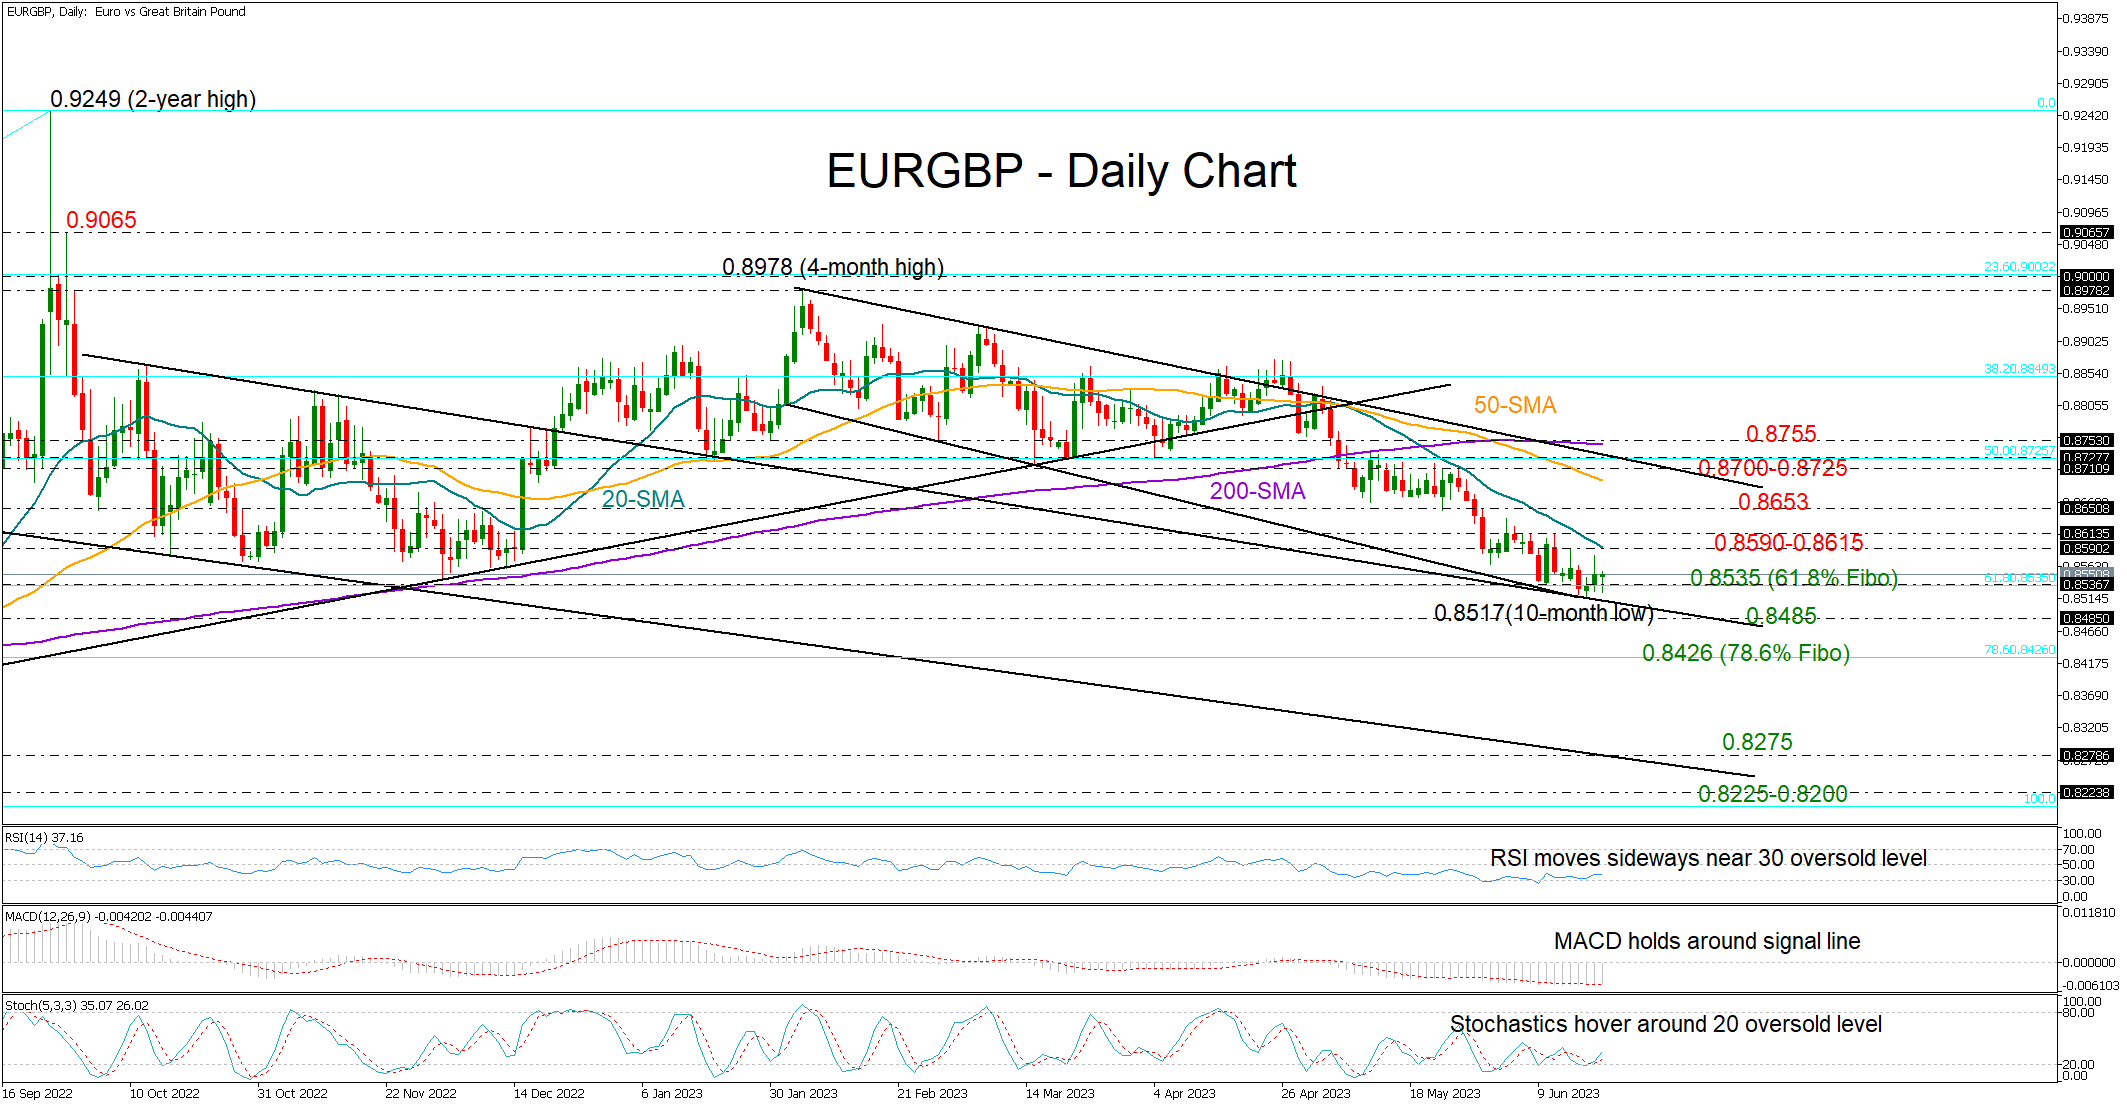
EURGBP marked a 10-month low of 0.8517 at the bottom of the four-month-old bearish channel on Monday, fully reversing its December-February ascent ahead of the Bank of England’s policy announcement due on Thursday.
The 61.8% Fibonacci retracement of the 0.8200-0.9249 uptrend has been cooling downside pressures since the start of the week as well. Still, traders may hesitate to raise their exposure in the market unless the price increases back above the falling 20-day simple moving average (SMA) at 0.8590 and closes above the 0.8615 resistance. If the bulls successfully breach the latter point, they could initially take a breather around the 0.8650 zone before speeding up to test the 50-day SMA at 0.8692. Slightly higher, the channel’s upper boundary, which overlaps with the 50% Fibonacci mark of 0.8725 could be a tougher obstacle.
From a technical perspective, the risk is looking bearish-to-neutral. The RSI is moving sideways around its 30 oversold level, the stochastic oscillator is also lacking direction, while the MACD remains attached to its red signal line way below the zero line. Strikingly, the 50-day SMA has recently slid below the 200-day SMA for the first time since January 2021, warning of a potential deterioration in the market trend.
Hence, a continuation lower cannot be excluded. In this case, a move below the channel could immediately stall somewhere between 0.8485 and the 78.6% Fibonacci of 0.8425. If the bears persist, the pair could come under significant pressure, likely sinking towards the September support trendline at 0.8278. Another extension lower from here may halt within the 0.8223-0.8200 zone, where the aggressive 2020-2021 sell-off paused.
In brief, EURGBP is not out of the woods yet despite stabilizing near a crucial support area. A decisive rally above 0.8615 will be needed to bring the bulls back into play.
USDJPY Stalls after Testing November 2022 Peak
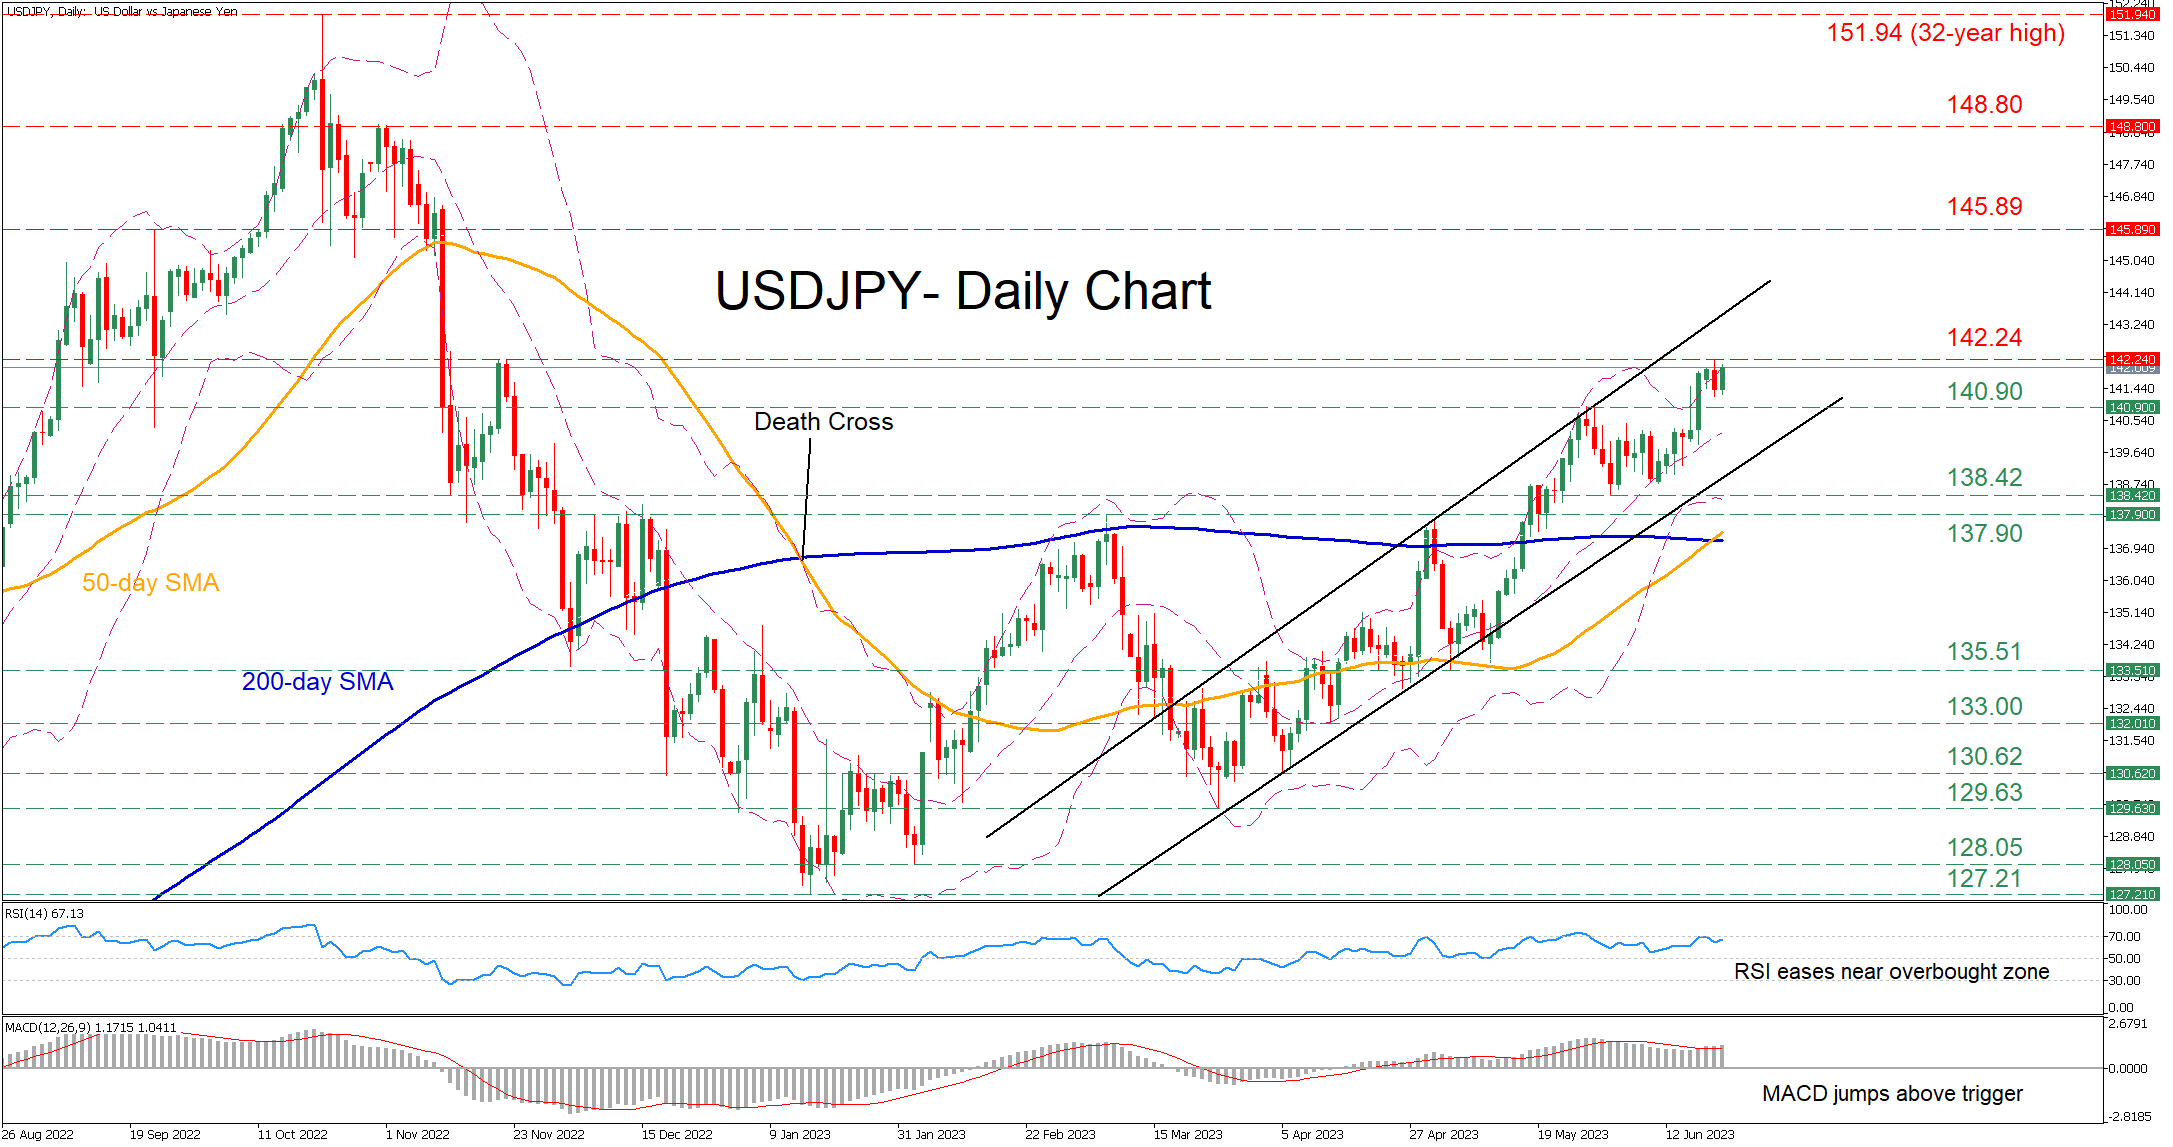
USDJPY has been trading within an upward sloping channel since mid-March, crossing above crucial technical levels and posting consecutive higher highs. However, the pair seems to be consolidating in the near term after failing to breach the November 2022 high of 142.24.
The momentum indicators currently suggest that the bullish forces are in control. Specifically, the RSI has flatlined just shy of the 70-overbought mark, while the MACD is holding above its red signal line in the positive territory.
If bullish pressures persist, the price needs to initially claim the recent rejection region of 142.24. Piercing through that wall, the pair could ascend towards the September high of 145.89 before the 148.80 hurdle gets tested. A break above the latter might pave the way for the 32-year high of 151.94.
Alternatively, should the uptrend lose steam and the price reverse lower, the recent resistance of 140.90 could serve as initial support. If that floor collapses, the bears might aim for the June low of 138.42 before the spotlight turns to 137.90. Further declines could then come to a halt at the 135.51 territory.
Overall, USDJPY has been stuck in a steep uptrend, but the price is approaching overbought conditions as it has been trading above its upper Bollinger band for the past few sessions. However, the recent completion of a golden cross between the 50-day simple moving average (SMA) and the 200-day SMA could enable the pair to extend its advance.
EUR/USD Corrects Gains While USD/CHF Aims Higher
EUR/USD started a decent increase above the 1.0860 resistance. USD/CHF is rising and might aim a move toward the 0.9055 resistance.
Important Takeaways for EUR/USD and USD/CHF Analysis Today
- The Euro gained pace after it broke the 1.0860 resistance against the US Dollar.
- There is a major bullish trend line forming with support near 1.0905 on the hourly chart of EUR/USD at FXOpen.
- USD/CHF is recovering higher above the 0.8945 resistance zone.
- There is a key rising channel forming with support near 0.8970 on the hourly chart at FXOpen.
EUR/USD Technical Analysis
On the hourly chart of EUR/USD at FXOpen, the pair started a decent increase and was able to settle above the 1.0860 resistance zone. The Euro was able to climb further higher above the 1.0920 level against the US Dollar.
Finally, it tested the 1.0970 zone. A high is formed near 1.0970 and the pair is now correcting gains. There was a move below the 23.6% Fib retracement level of the upward move from the 1.0803 swing low to the 1.0970 high.
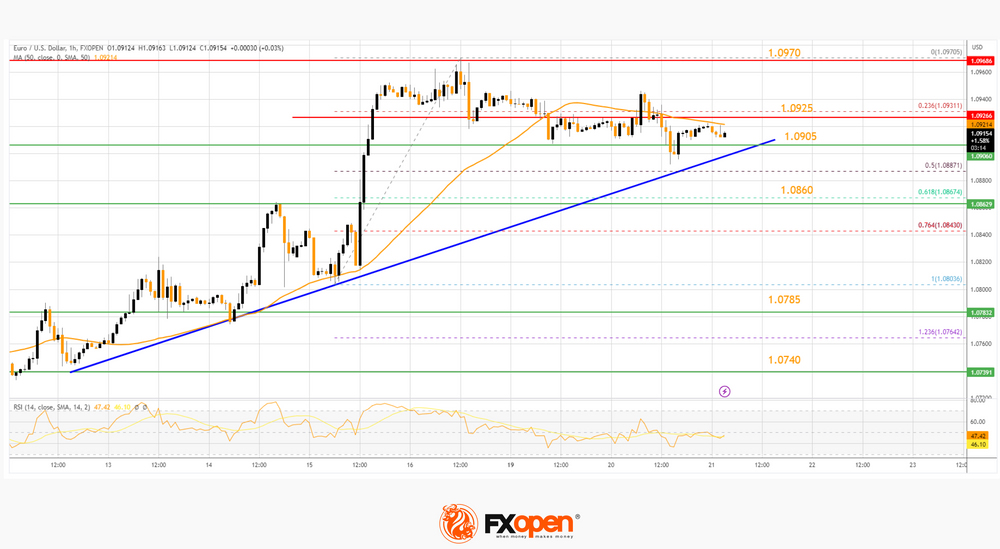
The pair is now trading below the 50-hour simple moving average. However, there is a major bullish trend line forming with support near 1.0905.
The next major support is near the 61.8% Fib retracement level of the upward move from the 1.0803 swing low to the 1.0970 high at 1.0860. A downside break below the 1.0860 support could send the pair toward the 1.0785 level.
Immediate resistance on the EUR/USD chart is near the 50-hour simple moving average at 1.0925. The first major resistance is near the 1.0970 level.
An upside break above the 1.0970 level might send the pair toward the 1.1000 resistance. The next major resistance is near the 1.1040 level. Any more gains might open the doors for a move toward the 1.1080 level.
USD/CHF Technical Analysis
On the hourly chart of USD/CHF at FXOpen, the pair started a decent increase from the 0.8900 support. The US Dollar gained climbed above the 0.8945 resistance zone against the Swiss Franc.
The pair cleared the 50% Fib retracement level of the downward move from the 0.9056 swing high to the 0.8901 low. It is now trading above the 0.8970 level and the 50-hour simple moving average.
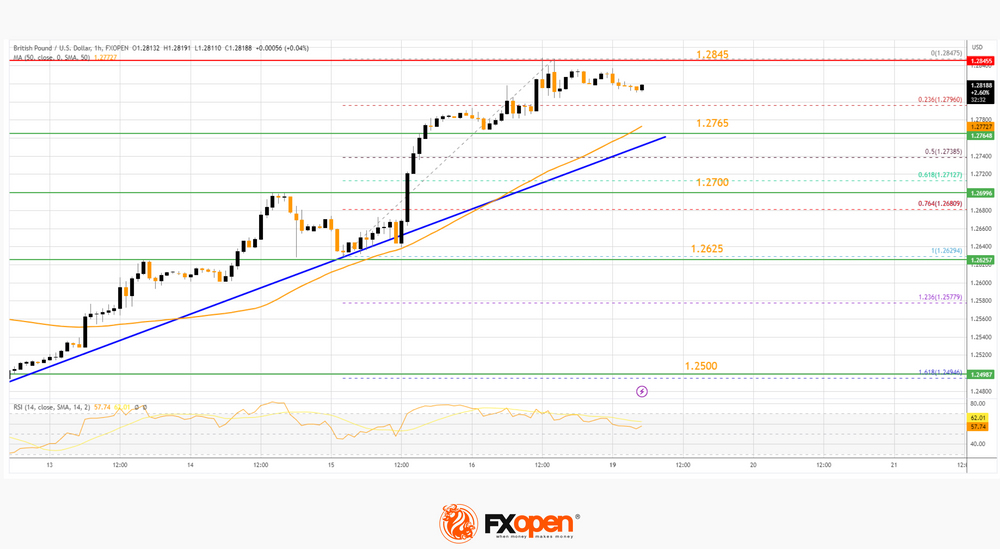
On the upside, the pair is now facing resistance near 0.9000. It is close to the 61.8% Fib retracement level of the downward move from the 0.9056 swing high to the 0.8901 low. The next major resistance is near the 0.9040 level.
If there is a clear break above the 0.9040 resistance zone, the pair could start another increase. In the stated case, it could even surpass 0.9055.
On the downside, immediate support on the USD/CHF chart is near a key rising channel at 0.8970 and the 50-hour simple moving average. The first major support is near the 0.8945 level. The next major support is near the 0.8900 level. Any more losses may possibly open the doors for a move toward the 0.8880 level or even 0.8850 in the coming days.
FTSE 100 on Decline, Reacting to News about Inflation in the UK
CPI (Consumer Price Index) was 8.7% in annual terms (8.4% — forecast, 8.7% last month).
Core CPI (excluding prices for food, energy, tobacco and alcohol) rose to 7.1% in annual terms (6.8% — forecast, 6.8% last month). This is the highest core inflation since 1992.
News of persistently high inflation may have an impact on the decision of the Bank of England on the value of the interest rate, it will be known tomorrow at 14:00 GMT+3. Recall that in the fight against inflation over the past 18 months, the Bank of England raised the rate from 0.1% to 4.5%. A further increase in the rate, according to CNBC, is fraught with the development of a mortgage crisis.
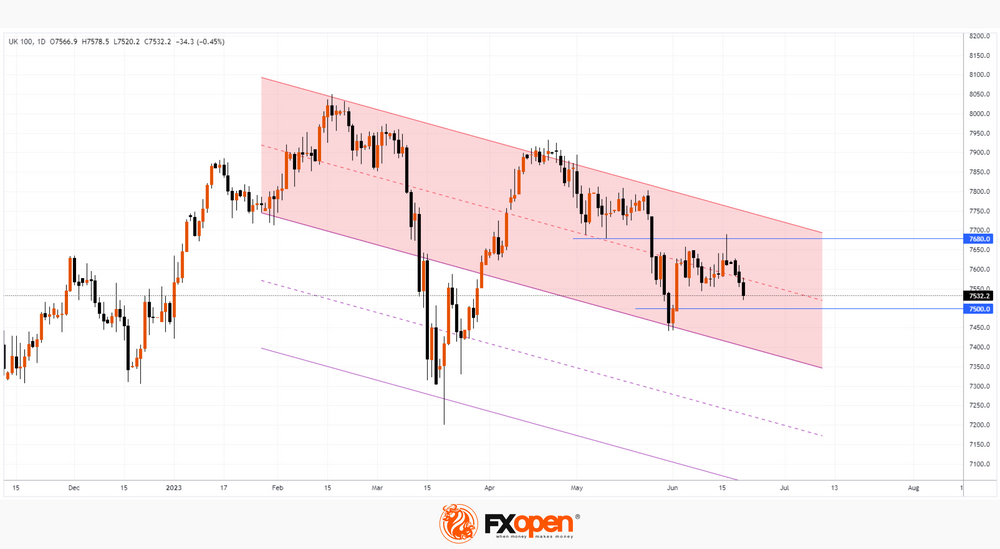
The chart of the FTSE 100 stock index shows negative dynamics. Today, the price of the FTSE 100 fell sharply to the psychological level of 7,500. Note that this happened after testing the level of 7,680, which previously served as support, and now resists the growth of the FTSE 100 index. Perhaps, in conditions of increased volatility against the background of tomorrow's meeting of the Bank of England, the bears will take a new attack on the psychological level 7,500. If successful, the price of the FTSE 100 may drop to the lower line of the descending channel (shown in red).
USD/JPY Technical Analysis
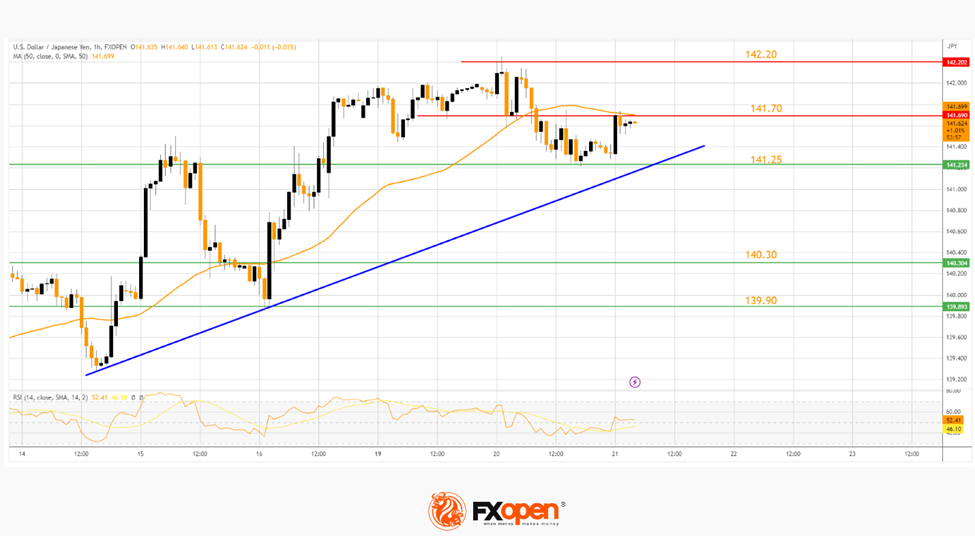
On the hourly chart of USD/JPY at FXOpen, the pair started a fresh increase from the 139.90 support zone. The US Dollar climbed higher above the 141.25 resistance zone against the Japanese Yen.
A high is formed near 142.20 and the pair is now correcting gains. Immediate resistance on the upside is near the 50-hour simple moving average at 141.70. The first major resistance is near the 142.20 level, above which the pair might gain bullish momentum.
The next major resistance is near the 142.80 zone. A clear break above the 142.80 resistance could push the price further higher toward 144.00.
If there is a fresh decline, the pair might find bids near the 141.25 level. The next support sits near the 140.30 zone, below which there is a risk of more downsides toward the 139.90 level.
EUR/USD Daily Outlook
Daily Pivots: (S1) 1.0892; (P) 1.0919; (R1) 1.0945; More...
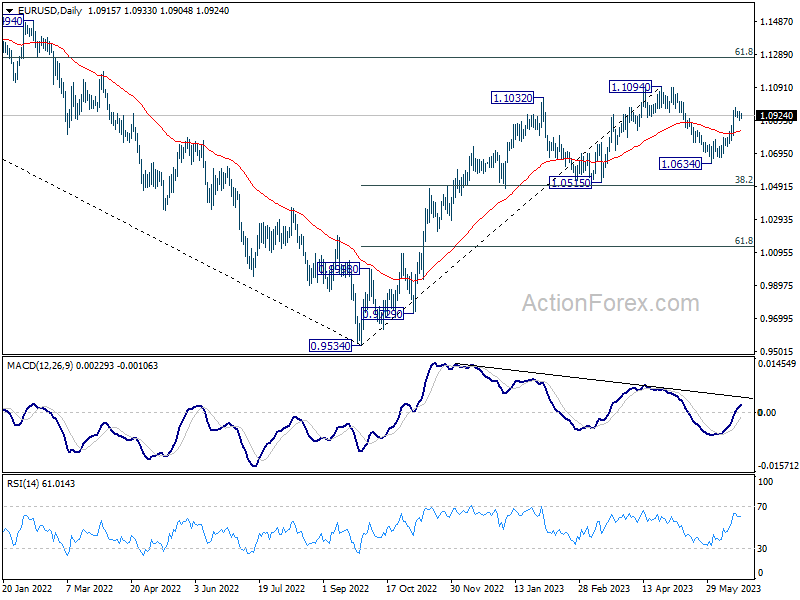
Intraday bias in EUR/USD remains neutral as consolidation from 1.0969 is extending. Further rally is expected as long as 1.0803 support holds. On the upside, above 1.0969 will resume the rise from 1.0634 to retest 1.1094 high. Decisive break there will confirm resumption of whole up trend from 0.9534. However, firm break of 1.0803 will extend the corrective pattern from 1.1094 with another falling leg, targeting 1.0634 and below.
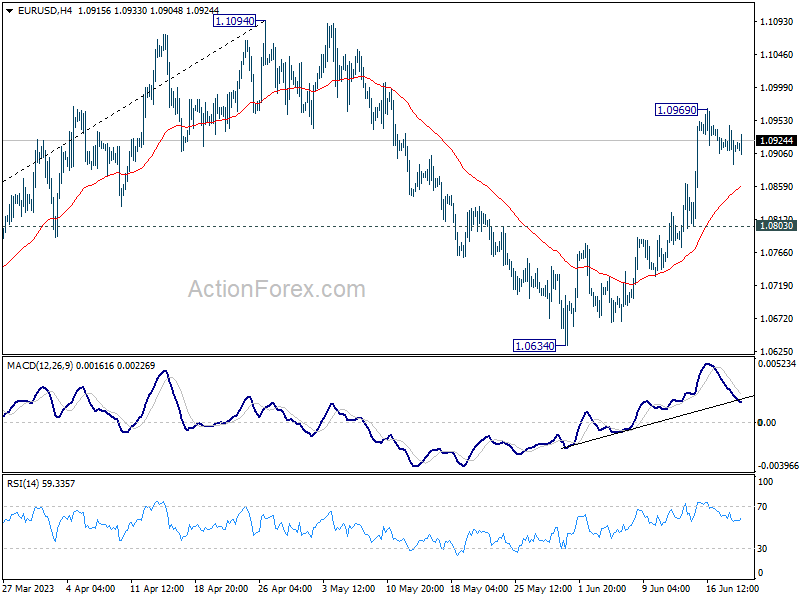
In the bigger picture, as long as 1.0515 support holds, rise from 0.9534 (2022 low) would still extend higher. Sustained break of 61.8% retracement of 1.2348 (2021 high) to 0.9534 at 1.1273 will solidify the case of bullish trend reversal and target 1.2348 resistance next (2021 high).