Sample Category Title
Is BoE Prepared to Step Up Inflation Fight in Light of Another Devastating Inflation Report?
Policymakers at the Bank of England will be scratching their heads this morning wondering what they have to do to get inflation down, with the latest CPI report another setback in the central bank's ambition of delivering price stability and a soft landing.
While there are many reasons to be confident that inflation should fall sharply over the coming months including lower energy and food price contributions, it's hard to be too optimistic when the data keeps consistently coming in well above forecasts.
There is clearly immense stubbornness in the UK inflation numbers and the fact that the core also unexpectedly rose yet again by another 0.3% will be a huge concern to the BoE. Services inflation was always going to take longer to regain control of and today's data once again suggests momentum is strong here.
Market interest rate expectations are continuing to fluctuate after the release but there's clearly now a much stronger case for a 50 basis point hike tomorrow, which would take Bank Rate to 5%. What's more, markets now see it reaching 6% early next year which could be very damaging and increases the risk of the economy buckling under the pressure.
The pound initially spiked after the release, hitting 1.28 against the dollar before giving around half of that back. Higher interest rates for longer against the backdrop of a more resilient economy may remain supportive for the pound for now but as soon as the economy starts to buckle, traders may be forced to rethink.
A very choppy start to the week for Oil prices
Oil prices have been very choppy at the start of the week as traders digest weaker economic prospects against higher Iranian output and a slightly more modest rate cut in China. There are so many moving parts at this stage but at this point in time, there's more negative than positive as far as the crude price is concerned.
Additional supply from Iran is undermining Saudi Arabia's efforts to desperately manipulate prices higher with production cuts. China's recovery is also not taking off as many thought earlier in the year and stimulus efforts have thus far not been as powerful as they could have been. I expect both of these will change in the second half of the year but for now, it's not helping oil prices.
What's more, countries are struggling to rein in inflation - the UK this morning a prime example of that - and that's going to dampen growth and threaten recessions across the globe. This summer was crucial in determining the scale of the job still to do and so far, investors arguably have more cause for pessimism than optimism.
Gold threatening to break lower as UK inflation spikes again
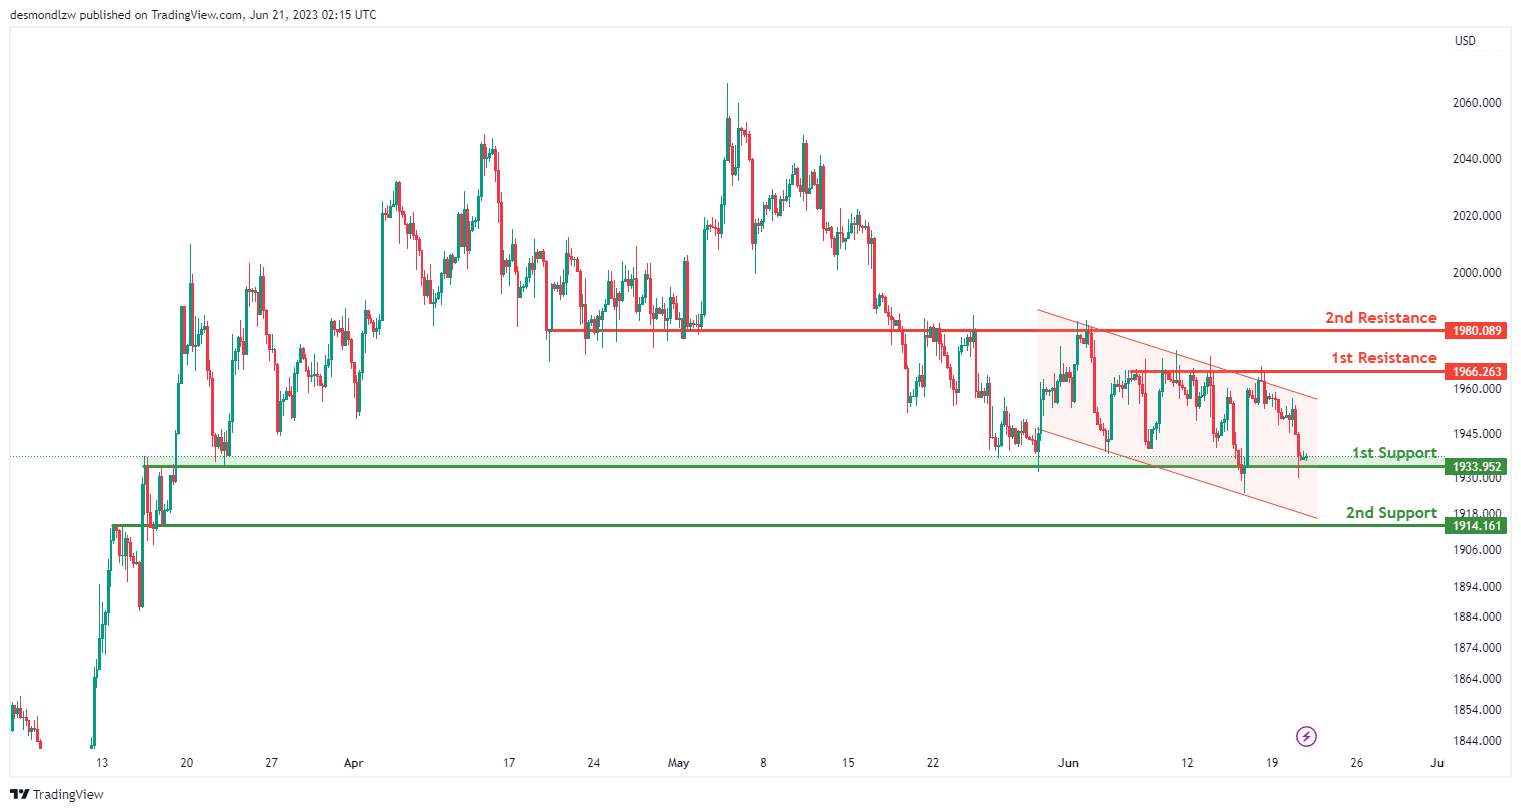
Gold prices came under some pressure on Tuesday, taking the prices back to the lower end of its recent range and even threatening to break below in what could have been a bearish development for the yellow metal.
Gold has broadly traded between $1,940-$1,980 over the last month, very briefly moving outside of this range on a few occasions and the lower boundary is being tested once again this morning. It actually fell below $1,930 yesterday and nearly did the same again this morning so traders will be on high alert for a more substantial breakout to the downside.
Higher yields could be the catalyst for that depending on how traders more broadly respond to this morning's disappointing UK inflation data. Is it a sign of a deeper problem in the global fight against inflation or just UK-specific? The dip after the release suggests the concerns around the former.
USD/CNH: The End of Bullish Trend Expected Near 7.400
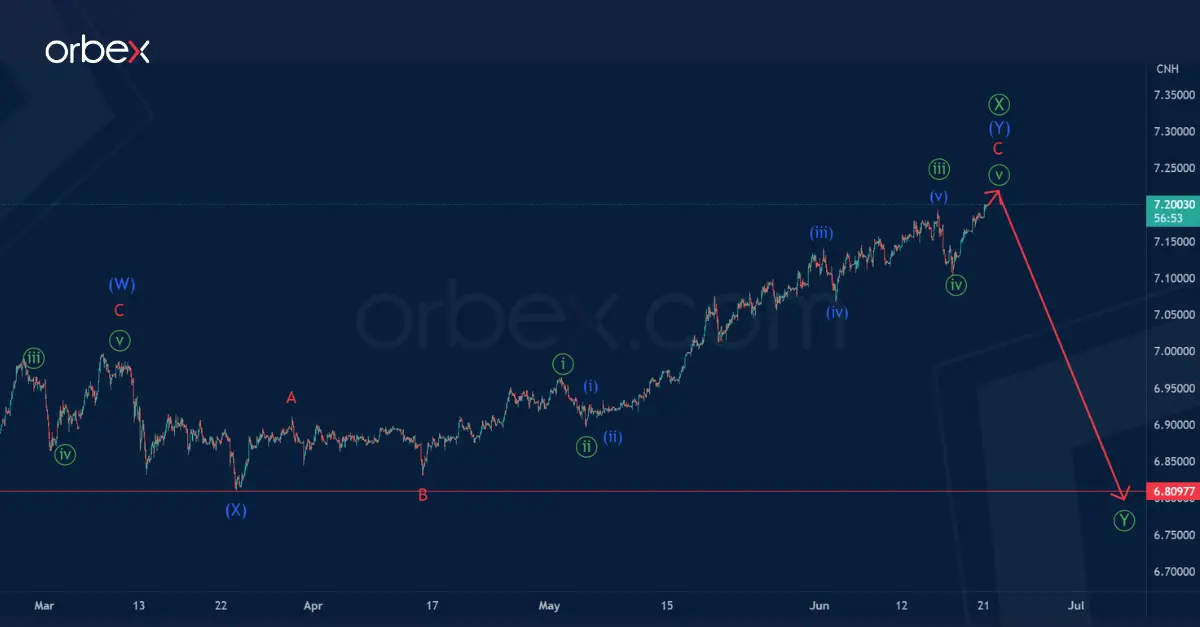
In the long term, the pair may form a bearish double zigzag of the primary degree Ⓦ-Ⓧ-Ⓨ.
On the current chart, we see the internal structure of the intervening wave Ⓧ. Most likely, it takes the form of an intermediate double zigzag, in which the first two parts are completed. That is, the final actionary wave (Y) is under development.
Wave (Y) may end in the form of a standard A-B-C zigzag near 7.400. At that level, third and fifth waves of the minute degree will be equal.
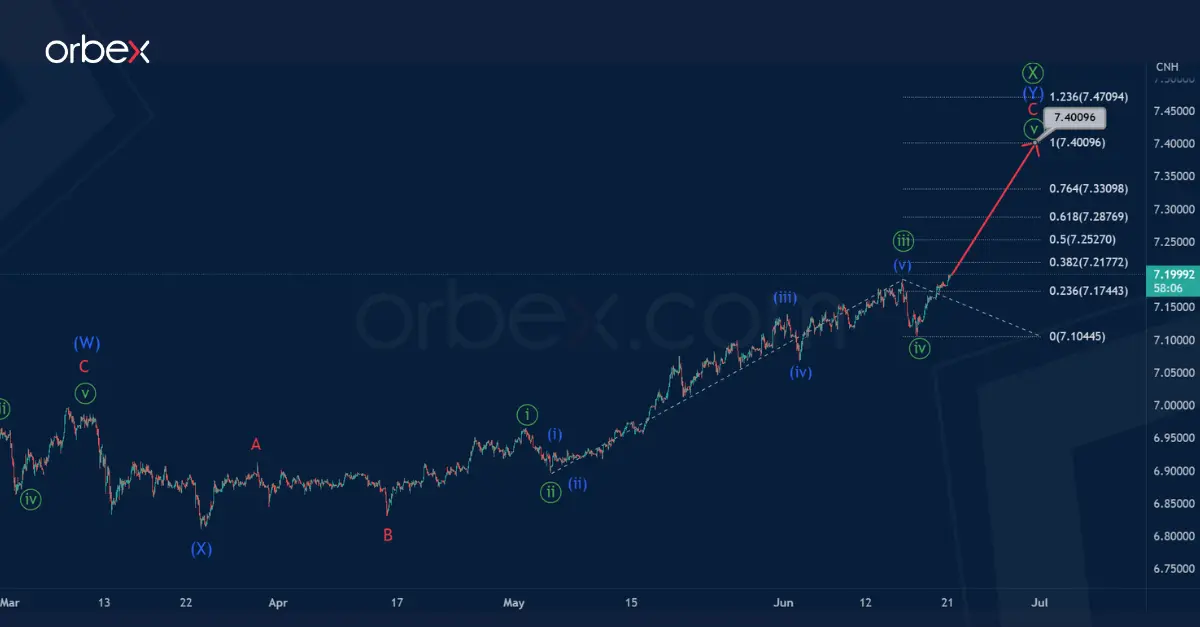
Alternatively, the minute fifth wave may be much shorter than in the main version. In the near future, market participants may observe the completion of this wave and a market reversal.
After the primary intervening wave Ⓧ is completed, we can observe the price drop and the development of the primary actionary wave Ⓨ.
The price, along with the wave Ⓨ going down, may fall to a minimum of 6.809, or even lower.
Gold Struggles to Bounce
AUD/USD pulls back
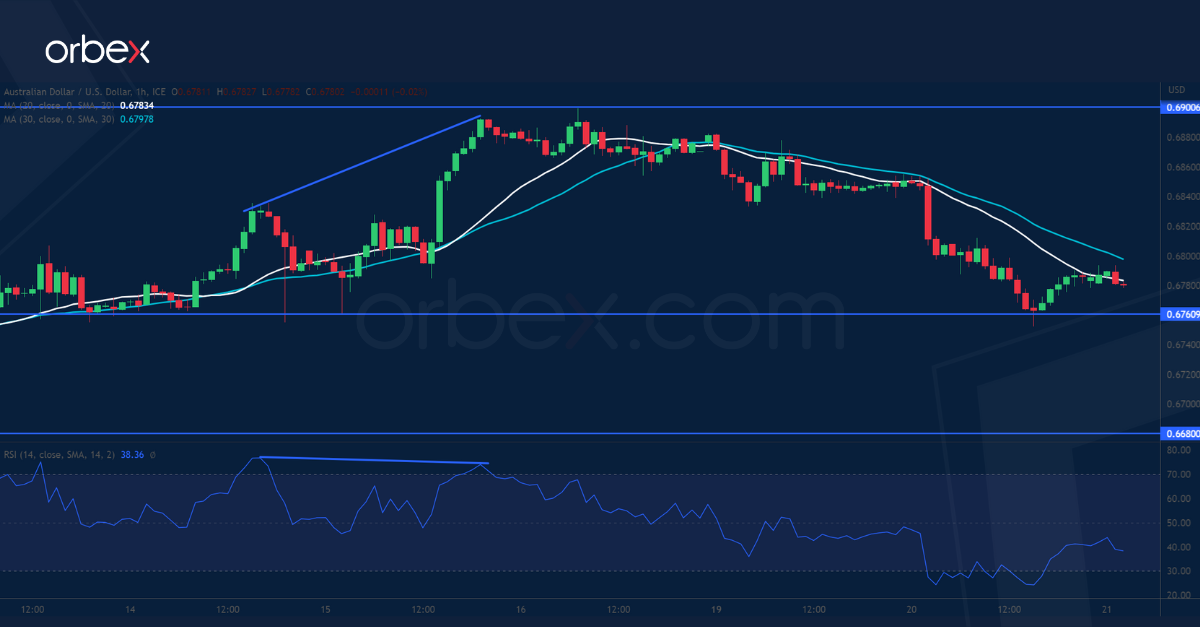
The Australian dollar fell after dovish RBA meeting minutes showed a pause to rate hikes was considered. As the pair hit a four-month high at 0.6900, a bearish RSI divergence showed a loss of momentum in the climb, and short-term buyers’ profit-taking has driven the quote lower. As the RSI dipped into the oversold area, 0.6760 at the base of a breakout rally above the daily resistance of 0.6800 is the first level to expect trend followers’ interests. Further down, 0.6680 on the 20-day SMA would be a second layer of support.
XAU/USD grinds key support
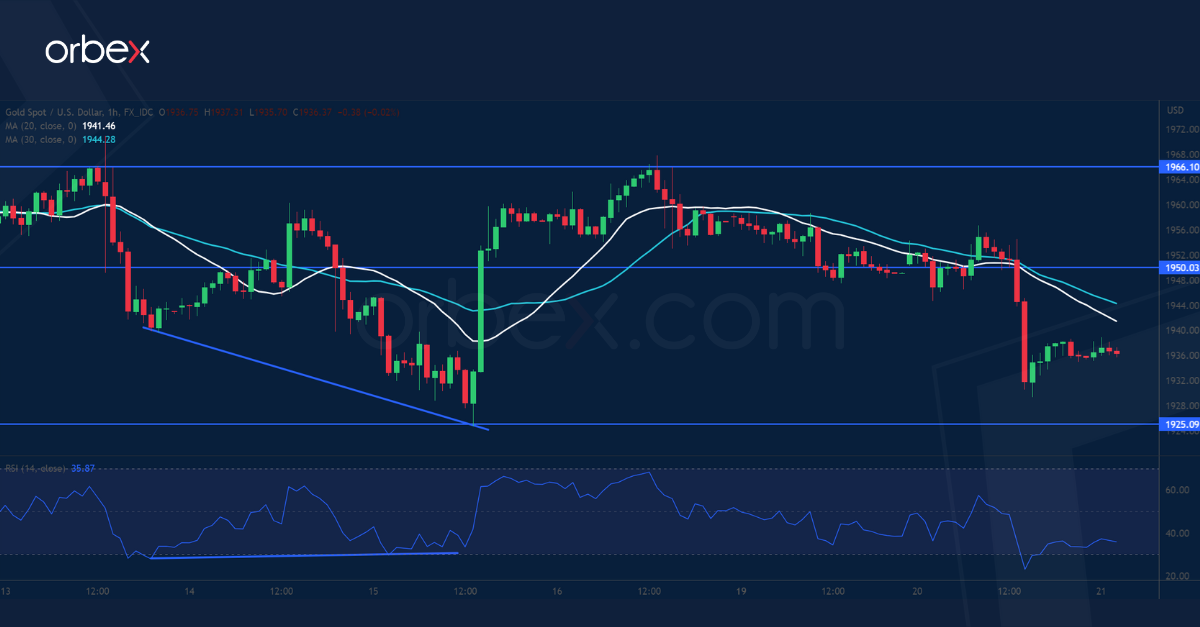
Gold tumbled as a hot US housing market could lead to higher interest rates. On the daily chart, the metal continues to grind lower along a falling 30-day SMA. 1925 at the base of the mid-March breakout rally above the daily resistance of 1950 has met some bids. A bullish RSI divergence suggested a deceleration in the sell-off impetus and a break above 1960 eased some of the pressure. But the bulls will need to lift 1950 then 1966 to make the rebound count. Otherwise, renewed selling may send the price below 1900.
FTSE 100 breaks support
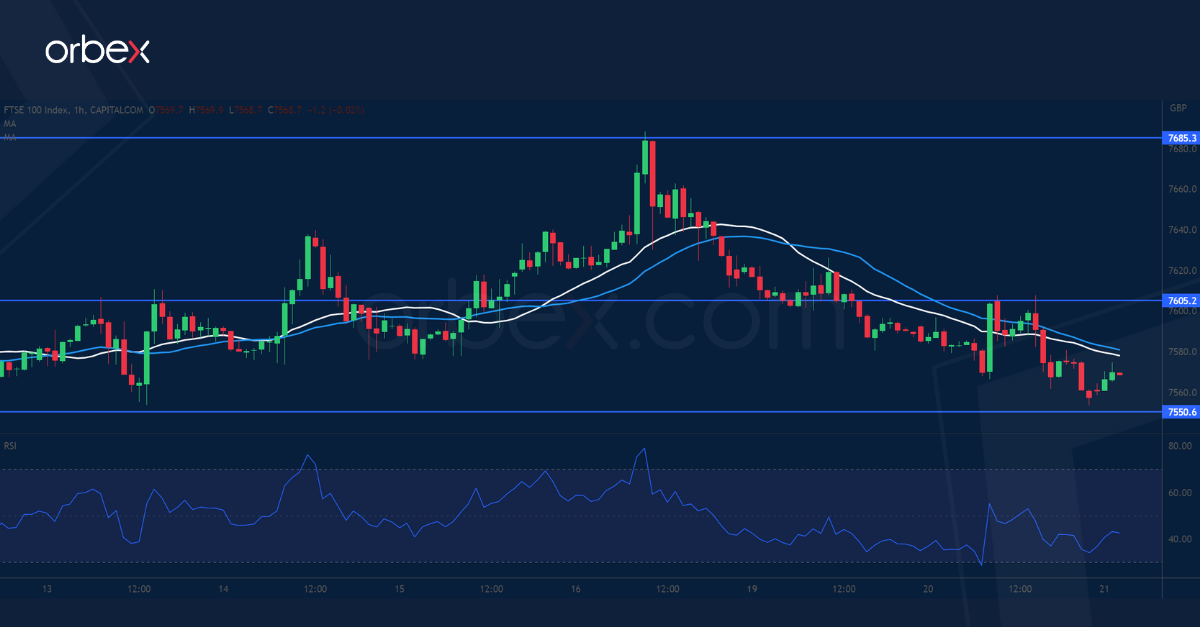
The FTSE 100 retreats as mining and energy stocks struggle amid falling commodity prices. The price could barely hold onto its latest gains above 7650 which coincides with the 30-day SMA, and a drift below 7620 then 7580 has dented the bullish momentum. 7550 on the lower band of last week’s consolidation range is a key level to keep the index up as its breach would cause a deeper correction to 7480 right next to the origin of the current rebound. The bulls will need to clear 7605 to put the index back on track.
Focus is on Fed Powell’s Testimony
Markets
The natural upside drift in yields since last week’s-FED/ECB-meetings ran into resistance yesterday. Disappointment on a smaller than expected reduction in the Chinese prime loan rates and softer than expected German May producer prices (1.4% M/M and 1% Y/Y) were mentioned as a potential driver for the setback in yields. Looking at the intraday price pattern, we’ re not fully convinced on this explanation. Whatever the reason, both yields and stocks were ripe for some repositioning, with UK markets taking the lead after their recent impressive jump in yields. UK yields dropped between 17.6 bps (2-y) and 10.3 bps (30-y). European bonds also rebounded with yields easing between 11 bps (10 & 30y) and 5.3 bps (2-y). The public debate between doves and hawks within the ECB continues. On the dovish side of the ECB-spectrum, Villeroy advocated that inflation in the EMU (and in France) is past its peak and the ECB completed most of its rate hike path. Interesting, he also said that the duration of keeping the terminal rate is more important than specific level to be reached. So, even more dovish oriented ECB members still embrace the higher-for-longer idea. US yields opened higher in Asia/Europe after the long weekend, but were soon captured in the global correction. Very strong US housing data (permits and housing starts) only caused a brief interruption to the bond rebound/risk-off correction. US yields at the end of the day ceded between 2.9 bps (2-y) and 4.1 bps (10 & 30-y). US equities also fell prey to modest profit taking (Dow -0.71%, Nasdaq -0.16%). On FX markets the dollar initially was better bid, but couldn’t maintain gains. DXY closed marginally stronger at 102.54. EUR/USD finished little changed at 1.0918. The yen (temporary) regained some ground after the recent setback (USD/JPY 141.47 from 142+).
Asian equities mostly continue yesterday’s correction this morning, with China underperforming and Japan the exception to the rule. The yuan eases further (USD/CNY 7.194). The yen can’t hold on to yesterday’s ‘gain’ (USD/JPY 141,75). Later today, the focus is on Powell’s testimony before the House Financial Services Panel. He can do no other but defend to last week’s hawkish ‘skip’, including the dots showing the MPC preference for two additional rate hikes (peak seen at 5.5%/5.75%). Money markets post-Fed remain very cautious to discount further hikes beyond July. We doubt the Fed-chair will be able to change this wait-and-see bias today. This morning, UK inflation (May) again printed higher than expected. Headline inflation rose 0.7% M/M leaving the Y/Y measure at 8.7%. Core inflation even accelerated further to 7.1% from 6.8%. Sterling gains modestly after the data (EUR/GBP 0.854).
News and views
The European Commission seeks an additional €66bn from member states for the bloc’s budget. The request follows an overhaul of the 2020-2027 budget framework for the upcoming four-year period (2024-2027). The funds are to cover unforeseen expenses that surpass existing build-in buffers due to rising interest costs, migration and commitments to support Ukraine during the war. For the latter, the EC created a new package totaling €50bn through 2027. Migration is expected to cost an additional €15bn. Borrowing costs at the time EU NextGen was created were estimated around €15 bn for 2021-2027. But that analysis was based on interest rates in the past years and imply a return to average levels by the end of the period from 0% to a mere 1.2%. For next year alone, Budget Commissioner Hahn said interest payments would double to about €4bn. The EC’s request has drawn a backlash from more frugal member states including The Netherlands and Germany, demanding more discipline instead.
China’s top three securities newspapers citing analysts said China is likely to cut the reserve requirement ratio and other interest rates further this year. The concerted reporting follows the unexpected rate cut by the PBOC last week but which is unlikely to be enough to jolt a stalling economy. Calls are also growing for targeted fiscal support alongside easier monetary policy. To that end, China this morning extended tax breaks for consumers buying electric vehicles. The wavering of a 10% sales tax on new clean cars has been in place since 2014 and was recently extended through 2023. Today’s announcement pushes that date forward to 2025 and even 2027 for the lower-budget cars.
BoJ Ueda: Will patiently maintain easy monetary policy
In his address to the annual trust association's meeting, BoJ Governor Kazuo Ueda highlighted the central bank's commitment to maintaining accommodative monetary policy. According to Ueda, BoJ "will patiently maintain an easy monetary policy to stably and sustainably achieve the 2% price target accompanied by wage growth."
Governor Ueda provided a cautiously optimistic outlook for Japan's economy, describing it as "picking up" and likely to "recover moderately." In terms of inflation, he reiterated the expectation of slowdown in Japan's consumer inflation towards the middle of the current fiscal year.
Ueda also offered reassurances about the stability of Japan's financial system, noting it was "stable as a whole." Despite recent failures of several US banks, Ueda claimed the impact on Japan's financial system was limited.
GBP/JPY Daily Outlook
Daily Pivots: (S1) 179.62; (P) 180.85; (R1) 181.78; More...
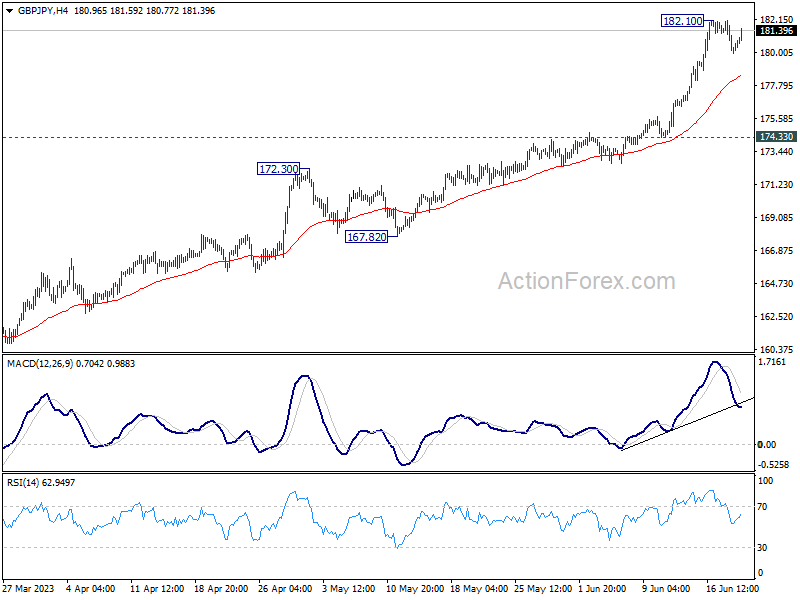
GBP/JPY recovers notably today but stays below 182.10 temporary top. Intraday bias stays neutral first and more consolidations could be seen. But downside of retreat should be contained above 174.33 to bring another rally. Break of 182.10 will resume larger up trend to 138.2% projection of 148.93 to 172.11 from 155.33 at 187.36.
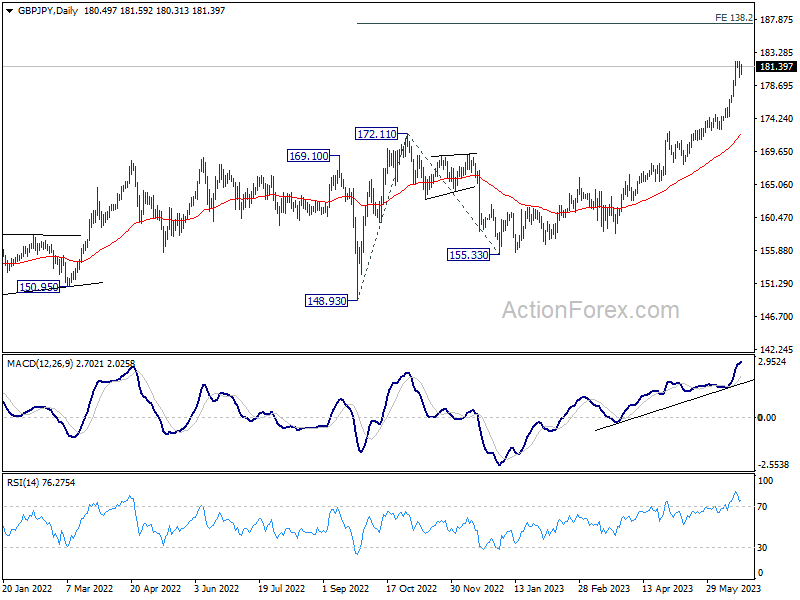
In the bigger picture, up trend from 123.94 (2020 low) is extending. Next target is 195.86 (2015 high). For now, medium term outlook will remain bullish as long as 172.11 resistance turned support holds, even in case of deep pull back.
Sterling Buoyed by CPI Data, Yet Moment Restrained ahead of Fed Powell
Sterling is given a boost in the wake of latest CPI data, which indicated a steady headline inflation rate and a further acceleration in core inflation. This data is likely to solidify BoE's case for a rate hike in tomorrow's meeting. However, how long this tightening phase will continue remains uncertain. Notably, the Pound's buying momentum is presently restrained, and the wider currency market appears to be operating within the confines of yesterday's range.
As we approach the halfway mark for the week, Dollar and Yen appear to be the slightly stronger ones, as they digest their recent steep losses. However, neither currency has displayed clear reversal sign yet. Direction for the remainder of the week could hinge on Fed Chair Jerome Powell's testimony today and tomorrow, and its subsequent impact on the broader financial market. Australian and New Zealand Dollars are underperforming, as they consolidate their recent gains. European majors are mixed in anticipation of the upcoming rate decisions by BoE and SNB tomorrow.
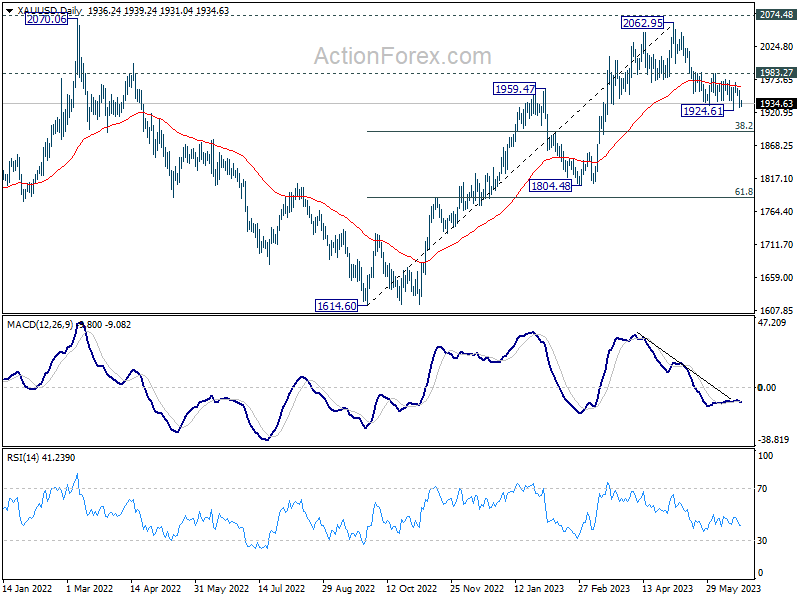
Technically, Gold continues to be a point of attention, as it weakened notably after recovery from 1924.61 was capped by 55 D EMA, and well below 1983.27 resistance. Break of 1924.16 support will resume the fall from 2062.95 to 38.2% retracement of 1614.60 to 2062.95 at 1891.68. Nevertheless, break of 1983.27 will suggest that correction from 2062.95 has completed, and prompt stronger rally back towards this high. As usual, Gold's next move will be closely watched as an indication or confirmation of Dollar's trajectory.
In Asia, Nikkei rose 0.56%. Hong Kong HSI is down -2.08%. China Shanghai SSE is down -1.10%. Singapore Strait Times is up 0.24%. Japan 10-year JGB yield dropped another -0.0092 to 0.381. Overnight, DOW dropped -0.72%. S&P 500 dropped -0.47%. NASDAQ dropped -0.16%. 10-year yield dropped -0.0040 to 3.729.
UK CPI unchanged at 8.7% yoy in May, core CPI rose to 7.1% yoy
UK annual CPI was unchanged at 8.7% yoy in May, above expectation of 8.5% yoy. Core CPI (excluding energy, food, alcohol and tobacco) accelerated to 7.1% yoy, up from prior month's 6.8% yoy, and the highest rate since March 1992. CPI goods eased from 10.0% yoy to 9.7% yoy. But CPI services rose from 6.9% yoy to 7.4% yoy. For the month, CPI rose 0.7% mom, slowed from April's 1.2% mom, but was well above expectation of 0.4% mom.
Also released. RPI ticked down from 11.4% yoy to 11.3% yoy, above expectation of 11.1% yoy. PPI input came in at -1.5% mom, 0.5% yoy, versus expectation of -0.6% mom, 1.2% yoy. PPI output was at -0.5% mom, 2.9% yoy, versus expectation of -0.1% mom, 3.6% yoy. PPI output core was at -0.3% mom, 4.1% yoy, versus expectation of 0.1% mom, 4.7% yoy.
BoJ Adachi: Appropriate to continue monetary easing with YCC
BoJ board member Seiji Adachi voiced support for continued monetary easing amid a climate of significant uncertainty regarding price outlook. Adachi relayed these views during a discussion with business leaders in Kagoshima.
Adachi said, "My view is that it's appropriate to continue monetary easing with the yield curve control framework." He added, "The shape of the yield curve has become smooth overall and there is improvement in market functioning."
"Amid huge uncertainty over the price outlook, there are upside and downside risks. In the long run, however, the downside risks appear to be larger," he warned. These risks, according to Adachi, must be carefully considered when deciding on changes to monetary policy.
Adachi also noted an interesting shift in public's perception of inflation, suggesting that Japan's long-standing deflationary mindset is starting to change. "We're seeing some changes in the public's deflationary mindset, or the perception that prices won't rise," he said.
"In a sense, we're moving closer to achieving our price target. But there's high uncertainty over our baseline inflation outlook, so it's premature to tweak monetary policy," Adachi concluded.
Australia's Westpac leading index fell to -1.09%, weakness to extend into 2024
Australia Westpac Leading Index growth rate fell from -0.78% to -1.09% in May. This is the lowest read of the growth rate since the pandemic. The tenth consecutive negative print for the index. The negative Index growth rates point to below-trend economic growth.
Westpac expects the weakness to extend through 2023 and into 2024. Westpac recently revised down growth forecast 2023 and 2024, from 1% and 1.5% to 0.6% and 1.0% respectively. This weakness in the economy is centred around consumers but also reflects slowing global economy; downturn in dwelling construction; and progressive weakening in labour market.
Regarding RBA policy, Westpac expects the central bank to raise cash rate by a further 0.25% at July 4 meeting. "As we saw at the June Board meeting, we expect that the July meeting will see these considerations of inflation risks again overriding concerns about the poor growth outlook."
Fed nominees Jefferson, Cook and Kugler prioritize tackling inflation
Three nominees for key roles at Fed, including two sitting Fed Governors, have pledged to make tackling inflation their primary concern if their nominations are confirmed. This commitment was made in prepared remarks ahead of confirmation hearings before Senate Banking Committee on Wednesday.
Philip Jefferson, the nominee for vice chair, recognized the multifaceted challenges facing the economy including inflation, banking-sector stress, and geopolitical instability. Jefferson said, "The Federal Reserve must remain attentive to them all. Inflation has started to abate, and I remain focused on returning it to our 2 percent target."
Lisa Cook, who is nominated for a new 14-year term, echoed Jefferson's concerns about inflation. She stated, "The American economy is at a critical juncture, and it will be essential for the FOMC to act as needed to bring inflation back to our 2% inflation target."
Adriana Kugler, the nominee chosen by President Joe Biden to fill the vacancy left by Lael Brainard earlier this year, reiterated the same sentiment. Kugler emphasized, "If confirmed, I am deeply committed to setting monetary policy to reduce inflation and promote maximum employment, and to foster the resilience of the financial sector to support job creation and economic growth."
Looking ahead
Canada will release retail sales and new housing price index. Fed Chair Jerome Powell's two-day congressional testimony will start today too.
GBP/JPY Daily Outlook
Daily Pivots: (S1) 179.62; (P) 180.85; (R1) 181.78; More...
GBP/JPY recovers notably today but stays below 182.10 temporary top. Intraday bias stays neutral first and more consolidations could be seen. But downside of retreat should be contained above 174.33 to bring another rally. Break of 182.10 will resume larger up trend to 138.2% projection of 148.93 to 172.11 from 155.33 at 187.36.
In the bigger picture, up trend from 123.94 (2020 low) is extending. Next target is 195.86 (2015 high). For now, medium term outlook will remain bullish as long as 172.11 resistance turned support holds, even in case of deep pull back.
Economic Indicators Update
| GMT | Ccy | Events | Actual | Forecast | Previous | Revised |
|---|---|---|---|---|---|---|
| 23:50 | JPY | BoJ Minutes | -0.30% | |||
| 00:30 | AUD | Westpac Leading Index M/M May | -0.03% | |||
| 06:00 | GBP | CPI M/M May | 0.70% | 0.40% | 1.20% | |
| 06:00 | GBP | CPI Y/Y May | 8.70% | 8.50% | 8.70% | |
| 06:00 | GBP | Core CPI Y/Y May | 7.10% | 6.80% | 6.80% | |
| 06:00 | GBP | RPI M/M May | 0.70% | 0.50% | 1.50% | |
| 06:00 | GBP | RPI Y/Y May | 11.30% | 11.10% | 11.40% | |
| 06:00 | GBP | PPI Input M/M May | -1.50% | -0.60% | -0.30% | 0.10% |
| 06:00 | GBP | PPI Input Y/Y May | 0.50% | 1.20% | 3.90% | 4.20% |
| 06:00 | GBP | PPI Output M/M May | -0.50% | -0.10% | 0.00% | -0.2% |
| 06:00 | GBP | PPI Output Y/Y May | 2.9% | 3.60% | 5.40% | 5.20% |
| 06:00 | GBP | PPI Core Output M/M May | -0.30% | 0.10% | 0.00% | |
| 06:00 | GBP | PPI Core Output Y/Y May | 4.10% | 4.70% | 6.00% | |
| 06:00 | GBP | Public Sector Net Borrowing (GBP) May | 19.2B | 20.3B | 24.7B | |
| 12:30 | CAD | New Housing Price Index M/M May | 0.00% | -0.10% | ||
| 12:30 | CAD | Retail Sales M/M Apr | 0.30% | -1.40% | ||
| 12:30 | CAD | Retail Sales ex Autos M/M Apr | 0.30% | -0.30% |
British Inflation Doesn’t Ease
Risk takers are not out dancing on the Wall Street this week before the Federal Reserve (Fed) President Powell’s semiannual congressional testimony scheduled for today and tomorrow. Equities are down, oil is down, sovereign bonds are up. And the rally in equities versus a selloff in sovereign bonds is a pattern that we have been seeing since the rebound following the mini banking crisis, and the correlation between stocks and sovereign bonds are reestablished, again, after last year’s visit to the positive territory. This – the return of negative equity-bond correlation - is what we expected to happen this year, but for the exact opposite reason. We were expecting the sovereign bonds to recover, as the US was supposed to be in recession by now, whereas the sovereign bonds were supposed to find buyers as a result of softening, and even reversing Fed policy. But none of it happened. Equities rallied, the Fed became more aggressive on tightening its monetary policy, and now the American housing market starts printing surprisingly positive data, with housing starts and building permits flashing strong figures for May, defying the rising mortgage rates in the US due to the rising Fed rates. I mean housing starts jumped more than 20% in May, but loans for residential real estate slumped. We no longer know what to do with this data, and that’s a cause for concern per se… not understanding the data.
What we know and understand very well, however, is, a strong housing market and tight jobs market will encourage Fed to hike more, and encourage other central banks to do more, as well. But not everyone is as lucky as Powell, because in Britain, the skyrocketing mortgage rates are turning into a serious headache that no one can solve for now. The UK home-loan approvals have been dropping after a post-pandemic peak, the refinancing costs took a lift, and political dispute is gaining momentum with Liberal Democrats asking for a £3 billion mortgage protection package to help people keep their homes, and their mortgages, while Jeremy Hunt says there is no money in the coffers for such fiscal support. The 2-year gilt yield slid below 5% yesterday, as a result of a broad-based flight to safer sovereign bonds, but the relief will likely remain short-lived and the outlook for Gilt market will likely remain negative with further, and significant rate hikes seen on the BoE’s horizon. Released this morning, the British inflation was expected to ease from 8.7% to 8.4% but did not ease… while core inflation unexpectedly jumped past the 7% mark again. These numbers warn that inflationary pressures in the UK are not under control and call for further rate hikes which will further squeeze the British households, without a guarantee of easing inflation. We will see what the BoE will do and say tomorrow, but we know that they now have a few doubts regarding the reliability of their inflation model which was pointing at a steep fall in H2 this year – a scenario that is unlikely to happen. Cable jumped past the 1.28 mark following the inflation data, then rapidly fell back to the pre-data levels. The short-term direction will depend on a broad US dollar appetite, yet the medium-term outlook for the pound-dollar remains positive on the back of more hawkish BoE expectations, compared to the Fed’s, and an advance toward the 1.30 is well possible, especially if the dollar appetite remains soft.
In the US, profit taking and flight to safety before Powell’s testimony sent the S&P500 and Nasdaq stocks lower yesterday. The S&P500 slipped below the 4400 mark, while Nasdaq 100 tipped a toe below the 15000 mark but closed above this level.
The US dollar index traded higher for the 3rd session and is now testing the 50-DMA to the upside, while gold pushed below the 100-DMA as rising US yields and stronger dollar weigh on appetite for non-interest-bearing gold.
Yet, any hawkishness from Powell’s testimony will likely be tempered by counter-expectation that the Fed may be going too fast too far, and could stop hiking before materializing the two rate hikes they revealed last week in their dot plot. It’s true that the surprising data on housing and jobs front don’t give a respite to the Fed, but a part of it is still believed to be the post-pandemic effect. For housing for example, insufficient number of homes due to the rising WFH demand, the retreat in material costs that exploded during the pandemic and the fading supply chain pressures help to explain why the market is not responding to the skyrocketing mortgage rates. But the risk is there – it’s not even hidden, and the meltdowns tend to happen without telling. I mean, no one could tell that the US regional banks would go bankrupt a week before they did! Anyway, the risks are there, but the resilient eco data hints that Jerome Powell will confidently remain hawkish, and that could lead to some further downside correction in US big stocks which are now in overbought market.
Cautious Sentiment Ahead of Powell Testimony
Market movers today
Focus today turns to Fed Chairman Jerome Powell's semi-annual testimony at 16.00 CET in the House Financial Services Committee.
This morning at 8.00 CET we have UK CPI for May. Consensus is for unchanged core CPI after it jumped to a new cycle high to 6.8% in April from 6.2% in March.
In the Nordics, we have Swedish unemployment out at 8.00 CET while awaiting the Norges Bank meeting tomorrow.
The 60 second overview
Markets: European equity markets broadly declined yesterday as market sentiment remains cautious so far this week. Especially concerns about the health of China's economy seems to weigh on risk appetite. Also in the US, equity markets ended the session lower after the Juneteenth holiday, as all three major indexes fell. This morning, risk-off has continued with Asian markets broadly in red, driven by retreating Chinese tech shares. Futures point to a slight positive open in Europe and a flat US open. Elsewhere, the USD strengthened against most G10 currencies, while EUR/SEK broke through 11.80 for the first time ever and posted a fresh all-time-high. US yields declined moderately across the curve, especially in the long end with 10Y Treasury shedding 3-4bp.
Fed Chairman Powell testimony: The congressional testimony offers Powell a chance to give more guidance on policy in a follow-up to the Fed meeting last week. However, given the short time span between the two events we doubt he will give many new clues. The Fed is data dependent and has a meeting-by-meeting approach so their next decision on 26 July is likely to not least hinge on the next CPI release (12 July) as well as employment report (7 July). Our call is that the Fed is done raising rates.
Equities: Equities were slightly lower on Tuesday. However alike Monday, it was not a clear risk-off session. There was no distinction between cyclicals and defensives, but health care and consumer discretionary faired the best while energy, real estate and utilities plummeted 2-3%. Also, VIX was roughly unchanged at the ultra-low level of 14. Both the US and Europe were down about -0.5%. Futures are unchanged to a tad higher today.
FI: Long yields drifted lower through yesterday's trading session as a reversal of Tuesday's sell-off. Both core countries and peripherals saw the 10y point declining by about 10bp. However, the front end of the curve saw relatively smaller changes throughout the day. As a result, the 2s10s German bond spread reached a new low of -71bp, marking the most inverted curve since 1992. Spreads between Italy and Germany continued widening moderately but still trade close to the tightest levels since the start of the year. In the US, similar to Europe, curve inversion was the theme of the day with rates declining markedly across tenors.
FX: EUR/SEK reached new all-time highs yesterday, briefly break through the 11.80 mark on shaky risk sentiment. In line with SEK, EUR/NOK likewise moved higher throughout yesterday's session. EUR/USD continues this week's moderate decline, hovering around the 1.09 mark. Today, the big market mover for GBP is the May inflation numbers out this morning, the final Tier 1 data release prior to the Bank of England meeting Thursday.
Credit: Credit Markets were relatively stable on Tuesday even as the recent rally in equities began to lose steam. Itrax main widened 0.2bp to close at 76.2bp and Itrax Xover widened 2.2bp to close at 401.3bp. Primary markets were once again fairly active ahead of the summer lull.
Nordic macro
Sweden: Ahead of today's LFS labour market statistics, we have observed continued resilience from, e.g., the PES data which showed that the unemployment rate dropped further in May. LFS data should go in the same direction. The SCB survey will also provide information regarding the employment rate, labour force and hours worked, where the latter is often an early indicator of were the labour market is heading.
Technical Outlook and Review
DXY:
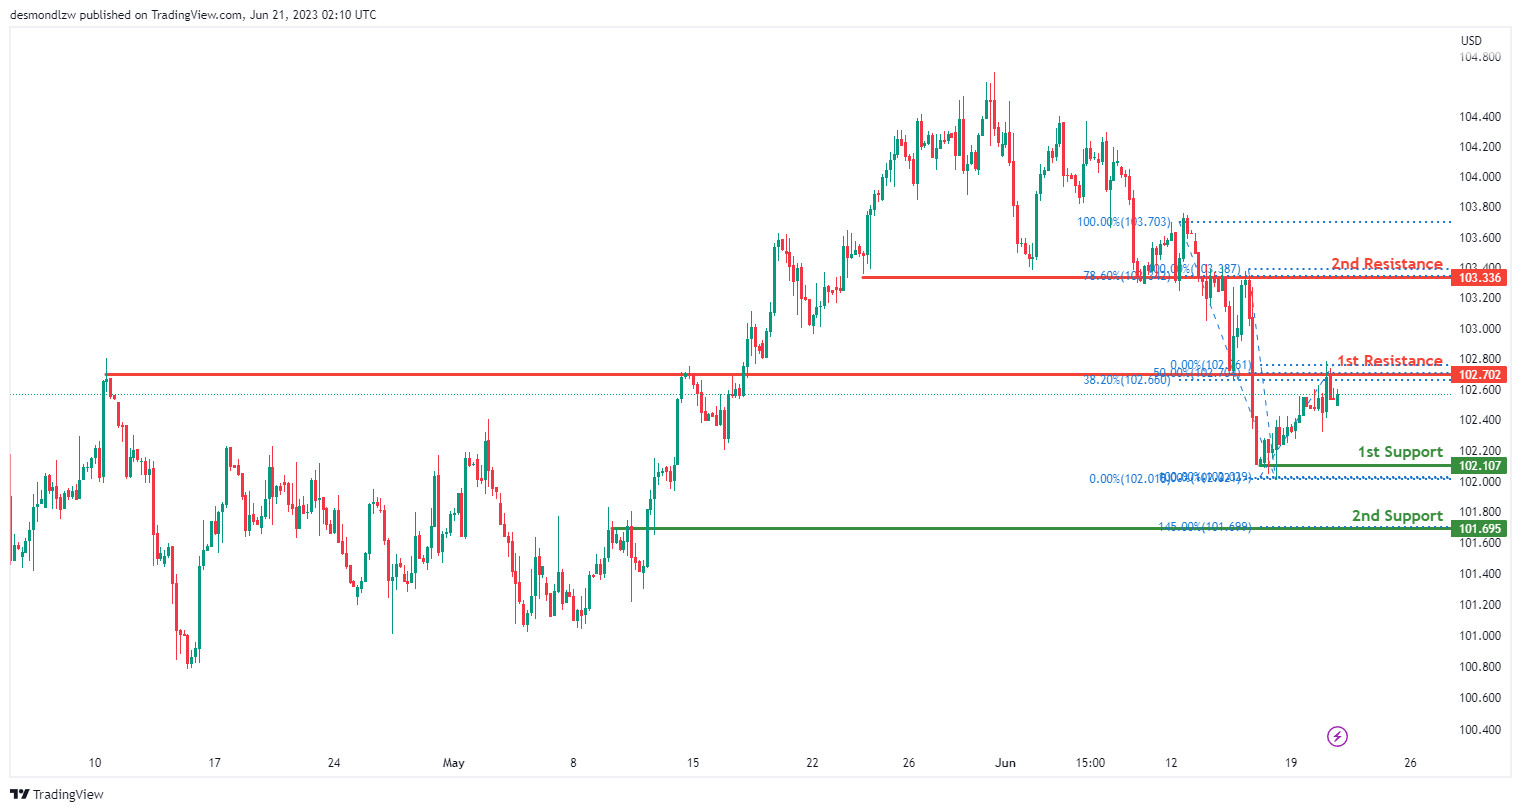
The DXY chart indicates a bearish momentum with the potential for a bearish continuation towards the first support at 102.10, which is a multi-swing low support, and the second support at 101.69, serving as an overlap support and aligning with the 145.00% Fibonacci Extension.
On the upside, the first resistance at 102.70 represents an overlap resistance, coinciding with the 38.20% and 50% Fibonacci Retracement levels, while the second resistance at 1980.08 is also an overlap resistance, aligning with the 78.60% Fibonacci Retracement.
EUR/USD:
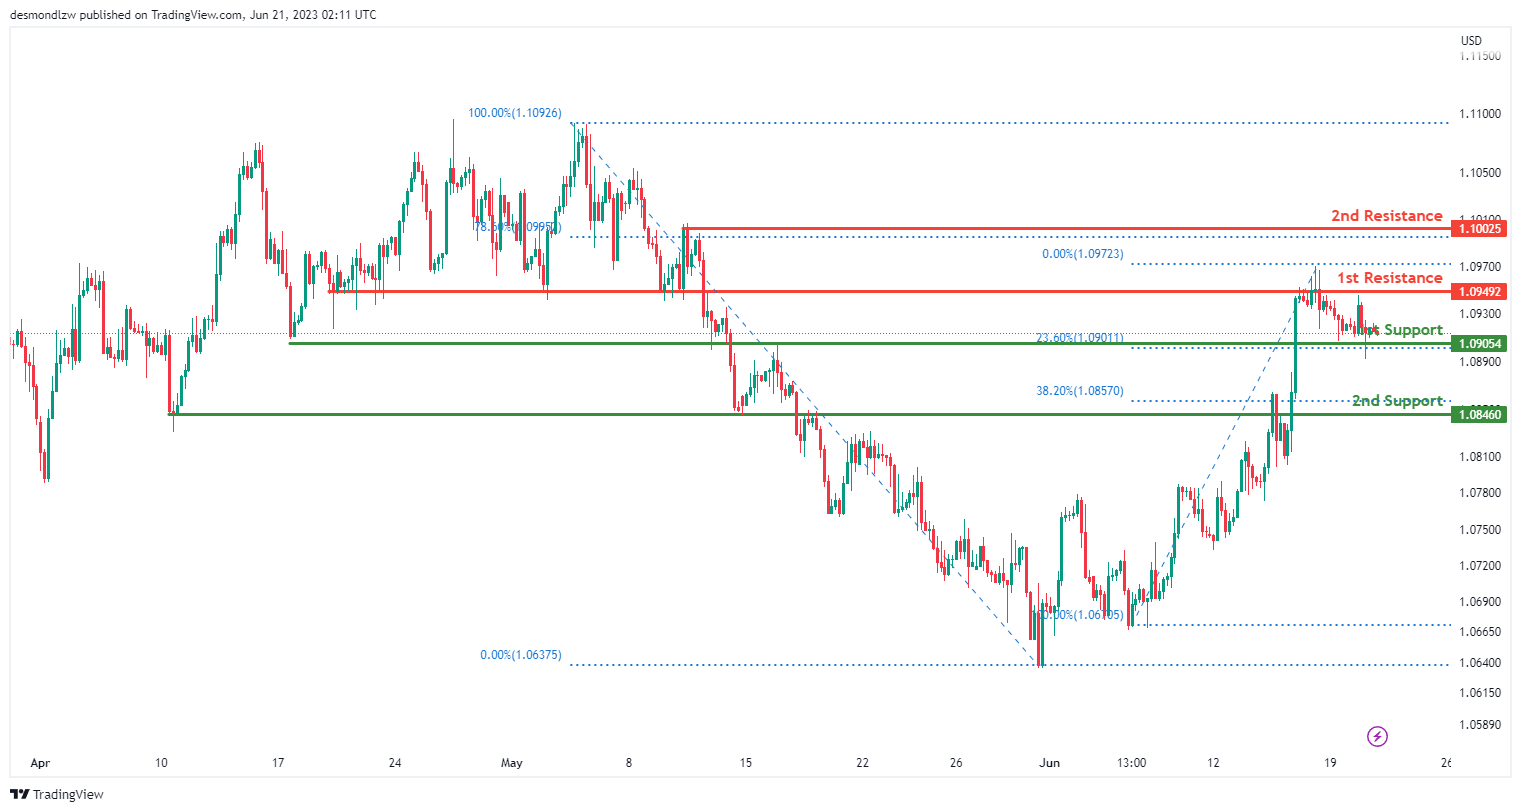
The EUR/USD chart currently exhibits a neutral momentum, suggesting a lack of clear directional bias in the market.
There is a potential for price to fluctuate between the first support level at 1.0905, which is an overlap support and coincides with the 23.60% Fibonacci Retracement, and the second support level at 1.0846, serving as a pullback support and aligning with the 38.20% Fibonacci Retracement.
On the upside, the first resistance at 1.0949 represents an overlap resistance, while the second resistance at 1.1000 acts as a swing high resistance, aligning with the 78.60% Fibonacci Retracement.
GBP/USD:
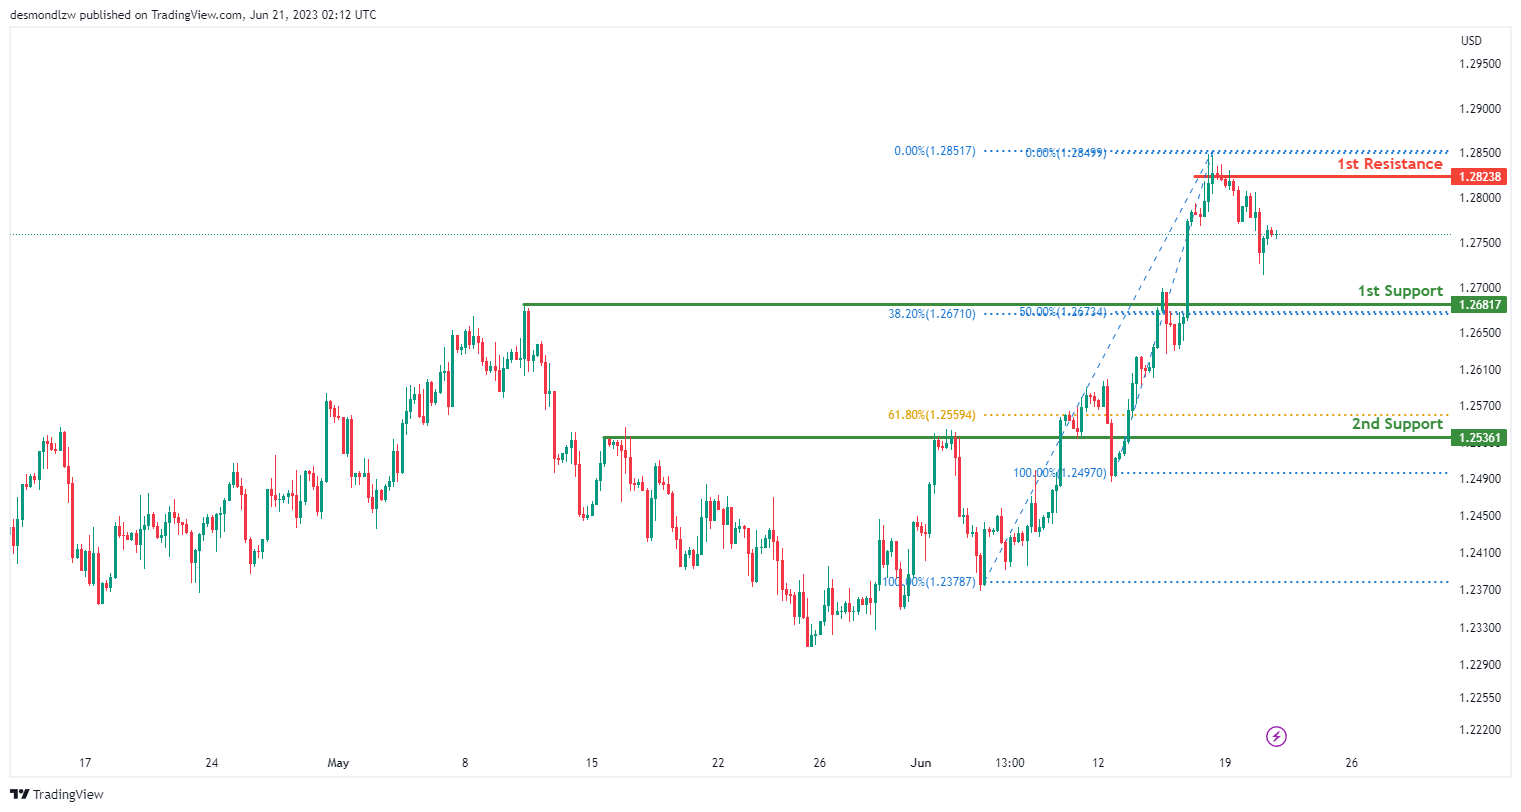
The GBP/USD chart currently demonstrates a bearish momentum, indicating a downward trend in the market.
There is a potential for a bearish continuation towards the first support level at 1.2681, which serves as a pullback support and aligns with both the 38.20% and 50% Fibonacci Retracement levels.
Additionally, the second support level at 1.2536 acts as a pullback support and aligns with the 61.80% Fibonacci Retracement.
On the upside, the first resistance at 1.2823 represents a swing high resistance.
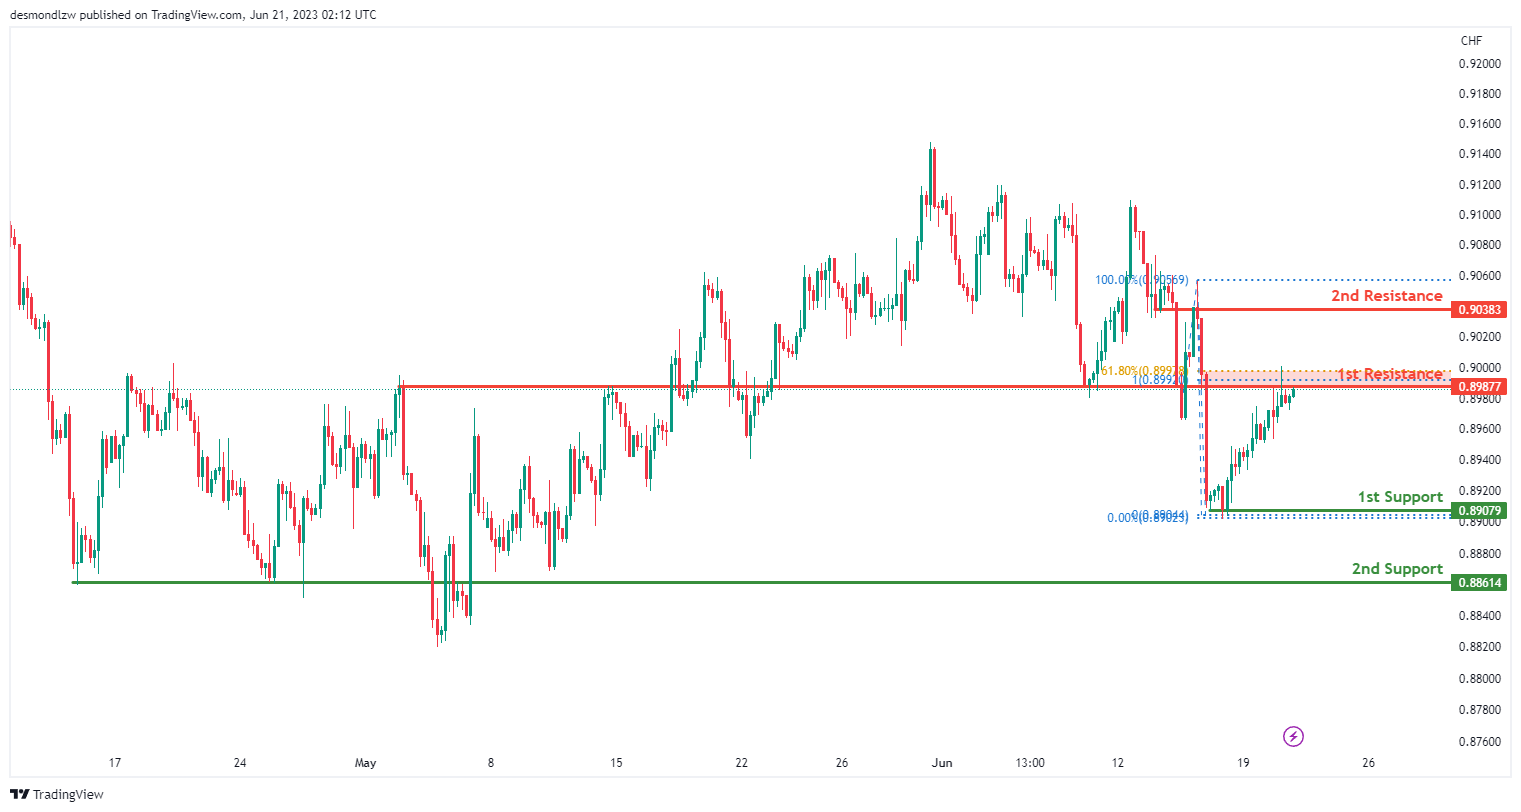
USD/CHF:
The USD/CHF chart currently exhibits a bearish momentum, indicating a downward trend in the market.
There is a potential for a bearish reaction off the first resistance level at 0.8987, which is an overlap resistance and aligns with both the 61.80% Fibonacci Retracement and 100% Fibonacci Projection.
On the downside, the first support level at 0.8907 represents a swing low support, while the second support level at 0.8861 acts as a pullback support.
Additionally, the second resistance level at 0.9038 functions as a pullback resistance.
USD/JPY:
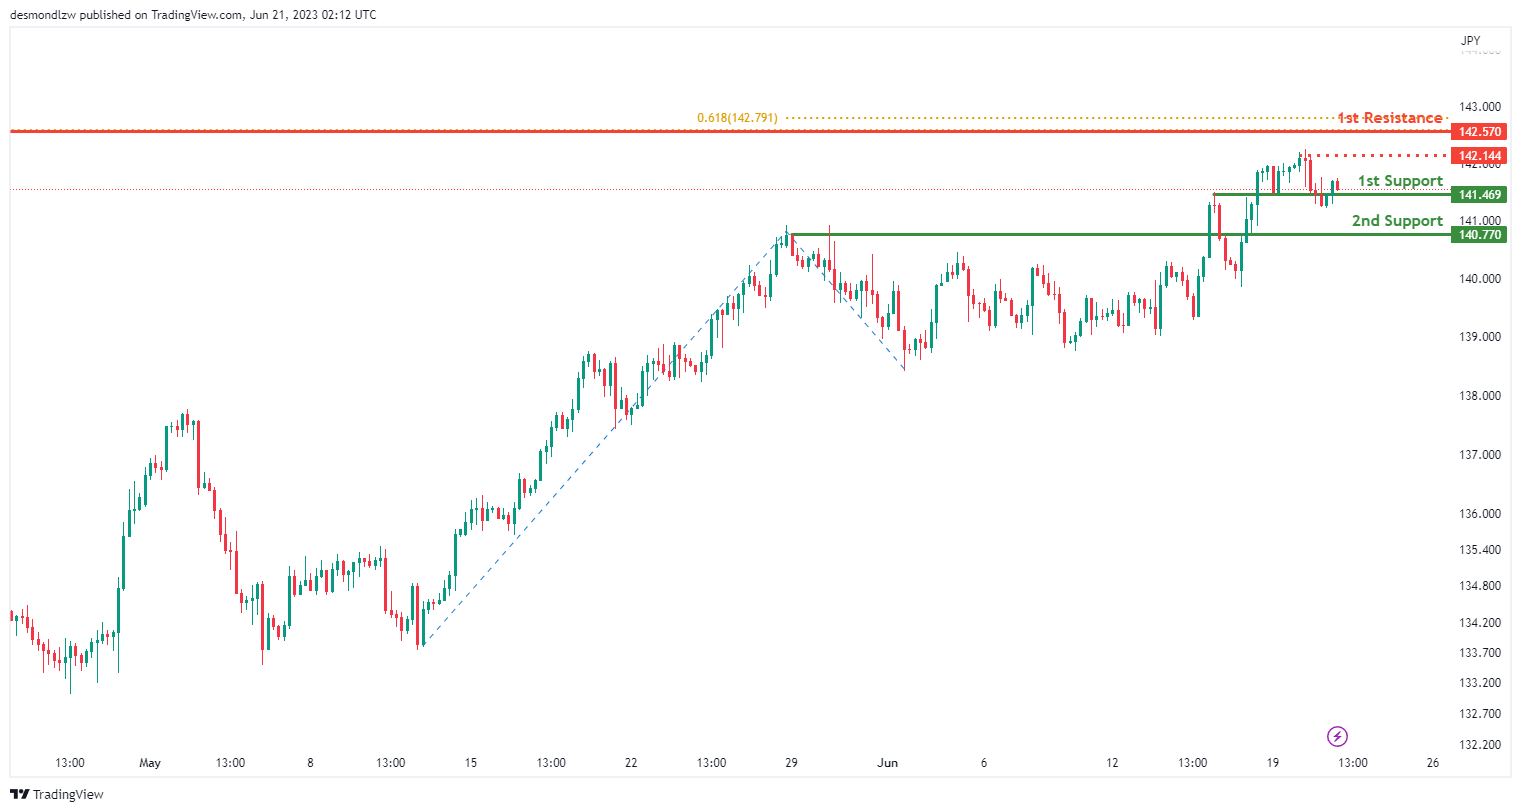
The USD/JPY chart demonstrates a bearish momentum, indicating a downward trend in the market.
There is a possibility of a short-term rise towards the first resistance level at 142.57, followed by a reversal and a drop towards the first support level at 141.46.
The first support at 141.46 is considered significant as it represents an overlap support, while the second support at 140.77 acts as a pullback support.
On the upside, the first resistance level at 142.57 is notable, coinciding with the 61.80% Fibonacci Retracement level. Additionally, the intermediate resistance at 142.20 functions as a swing high resistance.
USD/CAD:
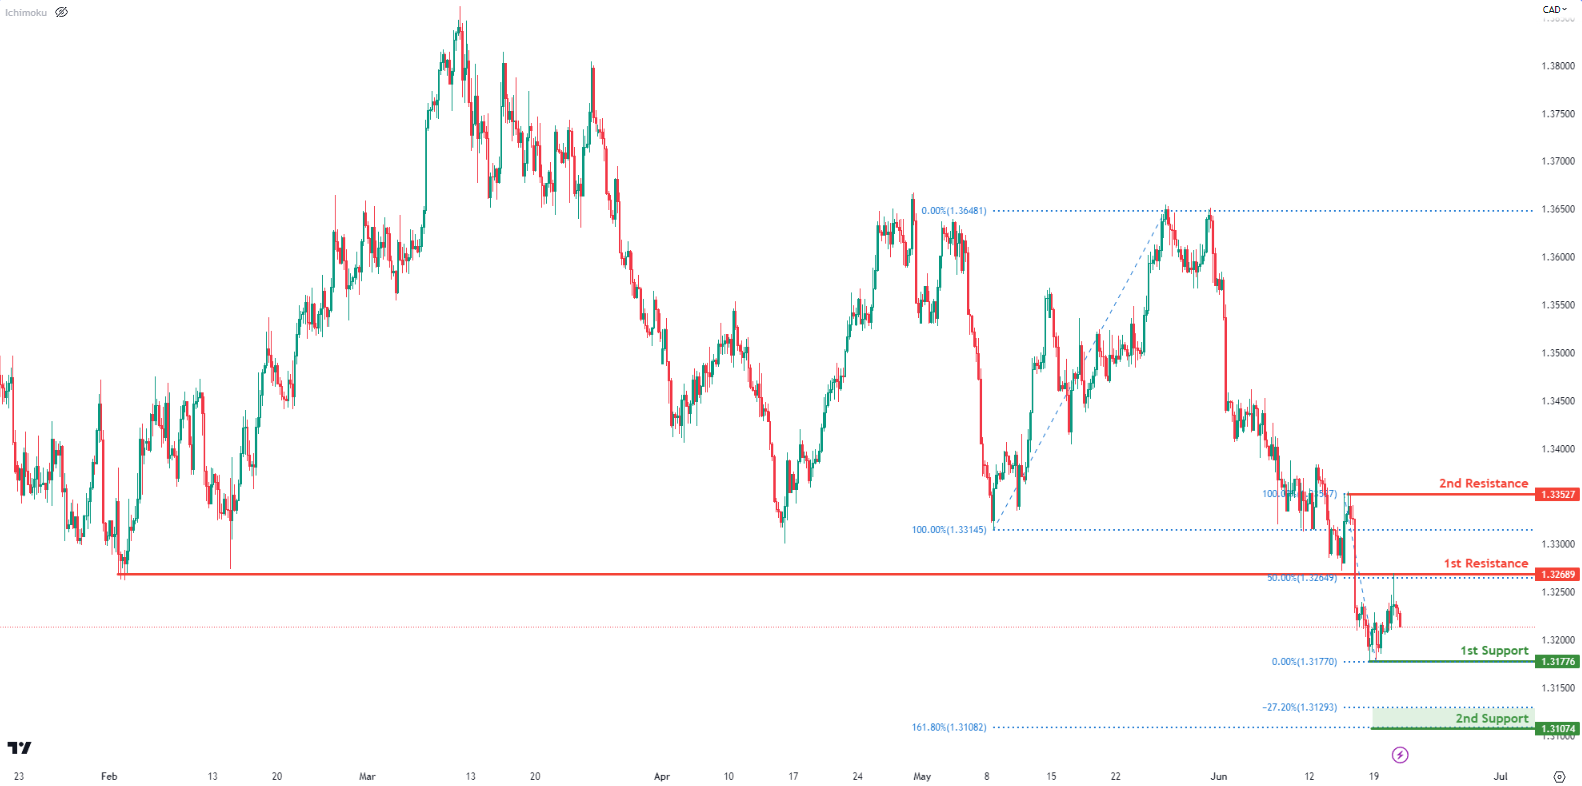
Price has reversed strongly from our 1st resistance at 1.3268 which is a major pullback resistance and also a short term 50% Fibonacci retracement. A reversal from this level could see prices drop down to test the 1st support level at 1.3177 which is a recent swing low support.
Breaking the 1st support level could see prices drop to the 2nd support level at 1.3107 which is a -27.2% Fibonacci expansion and a larger 161.8% Fibonacci extension.
AUD/USD:
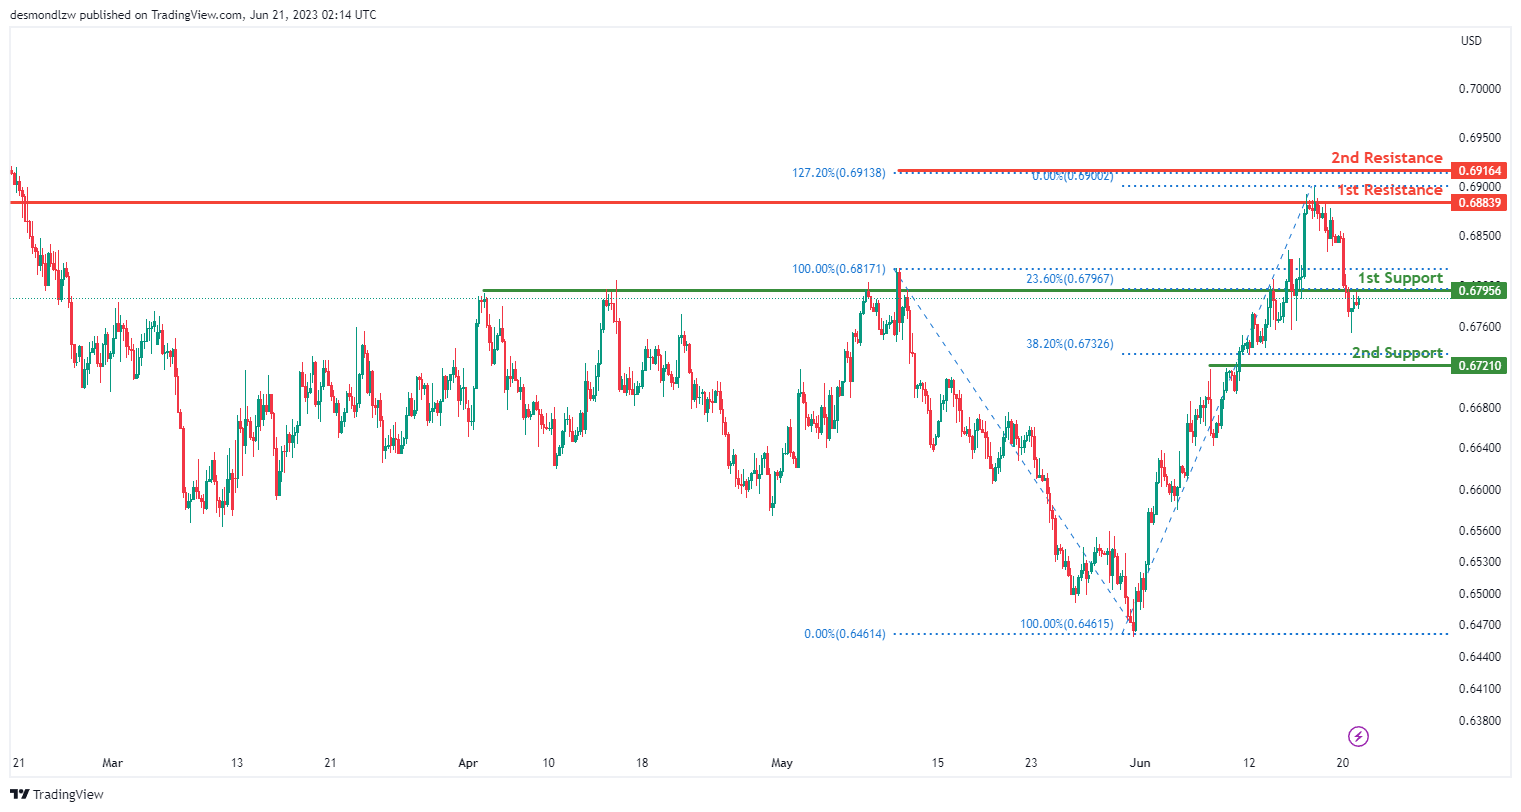
The AUD/USD chart demonstrates a bearish momentum, indicating a downward trend in the market.
There is a potential for a bearish break off the first support level at 0.6795, which is identified as a pullback support and aligns with the 23.60% Fibonacci Retracement. This could lead to a drop towards the second support level at 0.6721, which serves as another pullback support and coincides with the 38.20% Fibonacci Retracement.
On the upside, the first resistance level at 0.6883 represents a significant swing high resistance. Additionally, the second resistance level at 0.6916 is identified as a Fibonacci Extension level, further contributing to its significance.
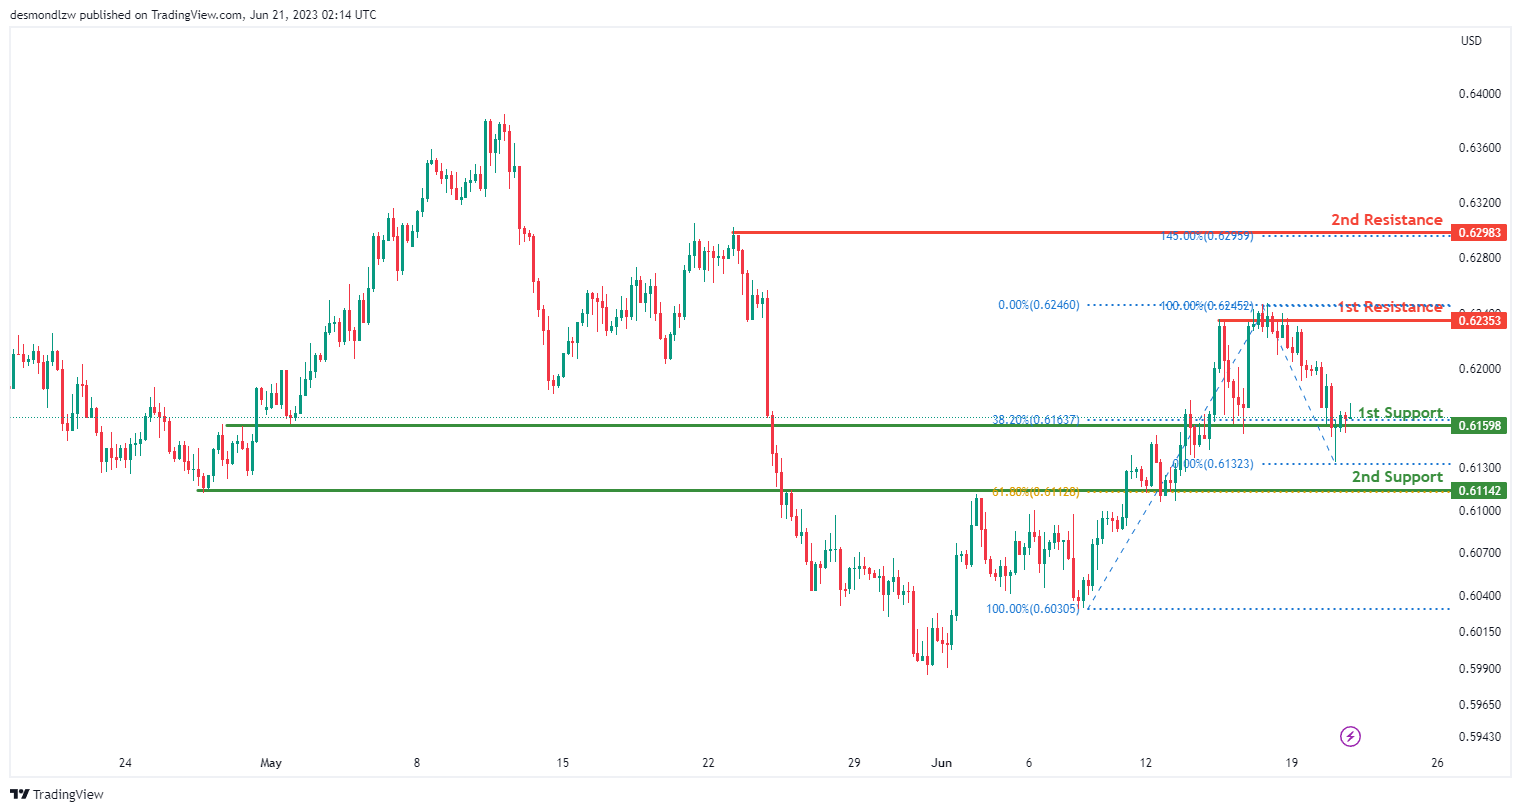
NZD/USD
The NZD/USD chart indicates a weak bullish momentum, suggesting a bullish bounce off the first support level and move towards the first resistance level.
The 1st support sits at 0.6160 which is an overlap support and aligns with the 38.2% Fibonacci retracement level while the 2nd support lies at 0.6114 which is an overlap support taht aligns witht he 61.8% Fibonacci retracement level.
On the upside, the first resistance level at 0.6235 represents a multi-swing high resistance, while the second resistance level at 0.6306 acts as a swing high resistance.
Furthermore, the 2nd resistance sits at 0.6298 which is an overlap resistance that aligns wit the 145.00 Fibonacci extension level.
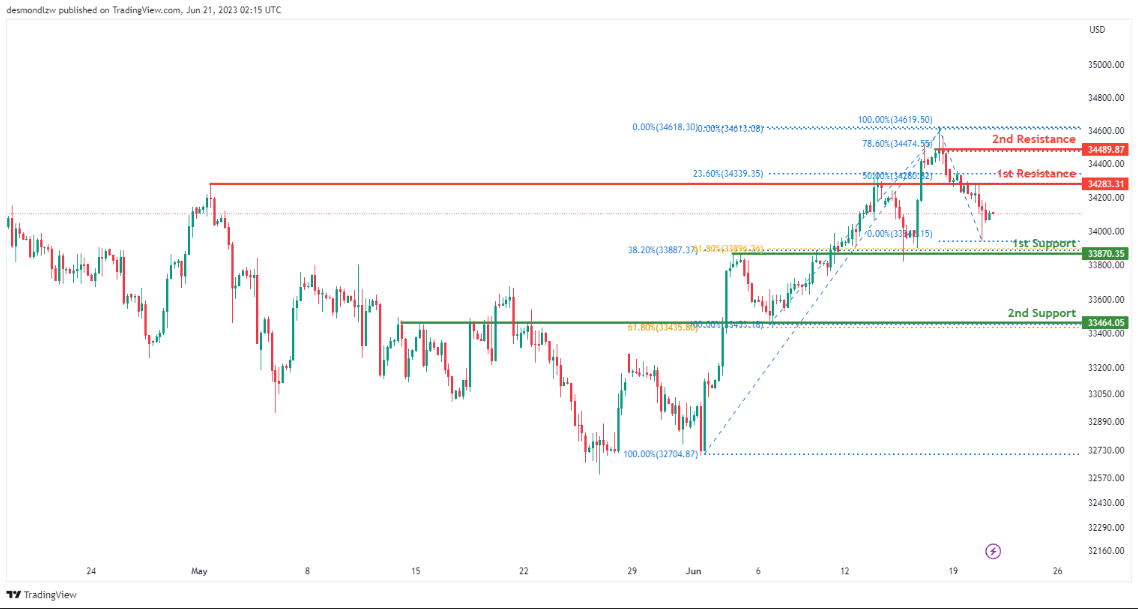
DJ30:
Price is currently approaching a major support at 33870 which is a 38.2% Fibonacci retracement and also an overlap support. It is worth noting that price is seeing higher lows suggesting that we’re still in a bullish trend.
A bounce from here could see prices rise up to test the 34783 level which is a big overlap resistance.
Breaking the 1st support could trigger another move down to the 2nd support at 33464 which is a 61.8% Fibonacci retracement.
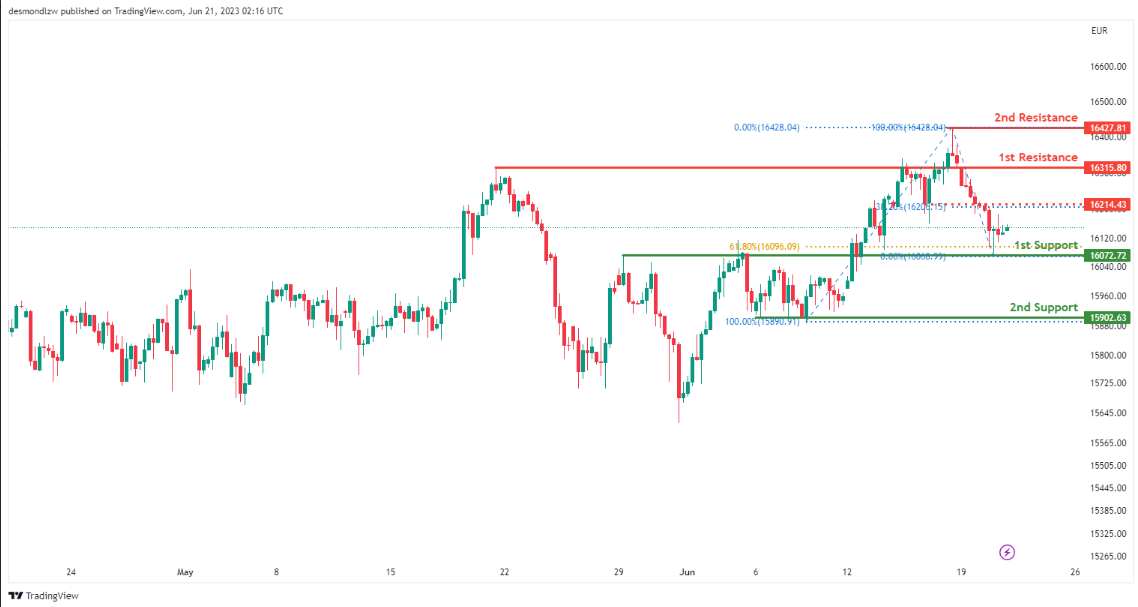
GER30:
Price is currently testing a key overlap support at 16072 which also happens to be a short term 61.8% Fibonacci retracement. If price were to bounce from here, we could see it first test the intermediate resistance at 16234 which is a short-term pullback resistance. Breaking that level could accelerate it up towards 1st resistance at 16315 which is an overlap resistance.
The 2nd support level is down at 15902 which is a recent significant swing low support – this would be the level to watch out for if price were to break the 1st support level.
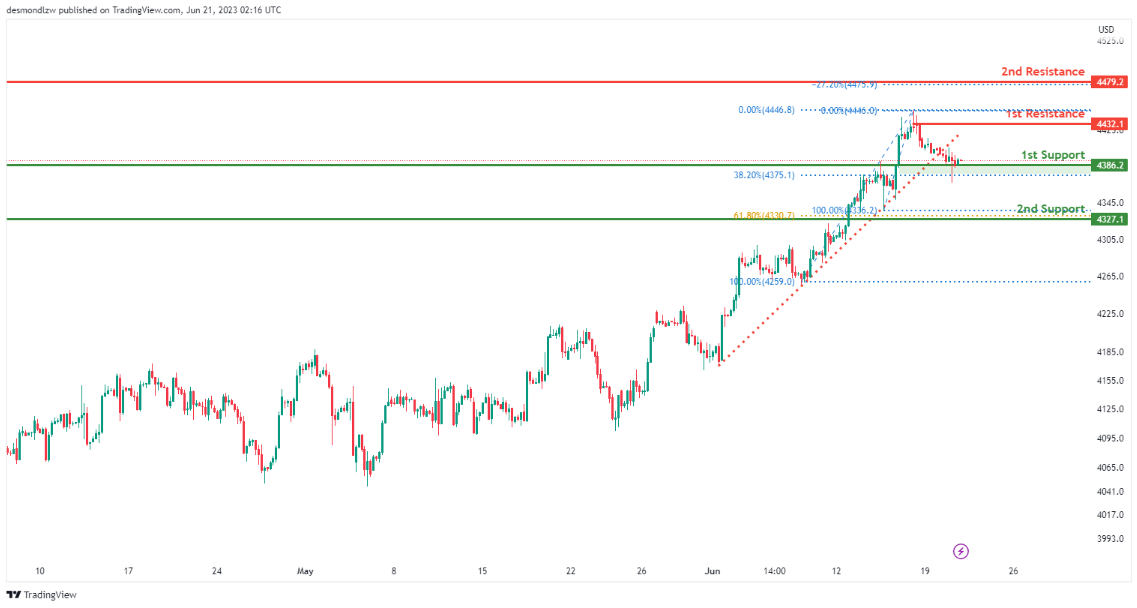
US500
Price is currently testing the 1st support level at 4386 which is a major pullback support level. It is worth noting that price has already broken a short term ascending trend line which suggest we might be seeing a bearish breakout towards the 2nd support level. However, the key level to watch out for to trigger that move would be the 1st support level – which also coincides with the 38.2% Fibonacci retracement.
The 2nd support is down at 4327 which is a 61.8% Fibonacci retracement while the 1st resistance we’re looking at is the recent swing high resistance at 4432.
BTC/USD:
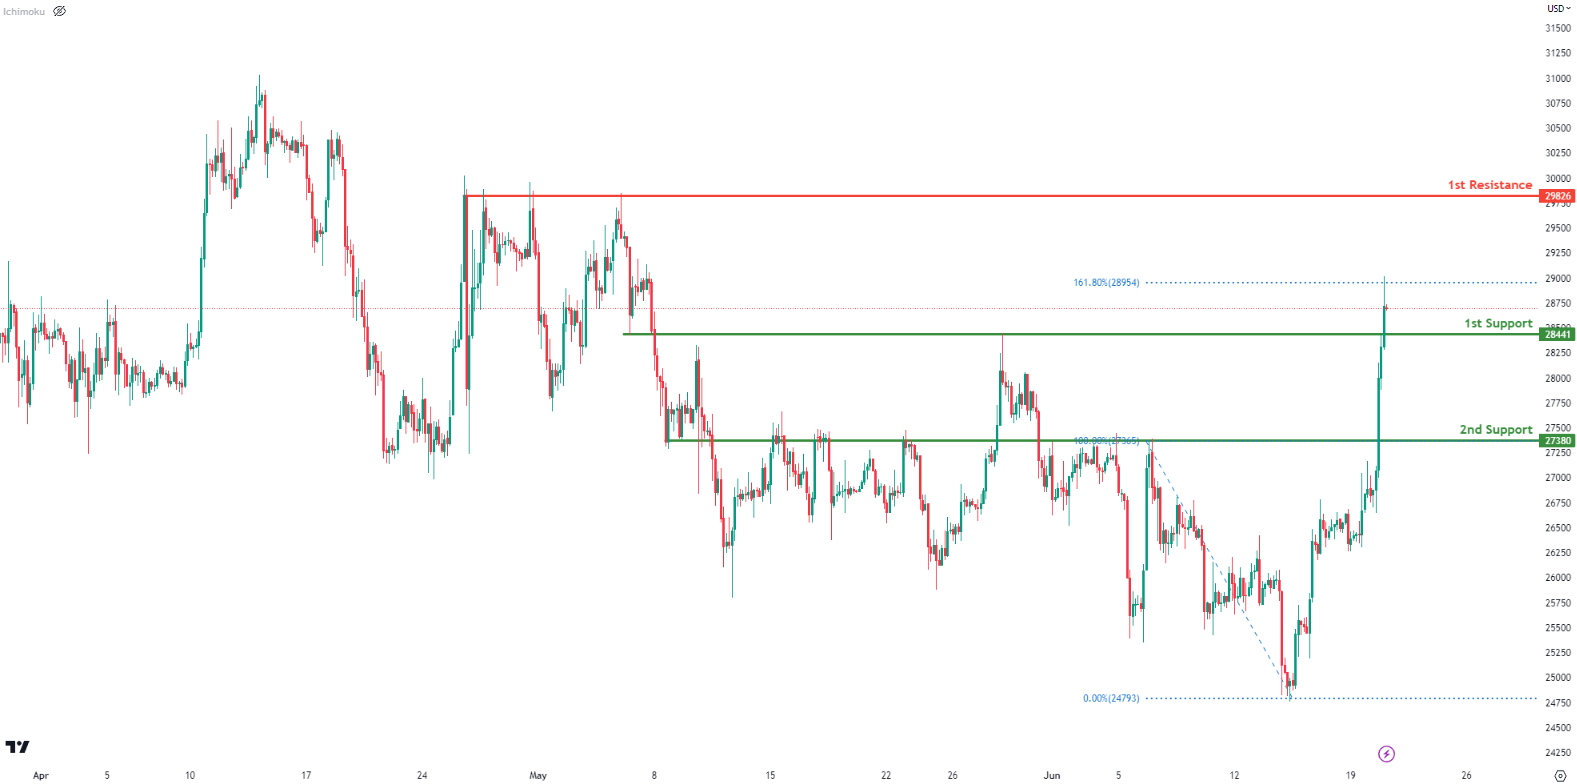
Price has broken a key resistance-turned-support at 28441 which is now a pullback support. We could potentially see prices accelerate up towards the 1st resistance at 29826 which is a multi-swing high resistance level.
It’s worth noting that price is currently testing the 161.8% fibonacci extension which is at 28954 – this could see prices reverse towards the 28441 level first before a potential bounce.
If price were to break the 1st support, we could see a bigger drop towards the 27380 level which is a key overlap support level.
ETH/USD:
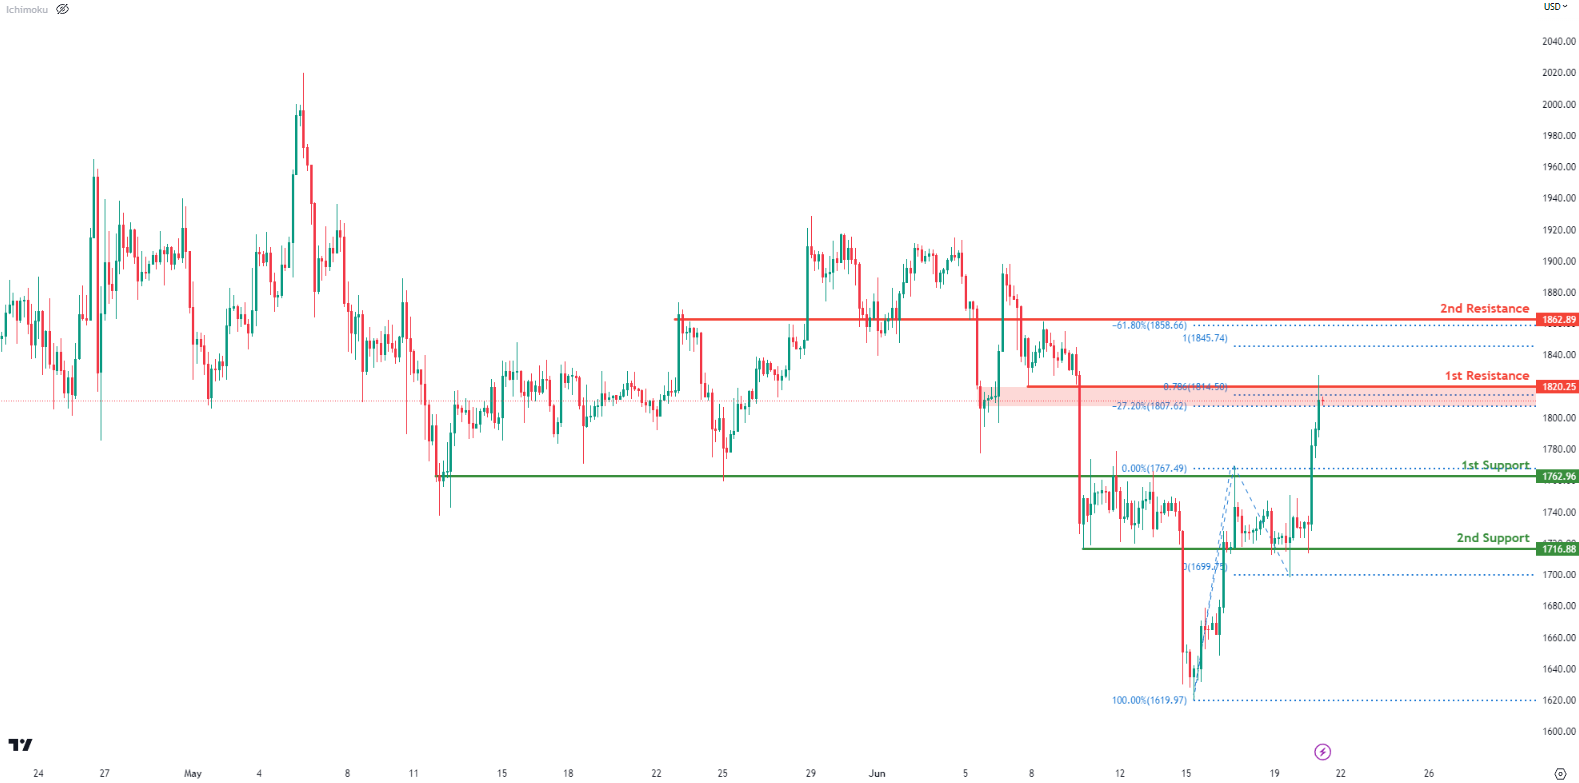
Price is currently testing a major resistance level at 1820 which is a -27% Fibonacci expansion and 78.6% Fibonacci projection. It also happens to be a pullback resistance. We could see a reversal from here to take prices back down to 1st support at 1762 which is an overlap support level.
If price were to break the 1st resistance, the next resistance we are looking at is up at 1862 which is an overlap resistance and a -61.8% Fibonacci expansion.
However, if prices were to reverse and break the 1st support, the next key support level to watch out for is 2nd support down at 1716 which is also an overlap support level.
WTI/USD:
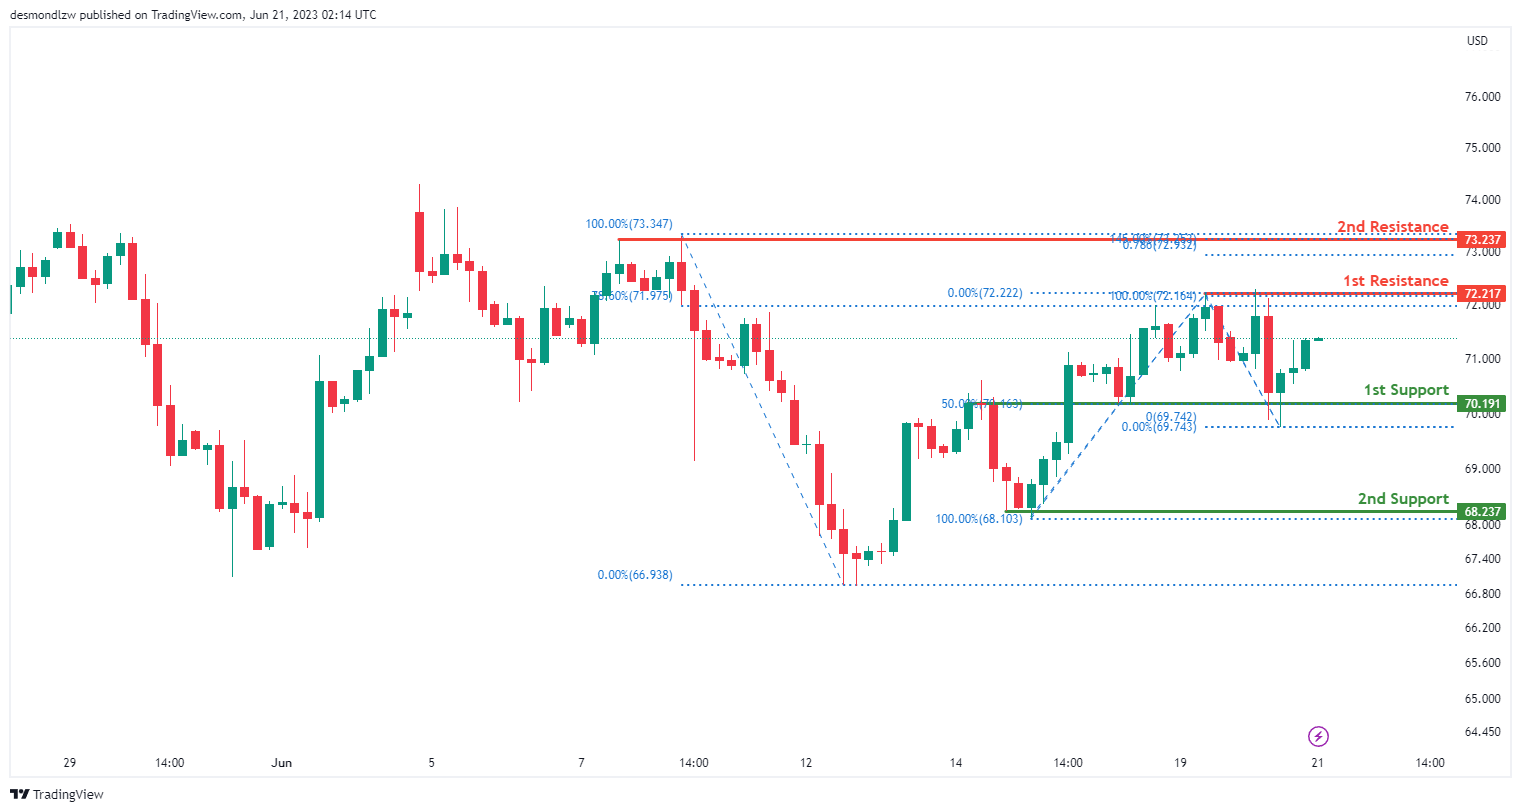
The WTI chart currently indicates a bullish momentum, suggesting an upward trend in the market.
There is a potential for price to continue its bullish movement towards the 1st resistance level at 72.22 which is an overlap resistance level and coincides with the 78.6% Fibonacci retracement. The 2nd resistance level sits at 73.24 which is an overlap resistance.
On the support side, the 1st support level sits at 70.19 which is verlap support level and coincides with the 50% Fibonacci retracement. Additional support can be found at the second support level of 68.24, which acts as a swing-low support.
XAU/USD (GOLD):
The XAU/USD chart currently exhibits a bearish momentum, indicating a downward trend in the market. This is supported by the price being in a bearish descending channel.
There is a possibility of a bearish continuation towards the first support level at 1933.95, which is identified as an overlap support. Additionally, the second support level at 1914.16 acts as another overlap support.
On the upside, the first resistance level at 1966.26 represents a multi-swing high resistance. Furthermore, the second resistance level at 1980.08 is identified as an overlap resistance.