Sample Category Title
Oil: Short-Term Bounce Rather Than New Bull Market
Oil ended last week with growth, having found support at key price levels, but unlikely for long.
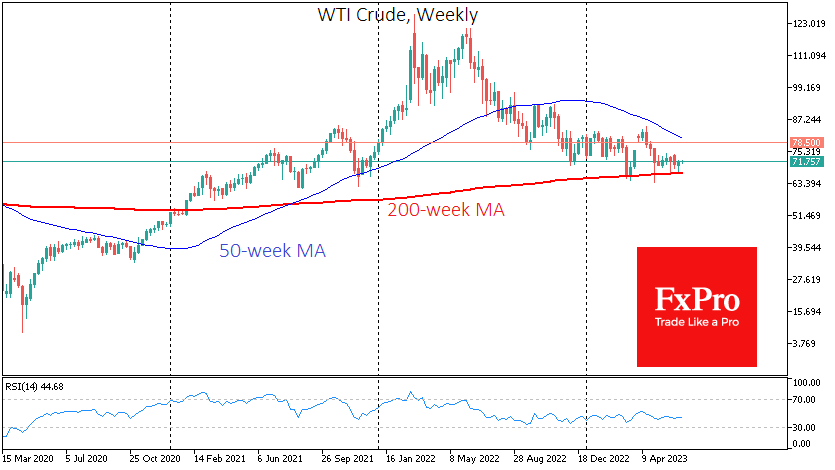
Last week, WTI tested its 200-week moving average for the fifth time since the beginning of the year but managed to bounce back from this level. Accumulated oversold conditions in oil on the intraday timeframe and hopes of demand stimulus in China worked in favour of the bulls at the start of the week. In the second half of the week, a falling dollar and demand for equities supported interest in risk assets, including oil.
In addition, it was easy to see the desire of OPEC+ to push oil prices higher by threatening supply shortages. It is essential to realise that we have been hearing such comments for years and that this has kept oil from experiencing substantial price swings.
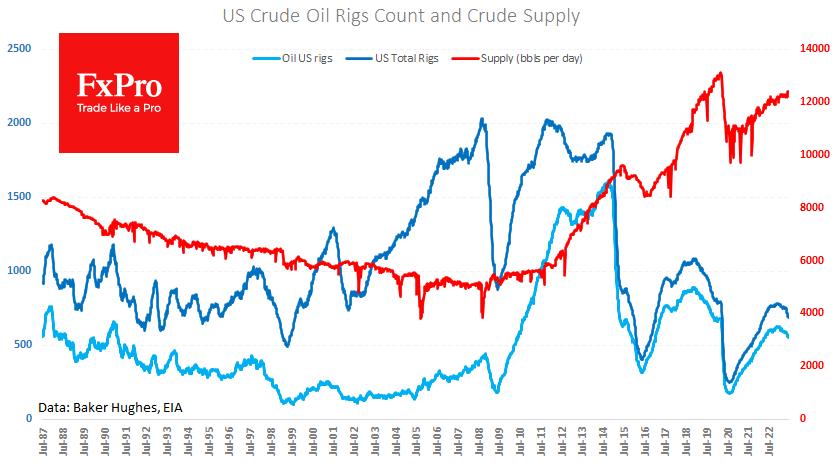
Weekly data from the US showed that production rose for the second consecutive week to 12.4M BPD, the highest level since April 2020. Commercial inventories rose by 7.9M barrels (+11% y/y). As the driving season approaches, we will likely see a short-term increase in production and inventories.
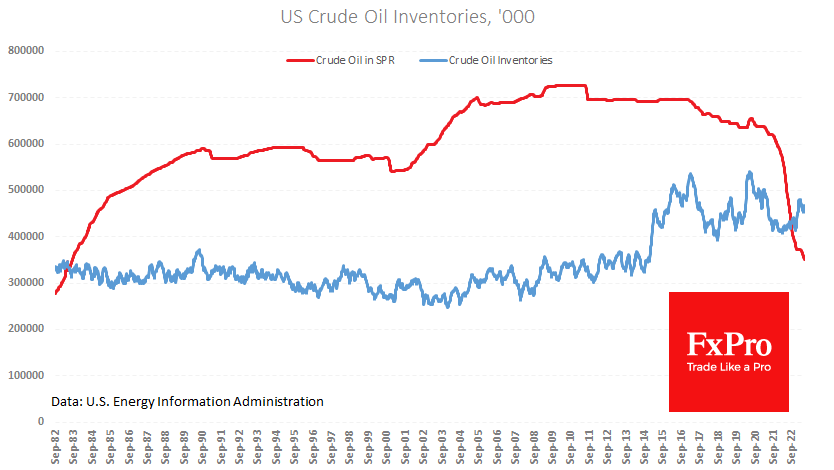
At the same time, oil leaks from the Strategic Petroleum Reserve, which lost another 1.9M barrels that week, down 45% from its plateau just over two years ago with a slightly higher price than in May 2021.
Friday’s weekly data on the number of rigs in operation continued to point to a decline in activity in the sector in the US. The total number (Oil+Gas) fell by seven units to 687, and the number of oil rigs fell to 552 (-4). In both cases, this is the lowest level since April 2022. So far, this decline has not hindered production growth, but it indicates caution on the part of industry participants and keeps oil production well below the maximum of 13.1M BPD we saw in March 2020.
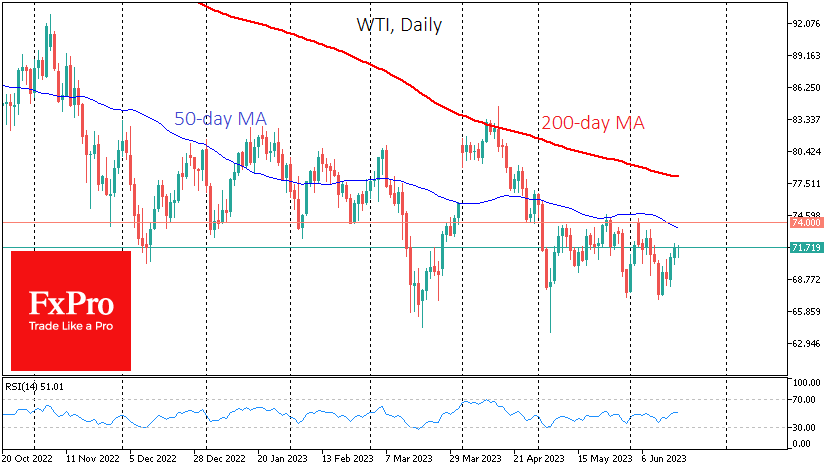
Technically, a rebound in oil may not face headwinds until $74 for WTI and $78.5 for Brent, a significant area of resistance that has previously acted as support. The next more rigid resistance is 78 for WTI and 83.5 for Brent, around the 200-day (50-week) moving average. A move higher would reclassify the current rally as a bullish reversal, but slowing global demand on the back of high-interest rates makes it worthwhile to remain cautious in the longer term.
New Zealand Dollar Slips Despite Solid Services Release
- NZD/USD is down sharply on Monday
- New Zealand services beat expectations
- US inflation expectations fall to March 2021 low
The New Zealand dollar is down sharply on Monday. In the European session, NZD/USD is trading at 0.6192 down 0.75%.
New Zealand Services PSI beats expectations
New Zealand’s services sector accelerated in May, as the Performance of Services Index rose from an upwardly revised 50.1 to 53.3 points. The 50.0 level separates contraction from expansion. The rebound was positive news after last week’s first-quarter GDP report, which dipped by 0.1% and marked a second straight decline. The services component of GDP came in at -0.6%, which indicates that the Reserve Bank of New Zealand’s rate tightening has reduced the demand for services. This is good news for the RBNZ, which is looking for the economy to cool in order to dampen inflation.
The Reserve Bank of New Zealand raised rates in May and has some time to gauge the impact of its rate tightening, as it does not meet again until July 12th. The weak GDP report is an indication that economic activity is slowing down, but inflation has been stickier than expected, falling to 6.7% in the first quarter, down from 7.2% in Q4 2022. This is much higher than the central bank’s target of 1%-3% and the RBNZ will likely have to tighten further, but that will make a soft landing a tricky task. The International Money Fund has urged New Zealand to continue its rate-tightening campaign in order to bring down inflation.
US inflation expectations fall
In the US, UoM inflation expectations eased to 3.3% in June, down sharply from 4.2% in May and lower than the 4.1% consensus. Inflation expectations haven’t been this low since March 2021 and this is another indication that inflation is heading lower. The UoM Consumer Sentiment survey rose from 59.2 to 63.9, boosted by the drop in inflation expectations as well as the resolution of the banking crisis, according to the survey.
NZD/USD Technical
- NZD/USD is testing support at 0.6198. Below, there is support at 0.6130
- 0.6276 and 0.6340 are the next resistance lines

EUR/GBP Hits New Multi-month Low ahead of UK CPI Data, BoE Policy Meeting
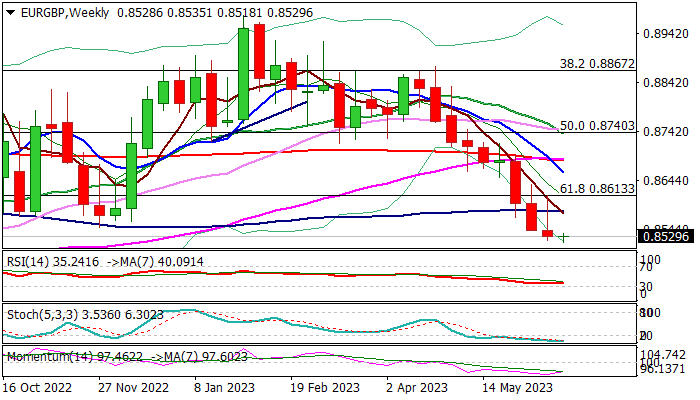
The cross remains at the back foot on Monday and hit new 2023 low (0.8518) also the lowest since 19 Aug 2022.
Sterling continues to rise on expectations for another BoE rate hike, as the MPC meets on Thursday and widely expected to deliver another rate hike.
The central bank is expected to raise interest rates by 25 basis points in the 13th consecutive time and push borrowing cost to 4.75% (the highest in 15 years.
Sticky inflation keeps the UK policymakers at high alert, with growing expectations among traders that interest rates might rise as high as 6% in 2023.
UK inflation report is due on Wednesday, with annualized inflation expected to ease to 8.5% in May from 8.7% previous month, but closely watched core CPI is expected to stay unchanged at 6.8% in May, warning that underlying inflation remains elevated without signs of easing.
Daily studies are in full bearish setup, although oversold conditions may produce headwinds and slow bears, en-route to next target at 0.8456 (Fibo 76.4% of 0.8202/0.9278).
Broken 100DMA (0.8580) should cap upticks.
Res: 0.8580; 0.8613; 0.8658; 0.8684.
Sup: 0.8500; 0.8456; 0.8407; 0.8339.
ECB Lane: September is so far away, let’s see
ECB Chief Economist Philip Lane emphasized the central bank's data-driven approach in managing inflation. Speaking today he suggested that another interest rate hike is likely in July, provided there are no significant changes in the economic outlook.
"At this point, we are surely data-driven," Lane stated, reflecting ECB's commitment to making policy decisions based on economic indicators and trends. "July is not so far away, we can say unless there's a material change another hike (is likely)."
Regarding further in September, however, Lane was more reserved. "But to me, September is so far away; let's see in September," he added.
Despite rising inflation, Lane remains optimistic about the medium-term outlook. "Inflation will come down fairly quickly in the next couple of years to ECB's 2% target," he predicted.
ECB Schnabel: We need to err on the side of doing too much
ECB Executive Board member Isabel Schnabel stressed the necessity of maintaining a proactive approach to monetary policy amid persistent inflation risks. In a speech today, she noted that "risks to the inflation outlook are tilted to the upside, reflecting both supply- and demand-side factors."
Referencing IMF's recent guidance, Schnabel noted, "The IMF has recently issued a clear recommendation: if inflation persistence is uncertain, risk management considerations speak in favour of a tighter monetary policy stance."
She further explained the rationale behind this approach. "First, the costs of protecting the economy from upside risks to inflation are comparatively small, as the policy rate can be brought back to neutral levels faster than if policymakers acted under the assumption of low inflation persistence," Schnabel said.
The second reason revolves around the high costs of reactive policies. Schnabel pointed out, "it is very costly to react only after upside risks to inflation have materialized, as this could destabilise inflation expectations and thus require a sharper contraction in output to restore price stability."
Overall, Schnabel emphasized the need for data-dependent decisions that lean towards more action rather than less. "We need to remain highly data-dependent and err on the side of doing too much rather than too little," she asserted.
She insisted, "We thus need to keep raising interest rates until we see convincing evidence that developments in underlying inflation are consistent with a return of headline inflation to our 2% medium-term target in a sustained and timely manner."
AUD/USD Technical Analysis
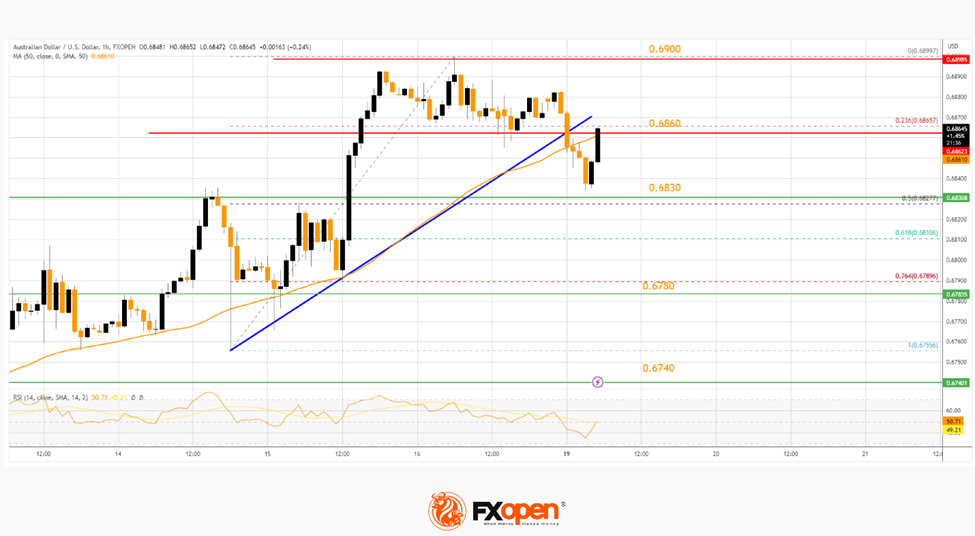
On the hourly chart of AUD/USD at FXOpen, the pair started a fresh increase above the 0.6830 resistance. The Aussie Dollar traded above the 0.6860 resistance before the bears appeared.
The pair tested the 0.6900 zone before there was a bearish reaction. There was a break below a key bullish trend line at 0.6860 and the 50-hour simple moving average. The pair traded close to the 0.6830 support and is currently attempting another increase.
The first key resistance is near 0.6860. If there is an upside break above the 0.6860 zone, the pair could rise steadily toward the 0.6900 level. Any more gains might send AUD/USD toward 0.6950.
On the downside, there is a decent support near the 0.6830 level, below which the pair might test the 0.6780 support. Any more losses might send the pair toward the 0.6740 support.
GBP/USD Rallies above 1.2800 While EUR/GBP Struggles
GBP/USD rallied above the 1.2765 and 1.2800 resistance levels. EUR/GBP declined and now trading below the 0.8565 resistance.
Important Takeaways for GBP/USD and EUR/GBP Analysis Today
- The British Pound is trading in a bullish zone above 1.2700 against the US Dollar.
- There is a key bullish trend line forming with support near 1.2765 on the hourly chart of GBP/USD at FXOpen.
- EUR/GBP started a fresh decline from the 0.8590 resistance zone.
- There is a major bearish trend line forming with resistance near 0.8540 on the hourly chart at FXOpen.
GBP/USD Technical Analysis
On the hourly chart of GBP/USD at FXOpen, the pair started a major increase from the 1.2500 support zone. The British Pound climbed above the 1.2625 resistance zone against the US Dollar.
The bulls were able to pump the pair above 1.2765 and the 50-hour simple moving average. Finally, the pair climbed above 1.2800 and tested 1.2845. A high is formed near 1.2847 and the pair is now consolidating gains.
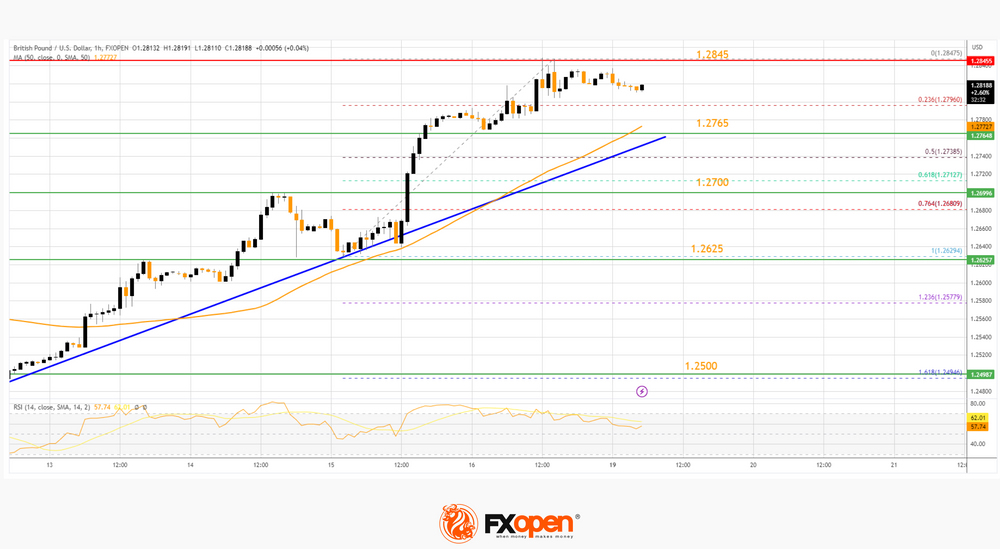
It is trading above the 23.6% Fib retracement level of the upward move from the 1.2629 swing low to the 1.2847 high. The GBP/USD chart indicates that the pair is facing resistance near the 1.2845 level.
The next major resistance is near the 1.2880 level. If the RSI moves above 60 and the pair climbs above 1.2880, there could be another rally. In the stated case, the pair could rise toward the 1.2950 level or even 1.3000.
On the downside, there is a major support forming near a trend line at 1.2765 and the 50-hour simple moving average. If there is a downside break below the 1.2765 support, the pair could accelerate lower.
The next major support is near the 61.8% Fib retracement level of the upward move from the 1.2629 swing low to the 1.2847 high or 1.2700, below which the pair could test 1.2625. Any more losses could lead the pair toward the 1.2500 support.
EUR/GBP Technical Analysis
On the hourly chart of EUR/GBP at FXOpen, the pair started a fresh decline from the 0.8590 resistance. The Euro traded below the 0.8565 support to move into a bearish zone against the British Pound.
The EUR/GBP chart suggests that the pair settled below the 50-hour simple moving average and 0.8540. A low is formed near 0.8522 and the pair is now showing a few bearish signs. The RSI is moving lower toward the 35 level.
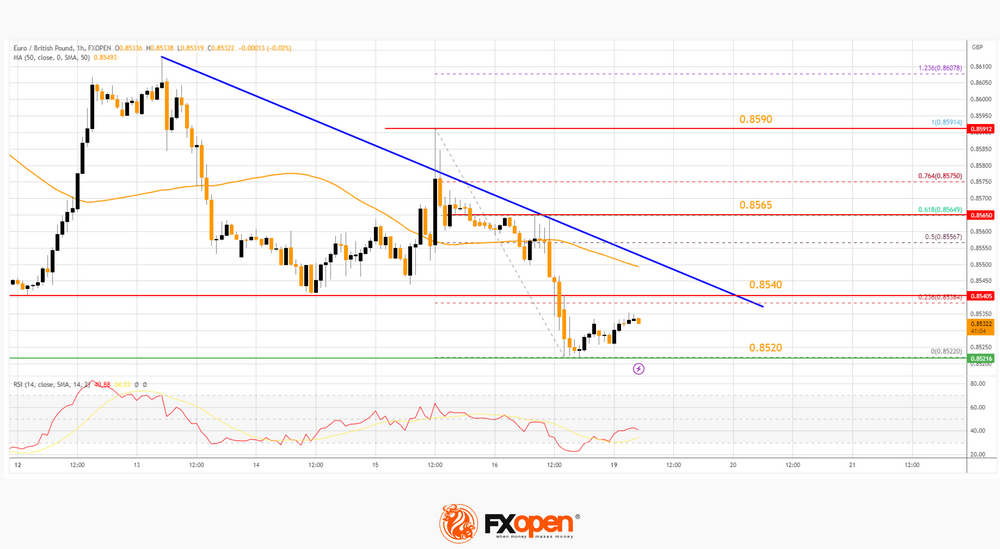
Immediate resistance is near a major bearish trend line at 0.8540. It coincides with the 23.6% Fib retracement level of the downward move from the 0.8591 swing high to the 0.8522 low.
The next major resistance for the bulls is near the 61.8% Fib retracement level of the downward move from the 0.8591 swing high to the 0.8522 low at 0.8565. A close above the 0.8565 level might accelerate gains.
In the stated case, the bulls may perhaps aim for a test of 0.8590. Any more gains might send the pair toward the 0.8650 level.
If there is no move above 0.8540, the pair could continue to move down. Immediate support sits at 0.8520. The next major support is near 0.8500.
A downside break below the 0.8500 support might call for more downsides. In the stated case, the pair could drop toward the 0.8440 support level.
Crypto May Be Ready for a New Leg Down
Market picture
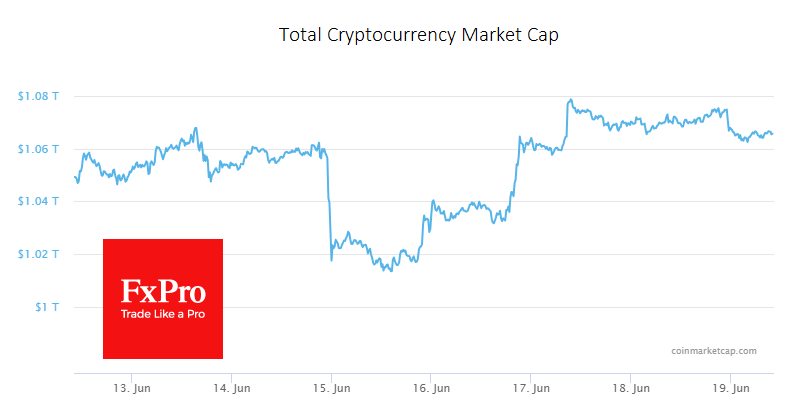
The crypto market capitalisation rose 1.5% last week to reach $1.066 trillion at the start of the new week. But it wasn’t a smooth ride, as Bitcoin gained 2% last week to end the week down 4% at around $26,500. Ethereum lost 1% to $1730. Other leading altcoins in the top 10 fell between 0.4% (TRON) and 6.4% (XRP). The exception was BNB (+2.6%).
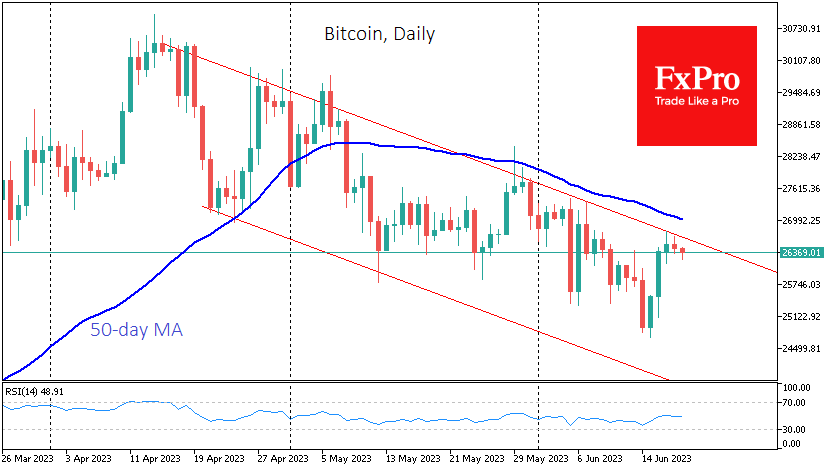
Thanks largely to positive equity market traction, bitcoin found support on the downside below $25,000 and formally closed above its 200-week average. The market was near the upper end of the downside range on the smaller timeframes. Given the overbought equity market, more downside risks could push BTCUSD lower, leaving it within the bearish trend. Only a rally above $27.2K – the area of previous local highs and the 50-day moving average – can effectively break this trend.
According to Bloomberg, Bitcoin’s share of the total market value of all cryptocurrencies has reached its highest level since mid-autumn 2021. Traders are more likely to keep their money away from altcoins.
News background
Digital asset platform Bakkt has announced that it is removing Solana, Polygon and Cardano cryptocurrencies from its available assets until regulatory uncertainty is resolved.
US financial giants BlackRock, Bank of America and Fidelity are increasing their investment in MicroStrategy shares, with more than $200 million invested. MicroStrategy holds more than 140,000 BTCs.
The Securities and Exchange Commission (SEC) agreed with the Binance exchange to restrict employees of the parent platform from accessing the assets of Binance.US customers.
French authorities have opened an investigation into the Binance exchange, Le Monde reported, citing the Paris prosecutor’s office. The authorities suspect the exchange of money laundering, failure to comply with KYC procedures and other violations of French law.
Tesla CEO Elon Musk denies insider trading in the Dogecoin cryptocurrency. He says he does not own the cryptocurrency wallets allegedly used for DOGE transactions.
EUR/GBP Technical: Short-term Downtrend Intact
- EUR/GBP has continued to trade lower, now at 0.8520, its lowest level since Aug 2022 ahead of UK inflation data (Wed,21 Jun) & BoE monetary policy decision (Thurs, 22 Jun).
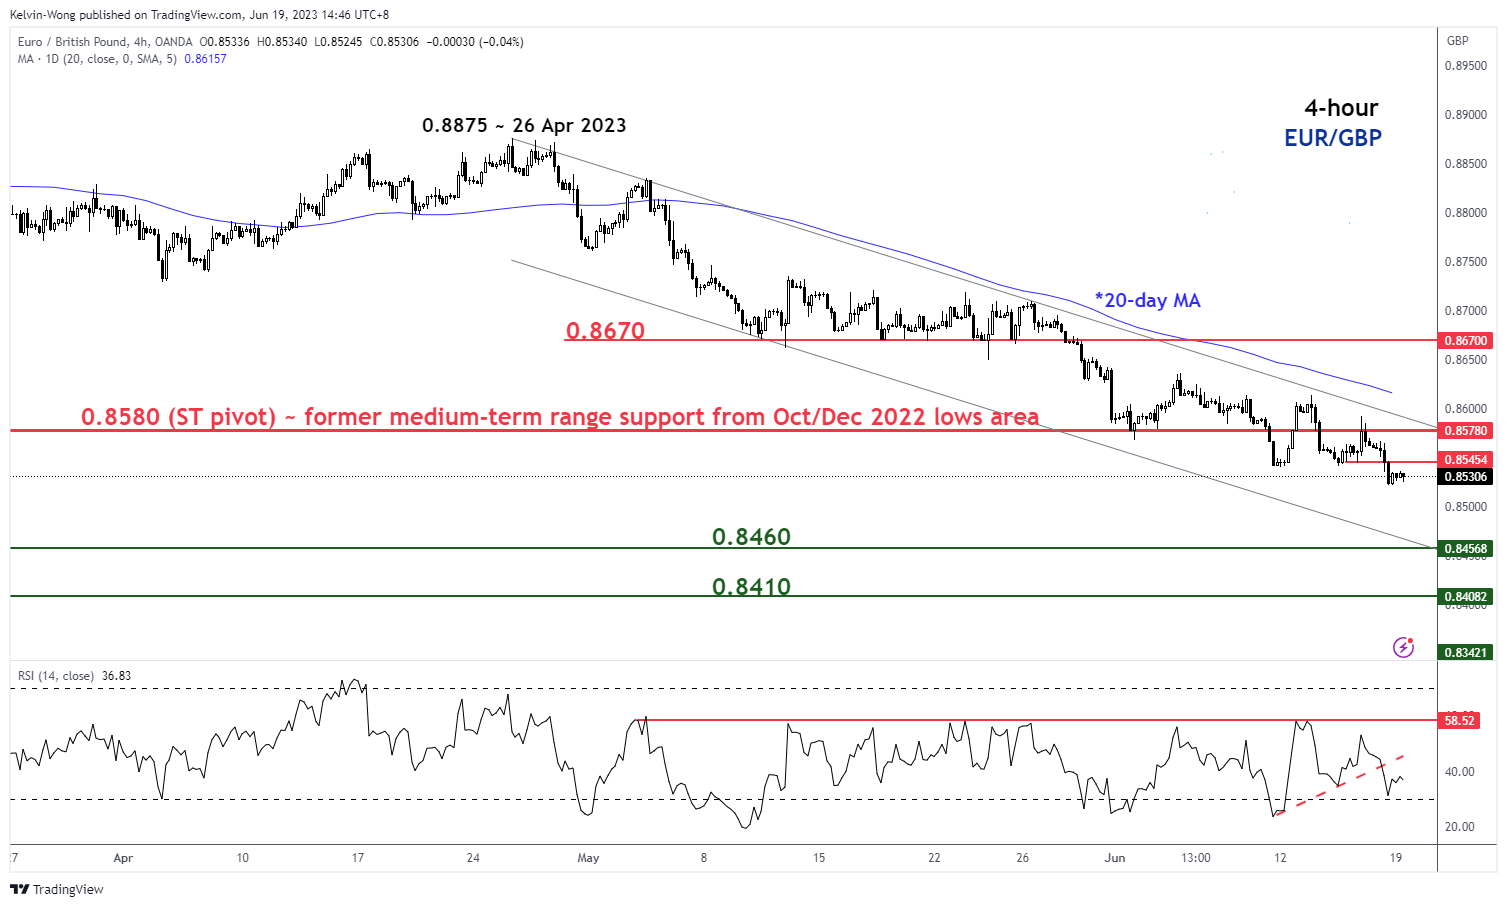
- Short-term downtrend for EUR/GBP remains intact since the 26 Apr high of 0.8875.
- Key short-term resistance to watch will be at 0.8580 to maintain bearish momentum.
Last week, the EUR/GBP cross rate recorded its third consecutive weekly loss and traded below its former medium-term range support of 0.8580 (swing low areas of October/December 2022) which was broken down in the week of 5 June 2023. At this time of writing, the EUR/GBP has continued to trade on a bearish bias at 0.8520, its lowest level since August 2022.
From a news flow/economic data and events standpoint, we have two key data/events this week for the UK; the inflation data for May out on Wednesday, 21 June, and the Bank of England’s (BoE)’s monetary policy decision on Thursday, 22 June.
The expectation of further rate hikes from BoE is being priced in the interest rate futures market where participants expect a 25 basis points (bps) hike this Thursday to bring the policy bank rate to 4.75%, follow by a potential series of five further rate hikes next of 25 bps each to reach a terminal rate of 6%. That’s a more hawkish stance than ECB if such a trajectory of hikes from the BoE turns out as expected.
Fig 1: EUR/GBP long-term & major trends as of 19 Jun 2023 (Source: TradingView, click to enlarge chart)
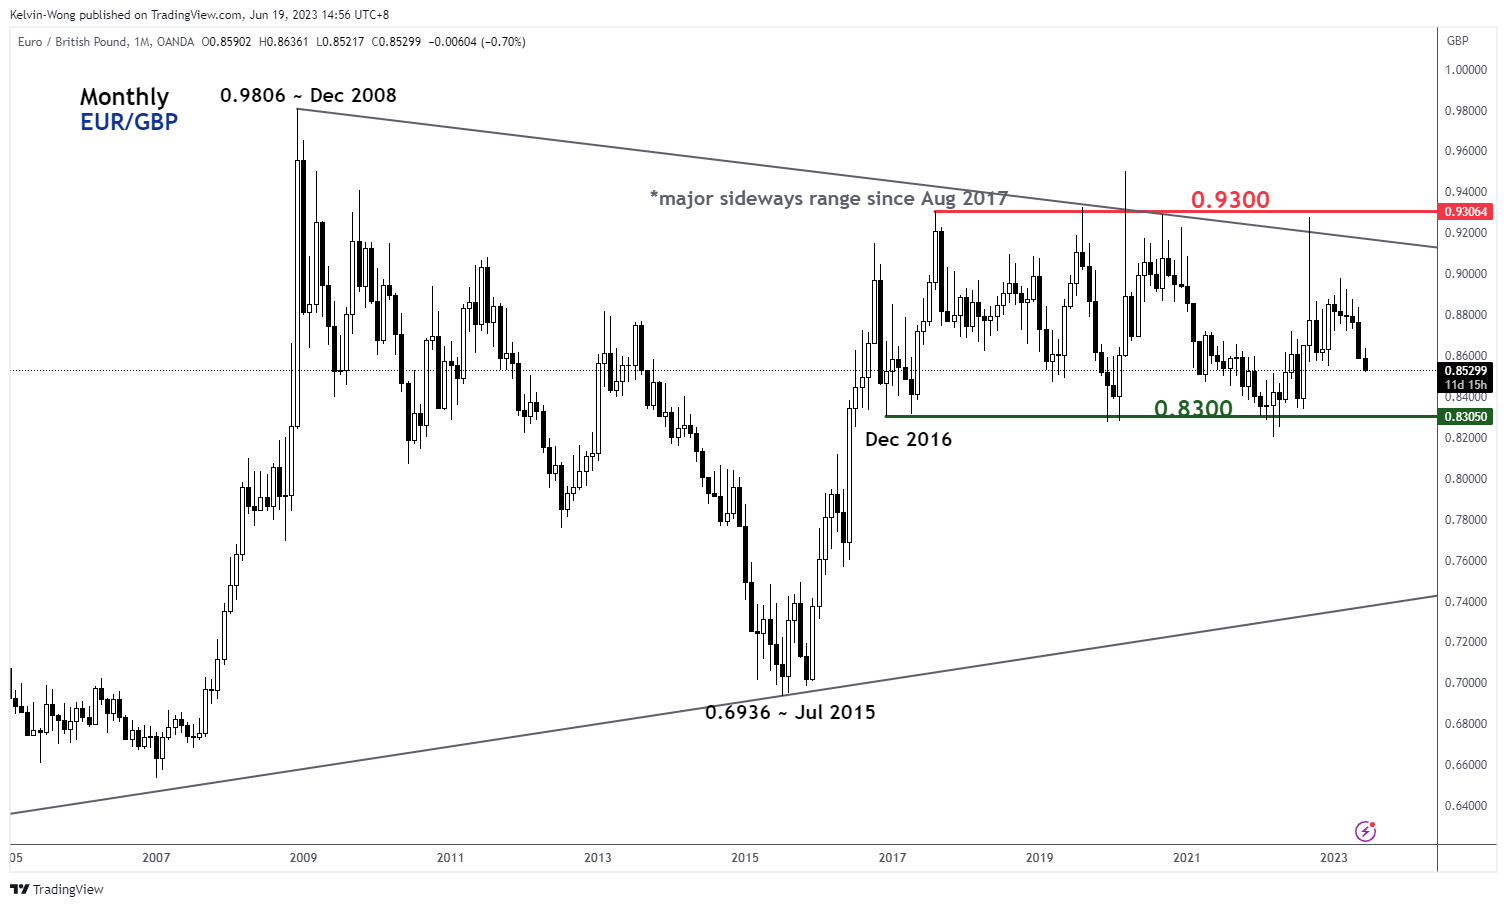
Fig 2: EUR/GBP minor short-term trend as of 19 Jun 2023 (Source: TradingView, click to enlarge chart)
The long-term secular trend remains sideways
Since Aug 2017 major swing high, the EUR/GBP is trapped within a major sideway range configuration with its key resistance and support at 0.9300 and 0.8300 respectively (see monthly chart).
The short-term downtrend remains intact
Price actions of the EUR/GBP have continued to evolve with a short-term descending channel in place since its 26 April 2023 high of 0.8875 as well as remained below its downward sloping 20-day moving average since 3 May 2023 (see 4-hour chart).
Momentum remains bearish in the short-term
The 4-hour RSI oscillator has broken below its corresponding ascending support at the 41% level last Friday, 16 June, and has yet to reach an extremely oversold level of 23.90% that was last seen on 1 May 2023.
Key short-term pivotal resistance will be at 0.8580 which is also defined by the upper boundary of the short-term descending channel with near-term supports coming in at 0.8460 and 0.8410 (24 August 2022 low, lower boundary of the short-term descending channel & a Fibonacci retracement/extension cluster).
On the flip side, a clearance above 0.8580 damages the short-term downtrend to expose the next resistance at 0.8670 (former minor range support of 10 May/25 May 2023).
Euro Drifting Lower on US Holiday-Thinned Trading
- ECB’s Nagel says tightening could continue after July
- US inflation expectations fall to lowest level since March 2021
The euro has started the week quietly. EUR/USD is trading at 1.0917, down 0.22%. There is a bank holiday in the US and no eurozone releases on the calendar, which should mean a calm day for the euro.
ECB signals that rate tightening to continue
The ECB raised rates by 0.25% last week, bringing the benchmark rate to 3.50%. The central bank was late to the tightening party, after dismissing rising inflation as transient. Those days are long gone, and the ECB’s aggressive tightening campaign has pushed the benchmark rate to a 22-year high.
The rate hike last week was expected, but that didn’t prevent the euro from having a massive Thursday, gaining 1.05%. The euro received a boost from ECB President Lagarde’s press conference, when she said it would take a “material change” for the ECB not to raise rates in July. On Friday, some of the ECB hawks stated that more rates hikes could be needed after July, including Bundesbank President Nagel, who said a September hike might be needed.
In response, the markets have revised upwards the pricing of a July hike to 72% and a September hike to 54%. Lagarde has been tight-lipped about what the ECB has planned after July, but clearly there is some support within the ECB for further hikes after that.
In the US, UoM inflation expectations fell sharply to 3.3% in June, down from 4.2% in May and lower than the 4.1% consensus. This was the lowest level since March 2021 and is another indication that inflation is heading lower. The UoM Consumer Sentiment survey rose from 59.2 to 63.9, boosted by the drop in inflation expectations as well as the resolution of the banking crisis, according to the survey.
EUR/USD Technical
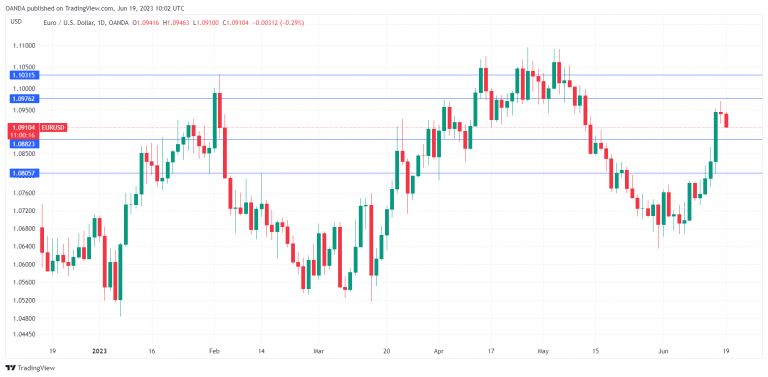
- There is resistance at 1.0976 and 1.1031
- 1.0882 and 1.0805 are providing support