Sample Category Title
USD/JPY: The Pair is Expected to Depreciate in a New Trend
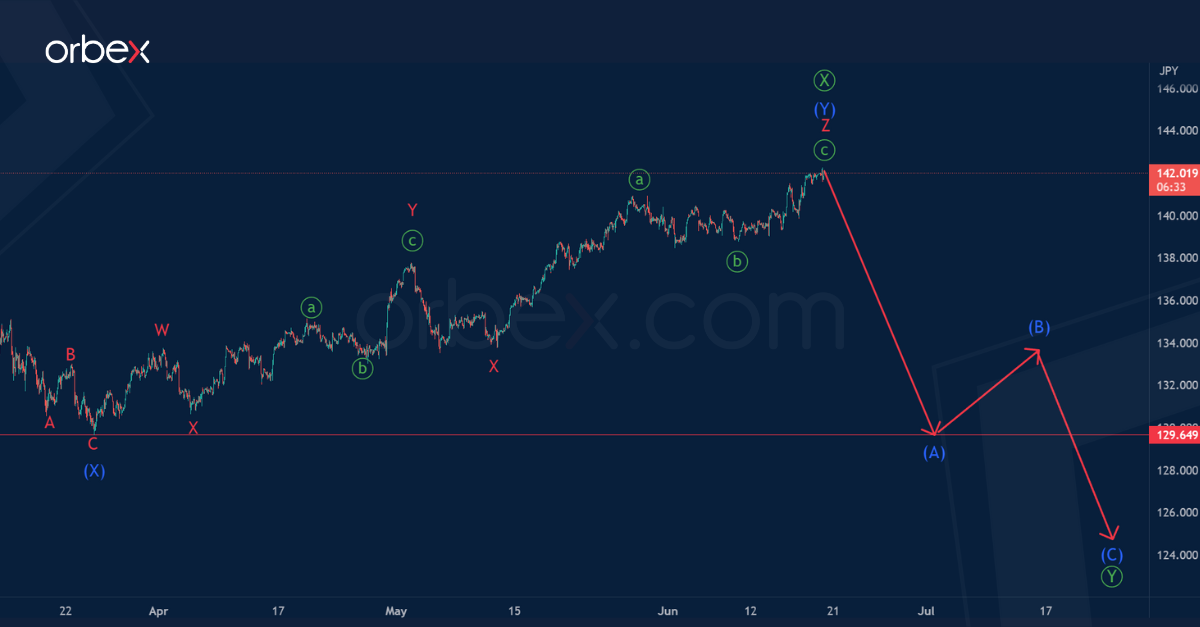
The USDJPY currency seems to be forming a bearish trend. Most likely, the trend takes the form of a double zigzag Ⓦ-Ⓧ-Ⓨ, within which the sub-waves Ⓦ-Ⓧ are completed.
The wave Ⓧ is a double zigzag consisting of intermediate sub-waves (W)-(X)-(Y).
At the moment, the market may be at the very beginning of the primary wave Ⓨ. Probably, this wave will have a standard zigzag shape (A)-(B)-(C).
The end of the first impulse sub-wave (A) is possible near the minimum of 129.64.
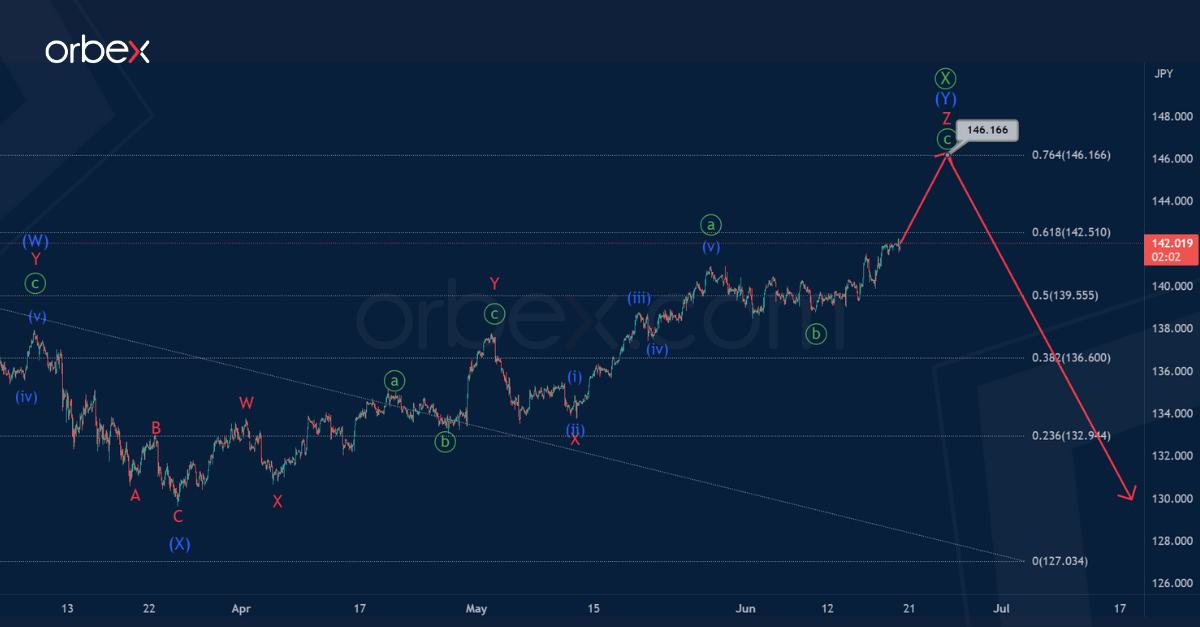
However, in an alternative scenario, the wave Ⓧ continues to build.
In waves Ⓧ, we see completed intermediate sub-waves (W) and (X).
Most likely, the final actionary wave (Y) is being constructed on the last section of the chart, the internal structure of which hints at a triple zigzag W-X-Y-X-Z.
We expect a bullish movement towards 146.16, where the primary wave Ⓧ will be at 76.4% of wave Ⓦ.
EUR Hits Resistance
EUR/USD sees limited pullback
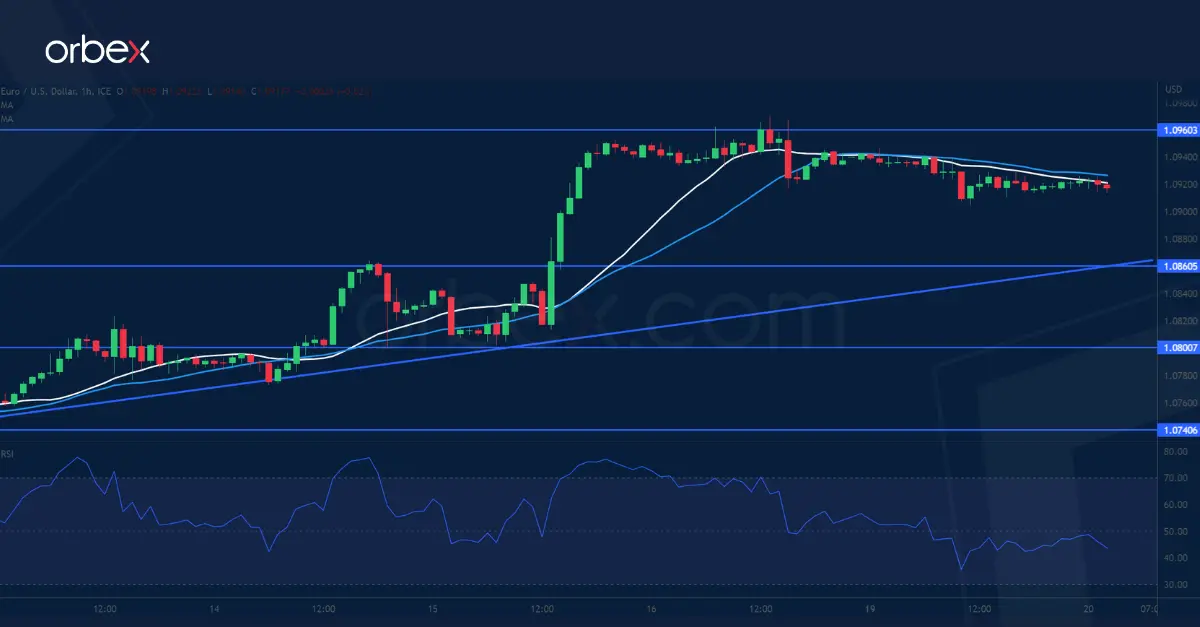
The euro retreated after the ECB's chief economist tempered expectations of more hikes after the summer. The pair is grinding the support-turned-resistance of 1.0960 from the start of the mid-May sell-off. The RSI’s repeatedly overbought condition may temper the bullish drive and prompt buyers to take some chips off the table. Mean reversion would send the euro to 1.0860 over the rising trend line where follow-up interest could be expected. A successful bounce and a close above 1.0960 would expose this year’s peak of 1.1090.
NZD/USD tests key supply area
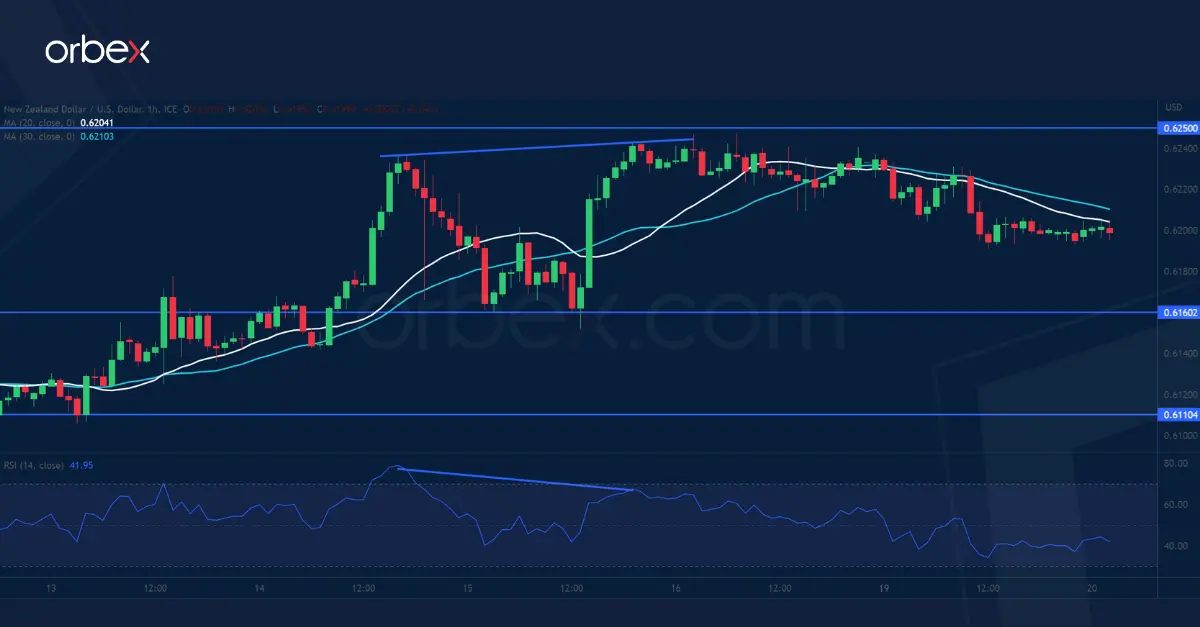
The New Zealand dollar slips over a cautious mood amid thin liquidity early this week. The price is at a crossroads as it grinds the supply zone 0.6250-0.6300. A bearish RSI divergence shows a loss of momentum as the bulls take profit. Still, a series of higher lows is a sign of a strong bullish pressure building up over the past two weeks and a decisive break above 0.6250 would force the remaining sellers out and open the door to the major daily resistance of 0.6380. 0.6160 is the closest support to assess buyers’ commitment.
Dow Jones 30 probes support
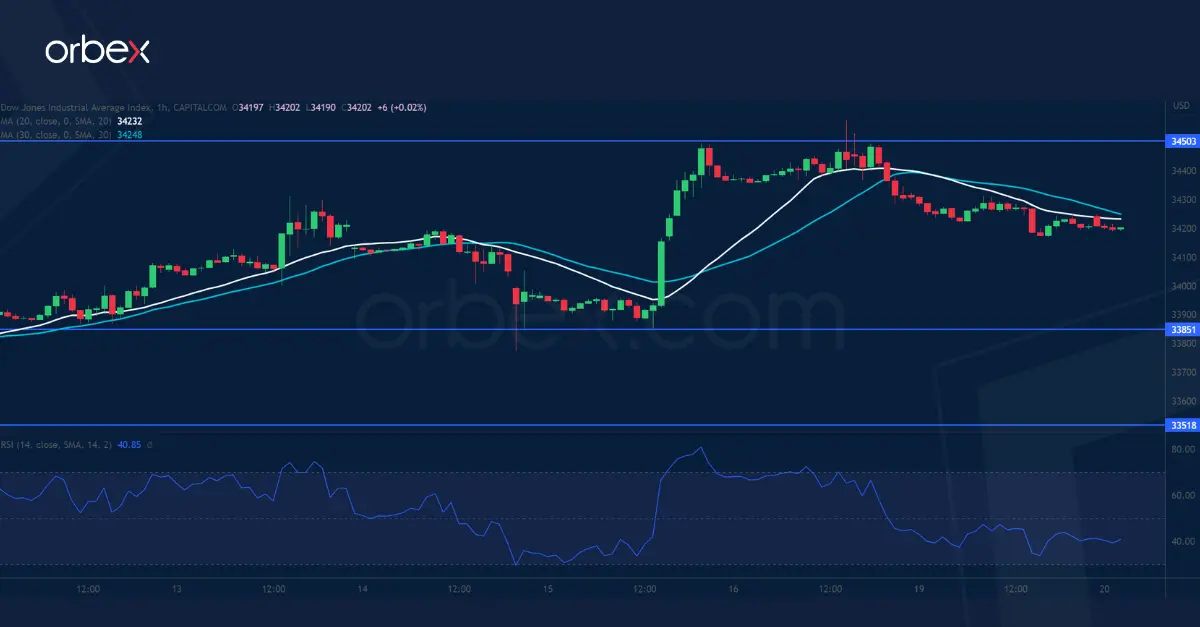
The Dow Jones 30 steadies as the market remains hopeful of a Fed pivot. A close above the daily resistance of 34300 after a botched attempt has helped the bulls regain control of the direction, with a bullish MA cross on the daily chart supporting the recovery in market sentiment. A close above 34500 would bring the index to the new supply area between last December’s spike at 34900 and the psychological level of 35000. The recent dip at 33850 is the first support and 33500 on the 20-day SMA the bulls’ second layer of defence.
EUR/USD Daily Outlook
Daily Pivots: (S1) 1.0903; (P) 1.0925; (R1) 1.0942; More...
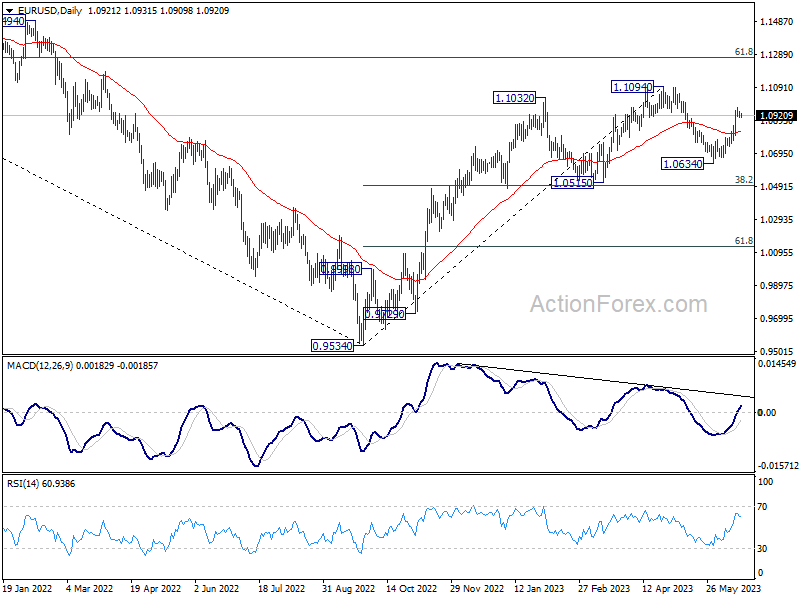
Intraday bias in EUR/USD remains neutral for consolidation below 1.0969 temporary top. Further rally is expected as long as 1.0803 support holds. On the upside, above 1.0969 will resume the rise from 1.0634 to retest 1.1094 high. Decisive break there will confirm resumption of whole up trend from 0.9534. However, firm break of 1.0803 will extend the corrective pattern from 1.1094 with another falling leg, targeting 1.0634 and below.
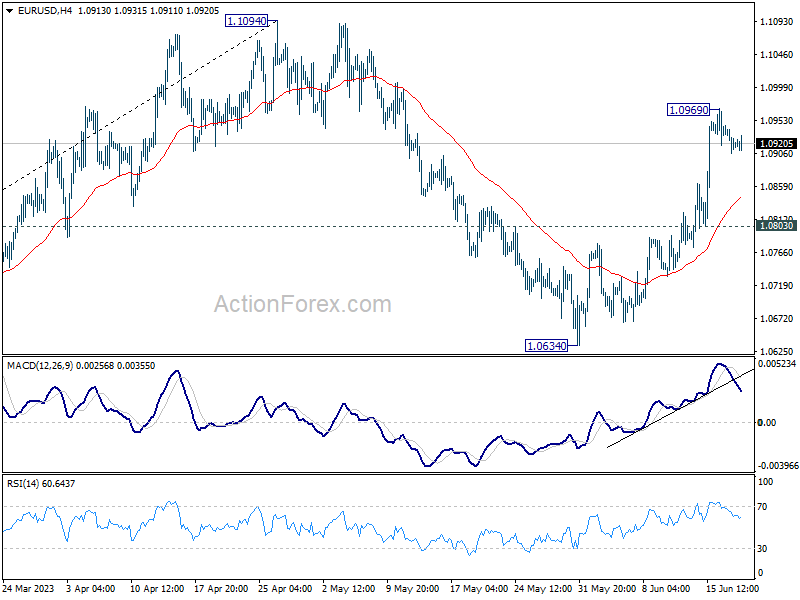
In the bigger picture, as long as 1.0515 support holds, rise from 0.9534 (2022 low) would still extend higher. Sustained break of 61.8% retracement of 1.2348 (2021 high) to 0.9534 at 1.1273 will solidify the case of bullish trend reversal and target 1.2348 resistance next (2021 high).
GBP/USD Daily Outlook
Daily Pivots: (S1) 1.2764; (P) 1.2801; (R1) 1.2830; More...
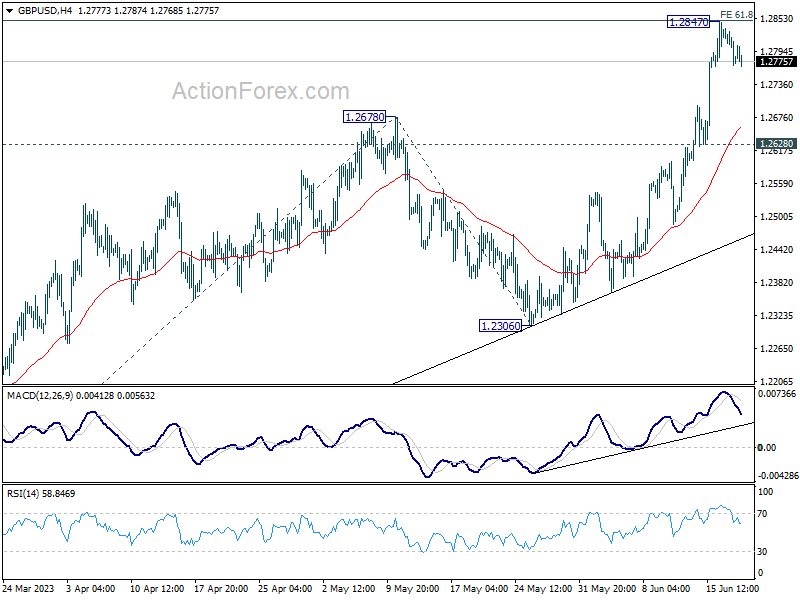
Intraday bias in GBP/USD stays neutral for consolidation below 1.2847 temporary top. Downside should be contained above 1.2628 support to bring rise resumption. On the upside, firm break of 1.2847 will resume larger up trend and target 100% projection of 1.1801 to 1.2678 from 1.2306 at 1.3183 next.
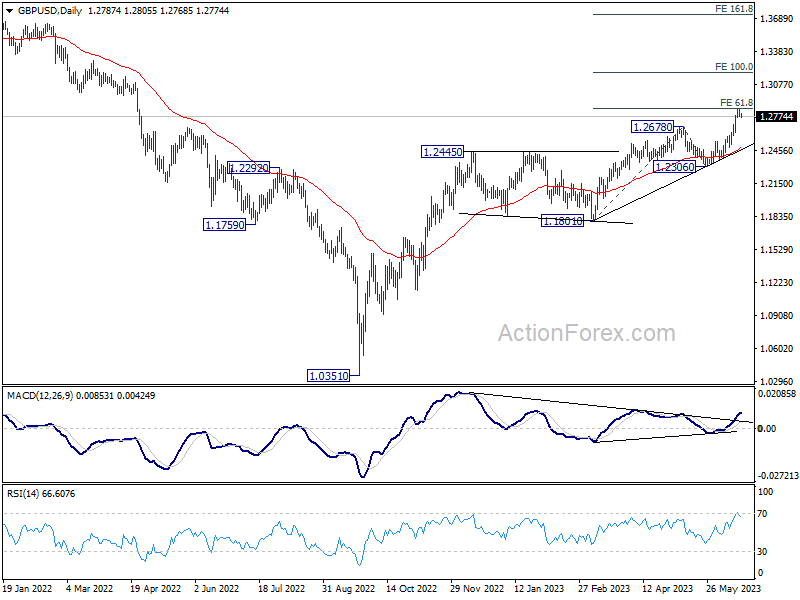
In the bigger picture, the strong support from 55 W EMA (now at 1.2345) is a medium term bullish sign. Outlook will stay bullish as long as 1.2306 support holds. Rise from 1.0351 medium term bottom (2022 low) is expected to extend further to retest 1.4248 key resistance (2021 high).
USD/CHF Daily Outlook
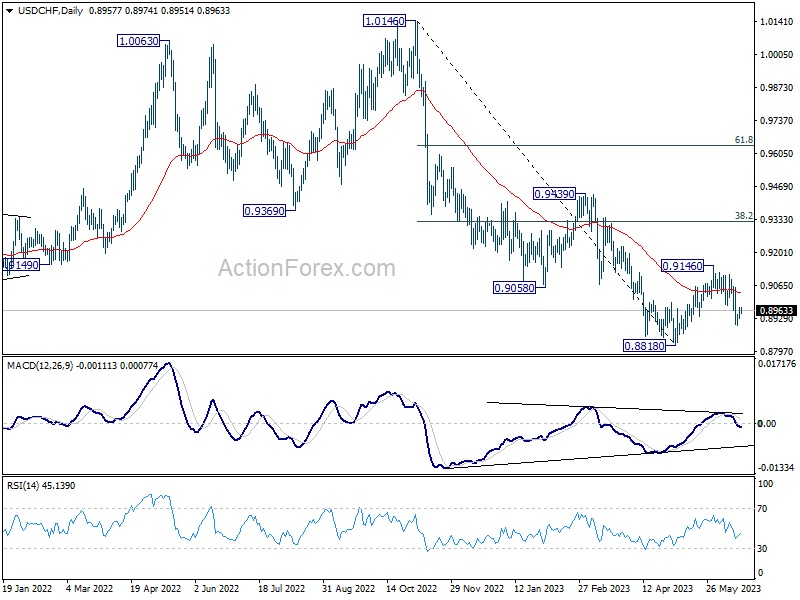
Daily Pivots: (S1) 0.8934; (P) 0.8954; (R1) 0.8978; More...
Intraday bias in USD/CHF remains neutral for consolidation above 0.8900 temporary low. Risk will stay on the downside as long as 0.9146 resistance holds. Below 0.8900 will target 0.8818 and possibly below. But strong support is still expected from 0.8756 to bring reversal.
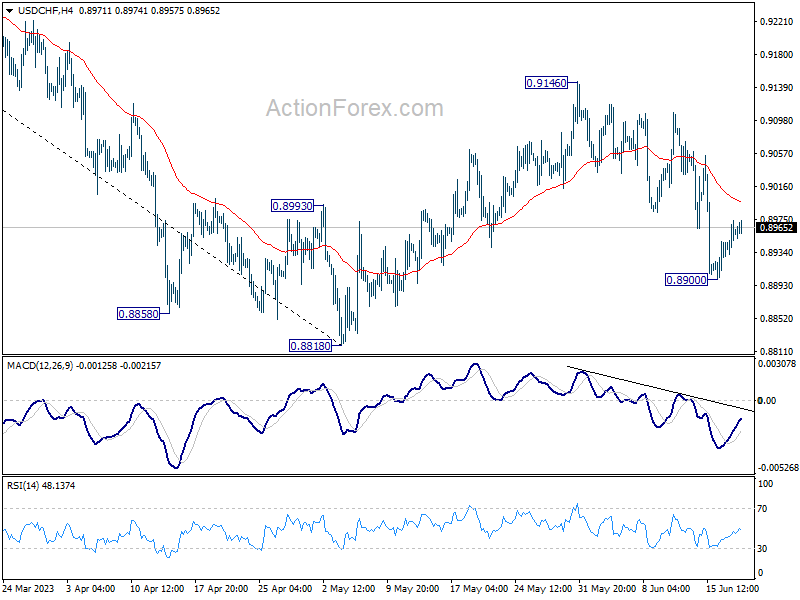
In the bigger picture, fall from 1.1046 (2022 high) is seen as a leg in the long term range pattern from 1.0342 (2016 high), which might have completed at 0.8818 already, just ahead of 0.8756 long term support. Sustained trading above 0.9058 support turned resistance should confirm medium term bottoming.
USD/JPY Daily Outlook
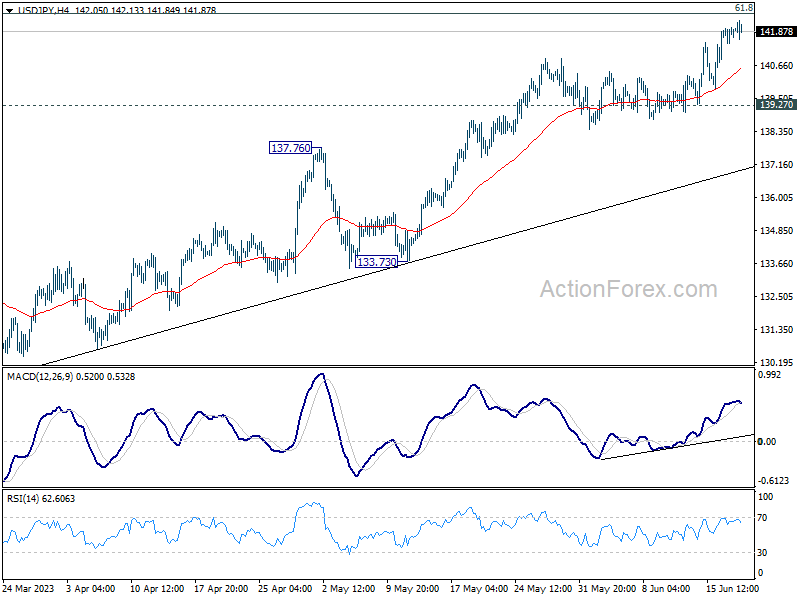
Daily Pivots: (S1) 141.61; (P) 141.83; (R1) 142.23; More...
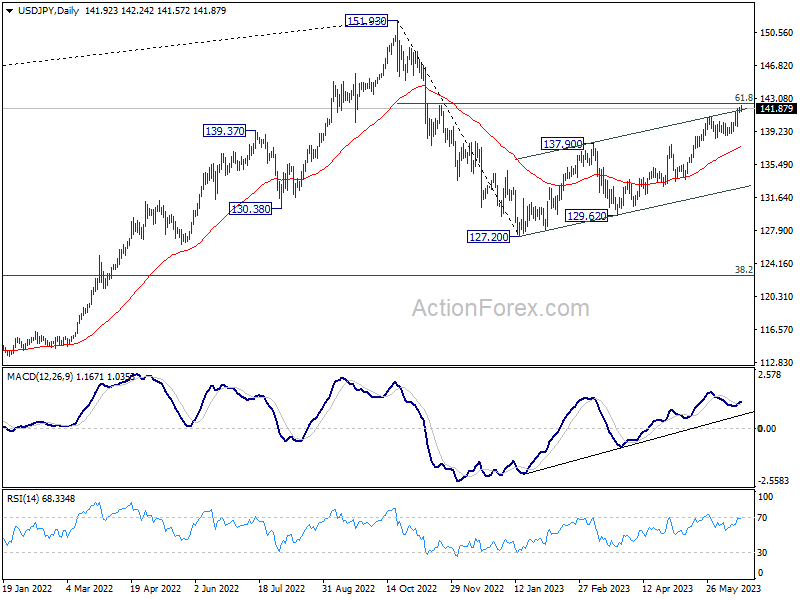
Intraday bias in USD/JPY stays on the upside for 61.8% retracement of 151.93 to 127.20 at 142.48 next. Sustained break there will pave the way back to retest 151.93 high. However, rejection by 142.48, followed by break of 139.27 will indicate short term topping and turn bias back to the downside.
In the bigger picture, rise from 151.93 are seen as a corrective pattern to up trend from 102.58. The first leg has completed at 127.20. Rebound from there is seen as the second leg, and should be limited below 151.93. Sustained trading below 55 D EMA (now at 137.47) will argue that the third leg has started back to 127.20 and possibly below.
USD/CAD Daily Outlook
Daily Pivots: (S1) 1.3183; (P) 1.3206; (R1) 1.3233; More....
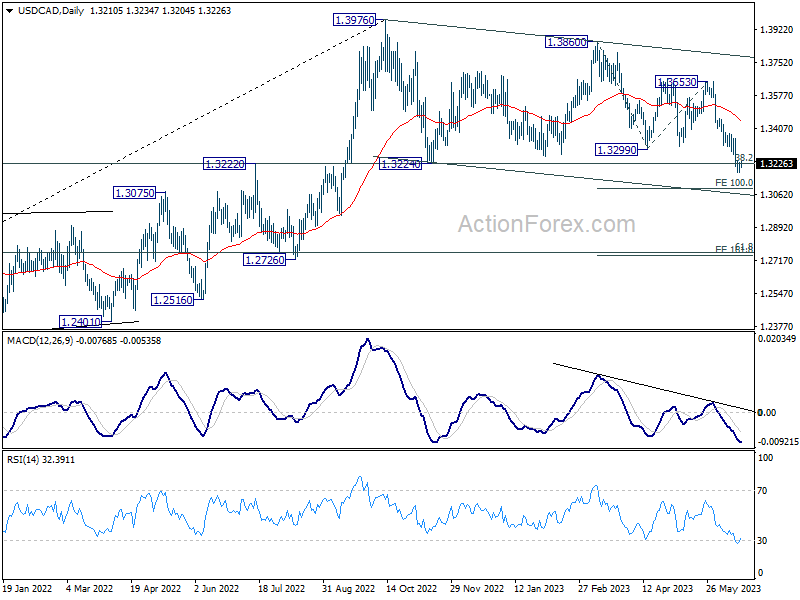
A temporary low is in place at 1.3176 in USD/CAD with current recovery. Some consolidations would be seen but further decline is expected as long as 1.3353 resistance holds. Below 1.3176 will resume the whole decline from 1.3976 to 100% projection of 1.3860 to 1.3299 from 1.3653 at 1.3092 next.
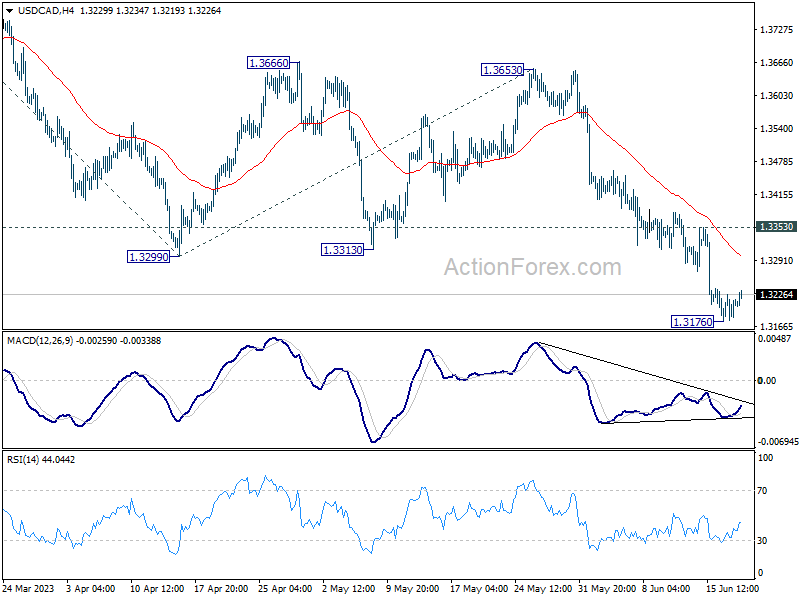
In the bigger picture, price actions from 1.3976 are still viewed as a correction to up trend from 1.2005 (2021 low), but chance of trend reversal is increasing with current decline. But in either case, sustained trading below 38.2% retracement of 1.2005 to 1.3976 at 1.3233 will pave the way to 61.8% retracement at 1.2758. Risk will stay on the downside as long as 1.3653 resistance holds, even in case of strong rebound.
RBA Minutes Less Hawkish Than Expected, For Now
The Board sees increased inflation risks while recognising prospect of weakening economy. And rising unemployment rate.
The Minutes from the Reserve Bank Board’s meeting in June provide a more balanced approach to the outlook for rates than we saw in the Governor’s statement following the decision to raise the cash rate by 25 basis points.
Of some significance is the absence of the sentence, “Some further tightening of monetary policy may be required to ensure that inflation returns to target in a reasonable time frame.”
That sentence was used in both his Statement and in his speech the following day to a bankers’ forum. It seems somewhat strange that the Governor would repeat the sentence on two occasions but the Board chose to exclude it from the Minutes.
The Minutes did conclude that the Governor’s speech the following day “would provide an opportunity to explain the decision in more detail.” So we should reasonably conclude that the “some further tightening” is still on the Board’s radar.
Less surprising is the description of the tightening decision as “finely balanced”. This is a fairly common description of decisions when we are nearing the end of the tightening cycle.
The Board considered two options – raise the cash rate by 25 basis points or hold rates steady.
The key theme from the Governor’s statement that the balance of risks on inflation had shifted to the upside (compared with a month earlier) was confirmed in the Minutes.
These direct risks are set out as: the monthly indicator of headline inflation had shifted to the upside in April; the decline in goods prices inflation had been less than observed in other countries; and services price inflation had not yet shown signs of moderating.
But concerns around wages growth seemed more acute: “the possibility of implicit indexation …to become widespread… [while] some members observed that some firms were indexing their prices.”
In addition the Annual Wage Review decision of the Fair Work Commission was higher than expected … and a range of public sector enterprise agreements were being negotiated and were likely to contain wage rises in excess of 4% for the first year. Concerns were also raised that “a broad range of jobs were to become implicitly indexed to high inflation.”
There is also specific concern around the housing market with the unexpected resumption of growth in house prices implying less of a drag on spending. Further, the stabilisation of housing loan approvals suggested that financial conditions “may not have been as tight as previously judged”.
Despite the rate increase in June the Westpac Melbourne Institute Index of House Price Expectations stabilised in June at a very high level, while auction clearance rates have remained high despite a marked lift in turnover. When the Board meets again on July 4 it is likely to be discussing another month of housing buoyancy.
There is ample recognition of the impact on households of rising rates, highlighting the risk that the economy slows and unemployment rises by more than expected. But the key remains that tight labour markets are inconsistent with the higher unemployment rate required to be consistent with the inflation target.
Conclusion
Westpac expects a follow up rate increase in July. This will be based around the key theme from the Minutes that the risks to achieving the inflation target have increased. It seems unlikely that concerns around indexation; sticky services inflation; and rising house prices will dissipate in one month.
Nevertheless it is curious that the Minutes did not repeat “some further tightening of monetary policy…” while there is clearly concern around household spending.
Since the Board meeting Compensation of Employees was reported to have lifted by a hefty 2.4% in the March quarter; while GDP lifted by a tepid 0.2% - around expectations.
The May Employment Report with an increase of 76,000 jobs will continue to see concerns at the RBA around a tight labour market raising those issues with respect to higher than acceptable wages growth, especially concerns around indexation. This concern around tight labour markets was emphasised by Deputy Governor Bullock today when she referred to employment being above what is consistent with the inflation target – more evidence that upside risks to inflation are sustained.
We still have to see the May Inflation Report – it is a little surprising that the Board gave reasonable emphasis to the April report given it excludes so many components of inflation. We will be watching that report but it seems unlikely to be a “game changer” given the Board’s clear recognition that inflation risks have increased.
Westpac confirms its expectation that the Board will raise the cash rate in both July and August.
USD/JPY Technical: 142.25 Resistance Met with Bullish Exhaustion
- The rally of USD/JPY has reached 142.25/142.50 key medium-term resistance ex-post BoJ monetary policy decision last Friday.
- Latest Commitments of Traders report on JPY futures on net large speculators’ open bearish positioning has reached close to a 3-year extreme.
- The next key related event will be the release of Japan’s nationwide inflation data for May on this Friday, 23 June.
This is a follow-up analysis from our earlier publication dated 15 June 2023, “USD/JPY Technical: Bullish breakout from 4-week range ahead of BOJ”.
The USD/JPY has shaped the expected positive follow-through in price actions reinforced by the latest Bank of Japan (BoJ)’s dovish jawboning last Friday, 16 June to maintain its ultra-dovish monetary policy due to an expectation that inflation in Japan faces a risk of a slowdown in the second half of the current fiscal year.
The last 3 days of up move in the USD/JPY has led it to hit a 142.25/50 key resistance with bullish exhaustion elements at this juncture ahead of the next key related economic data release, the Japan nationwide inflation for May out on this Friday, 23 June.
Fig 1: USD/JPY medium-term trend as of 20 Jun 2023 (Source: TradingView, click to enlarge chart)
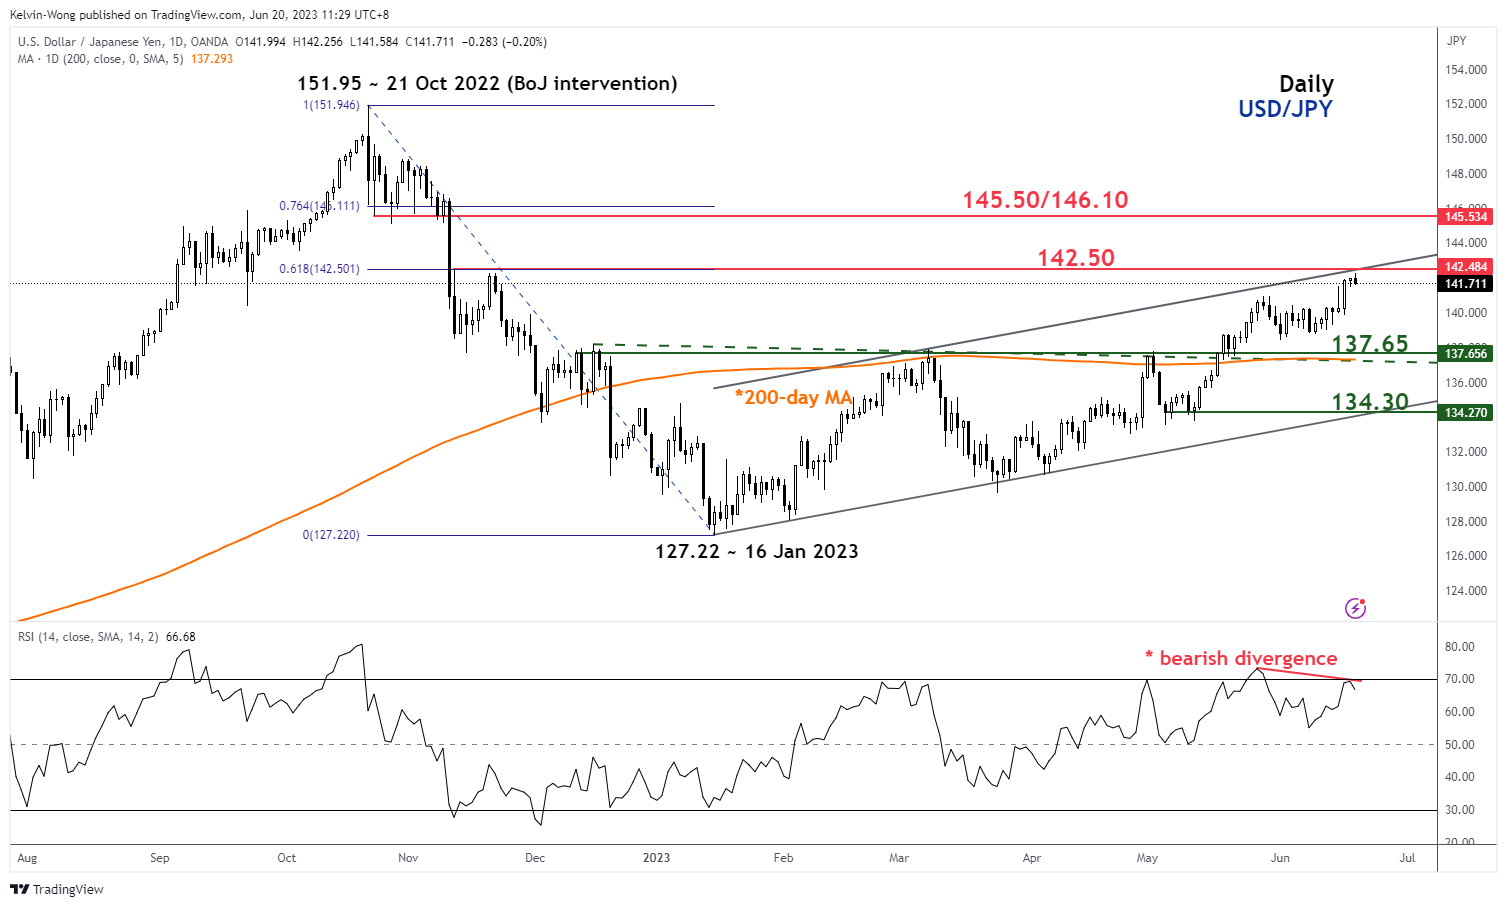
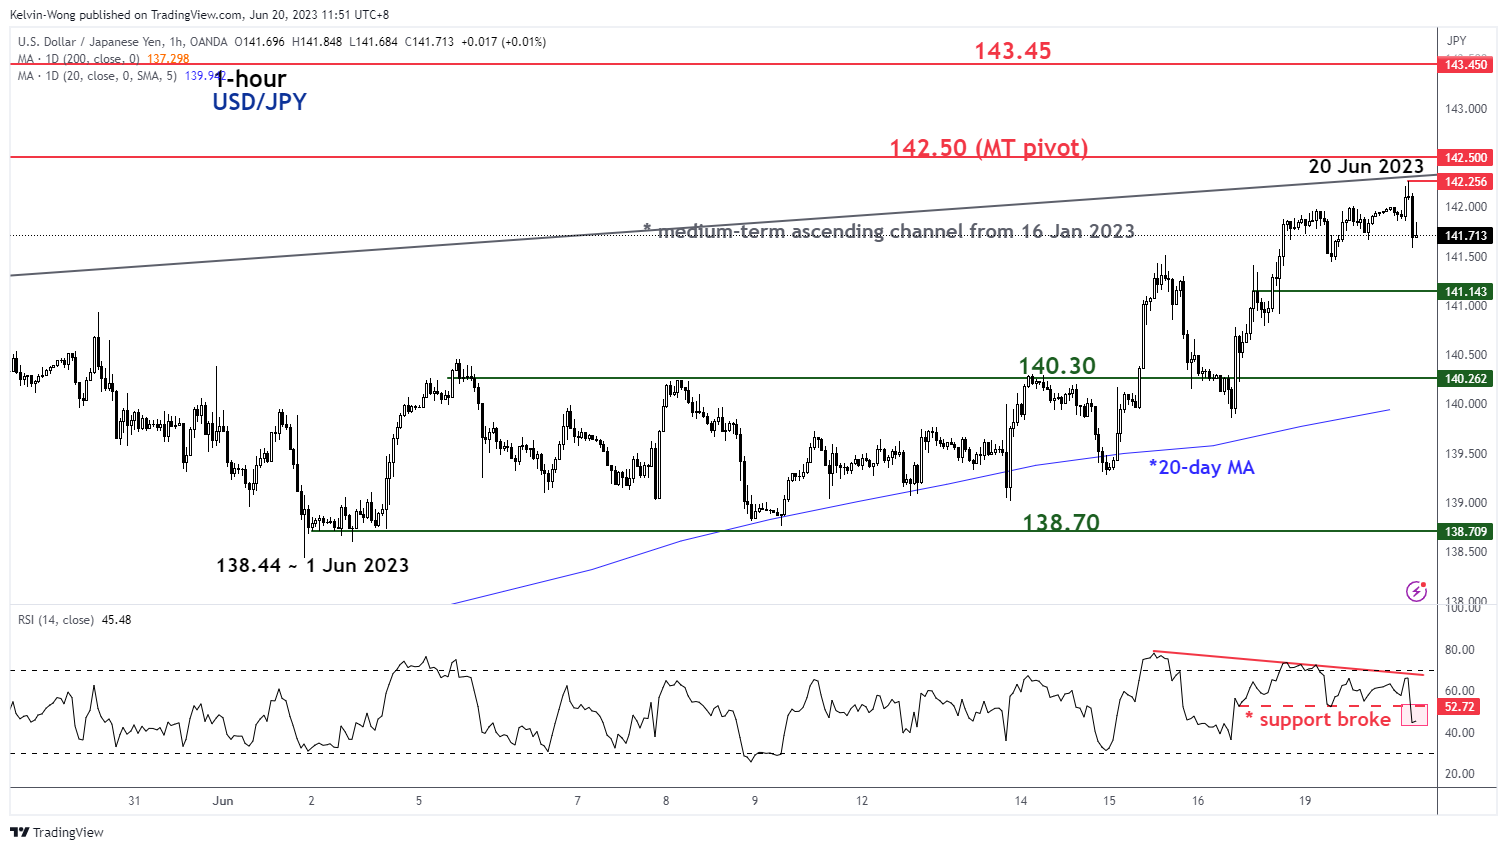
Fig 2: USD/JPY short-term minor trend as of 20 Jun 2023 (Source: TradingView, click to enlarge chart)
JPY futures’ bearish net open positioning of large speculators has reached close to a 3-year extreme
Fig 3: JPY futures net open positioning trend of large speculators as of 12 Jun 2023 (Source: MacroMicro, click to enlarge chart)
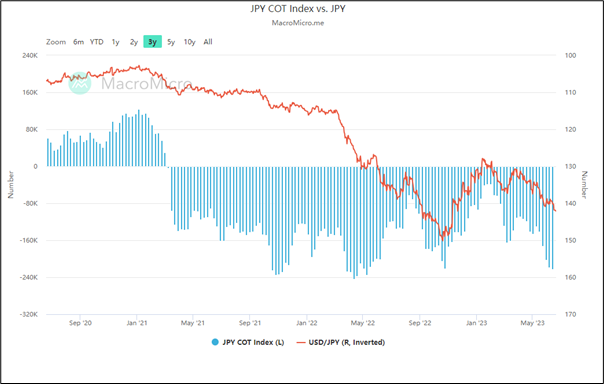
Traders’ sentiment from the Commitments of Traders report can be measured by the difference between the net open positions of large non-commercials (speculators) and the large commercials (hedgers/dealers) in the futures market. A positive number represents net long positions on JPY and a negative number represents net short on JPY.
Based on the latest weekly Commitments of Traders report as of 12 June 2023 compiled by the Commodity Futures Trading Commission (CFTC) on US exchange-listed FX futures market on the JPY futures contract (take note that JPY is quoted as the base currency & USD as the variable currency, i.e. JPY/USD), it has indeed shown that traders’ sentiment is skewed towards a more significant increase bearish positioning on JPY versus three months ago.
The latest weekly reported net open positions on the JPY futures market have indicated a jump of net shorts positions on JPY to -222,157 contracts which is close to a 3-year extreme with -243,729 contracts reported on 11 April 2022.
Interestingly, the current reported -222, 157 contracts on net short JPY futures open positions have surpassed the -220,700 contracts reported on 24 October 2022 and thereafter saw the JPY strengthen by +15% against the USD in the following three months.
That’s a form of contrarian opinion analysis where positioning has reached a relatively extreme level and the risk of a reversal in price actions is likely to be easily triggered if related news or events fail to meet the expectations of an “overconfident and exuberance” mindset of participants due to the overcrowding effect.
142.25/142.50 key medium-term resistance of USD/JPY is defined by a confluence of elements
There are three different elements that allow 142.25/142.50 on the USD/JPY to be classified as potential key resistance (see daily chart). Firstly, it is the prior swing highs area of 11 and 22 November 2022 that led to a significant decline in price actions thereafter.
Secondly, it is the upper boundary of a medium-term ascending channel that price actions have oscillated within it since the 16 January 2023 low of 127.72.
Thirdly, it’s the 61.8% Fibonacci retracement of the prior medium-term decline from the 21 October 2022 high to the 16 January 2023 low. Thus, such confluence of elements on the 142.25/142.50 resistance level may suggest that the USD/JPY medium-term uptrend from 16 January 2023 is at risk of hitting a terminal juncture where a potential corrective decline may occur next.
Upside momentum has started to wane
The daily RSI oscillator has flashed a bearish divergence signal at its overbought region and the shorter-term 1-hour RSI has broken below a corresponding support at the 52% level.
Below the 141.15 minor support exposes the next intermediate support at 140.30 (also the 20-day moving average) in the first step.
However, a clearance above 142.50 key medium-term pivotal resistance invalidates the bearish tone for the next resistance to come in at 143.45.
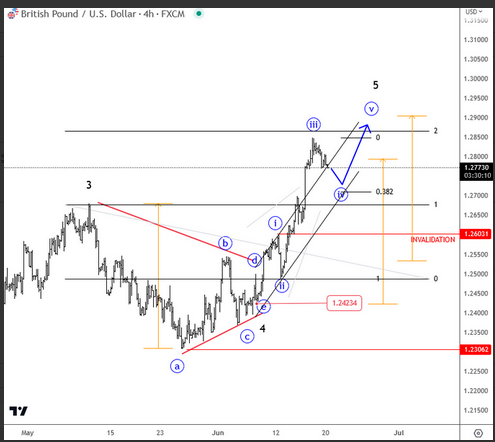
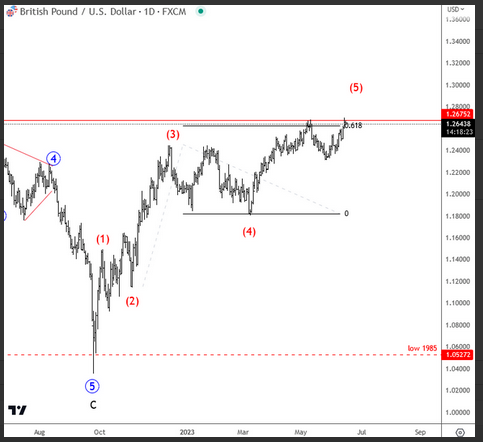
Cable Can be Targeting 1.29 Area With a Fifth Wave
So far this year, pound has made significant progress to the upside and it's still underway. However, there's now a chance that pair is trading in a final wave (5) of a five-wave bullish cycle on a daily chart, which can face a new, higher-degree correction later this year. Looking at the 4-hour chart we see it price breaking higher, out of the bullish fourth wave triangle pattern, so it appears there is a new impulse in play, possibly towards 1.29 area this week, after minor wave four finds support near 1.27-1.2750. A drop below 1.26 will mark end of a bullish run.